Earnings Reports
Philip Morris International Inc. FQ3 2026 Earnings Report
Philip Morris International Inc. (PM) FQ3 2026 earnings: International Earnings Fund the ZYN Reset; Its Return Is the Open Question. Full earnings analysis, key read-throughs, and the one-page exhibit from Atlas Peak Research.
Philip Morris International Inc. (PM)
Sector: Consumer Staples · FQ3 2026 · Period end September 30, 2026 · Reported October 21, 2026
Philip Morris International’s Q3 2026 results support a hold stance, with incremental purchases dependent on valuation rather than the headline earnings beat. The quarter demonstrated the resilience of the international earnings engine, particularly combustible pricing and geographically diversified IQOS demand.
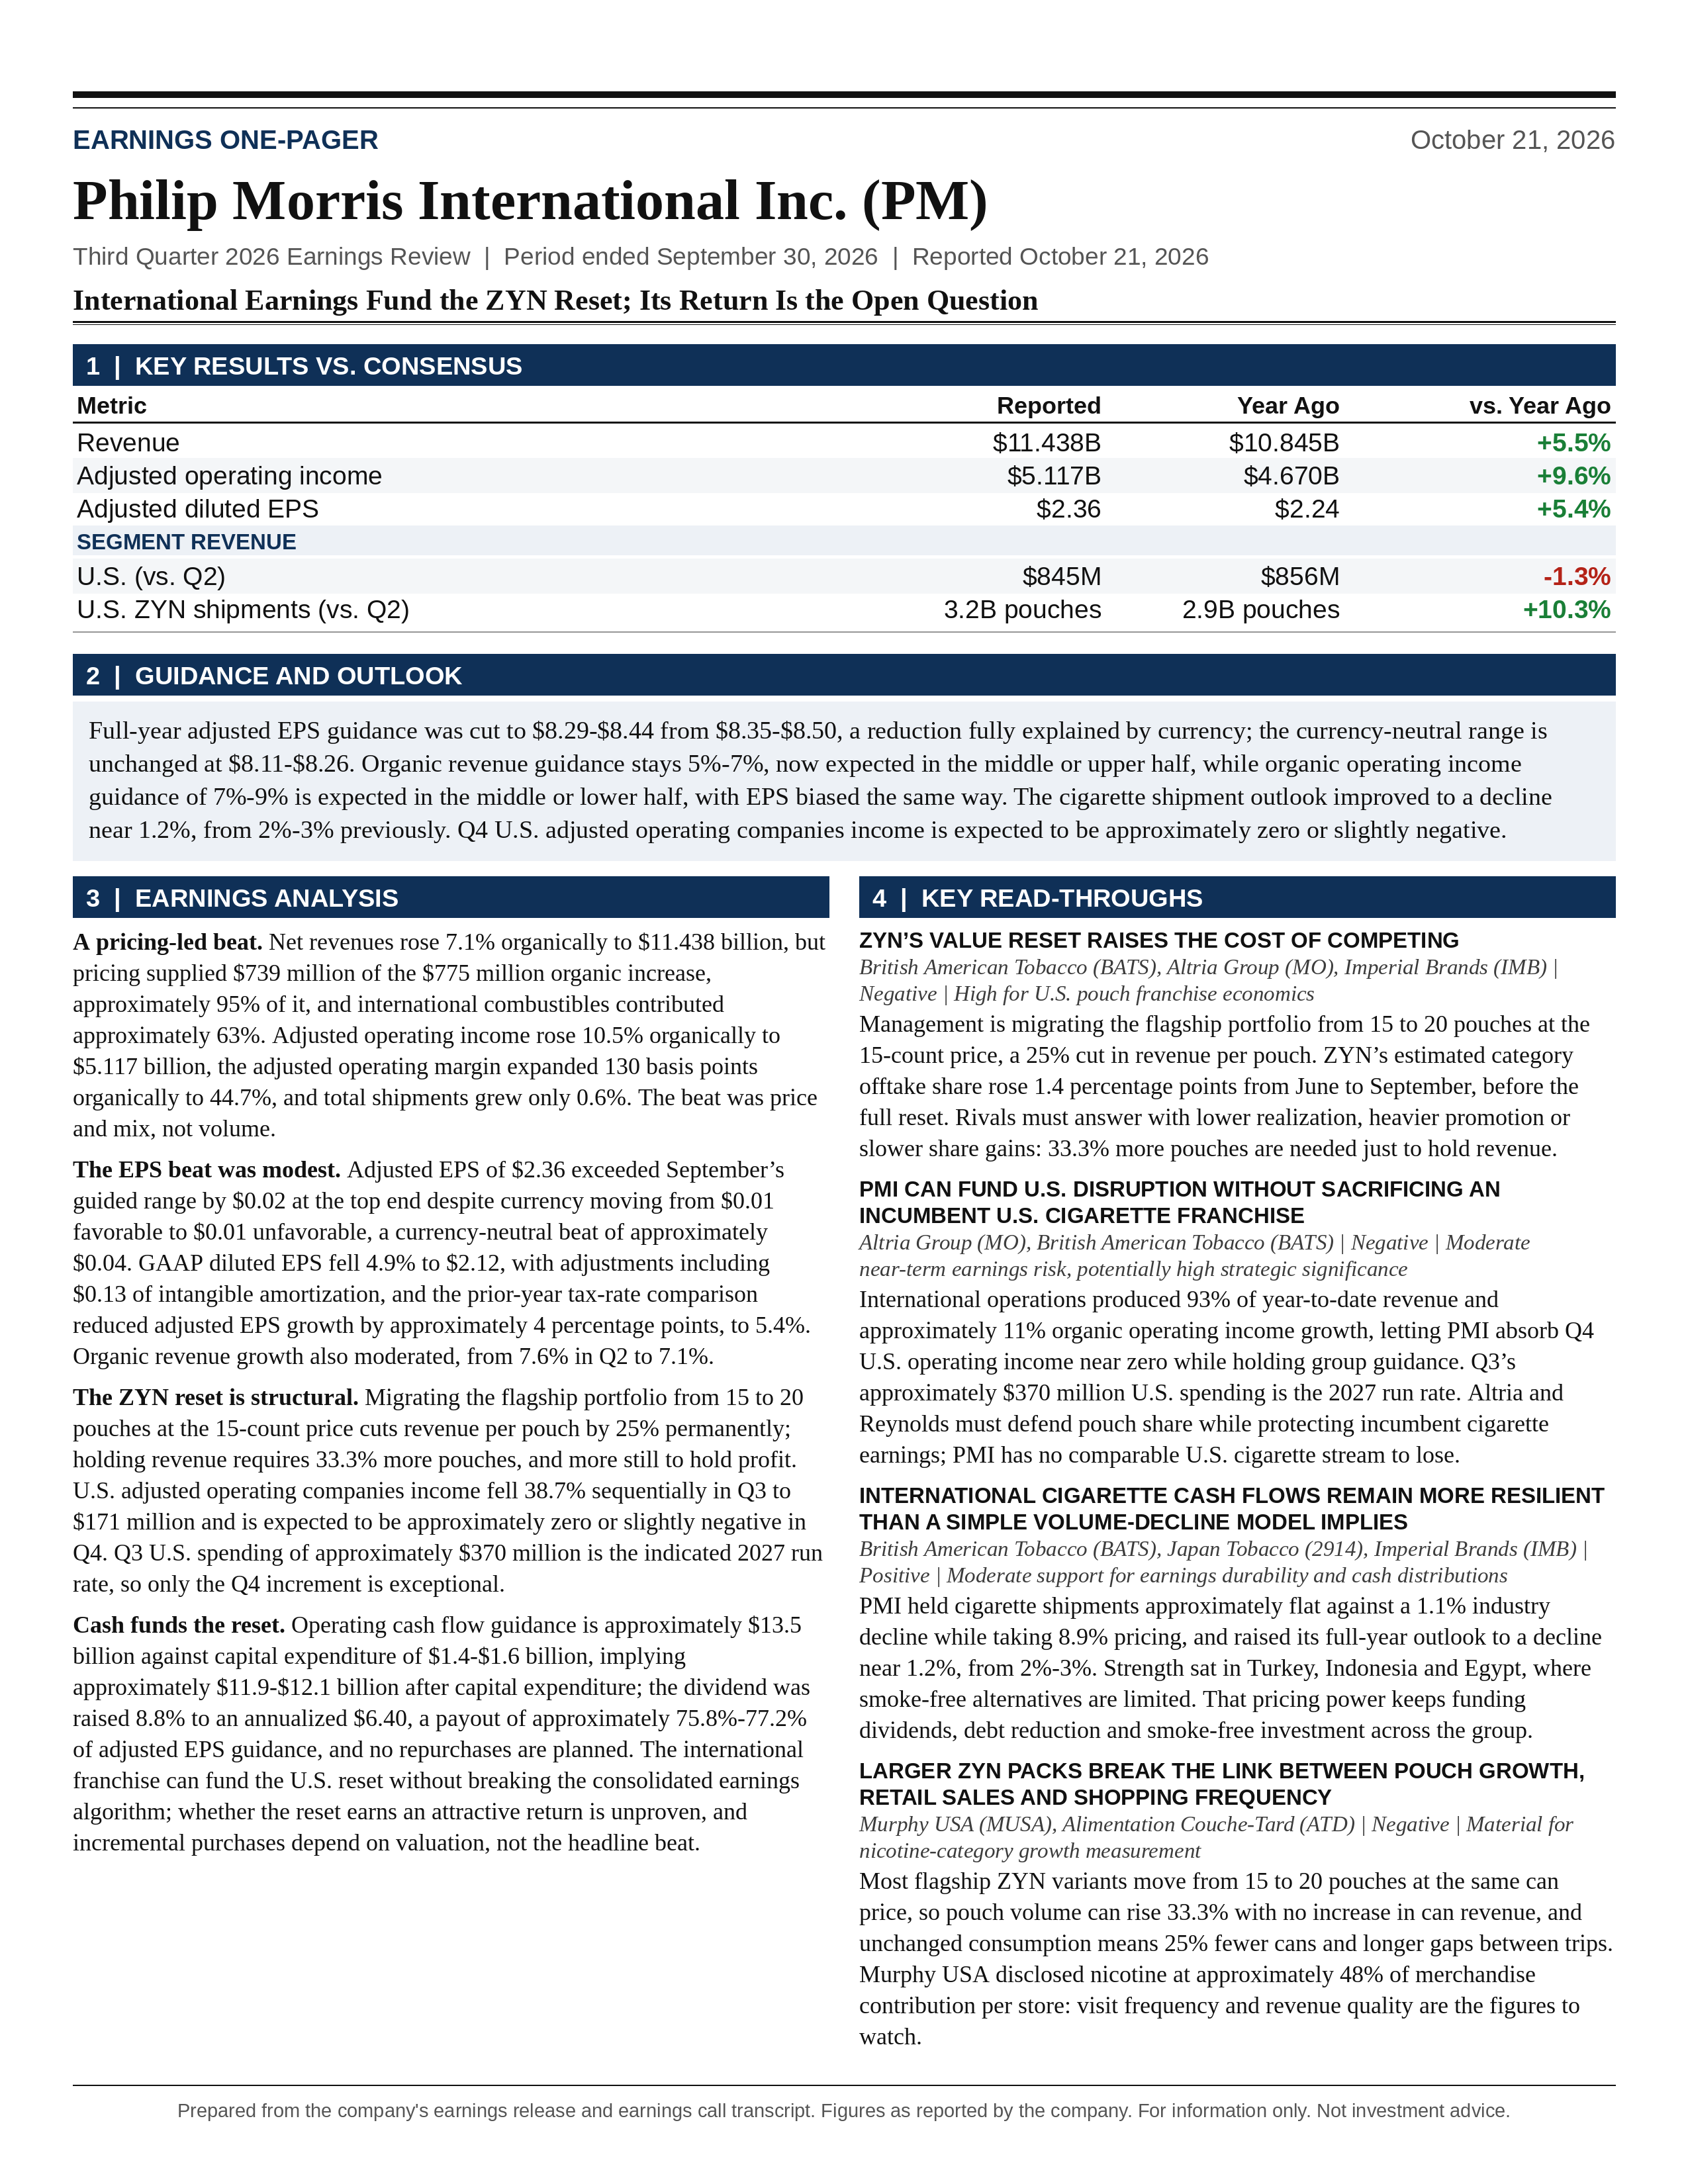
One-Page Exhibit
Earnings Analysis
EXECUTIVE CALL SUMMARY: Philip Morris International (10/21/26)
Philip Morris International’s Q3 2026 results support a hold stance, with incremental purchases dependent on valuation rather than the headline earnings beat. The quarter demonstrated the resilience of the international earnings engine, particularly combustible pricing and geographically diversified IQOS demand. It also established that restoring ZYN’s U.S. competitiveness requires a more substantial and persistent reset of unit economics than a temporary increase in promotional spending. The central investment issue is whether stronger pouch consumption, market share recovery and manufacturing utilization can offset a 25% reduction in revenue per pouch across most of the flagship ZYN portfolio.
The reported operating performance was strong. Net revenues increased 7.1% organically to $11.438 billion, adjusted operating income increased 10.5% organically to $5.117 billion, and adjusted operating margin reached 44.7%. Adjusted diluted EPS of $2.36 exceeded the upper end of September’s $2.29-$2.34 guidance despite currency being less favorable than anticipated. IQOS adjusted in-market sales growth accelerated to 7.1% from 5.1% in Q2, while cigarette shipments were approximately flat despite 8.9% pricing. These results confirm that PMI can sustain attractive consolidated growth even when a strategically important business is absorbing substantial investment.
The outlook was less constructive than the quarterly results. Full-year organic revenue guidance remains 5%-7%, with management now favoring the middle or upper half. Organic operating income guidance remains 7%-9%, but delivery is expected in the middle or lower half, with a corresponding bias in adjusted EPS. The divergence between stronger revenue positioning and weaker profit positioning is the most important consolidated signal from the call. PMI is preserving its growth algorithm, but a larger proportion of incremental revenue is being consumed by competitive investment, manufacturing costs and geopolitical disruption.
The most consequential disclosure was the expectation that Q4 U.S. adjusted operating companies income will be approximately zero or slightly negative, compared with $171 million in Q3. Management stated, “Q4 will be a unique quarter of investment.” However, not all of the associated pressure is temporary. The transition from 15-pouch to 20-pouch cans at the same price permanently lowers revenue per pouch unless subsequently offset by pricing or mix. Management also established Q3’s approximately $370 million quarterly U.S. spending level as a reasonable proxy for 2027. Only the additional Q4 spending increment and certain transition costs were identified as exceptional.
The investment conclusion is therefore differentiated. The quarter strengthens confidence in the durability of international cash generation and the underlying IQOS franchise. It weakens the case for treating U.S. nicotine pouch growth as an uncomplicated source of high-margin earnings acceleration. A premium valuation remains supportable for a diversified smoke-free growth platform, but a further premium based on an imminent restoration of historical ZYN economics requires evidence that was not provided on this call.
QUARTERLY PERFORMANCE AND THE QUALITY OF THE BEAT
Q3 net revenues of $11.438 billion compared with $10.845 billion in Q3 2025, representing 5.5% reported growth and 7.1% organic growth. Adjusted operating income increased from $4.670 billion to $5.117 billion, or 9.6% in dollar terms and 10.5% organically. Adjusted operating margin expanded to 44.7%, compared with 43.1% in Q3 2025 and 42.6% in Q2 2026. Management reported 130 basis points of organic operating margin expansion, separating the underlying improvement from currency and other presentation effects.
The composition of revenue growth matters more than the headline rate. PMI’s earnings release identifies $739 million of favorable pricing and $36 million of favorable volume, mix and other effects. Pricing therefore represented approximately 95% of the $775 million organic revenue increase. This does not diminish the value of PMI’s pricing power, but it distinguishes the quarter from a broadly volume-led acceleration. Total shipment growth was only 0.6%, and substantial differences in profitability across countries and product categories prevent that aggregate volume measure from serving as a reliable proxy for economic growth.
International combustibles generated approximately $490 million of organic revenue improvement, compared with approximately $129 million from international smoke-free products and $157 million from the U.S., subject to rounding. International combustibles therefore contributed approximately 63% of the consolidated organic revenue increase. The smoke-free transition remains the long-term strategic driver, but the immediate quarterly financial outperformance depended heavily on the legacy business.
The latest company guidance is the appropriate benchmark for evaluating the EPS beat. PMI’s September 8 update projected Q3 adjusted EPS of $2.29-$2.34, including a $0.01 favorable currency impact. Actual EPS was $2.36 despite a $0.01 unfavorable currency impact. The reported beat was therefore $0.02 above the upper end, while the currency-neutral result of $2.37 exceeded the implied currency-neutral upper end of $2.33 by approximately $0.04. This was a genuine operating beat, although its magnitude was more modest than a comparison against the superseded July guidance would imply.
Adjusted EPS increased 5.4% from $2.24 in Q3 2025, or 5.8% excluding currency. Management indicated that the comparison with the prior-year tax rate reduced growth by approximately 4 percentage points. This explains much of the gap between 10.5% organic operating income growth and 5.8% currency-neutral EPS growth. The slower EPS rate should not be interpreted as equivalent deterioration in underlying operating performance.
Nevertheless, Q3 did not represent an acceleration across every financial measure. Organic revenue growth moderated from 7.6% in Q2 to 7.1%, while organic operating income growth moderated from 10.7% to 10.5%. Total smoke-free shipment growth slowed from 7.5% to 2.7%, largely reflecting heated tobacco shipment comparisons. The stronger IQOS demand indicator and weaker shipment indicator moved in opposite directions, reinforcing the need to distinguish consumer demand from manufacturer shipment timing.
For the first 9 months, revenue reached $32.776 billion, increasing 5.9% organically and 8.2% in dollar terms. Adjusted operating income reached $14.058 billion, increasing 7.7% organically and 10.6% in dollar terms. Adjusted EPS of $6.52 increased 8.4% excluding currency and 11.8% in dollar terms. These figures demonstrate that PMI’s full-year outlook is supported by substantial realized earnings rather than an unusually demanding year-end recovery assumption.
GUIDANCE CHANGES AND THE IMPLIED Q4 EARNINGS PROFILE
The progression of guidance requires separating currency changes from operating changes. On July 22, PMI projected full-year adjusted EPS of $8.26-$8.41, including a $0.15 currency benefit. On September 8, the range increased to $8.35-$8.50 solely because the expected currency benefit increased to $0.24. The Q3 update reduced the range to $8.29-$8.44 as the currency benefit fell to $0.18. The $0.06 reduction relative to September is therefore fully explained by currency at the formal range level.
Currency-neutral adjusted EPS remains $8.11-$8.26, representing 7.5%-9.5% growth from the 2025 adjusted EPS base of $7.54. It would be inaccurate to describe the latest dollar guidance as an operational range cut. It would also be incomplete to describe the outlook as economically unchanged. Management’s preference for the midpoint or lower half reduces the expected outcome within the retained range.
The distinction was explicit in the discussion with Goldman Sachs. Andolina stated, “Our guidance points for the OI and for the EPS for the full year towards the mid or lower half of the range.” Management attributed the shift primarily to geopolitical costs, while emphasizing that international strength was absorbing much of the U.S. investment burden. That explanation is plausible, but the resulting earnings distribution is still less favorable than an interpretation centered on the full range’s upper end.
Revenue guidance has become more constructive. The formal 5%-7% organic range is unchanged, but management now expects delivery in the middle or upper half. Total shipment guidance has improved from broadly stable to slightly growing to growing. Cigarette shipments are now expected to decline at approximately the year-to-date rate of 1.2%, compared with the prior expectation of a 2%-3% decline. Full-year combustible pricing is expected to exceed 8%. These changes establish that weaker profit positioning is not being driven by a deterioration in the aggregate sales outlook.
Subtracting year-to-date adjusted EPS of $6.52 from the full-year range implies Q4 adjusted EPS of $1.77-$1.92. The midpoint-to-lower-half preference implies approximately $1.77-$1.845, although this is an arithmetic interpretation rather than a separately issued quarterly range. The comparable Q4 2025 adjusted EPS was $1.71, derived from full-year EPS of $7.54 less first-9-month EPS of $5.83. The preferred outcome therefore implies approximately 3.5%-7.9% reported Q4 EPS growth.
Currency is also less supportive at year-end than the full-year headline suggests. PMI has already recorded $0.20 of favorable currency impact in first-9-month adjusted EPS, compared with a full-year assumption of $0.18. This implies approximately $0.02 of unfavorable Q4 currency impact. Full-year dollar EPS growth of approximately 10%-12% should not be extrapolated mechanically into the final quarter.
The guidance has several other important continuities. Operating cash flow remains approximately $13.5 billion, capital expenditure remains $1.4-$1.6 billion, the effective tax rate excluding discrete items remains approximately 21.5%, and net financing costs are expected to be broadly stable. PMI continues to target net debt to adjusted EBITDA close to 2.0x at year-end and does not plan share repurchases. The operating reset is therefore concentrated in business mix, competitive investment and costs, rather than a broad revision to the financial framework.
U.S. ZYN: IMPROVING COMPETITIVENESS, INCOMPLETE DEMAND VERIFICATION
U.S. ZYN shipments increased 4.2% to 3.2 billion pouches, compared with 1.8% growth to 2.9 billion pouches in Q2. Sequential shipment growth of approximately 10% is encouraging and consistent with category expansion and broader product availability. Management also reported approximately 13% Q3 shipment growth after excluding the effect of special promotional activity in September 2025.
The normalized 13% figure should not replace the reported 4.2% result. It isolates a specific comparison effect, but it is not a direct measurement of consumer consumption growth. The prior promotion changed the shipment base, while current-quarter launches created distribution and pipeline demand. Both periods contain commercial activity that complicates the relationship between shipments and underlying consumption.
The call did not fully reconcile shipment growth with retail measurement. Jefferies cited scanner data suggesting a mid-single-digit decline in Q3 volumes, compared with PMI’s positive shipment growth. Management pointed to the prior-year promotion and acknowledged current-quarter pipelining associated with new flavors, ZYN Ultra and distribution expansion. The response established that channel stocking contributed, but did not quantify that contribution or reconcile like-for-like retail and shipment measures.
Removing a prior-year shipment promotion does not, by itself, explain why current manufacturer shipments and current retail offtake differ. A complete reconciliation would require consistent measurement periods, channel coverage, pouch-versus-can definitions and distributor inventory changes. The shift in package size makes the unit definition particularly important. Shipment momentum is consequently a constructive signal, but not yet definitive evidence of an equivalent acceleration in end-user demand.
The more persuasive positive indicator was the estimated 1.4 percentage point improvement in category offtake share from June to September. Unlike shipment growth, retail share recovery is less directly affected by manufacturer pipeline loading. It indicates that the expanded portfolio is improving competitive relevance. However, the disclosure does not establish that ZYN has recovered its year-earlier share, that the gains are durable after promotional support, or that they have been achieved at attractive incremental profitability.
The product changes address identifiable gaps in the prior offering. ZYN Ultra adds a moist format at 9 mg and 11 mg strengths, while new dry flavors and 1.5 mg and 8 mg variants broaden the flagship range. Management described returning consumers who had previously moved to higher-strength competitor products, as well as interest from smokers entering the category. These observations support the strategic logic of the expansion, but no quantified cohort retention, repeat purchase, acquisition cost or cannibalization data were provided.
Regulatory progress improves the credibility of the expanded portfolio. The FDA’s August 21 announcement confirms marketing authorization for 11 ZYN Ultra products, comprising 10 variants at 9 mg and a Smooth variant at 11 mg. PMI’s earnings release states that ZYN now has 31 PMTA-authorized variants and that 20 flagship variants received modified-risk authorization on June 30. These authorizations support legal commercialization and specific permitted communications. They do not establish that every newly introduced variant is authorized, that the products are risk-free, or that regulatory authorization guarantees commercial returns.
The strategic interpretation is balanced. PMI is correcting product and value gaps that had contributed to below-category performance. Initial share recovery supports that response. The financial cost of the correction demonstrates that brand leadership alone was insufficient to preserve the previous economic model.
THE 20-POUCH TRANSITION AND THE RESET OF ZYN UNIT ECONOMICS
The transition to 20-pouch cans is the call’s most important structural disclosure. Management stated, “We are migrating our entire flagship portfolio from 15 to 20 count at the price of the 15 counts.” The prepared remarks specified that the 1.5 mg, 3 mg and 6 mg flagship variants, representing a large majority of volumes, are transitioning from October, with the change expected to be largely complete during Q4.
The economic arithmetic is straightforward. Increasing pouch count from 15 to 20 at the same can price increases the quantity provided by 33.3% and reduces revenue per pouch by 25%. To preserve revenue on a fully affected product at unchanged mix, pouch volume must increase by 33.3%. A 25% increase in pouch volume would still leave revenue 6.25% below the previous level because 1.25 multiplied by 0.75 equals 0.9375.
The profit hurdle is higher than the revenue hurdle when each additional pouch carries a positive marginal cost. As an illustrative sensitivity, if marginal manufacturing cost were 25% of the old net revenue per pouch, contribution per pouch would fall from 75% to 50% of that old revenue base following a 25% price reduction. Pouch volume would then need to increase 50% to preserve contribution dollars before incremental fixed-cost absorption or marketing spending. This is not an estimate of ZYN’s actual marginal cost, which was not disclosed. It demonstrates why revenue stabilization does not automatically imply profit stabilization.
The full U.S. segment will not experience an immediate uniform 25% revenue reduction. The change applies to most flagship ZYN volume rather than every U.S. product, implementation is phased, ZYN Ultra already uses a 20-pouch format, and the segment includes other businesses. Product mix, trade terms and promotional activity also affect realized revenue. Nevertheless, the scale of the affected flagship portfolio makes the dilution economically material.
Package size also changes the interpretation of volume growth. If consumers purchase the same number of cans after the transition, pouch shipments rise by 33.3% on affected products without any increase in revenue per can. Conversely, if daily consumption is unchanged, larger cans can reduce purchase frequency. Future pouch growth must therefore be evaluated alongside can-equivalent sales, consumer counts, daily consumption, retail revenue and net revenue per pouch.
Management suggested that larger packs and longer category tenure could increase consumption. Andolina described average daily consumption as lower in the U.S. than in more mature international markets. This provides a plausible source of category growth, but it remains a hypothesis rather than a demonstrated response to the new package size. Greater consumption intensity can also increase regulatory scrutiny and cannot be treated solely as an economic benefit.
The most important temporal clarification came in the Barclays exchange: “The 25% price optimization that we are making in Q4 will have a lagging effect for three quarters on the revenue level, but on a growing volume.” This means the revenue comparison remains affected through much of 2027. The Q4 packaging transition may be temporary operationally, but the lower unit revenue base persists.
The U.S. growth thesis now depends on several mechanisms working together: better portfolio coverage, continued category expansion, recovery of competitive share, improved manufacturing utilization and sufficient repeat consumption to absorb lower realization. None is implausible. Their combined financial outcome remains unproven.
U.S. PROFITABILITY: THE YEAR-OVER-YEAR RECOVERY MASKS SEQUENTIAL DETERIORATION
U.S. Q3 net revenues increased 22.7% year over year to $845 million, and adjusted gross profit increased to $544 million. Adjusted gross margin was 64.4%, expanding approximately 60 basis points organically. Adjusted operating companies income increased only 1.5% organically to $171 million because commercial spending increased substantially.
The revenue bridge shows how dependent the year-over-year growth was on the prior promotional comparison. PMI attributed $153 million of the U.S. revenue improvement to pricing and only $4 million to volume, mix and other factors, before a small currency effect. Favorable pricing comparisons accounted for nearly all of the $156 million reported revenue increase. The 22.7% headline should therefore not be interpreted as an equivalent increase in sustained consumer demand or underlying pricing power.
The sequential comparison is less favorable. Q2 U.S. revenue was $856 million, adjusted gross profit was $560 million and adjusted operating companies income was $279 million. Q3 revenue declined approximately 1.3% sequentially, adjusted gross profit declined approximately 2.9%, and adjusted operating income declined approximately 38.7%. The adjusted operating margin fell from approximately 32.6% to 20.2%, while gross margin declined from 65.4% to 64.4%.
These comparisons reconcile apparently conflicting messages. U.S. shipment momentum and competitive positioning improved, but the earnings cost of achieving that improvement increased faster. The quarter can be viewed as commercially encouraging and financially dilutive without contradiction.
The scale of the year-to-date deterioration remains substantial. U.S. organic revenue declined 5.5% over the first 9 months, adjusted gross profit declined 14.6% organically and adjusted operating companies income declined 41.1% organically to $550 million. The year-to-date adjusted gross margin of 64.1% was down approximately 690 basis points organically. A favorable Q3 comparison does not erase that deterioration.
Management reported approximately $370 million of U.S. SG&A in Q3 and expects an exceptional sequential increase of approximately 10% in Q4, implying about $407 million. It then stated that “the spend level that you are seeing in Q3 is a good proxy for the run rate that we’re going to have next year.” A simple annualization implies approximately $1.48 billion of annual U.S. spending at that quarterly level. This is a planning sensitivity based on management’s indicated run rate, not formal 2027 segment guidance.
The distinction between recurring and exceptional spending is crucial. The incremental Q4 increase is approximately $37 million. Returning from that level to the Q3 run rate would remove only that incremental quarterly burden. It would not reverse the larger step-up already embedded in Q3, nor restore the old revenue per pouch.
The expected Q4 profit decline also cannot be explained by advertising alone. Relative to Q3 adjusted operating income of $171 million, approximately $37 million of additional SG&A accounts for only about 22% of the decline to breakeven. On a simplified bridge, the remaining approximately $134 million must reflect lower gross profit or other effects, including the unit revenue reset, support for selling through 15-pouch inventory and manufacturing costs. This is an approximation rather than a disclosed company reconciliation, but it clarifies the nature of the pressure.
The Colorado facility adds another distinction. Low initial utilization and startup overheads can improve as production scales, providing a credible recovery lever. However, capacity utilization depends on realized demand. Building additional capacity does not itself resolve lower unit realization, and the call did not quantify the utilization level required for attractive incremental returns.
The U.S. represented approximately 7.4% of Q3 group revenue and approximately 3.3% of group adjusted operating income, using segment income as an indicative contribution measure rather than a full corporate reconciliation. This limits the immediate consolidated damage from Q4 breakeven profitability. It does not limit the potential valuation effect if investors had assigned the U.S. a disproportionately large share of future earnings growth.
IQOS: THE STRONGEST EVIDENCE SUPPORTING THE LONG-TERM THESIS
IQOS adjusted in-market sales growth accelerated from 5.1% in Q2 to 7.1% in Q3, with first-9-month growth of 7.7%. Excluding Japan and Poland, Q3 growth was approximately 10%, while year-to-date growth was 10.8%. Management compared that year-to-date rate with 10.6% in 2025. The evidence supports sustained double-digit momentum across the less disrupted geographic portfolio.
The improvement is geographically broad. European markets including Italy, Greece, Spain, Germany, the Netherlands and the U.K. are contributing, while Indonesia, Mexico, Saudi Arabia, Taiwan and global travel retail provide additional diversification. Broad participation reduces dependence on a single market’s conversion curve and is more valuable than growth concentrated in a small number of immature launches.
The shipment result was materially weaker than the consumer-demand proxy. HTU shipments increased only 1.5% to 41.5 billion units in Q3, compared with 7.6% shipment growth in Q2. Management attributed the gap to shipment phasing, prior inventory positioning and Japan’s tax-related purchasing patterns. The combination of 7.1% adjusted IMS growth and 1.5% shipment growth is consistent with inventory reduction, although IMS remains a company-estimated demand measure rather than a perfectly observed consumption statistic.
PMI now expects full-year HTU shipment growth to trail adjusted IMS growth slightly. Q4 shipment guidance of 39.5 billion-40.5 billion units implies full-year shipments of approximately 164 billion-165 billion when added to first-9-month shipments of 124.5 billion. The Q4 range is approximately 2.4%-4.8% below Q3 in absolute units. Given the disclosed phasing and seasonal effects, that sequential reduction should not automatically be interpreted as weaker underlying demand.
Lower inventories can improve working capital, as management noted. However, the resulting cash release should not be capitalized as a recurring structural increase in cash generation. Shipment growth cannot indefinitely remain below consumer demand without eventual inventory normalization.
International smoke-free financial performance was softer in Q3 than the demand indicators. Organic revenue growth slowed to 3.4%, compared with 11.8% in Q2, while organic gross profit growth slowed to 3.3% from 14.6%. The Q3 adjusted gross margin was approximately 70%, with essentially no organic expansion, compared with approximately 120 basis points of expansion year to date.
Management attributed the weaker revenue conversion to shipment comparisons, category mix and the timing of pricing decisions. These explanations are consistent with the operating data, but not sufficiently quantified to isolate the effect of each factor. The next verification point is whether stronger IMS translates into the promised Q4 reacceleration in international smoke-free revenue and profit.
The portfolio architecture remains strategically relevant. TEREA and LEVIA support premium positioning, while SENTIA and DELIA provide lower-priced options that can preserve consumer participation during tax and affordability shocks. This helps defend the franchise, but downtrading within PMI’s own portfolio can support volume and share while moderating revenue per unit. Volume retention and value creation should therefore be monitored separately.
JAPAN, EUROPE AND THE REGULATORY GROWTH CONSTRAINT
Japan’s Q3 adjusted IMS growth of 3.4% overstates the underlying recovery because consumers purchased ahead of the October price increase. Excluding estimated pantry loading, growth was only 1.3%. This compares with approximately 1.0% underlying growth in Q2 after adjusting for pantry depletion. The underlying recovery was modest even though the reported adjusted IMS rate moved sharply from a Q2 decline to Q3 growth.
The price shock was substantial. PMI increased prices by JPY 40 per pack in April and JPY 20 in October, while combustible cigarettes did not face an equivalent 2026 excise change. Management characterized the cumulative heated tobacco increase as exceeding 10%. That relative-price deterioration is a credible explanation for slower category growth and reinforces the importance of cross-category affordability.
IQOS maintained approximately 68% heat-not-burn category share despite taking more pricing than competitors in April. This is evidence of brand resilience within heated tobacco. It is not evidence that absolute category demand is unaffected, since consumers can change consumption or remain with cigarettes even when IQOS retains its share of heated tobacco.
The 2027 tax calendar appears less disruptive according to management, with a JPY 12 increase across heated tobacco and cigarettes in April. Greater symmetry should reduce the distortion created by 2026’s category-specific increases. However, April 2027 will still represent another consumer price event after the 2026 increases. A return to historical growth rates should not be assumed solely because the comparative tax structure becomes less unfavorable.
Europe provides a more constructive underlying demand picture. IQOS adjusted IMS growth increased to approximately 6% in Q3, or around 8% excluding Poland. Combined European smoke-free IMS growth was approximately 8.9%, reflecting the contribution of VEEV and ZYN alongside IQOS. This supports the multicategory strategy and shows that the regional growth opportunity is broader than heated tobacco alone.
Poland’s characterizing flavor ban remains a real economic constraint. Excluding the market is useful for diagnosing demand elsewhere, but the exclusion should not become a permanent substitute for forecasting the consolidated business. The eventual anniversary removes the initial comparison disruption; it does not restore the prohibited product proposition.
Germany introduces another tax-related risk. Management emphasized that the heated tobacco differential is preserved under the recently discussed excise increases and highlighted the strength of Marlboro, L&M and broader pack-format coverage. These advantages can support relative market share, but cannot eliminate affordability pressure, downtrading or illicit trade. Management’s observation that tax increases can shift volume to illegal channels is a risk assessment, not evidence that the specific German increase will produce a predetermined outcome.
BONDS and BLENDS provide additional acquisition optionality. Management reported that the proposition is attracting entrenched smokers who find its experience closer to cigarettes, with less apparent switching from existing HTU users. If sustained, that would improve incrementality. The evidence remains qualitative, with no disclosed acquisition cost, retention, margin or cannibalization statistics.
Taiwan’s category share above 80% demonstrates strong execution in a newly opened market, while Argentina offers potential future access. Neither should be assigned mature-market economics before launch timing, regulatory implementation, consumer acquisition and capital requirements are established.
VEEV AND INTERNATIONAL ZYN: VALUABLE OPTIONALITY, LIMITED DISCLOSED EARNINGS SCALE
VEEV shipments increased 61.6% in Q3, accelerating from 55.1% in Q2. First-9-month shipments increased 68.1% to approximately 4.0 billion equivalent units. European growth remained especially strong, while newer markets including South Korea broaden the opportunity.
The commercial model has a credible efficiency advantage. PMI can use IQOS distribution, consumer relationships and infrastructure to support VEEV, potentially reducing incremental market-entry costs. A shift toward closed-pod systems is also consistent with the portfolio’s positioning. These factors support the possibility of attractive economics as scale increases.
The current scale remains much smaller than the headline growth rate might suggest. Q3 VEEV shipments of approximately 1.4 billion equivalent units represented about 2.9% of total smoke-free shipment units. PMI did not disclose standalone VEEV revenue, operating income or return on invested capital. The business is strategically promising, but its earnings contribution cannot be quantified from shipment growth alone.
International ZYN shipments reached approximately 1.5 billion pouches over the first 9 months, increasing 6.3% on a like-for-like basis, with approximately 7% growth in Q3. Ex-Nordic IMS growth of approximately 30% demonstrates strong momentum in developing markets, while the much slower aggregate shipment growth reflects regional maturity, inventory effects and different comparison bases.
These measures should not be conflated with the release’s broader modern oral figures or the total oral category, which includes legacy snus. Brand growth, modern oral category growth and total oral volume can move differently. The common investment implication is that PMI has an expanding international pouch opportunity, but the contribution remains too small and insufficiently disclosed to offset the U.S. earnings reset on a quantified basis.
COMBUSTIBLES: THE QUARTER’S FINANCIAL SUPPORT, WITH LIMITS TO EXTRAPOLATION
The combustible business delivered unusually strong value extraction. Cigarette shipments were approximately flat against an industry decline of 1.1%, while pricing reached 8.9%. International cigarette category share increased 0.4 percentage points to 25.9%, and Marlboro share increased to a record 11.4%.
International combustible organic revenue increased 7.8%, while gross profit increased 9.8%. The adjusted gross margin reached approximately 68.5%. These results establish that the legacy portfolio remains a powerful funding source for smoke-free investment rather than merely a declining residual business.
Several qualifications limit extrapolation. Volume resilience was concentrated in markets such as Turkey, Indonesia and Egypt, where smoke-free availability is limited or constrained. Management acknowledged unfavorable geographic mix, indicating that unit growth is skewing toward markets with lower revenue realization. Stable aggregate cigarette volumes therefore do not imply stable geographic economics.
Q3 also benefited from restructuring distribution terms in certain markets. Management does not expect that benefit to be significant in Q4. Because the contribution was not quantified, a precise normalized growth rate cannot be calculated. The quarter’s 7.8% organic revenue growth and 9.8% gross profit growth should not be treated as clean ongoing run rates.
There is also an internal strategic tension. Restricted smoke-free availability supports combustible resilience in some markets, while future liberalization creates a smoke-free growth opportunity and potential cannibalization of cigarettes. PMI’s combined portfolio reduces the risk of losing the consumer relationship, but the cigarette and smoke-free growth opportunities cannot always be added without overlap.
The appropriate interpretation is that combustibles provide a durable financing mechanism and downside buffer. They should not be modeled as an indefinitely repeatable source of near-flat volumes combined with approximately 9% pricing.
MARGINS, PRODUCTIVITY AND GEOPOLITICAL COSTS
Group adjusted gross margin expanded approximately 80 basis points organically in Q3, while adjusted operating margin expanded approximately 130 basis points. The additional operating leverage benefited from administrative productivity and a favorable comparison with prior-year combustible-related items. Management explicitly stated that smoke-free commercial investment continued to grow faster than revenue.
Full-year SG&A is expected to grow broadly in line with revenue. This is less favorable than extrapolating Q3’s operating leverage and indicates that much of the gross profit improvement will continue to fund commercial expansion. The quarter demonstrates the ability to invest while expanding margins, but not an unrestricted path to lower operating expense ratios.
PMI has generated more than $2 billion of cumulative gross cost savings since 2024, achieving its 3-year objective ahead of schedule. This is evidence of strong execution. Gross savings are not equivalent to incremental net earnings, since they can be absorbed by inflation, reinvestment and other costs. The completed program should not be counted again as a new source of equivalent 2027 earnings growth without an additional target.
Management estimated that Middle East-related inflation reduces full-year adjusted EPS growth by approximately 0.5 percentage points, with Ukraine disruptions contributing another approximately 0.5 percentage points. Against the 2025 adjusted EPS base of $7.54, the combined 1 percentage point effect equates to approximately $0.075 per share. That is material relative to the $0.15 width of the full-year EPS guidance range.
The 2 cost categories have different risk characteristics. Ukraine disruption included damage to supply-chain facilities and goods from specific attacks. Those incidents may be individually nonrecurring, but the underlying geopolitical exposure remains. Energy, shipping and input inflation flow through contracts and inventories with a lag, creating a potentially longer earnings effect even if spot conditions subsequently improve.
Management declined to quantify the quarterly allocation or provide a 2027 cost forecast. The claim that PMI is more resilient than other consumer companies is directionally supported by maintained growth, but the call did not provide a standardized peer comparison. The observable conclusion is that the business has absorbed the costs without changing its formal organic growth ranges, while reducing the likelihood of outcomes near the upper end.
GAAP EARNINGS AND CASH GENERATION
The adjusted earnings picture differs materially from the GAAP result. Q3 reported diluted EPS declined 4.9% to $2.12 from $2.23, while adjusted EPS increased 5.4% to $2.36. Current-quarter adjustments included $0.13 of intangible amortization, $0.06 of equity investment fair-value adjustments, $0.04 related to a Dutch pension buyout and $0.01 related to Swedish Match financing taxes.
For the first 9 months, reported EPS declined 7.0% to $5.48, compared with adjusted EPS growth of 11.8% to $6.52. Full-year reported EPS guidance is $7.11-$7.26, compared with $7.26 in 2025, implying approximately flat to 2.1% lower GAAP earnings rather than double-digit growth.
The distinction does not invalidate the operating improvement. Fair-value movements and discrete tax items can obscure recurring operations. However, intangible amortization is recurring, and investment impairments remain relevant to capital-allocation assessment even when excluded from adjusted EPS. A valuation based on adjusted earnings should therefore be cross-checked against cash generation and the economic returns on acquired assets.
Operating cash flow guidance of approximately $13.5 billion remains a strong support for the equity case. Deducting expected capital expenditure of $1.4-$1.6 billion implies approximately $11.9-$12.1 billion of cash flow after capital expenditure, before acquisitions and financing distributions. The $13.5 billion operating cash flow figure should not be described as free cash flow.
The dividend increased 8.8% to an annualized $6.40 per share. Relative to adjusted EPS guidance, the annualized payout ratio is approximately 75.8%-77.2%. This is consistent with a mature, highly cash-generative business, but leaves less retained earnings capacity than a lower-payout growth company. Inventory reductions can support current-year cash conversion, while also limiting the extent to which that working-capital benefit should be repeated in forecasts.
The continued deleveraging target and absence of repurchases indicate that debt reduction and dividends remain the main uses of excess capital alongside reinvestment. EPS growth is not being supported by an announced buyback program, increasing the importance of genuine operating improvement.
INVESTMENT IMPLICATIONS AND SCENARIO FRAMEWORK
The call argues against treating PMI as either a conventional declining tobacco company or an uncomplicated high-growth nicotine platform. The international business combines pricing power, improving smoke-free penetration and strong cash conversion. The U.S. business offers substantial category exposure but has demonstrated that growth can require significant concessions in price and spending. The appropriate valuation should distinguish those earnings streams rather than applying a uniform growth premium.
A base case with a 50% illustrative probability assumes continued high-single-digit IQOS demand growth, durable but less exceptional combustible pricing, and gradual improvement in U.S. profitability as the transition stabilizes. ZYN share recovery persists, but lower realization and the higher spending base limit operating leverage. An illustrative 2027 adjusted EPS assumption of $9.00 represents approximately 8% growth from a $8.33 planning base within management’s preferred 2026 outcome zone. At an assumed 22x earnings multiple, the corresponding value is $198 per share.
A bull case with a 25% illustrative probability assumes that the broader ZYN portfolio delivers sustained share gains and sufficient consumption growth to absorb the lower revenue per pouch, while Colorado utilization improves and Japan demand normalizes. International smoke-free growth remains geographically broad, and geopolitical costs ease. An illustrative $9.50 EPS outcome at 25x earnings produces $237.50 per share.
A bear case with a 25% illustrative probability assumes that U.S. share gains prove promotion-dependent, volume growth fails to offset lower realization, and elevated spending persists without adequate incremental returns. Japan remains weak, European taxation constrains growth and combustible pricing produces greater volume pressure. An illustrative $8.25 EPS outcome at 18x earnings produces $148.50 per share.
These probabilities, EPS assumptions and multiples are analytical sensitivities, not company guidance or verified consensus estimates. Their probability-weighted value is approximately $195.50 per share. Assuming an unchanged $6.40 annual dividend, a $175 entry would imply approximately 15.4% probability-weighted 12-month total return and approximately 11.5% downside in the stated bear case including that dividend. More severe downside remains possible. No verified live share price is used here, so these figures establish conditional entry economics rather than a claim about current market upside.
The resulting action framework is to hold appropriately sized existing exposure and avoid increasing positions solely because Q3 exceeded guidance. Incremental purchases become more attractive around $175 or below under the stated assumptions, equivalent to approximately 19.4x the illustrative base-case 2027 EPS. A valuation materially above the $198 base-case outcome would require stronger evidence of U.S. profit recovery than was provided on this call.
For a diversified portfolio, an illustrative initial allocation of 0.5% of NAV would limit exposure while the U.S. economics are verified. Expansion toward 1.0% would require evidence that retail demand, realized revenue and gross profit improve together after the package transition. A 15% price-risk limit would correspond to approximately 7.5 basis points of NAV at the initial size and 15 basis points at the larger size, before gaps and execution slippage. At a $175 entry, that price threshold would be approximately $148.75. These are conditional risk parameters, not a trade instruction or a substitute for portfolio-specific limits.
Relative to a technology-heavy portfolio, PMI can diversify revenue cyclicality and add cash distributions. It is not a pure defensive hedge. The shares retain exposure to valuation duration, non-U.S. currencies, geopolitical disruption, regulation and premium consumer-brand execution. Existing holdings and factor exposures are not established here, so marginal correlation and portfolio concentration cannot be quantified.
CATALYSTS, VERIFICATION POINTS AND EXIT CONDITIONS
The first major catalyst is Q4 reporting and the initial 2027 outlook expected in February. The critical questions are whether U.S. profitability remains within the stated breakeven-to-slightly-negative expectation, whether spending returns toward the Q3 run rate and whether international smoke-free revenue and profit reaccelerate as guided. A recovery in shipment growth without a corresponding improvement in retail demand or realized revenue would be insufficient.
The second catalyst is the first clear post-transition evidence from 2027. Consumer repeat purchasing, pouch and can-equivalent volumes, category share, revenue per pouch, gross profit dollars and factory utilization need to be evaluated together. The disappearance of the exceptional Q4 spending increment should not be confused with restoration of historical margins.
Japan’s April 2027 tax change is another important checkpoint. More symmetric increases across cigarettes and heated tobacco could improve relative affordability, but the cumulative consumer burden remains. Evidence that underlying consumption growth strengthens after the increase would be more valuable than temporary purchasing ahead of the tax change.
The planned Q2 2027 Investor Day should clarify the medium-term earnings framework. The highest-value disclosures would be U.S. investment returns, the path to normalized profitability, product-level economics where available, the next productivity program and the capital required to sustain multicategory expansion. A longer-term target without a bridge from current U.S. economics would provide less reassurance.
The constructive thesis would be challenged by renewed ZYN share losses despite lower pricing, repeated U.S. spending increases beyond the indicated run rate, prolonged losses after the transition period, or sustained weakness in IQOS demand outside the known Japan and Poland effects. It would also be weakened by a failure to convert strong operating earnings into cash after allowing for temporary inventory movements.
The cautious stance would be challenged positively by sustained retail share gains with improving gross profit, stronger-than-expected utilization benefits and an early return to attractive U.S. operating leverage. Those outcomes would demonstrate that the price reset is expanding economic value rather than merely defending volume.
The quarter’s central conclusion remains clear: PMI’s international franchise is strong enough to fund a major U.S. competitive reset without breaking the consolidated earnings algorithm. Whether that reset earns an attractive return, rather than simply preserving ZYN’s relevance in a more competitive market, is the decisive question for the next phase of earnings growth and valuation.
COMPANY EMPLOYEES ON THE CALL
• Massimo Andolina, Group Chief Financial Officer, Philip Morris International. • James Bushnell, Vice President of Investor Relations and Financial Communications, Philip Morris International.
RESEARCH ANALYSTS ON THE CALL
• Bonnie Herzog, Goldman Sachs. • Matt Smith, Stifel. • Eric Serotta, Morgan Stanley. • Pallav Mittal, Barclays. • Andrei Andon, Jefferies.
Key Read-Throughs
KEY READ-THROUGHS FROM PHILIP MORRIS INTERNATIONAL’S Q3 2026 EARNINGS CALL
Philip Morris International’s results reveal a divergence between resilient nicotine demand and increasingly contested profit pools. The most actionable negative signal is the U.S. ZYN reset: a 25% reduction in revenue per pouch across most flagship products, broader product coverage and a sustained increase in commercial spending raise the competitive burden for nicotine pouch rivals. Conversely, strong international cigarette pricing and geographically diversified heated tobacco adoption support the durability of the industry’s cash generation. Outside tobacco, larger pouch packs create an important revenue-measurement risk for convenience retailers, while delayed energy and transportation inflation provides a corroborating warning for food producers. The strongest implications concern competitive economics and earnings composition rather than a generalized acceleration or deterioration in consumer spending. Impact magnitudes below refer to business and earnings sensitivity, not predicted share-price movements.
U.S. NICOTINE POUCHES
ZYN’S VALUE RESET RAISES THE COST OF COMPETING FOR EVERY MAJOR CHALLENGER (READ-THROUGH 1)
Affected companies: British American Tobacco (BATS: United Kingdom), Altria Group (MO: United States), and Imperial Brands (IMB: United Kingdom). Direction: negative. Magnitude: high for U.S. pouch franchise economics and growth expectations; smaller for immediate consolidated earnings, particularly where pouch profitability remains limited.
Call evidence: Management stated, “We are migrating our entire flagship portfolio from 15 to 20 count at the price of the 15 counts,” describing the change as “a 25% price reduction on a per pouch basis.” ZYN also expanded into moist, higher-strength products and additional dry variants. Estimated category offtake share increased 1.4 percentage points between June and September, before full implementation of the flagship value reset.
The transmission mechanism is a narrowing of the competitive advantages previously available to challengers. BAT’s Velo, Altria’s on! and Imperial’s Zone face a stronger incumbent offering more comparable formats, strengths and flavors at a lower effective price. Competitors must respond through some combination of lower net realization, greater promotional spending, stronger retailer incentives or acceptance of slower share gains. The pressure is on the economic cost of acquiring and retaining customers, not necessarily on absolute category volumes.
BAT has particular expectations exposure. Its H1 2026 disclosure identified modern oral as its largest New Category by revenue and reported 65.9% growth on its stated constant-currency basis. A stronger ZYN response therefore challenges an important source of BAT’s growth momentum, even though it does not establish that Velo’s growth will stop. Altria is exposed through the national expansion of on! PLUS, while Imperial faces a higher spending hurdle as a smaller challenger.
The arithmetic illustrates the severity of the pricing change. A 25% reduction in revenue per pouch requires 33.3% more pouches merely to preserve revenue on affected products. If rivals respond with comparable price concessions, positive manufacturing costs mean the volume increase required to preserve contribution profit is greater still. Category growth can therefore remain strong while economic returns deteriorate.
Near-term trading catalysts are Q4 promotional intensity, retail share movements and competitors’ initial 2027 spending assumptions. The longer-duration shift is toward a more competitive category in which brand growth cannot be valued independently of acquisition costs and net revenue per pouch. The counterweight is category expansion: better value can attract additional consumers, but that benefit does not automatically compensate each manufacturer for lower unit economics.
PMI CAN FUND U.S. DISRUPTION WITHOUT SACRIFICING AN INCUMBENT U.S. CIGARETTE FRANCHISE (READ-THROUGH 2)
Affected companies: Altria Group (MO: United States) and British American Tobacco (BATS: United Kingdom), with a relative strategic advantage for Philip Morris International (PM: United States). Direction: negative for incumbent U.S. tobacco profit migration; positive for PMI’s competitive staying power. Magnitude: moderate near-term earnings risk, potentially high strategic significance over several years.
Call evidence: International operations represented 93% of PMI’s year-to-date revenue and delivered approximately 11% organic operating companies income growth. Management expects Q4 U.S. adjusted operating companies income to be approximately zero or slightly negative, while maintaining group organic operating income growth guidance of 7%-9%. It also stated that Q3’s approximately $370 million U.S. spending level is “a good proxy for the run rate that we’re going to have next year.”
The competitive asymmetry is important. PMI can accept depressed U.S. profitability while funding expansion from international cash flows. Unlike Altria and BAT’s Reynolds business, PMI does not have a large incumbent U.S. cigarette earnings stream that loses sales when American smokers switch to its pouches. For PMI, that conversion is primarily an acquisition opportunity. For incumbent manufacturers, it can require replacing highly profitable legacy sales with newer products that demand substantial marketing and competitive investment.
Altria also faces exposure through traditional smokeless tobacco. Its Q2 2026 disclosure reported Copenhagen shipment declines of 10.9% and Skoal declines of 13.7%. ZYN’s broader strengths and moist format increase its relevance to consumers of traditional oral products. Altria consequently faces pressure both on the legacy profit pool and on the spending required to establish its replacement platform.
This is not a claim that every pouch purchase displaces a cigarette or traditional smokeless purchase. Dual use, competitor switching and consumption intensity all affect substitution. The high-conviction implication is that aggressive pouch competition raises the cost of navigating an already established migration.
Near-term catalysts are competitor guidance for promotional spending and oral-category profit conversion, rather than pouch shipment growth alone. The longer-duration risk is that a growing smoke-free sales mix fails to produce equivalent growth in operating profit. BAT’s international diversification provides more funding flexibility than a predominantly U.S.-focused model, but does not remove this issue within Reynolds.
HEATED TOBACCO AND EUROPEAN VAPOR
IQOS’S GEOGRAPHIC BREADTH RAISES THE INVESTMENT HURDLE FOR CHALLENGER PLATFORMS (READ-THROUGH 3)
Affected companies: British American Tobacco (BATS: United Kingdom) and Japan Tobacco (2914: Japan). Direction: negative competitive read-through for glo and Ploom. Magnitude: moderate for medium-term heated tobacco returns and required investment; limited evidence for an immediate consolidated earnings downgrade.
Call evidence: IQOS adjusted in-market sales increased 7.1% in Q3 and approximately 10% excluding Japan and Poland. Management highlighted double-digit growth across multiple European and emerging markets, while Taiwan category share exceeded 80%. PMI also reported that its international smoke-free portfolio outgrew its comparable industry by approximately 1 percentage point.
The transmission mechanism is cumulative commercial scale. A larger installed device base supports recurring consumables purchases, retailer relevance and more efficient use of consumer-acquisition infrastructure. Broad geographic participation also allows PMI to sustain investment despite temporary disruption in individual markets. Challenger platforms must compete against an established ecosystem rather than simply a competing device.
The non-obvious implication is that opening a heated tobacco market does not necessarily create an evenly shared opportunity. Taiwan demonstrates how quickly a well-resourced entrant can establish a dominant category position. Existing cigarette distribution and brand familiarity remain useful, but do not guarantee equivalent success in heated tobacco.
For BAT and Japan Tobacco, the principal risk is a higher acquisition cost or longer path to attractive returns, not an automatic decline in absolute heated tobacco volume. A growing category can support challenger growth while the leader captures a disproportionate share of incremental economics. PMI’s strength should therefore not be translated mechanically into a claim that every competitor is losing share.
Near-term catalysts are competitors’ reported heated tobacco shares, device subsidies and commercial spending. The longer-duration shift is toward greater advantage for platforms with sufficient consumables scale to fund continuous innovation and market development.
KT&G (033780: South Korea) requires different treatment because its lil products also participate in a supply and commercialization relationship with PMI outside South Korea. That relationship makes KT&G both a competitor and a commercial partner. However, the call did not disclose lil-specific orders or volumes, so IQOS growth cannot be assigned directly to KT&G revenue.
VEEV’S EUROPEAN SCALE-UP PRESSURES THE PROFITABILITY OF THE CLOSED-POD OPPORTUNITY (READ-THROUGH 4)
Affected companies: British American Tobacco (BATS: United Kingdom) and Imperial Brands (IMB: United Kingdom). Direction: negative competitive impact on Vuse and blu. Magnitude: moderate for European vapor economics and medium-term growth expectations; lower for immediate group earnings.
Call evidence: VEEV shipments increased approximately 62% globally and 66% in Europe during Q3. Management described Europe as “the primary international profit pool” and stated that VEEV was extending its position as the region’s leading closed-pod brand. It attributed part of the performance to deployment through IQOS’s commercial infrastructure and consumer reach.
The important transmission mechanism is shared infrastructure. PMI can deploy VEEV through relationships, distribution capabilities and consumer engagement resources already supporting IQOS. This can reduce the incremental investment required to build a vapor business relative to a platform relying more heavily on standalone spending.
The shift toward reusable closed-pod systems remains positive for the addressable category. The negative read-through is that the category opportunity is being contested by a rapidly scaling competitor. Regulatory or consumer migration away from other formats should not be assumed to translate automatically into high-margin growth for existing listed vapor brands.
BAT and Imperial face potential pressure through retailer visibility, promotional expenditure and consumer retention. Their products can continue to grow while the cost of maintaining competitive relevance rises. Imperial’s recent disclosures also describe growth in blu, illustrating why PMI’s performance is evidence of intensifying competition rather than proof of universal competitor contraction.
Near-term catalysts are European category share, retail distribution and promotional intensity. The longer-duration issue is whether vapor platforms can generate attractive returns after accounting for recurring product innovation and customer-acquisition costs. No specific component supplier can be assigned the benefit of VEEV’s growth from this call because manufacturing counterparties and sourcing volumes were not disclosed.
INTERNATIONAL COMBUSTIBLES AND EXCISE POLICY
INTERNATIONAL CIGARETTE CASH FLOWS REMAIN MORE RESILIENT THAN A SIMPLE VOLUME-DECLINE MODEL IMPLIES (READ-THROUGH 5)
Affected companies: British American Tobacco (BATS: United Kingdom), Japan Tobacco (2914: Japan), and Imperial Brands (IMB: United Kingdom). Direction: positive. Magnitude: moderate support for earnings durability and cash distributions, subject to geographic mix and competitive execution.
Call evidence: PMI delivered approximately flat cigarette shipments despite 8.9% pricing, compared with a 1.1% industry volume decline. Management raised its full-year cigarette outlook to a decline near the year-to-date rate of 1.2%, versus the previous expectation of a 2%-3% decline. Strength was concentrated in markets including Turkey, Indonesia and Egypt, where smoke-free alternatives are unavailable or have limited penetration.
The transmission mechanism is pricing combined with uneven substitution. Where consumers have fewer legal alternatives, the combustible franchise can retain demand longer, allowing price increases to offset volume attrition. That supports the cash flows used by international tobacco manufacturers to fund dividends, debt reduction and smoke-free investment.
The positive inference is strongest at the industry profit-pool level. It does not imply that competitors match PMI’s results. PMI gained 0.4 percentage points of international cigarette category share, so part of its resilience reflects company-specific execution. Its pricing performance also came with unfavorable geographic mix, meaning unit stability overstated the economic benefit.
The quarter’s distribution-term benefit should not be transferred to peers. Management specifically stated that this support would not be significant in Q4. A cleaner read-through is that pricing remains effective in selected international markets, not that approximately 9% pricing with flat volumes is a permanent sector run rate.
Near-term catalysts are peers’ price-versus-volume bridges and cash-flow guidance. The longer-duration implication is a potentially slower erosion of the financing base supporting the industry’s transition.
This positive signal should not be extended automatically to Altria Group (MO: United States). PMI’s strongest markets have different substitution and affordability conditions. Altria’s own Q2 disclosure estimated approximately 5% adjusted U.S. cigarette industry volume decline, illustrating the geographic distinction.
JAPAN’S MORE SYMMETRIC 2027 TAX INCREASE IS A RELATIVE POSITIVE FOR THE ENTIRE HEATED TOBACCO CATEGORY (READ-THROUGH 6)
Affected companies: Japan Tobacco (2914: Japan) and British American Tobacco (BATS: United Kingdom). Direction: positive for Ploom and glo category conditions, with near-term pressure before the comparison normalizes. Magnitude: moderate within Japanese heated tobacco; smaller and mixed at consolidated level.
Call evidence: PMI’s Japanese price increases totaled JPY 40 per pack in April and JPY 20 in October, while cigarettes did not face an equivalent 2026 excise change. Excluding pantry loading, Japanese IQOS growth was only 1.3% in Q3. Management described the next scheduled increase as JPY 12 across both heated tobacco and cigarettes in April 2027.
The positive mechanism is relative-price normalization. A tax change concentrated on heated tobacco increases the cost of switching away from cigarettes. A more symmetric increase reduces that incremental disadvantage. This benefit applies to the category, not exclusively to IQOS, creating a more favorable acquisition environment for Ploom and glo.
The call also provides a useful interpretation of 2026 weakness: part of the slowdown reflects relative affordability and purchase timing rather than a definitive end to adoption. This supports a more constructive assessment of medium-term category demand than would follow from shipment data alone.
The near-term effect remains less favorable. Consumers still need to absorb October’s price increase, pantry loading reverses, and April 2027 adds another price event. More symmetric taxation reduces a distortion; it does not reverse the accumulated increase in consumer spending.
Japan Tobacco’s consolidated effect is mixed because improved heated tobacco conversion can also displace some of its domestic cigarette sales. The benefit depends on its ability to retain the consumer through Ploom and earn an attractive contribution after acquisition costs. PMI’s approximately 68% category share indicates that the more favorable category environment does not eliminate intense competition.
The main catalyst is underlying consumption and category share after April 2027, rather than shipments immediately before the tax change. The longer-duration implication is reduced regulatory distortion between cigarettes and heated tobacco.
GERMANY’S EXCISE PATH FAVORS CATEGORY FLEXIBILITY OVER PURE CIGARETTE PRICING (READ-THROUGH 7)
Affected companies: Imperial Brands (IMB: United Kingdom), British American Tobacco (BATS: United Kingdom), and Japan Tobacco (2914: Japan). Direction: negative for German legal cigarette demand and potentially positive for heated tobacco substitution. Magnitude: moderate local-market sensitivity; consolidated impact cannot be quantified from the call.
Call evidence: Management discussed a materially larger German tax increase beginning January 1 and warned that such changes can move volume toward illicit channels. It also stated, “The differential with HTU has been retained,” while noting double-digit IQOS in-market sales growth in Germany.
The transmission mechanism has 2 components. Higher retail prices can accelerate downtrading, cross-border purchasing and illicit substitution, weakening the legal cigarette revenue pool. At the same time, preservation of a heated tobacco tax differential can improve the relative consumer proposition of HTUs.
Imperial merits particular attention because Germany is an important market in its combustible strategy, and its October trading update highlighted gains in targeted German segments. Those gains do not eliminate the risk that the overall legal profit pool deteriorates. Value brands and pack-format flexibility can cushion the impact, but retaining unit share does not guarantee retention of revenue or profit per consumer.
BAT and Japan Tobacco also face cigarette pressure, with potential partial offsets through glo and Ploom. The offsets depend on category execution and acquisition economics. A legal tax advantage does not itself guarantee profitable migration.
Near-term trading catalysts are manufacturers’ January pricing decisions, any year-end inventory loading and early-2027 legal-market volumes. The longer-duration risk is a lower-quality cigarette market characterized by greater price sensitivity and leakage into untaxed channels. An apparent shipment benefit before implementation should not be interpreted as improved underlying demand.
CONVENIENCE RETAIL
LARGER ZYN PACKS BREAK THE LINK BETWEEN POUCH GROWTH, RETAIL SALES AND SHOPPING FREQUENCY (READ-THROUGH 8)
Affected companies: Murphy USA (MUSA: United States) and Alimentation Couche-Tard (ATD: Canada). Direction: negative for revenue forecasts based mechanically on pouch growth; potential pressure on purchase frequency. Magnitude: material for the measurement of nicotine-category growth, but an unquantified and likely smaller consolidated earnings effect.
Call evidence: Most flagship ZYN variants are moving from 15 to 20 pouches at the same can price. Management also acknowledged distribution and pipeline effects in shipments and did not fully reconcile 4.2% shipment growth with the weaker retail data cited during Q&A.
The high-conviction implication is arithmetic rather than a prediction of retailer distress. If cans sold are unchanged, affected pouch volume rises 33.3% without an increase in can revenue. If total consumption is unchanged, consumers require 25% fewer cans. Where retail price per can is also unchanged, that reduces revenue per unit of consumption and can extend the interval between nicotine-related shopping visits.
Murphy’s exposure is economically relevant. Its Q2 2026 disclosure reported same-store nicotine contribution of $20.6 thousand per store per month against total merchandise contribution of $43.3 thousand, approximately 48%. That is all nicotine, not ZYN alone, so it must not be used as a direct measure of ZYN sensitivity. It does establish why nicotine revenue quality and visit frequency matter.
The manufacturer’s 25% reduction in revenue per pouch should not be equated with a 25% reduction in retailer margin. Wholesale terms, retail pricing, promotional reimbursement and other basket purchases determine the actual outcome. PMI’s transition support could cushion the near-term effect, while category expansion and additional consumption could offset fewer cans per existing user.
Near-term catalysts are Q4 retail sales measured in dollars and cans, rather than pouches alone, and disclosures about promotional support. The longer-duration issue is whether larger packs reduce visit frequency or whether consumer acquisition and consumption growth compensate. Strong pouch data alone is not sufficient evidence for an upgrade to convenience-store earnings.
PACKAGED FOOD AND CONSUMER COSTS
DELAYED ENERGY AND FREIGHT INFLATION LIMITS THE QUALITY OF COMMODITY-RELIEF MARGIN RECOVERY (READ-THROUGH 9)
Affected company: Nestlé (NESN: Switzerland). Direction: negative incremental margin read-through. Magnitude: low to moderate, with insufficient evidence for a numerical EPS revision from this call alone.
Call evidence: PMI stated that higher energy and shipping costs were beginning to appear in input prices, with a greater effect expected in Q4 as those inputs flowed through inventory and contracts. Management estimated approximately 0.5 percentage points of full-year EPS growth pressure from this inflation and cautioned that supply-chain protections “cannot last forever.”
The transmission mechanism is delayed cost recognition. Procurement contracts and existing inventories can postpone inflation rather than eliminate it. A company can therefore report manageable early-period costs while facing a larger subsequent P&L burden, even without a further increase in spot prices.
Nestlé provides a directly corroborated exposure rather than a generic consumer-sector analogy. Its H1 2026 outlook identified lower coffee and cocoa costs and additional savings as margin supports, offset by higher transportation and energy costs arising from the Middle East conflict. PMI’s Q3 commentary strengthens the case that this offset is reaching reported earnings rather than remaining a theoretical risk.
The actionable implication is negative for forecasts that translate agricultural commodity relief into unqualified gross-margin expansion. Manufacturing energy, freight and associated packaging costs can absorb part of the benefit, while weaker consumer affordability can limit the ability to pass through those costs.
Near-term catalysts are year-end margin delivery and initial 2027 cost assumptions. The longer-duration issue is the lag between commodity markets, contract repricing and reported earnings. Nestlé’s lower coffee and cocoa costs remain genuine offsets, so this is a warning against overestimating the margin recovery, not evidence that the recovery must reverse. PMI’s results also do not establish a corresponding positive earnings call on shipping or energy producers, whose profitability depends on different price, volume and cost exposures.
Report record
- Sector
- Consumer Staples
- Fiscal period end
- September 30, 2026
- Report date
- October 21, 2026
- Analysis
- 6430 words
- Read-throughs
- 3176 words
- Content fingerprint (PDF)
0e39e9996d3a- Content fingerprint (analysis)
927597299d14- Content fingerprint (read-throughs)
8cb3f38bb943
Prepared from the company's earnings release and earnings call transcript. Figures as reported by the company. For information only. Not investment advice.
More from Philip Morris International Inc.
No other reports yet.
All Philip Morris International Inc. reports
More in Consumer Staples
No other reports yet.
Follow @AtlasPeakRes on X for new earnings reports as they publish.