Earnings Reports
Tesla, Inc. FQ3 2026 Earnings Report
Tesla, Inc. (TSLA) FQ3 2026 earnings: Operating Execution Improved Materially, but a Durable Earnings Acceleration Is Not Yet Established. Full earnings analysis, key read-throughs, and the one-page exhibit from Atlas Peak Research.
Tesla, Inc. (TSLA)
Sector: Consumer Discretionary · FQ3 2026 · Period end September 30, 2026 · Reported October 21, 2026
Tesla’s Q3 2026 results support a HOLD/NEUTRAL investment stance: operating execution improved materially from Q2, but the quarter does not yet establish a durable acceleration in underlying earnings or free cash flow.
One-Page Exhibit
Earnings Analysis
EXECUTIVE CALL SUMMARY: Tesla Inc. (10/21/26)
Tesla’s Q3 2026 results support a HOLD/NEUTRAL investment stance: operating execution improved materially from Q2, but the quarter does not yet establish a durable acceleration in underlying earnings or free cash flow. Automotive profitability recovered, paid FSD adoption strengthened, and services generated record gross profit. However, consolidated revenue remained essentially unchanged year over year, operating income declined 56%, energy margins benefited substantially from discrete accounting adjustments, and operating cash flow depended meaningfully on growth in operating liabilities and deferred revenue. The investment case improved at the product and gross-profit levels, while remaining constrained by capital intensity, rising development spending, and limited evidence of commercial returns from autonomy and robotics.
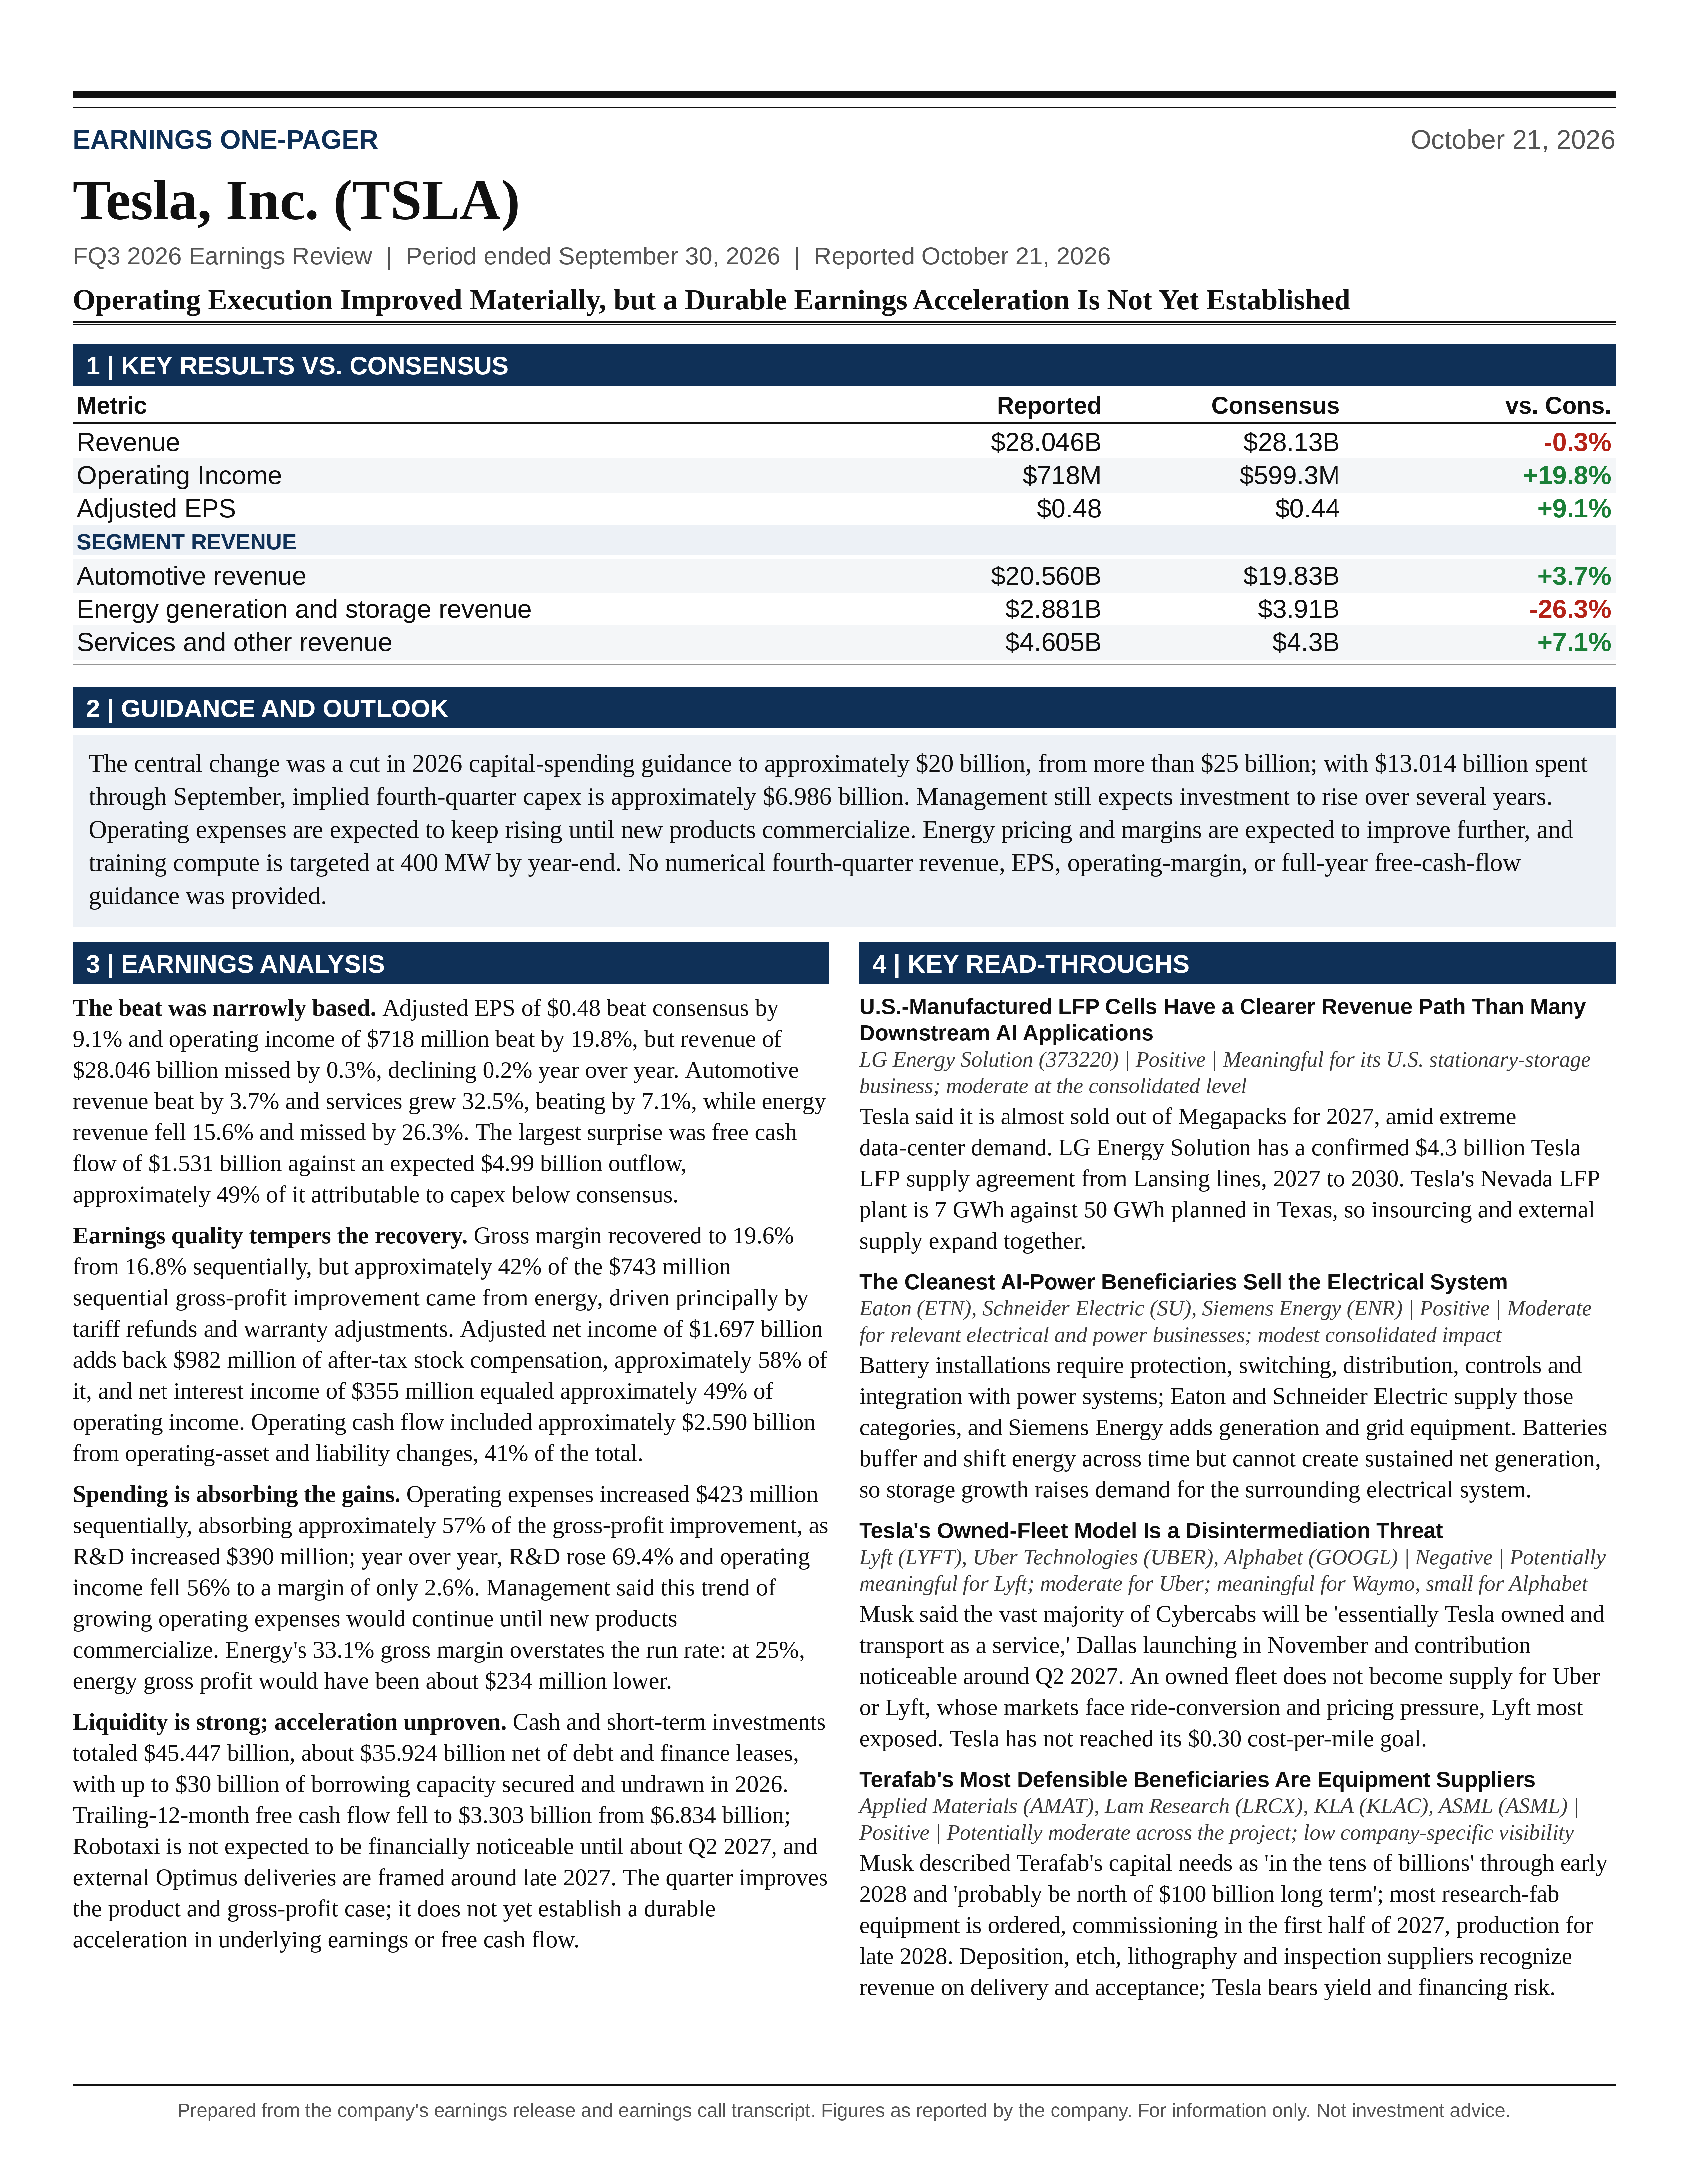
Adjusted EPS of $0.48 exceeded Bloomberg consensus of $0.44 by 9.1%, while revenue of $28.046 billion missed the $28.13 billion estimate by approximately 0.3%. Operating income of $718 million exceeded consensus by 19.8%. The largest positive surprise was free cash flow of $1.531 billion against an expected outflow of $4.99 billion. Approximately 49% of that $6.521 billion surprise was attributable to capital expenditures below consensus, rather than stronger operating cash generation. Both components were favorable, but neither establishes that the multiyear investment burden has diminished.
The most important commercial development was the increasing monetization of FSD. More than 75% of North American deliveries included paid subscription enrollment, compared with approximately 55% in Q2. The company’s reported 1.74 million “Active FSD Subscriptions” include both upfront purchases and recurring subscriptions. Management’s disclosure that approximately 50% are recurring implies around 870,000 actual subscription customers, not 1.74 million. At an illustrative $99 monthly price, that recurring customer base supports approximately $1.03 billion of annualized revenue. This is a meaningful business with attractive incremental economics, but retention, realized pricing, and incremental support costs remain insufficiently disclosed.
The central guidance change was the reduction in 2026 capital expenditure expectations from more than $25 billion to approximately $20 billion. That improves near-term liquidity expectations but does not represent a structural reduction in planned investment. Management still expects spending to rise over several years, has secured up to $30 billion of borrowing capacity, and described semiconductor infrastructure requiring tens of billions of dollars through early 2028 and potentially more than $100 billion over the long term. The allocation of that semiconductor expenditure between Tesla and SpaceX remains unresolved.
The call also clarified the timing of prospective earnings contributions. Robotaxi is not expected to become financially noticeable until approximately Q2 2027, with a potentially larger contribution in Q3 or Q4. Initial customer-owned vehicles could enter the Robotaxi network around Q2 2027. External Optimus deliveries are now framed around late 2027, with substantial software, dexterity, durability, and manufacturing work still required. These milestones support substantial long-duration optionality, but they should not be treated as equivalent to contracted revenue or demonstrated profitability.
QUARTERLY RESULTS AND THE QUALITY OF THE EARNINGS BEAT
Revenue declined approximately 0.2% year over year and 0.7% sequentially. The composition of revenue was considerably more informative than the consolidated total. Automotive revenue of $20.560 billion declined 3.0% year over year but exceeded Bloomberg consensus by 3.7%. Energy generation and storage revenue of $2.881 billion declined 15.6% and missed consensus by 26.3%. Services and other revenue of $4.605 billion increased 32.5% and exceeded consensus by 7.1%. The quarter therefore reflected an offset between automotive and energy revenue pressure and substantial services growth, rather than broad-based top-line expansion.
Gross profit increased to $5.494 billion from $4.751 billion in Q2 and $5.054 billion in Q3 2025. Consolidated gross margin recovered to 19.6%, compared with 16.8% sequentially and 18.0% a year earlier. The $743 million sequential gross-profit improvement comprised $343 million from automotive, $314 million from energy, and $86 million from services. Approximately 42% of that improvement came from energy, where management explicitly identified tariff refunds and warranty adjustments as the principal margin drivers. The gross-margin recovery was therefore real, but its recurring component was smaller than the headline improvement.
Operating expenses increased $423 million sequentially to $4.776 billion, absorbing approximately 57% of the gross-profit improvement. Research and development increased $390 million to $2.761 billion, accounting for approximately 92% of the sequential operating-expense increase. Operating income consequently improved from $398 million to $718 million, an 80.4% increase, but operating margin remained only 2.6%. This remains a business with limited current operating-profit protection against additional spending or adverse pricing.
The year-over-year comparison was weaker. Gross profit increased $440 million, but operating expenses increased $1.346 billion, producing a $906 million decline in operating income. R&D increased 69.4%, while total operating expenses increased 39.2%. The absence of the prior-year $238 million restructuring charge provided a favorable comparison, yet was insufficient to offset the expansion in development and administrative costs. The deterioration in operating income therefore cannot be attributed simply to a difficult restructuring comparison or isolated automotive weakness.
Management made the persistence of this spending explicit. Taneja stated, “This trend of growing OpEx would continue till we commercialize these new products.” That statement is more consequential for near-term earnings than the broadly optimistic demand commentary. Commercialization dates determine when development spending can be absorbed by new revenue, but commercialization itself does not guarantee profitability. Early products can continue to incur substantial engineering, warranty, support, and manufacturing costs after initial customer deliveries.
GAAP net income attributable to common shareholders was $787 million, down 42.7% year over year and 29.4% sequentially. GAAP diluted EPS declined to $0.22 from $0.39 a year earlier and $0.32 in Q2. Adjusted EPS, by contrast, increased from $0.33 in Q2 to $0.48. This divergence largely reflects the treatment of investment marks, stock compensation, and specified tax items, rather than an inconsistency in operating performance.
The company’s reconciliation is important. Q3 adjusted net income of $1.697 billion adds back $982 million of after-tax stock compensation, removes a $224 million after-tax digital-asset gain, adds back a $108 million after-tax SpaceX investment loss, and adjusts $44 million of specified tax items. The Bitcoin and SpaceX marks therefore do not explain the adjusted EPS beat because those items are excluded from the adjusted measure. Tariff-related operating benefits and warranty adjustments, however, are not separately removed in that reconciliation and remain relevant to the quality of adjusted earnings.
Stock compensation warrants particular attention. Pretax expense increased to $1.165 billion from $663 million a year earlier. The after-tax addback represented approximately 58% of adjusted net income. Although noncash in the current period, stock compensation remains an economic cost through dilution and the transfer of shareholder value. Adjusted earnings should therefore be assessed alongside GAAP operating income and cash generation rather than treated as a complete measure of shareholder profitability.
Below-the-line support also matters. Net interest income was $355 million, equivalent to approximately 49% of operating income. The effective tax rate was approximately 15.9%, compared with 29.1% a year earlier. These items supported net earnings despite the decline in operating profitability. As capital is deployed and borrowing potentially increases, the contribution from net interest income could become less favorable.
AUTOMOTIVE: BETTER ECONOMICS, BUT DEMAND AND PRICING REQUIRE SEPARATE ASSESSMENT
Tesla delivered 486,532 vehicles, up 1.3% sequentially but down 2.1% year over year. Production increased 2.8% sequentially and 3.8% year over year to 464,391 vehicles. Deliveries exceeded production by 22,141 vehicles, while reported inventory days declined from 15 in Q2 to 11. These figures support management’s description of tightening finished-vehicle availability, although they do not independently establish the magnitude, duration, or cancellation risk of the order backlog.
Musk stated that demand was “exceeding our production by a significant margin,” while Taneja described the largest backlog in 4 years. The written update identified battery availability as a limiting factor on production. This is a more constructive operating setup than excess capacity combined with weak demand, but supply-constrained revenue is not automatically high-return revenue. Customer financing subsidies, regional mix, and vehicle pricing still determine the economics of converting backlog into deliveries.
Automotive gross margin excluding regulatory credits increased to 18.1%, compared with 16.3% in Q2 and 15.4% a year earlier. Automotive gross profit excluding credits increased to approximately $3.693 billion from $3.317 billion sequentially and $3.198 billion a year earlier. The approximately 15.5% year-over-year increase in credit-excluded automotive gross profit is among the strongest underlying operating indicators in the quarter.
Management attributed the sequential margin improvement primarily to a higher proportion of deliveries in Asia-Pacific. The shareholder update also cited favorable regional and product mix, partially offset by lower vehicle ASPs. Consequently, the margin recovery should not be characterized solely as improving vehicle pricing or FSD operating leverage. Geographic mix can reverse, and the quarter’s realized automotive pricing remained under pressure.
Regulatory-credit revenue declined to $113 million from $146 million in Q2 and $417 million a year earlier. The $304 million year-over-year reduction was a meaningful operating-profit headwind. Improvement in automotive margins despite that decline strengthens the case that the core vehicle economics improved. Nevertheless, credit revenue still represented approximately 16% of consolidated operating income, illustrating how sensitive the current profit base remains to relatively small revenue streams.
Product concentration remains elevated. Model 3 and Model Y represented approximately 98.3% of passenger-vehicle deliveries. Other-model deliveries declined 47.9% year over year to 8,295 vehicles and accounted for approximately 72% of the total year-over-year delivery decline. Strong Model Y performance in selected markets therefore coexists with material weakness elsewhere in the portfolio. The broader automotive recovery remains heavily dependent on a narrow set of products.
The target of approximately 5 million vehicles annually by 2030 implies substantial manufacturing expansion. Relative to Q3’s annualized passenger-vehicle production rate of approximately 1.86 million, reaching 5 million would require approximately 28% annual growth over 4 years. That comparison is indicative rather than exact because the future production mix may include more vehicles retained for Tesla’s own fleet. Owned Robotaxis generate capital assets and subsequent service revenue, not immediate third-party vehicle sales. Production growth, delivery growth, and revenue growth therefore require separate forecasts.
FSD: A MATERIAL RECURRING-REVENUE INFLECTION WITH IMPORTANT DEFINITIONAL LIMITS
The FSD disclosures materially strengthen the argument that software capability can influence vehicle demand and lifetime customer economics. The North American delivery attach rate increased from approximately 55% in Q2 to more than 75% in Q3. Although the spoken transcript described the increase as approximately 20%, the written shareholder update specifies nearly 20 percentage points. That distinction matters because the relative increase in attachment was substantially larger than 20%.
The reported 1.74 million active FSD customer count increased 17.6% sequentially and 67.3% year over year. However, the company’s definition includes both upfront-payment customers and monthly subscribers, while excluding free trials. Treating the full 1.74 million as recurring monthly subscriptions would materially overstate annual recurring revenue.
Management indicated that subscriptions represented approximately 50% of the current paid base, compared with 45% of 1.48 million customers in Q2. Those disclosures imply approximately 870,000 recurring subscribers in Q3 versus 666,000 in Q2, or roughly 31% sequential growth. Approximately 204,000 of the 260,000 increase in the total paid customer base therefore came from recurring subscriptions, subject to rounding and customer movements between categories. This is a more economically meaningful indicator than the headline 17.6% growth in the combined customer metric.
At a uniform $99 monthly price, 870,000 subscribers imply approximately $1.03 billion of annualized recurring revenue, compared with approximately $791 million using the same assumptions for Q2. This is a run-rate illustration, not reported revenue or a forecast. International pricing, promotional terms, cancellations, and the timing of additions can materially change recognized revenue. Nevertheless, the calculation is consistent with management’s broad endorsement of Pierre Ferragu’s suggestion that FSD recurring revenue was approaching $1 billion annually.
The delivery attachment disclosure does not establish durable retention. Taneja emphasized that customers were enrolling despite having access to a free introductory month, which is more encouraging than automatic trial activation. However, the call did not provide 3-month, 6-month, or 12-month retention, average subscriber tenure, realized revenue per customer, or acquisition-channel economics. Initial enrollment and sustained payment are different measures.
The assertion that FSD could approximately double lifetime profit per vehicle is plausible under favorable assumptions but not yet demonstrated. At $99 per month and an assumed 85% incremental gross margin, annual gross contribution would be approximately $1,010. Sustained for 10 years, that produces approximately $10,100 before discounting. At a 10% discount rate, the value falls to approximately $6,200 even with no churn. Under an illustrative 5-year model with 80% annual retention, the present value falls to approximately $2,700. None of these margin, retention, or duration assumptions was provided as guidance. The sensitivity demonstrates why subscription persistence is more important than initial attachment when valuing the installed base.
FSD subscription revenue belongs within automotive-related economics, whereas Robotaxi revenue is included in services and other. A valuation framework must avoid valuing the same software profit both inside the automotive business and again as a separate software asset. Similar care is required when extrapolating recurring subscriptions from vehicles that could subsequently enter a Tesla-operated commercial network.
Competitive pricing risk was not resolved. Management emphasized the difficulty of achieving reliable autonomy and asserted a significant technical lead. Those claims may support differentiation, but they do not establish the durability of subscription pricing. Competing driver-assistance offerings could pressure willingness to pay without matching Tesla across every operating condition. This risk is particularly relevant where advanced assistance is bundled into vehicle pricing.
The current customer product also remains supervised. Tesla’s written disclosure states that active driver supervision is required and that the software does not make the vehicle autonomous. Greater availability of supervised FSD in Europe should not be conflated with regulatory authorization for driverless commercial service.
ENERGY: STRONG FORWARD DEMAND, WEAK REVENUE CONVERSION, AND DISTORTED MARGINS
Energy storage deployments reached 13.7 GWh, up 9.6% year over year and 1.5% sequentially. This was the company’s 2nd-highest quarterly deployment level, below the 14.2 GWh recorded in Q4 2025. Despite that volume growth, energy revenue declined to $2.881 billion from $3.415 billion a year earlier and $3.139 billion in Q2.
The shareholder update provides an important explanation that is not apparent from the headline results: energy revenue was reduced partly by tariff-related customer refunds. Simultaneously, Taneja attributed the increase in energy gross margin to tariff refunds recognized by Tesla and warranty true-downs associated with vendor reimbursement of cell-related costs. Tariff effects therefore operated on both revenue and costs. A simple adjustment that subtracts a headline benefit from gross profit without addressing customer refunds would not produce a reliable normalized margin.
Reported energy gross margin increased from 20.4% to 33.1% sequentially, while gross profit increased from $640 million to $954 million. However, gross profit remained 11.1% below the prior-year $1.073 billion. The recovery in margin percentage consequently did not restore prior-year gross-profit dollars.
The sequential comparison also began from a depressed base. On the July 22 Q2 call, management disclosed approximately $240 million of warranty expense related to vendor cell issues and explained that more than $200 million of Q1 tariff benefits had not repeated. Q3’s vendor reimbursement and warranty true-down commentary suggests that the underlying economic burden of some previously recognized costs was being reassessed. The exact amount and relationship to earlier charges were not disclosed, preventing a precise recurring-profit bridge.
A major change in tone occurred relative to Q2 guidance. In July, management discussed declining industrial-storage ASPs amid competition and indicated that long-term gross margins should normalize in the low-to-mid-20% range. In October, management described extreme data-center demand, anticipated improving ASPs, and expected further margin improvement. That is a favorable qualitative change in the commercial outlook. It is not a quantified replacement for the earlier normalized-margin framework.
The distinction is financially material. At Q3 revenue, a 25% energy gross margin would produce approximately $720 million of gross profit, around $234 million below the reported result. A 20% margin would imply approximately $576 million, around $378 million below reported gross profit. These are sensitivities, not estimates of the quarter’s actual adjustments. They demonstrate that energy normalization can materially change consolidated earnings when quarterly operating income is only $718 million.
Dividing reported energy revenue by deployed storage yields approximately $210 per kWh, compared with $273 a year earlier. The approximately 23% decline should not be interpreted as a like-for-like Megapack price decline. Segment revenue includes different products and services, deployment and revenue-recognition timing can differ, and tariff-related customer refunds affected revenue. The calculation nevertheless highlights the weak conversion of deployment volume into reported revenue.
The forward demand commentary was substantially stronger. Musk stated, “We’re actually almost sold out of all megapacks for 2027.” The written update reported record order intake and backlog, while the Texas Megafactory began production with planned annual capacity of 50 GWh. Together with listed capacity in California and Shanghai, the company has a considerably larger manufacturing opportunity than current deployments suggest. Installed capacity, however, is not equivalent to achieved throughput, customer acceptance, or revenue recognition.
The first shipments using internally produced LFP cells represent an important localization milestone. Domestic production can improve supply assurance, tariff exposure, and manufacturing integration. Yet the Nevada LFP operation’s stated 7 GWh capacity remains in early ramp and is modest relative to the broader storage manufacturing footprint. This should be valued as a developing capability, not as complete insulation from third-party cell costs or trade policy.
Energy storage offers a credible exposure to data-center power constraints, but the physical role should be defined accurately. Batteries can buffer load, improve reliability, support interconnection requirements, and shift available energy across time. They do not create net energy and cannot by themselves solve a sustained generation deficit. Long-term demand depends on integration with generation, transmission, customer utilization, and project economics.
SERVICES AND OTHER: SUBSTANTIAL PROFIT GROWTH WITHOUT PROVEN ROBOTAXI MATERIALITY
Services and other gross profit increased to $734 million from $648 million in Q2 and $366 million a year earlier. Gross margin reached a record 15.9%, compared with 14.1% sequentially and approximately 10.5% a year earlier. The doubling of gross profit on approximately 33% revenue growth demonstrates substantial operating improvement.
The written update attributed growth to charging, insurance, and parts sales. Supercharger connectors increased 14% year over year to 84,465, while the company’s customer-owned charging program expanded beyond 600 stalls. These businesses provide additional monetization of the installed vehicle base and can support margins without requiring equivalent growth in new-car deliveries.
Robotaxi is included in services and other, but the segment’s strong performance should not be credited primarily to autonomy. Management explicitly stated that Robotaxi would not yet materially affect near-term consolidated results. Moreover, charging, insurance, repairs, used vehicles, and autonomous transportation have different capital requirements and risk profiles. Insurance reserve development, used-car residual values, and charging utilization require separate assessment before assigning a uniform software-like valuation to the segment.
CASH FLOW: A STRONG SURPRISE, BUT NOT YET A SELF-FUNDING GROWTH MODEL
Operating cash flow was $6.263 billion, almost unchanged from $6.238 billion a year earlier and up from $4.697 billion in Q2. Capital expenditures were $4.732 billion, compared with $2.248 billion a year earlier and $5.789 billion sequentially. Free cash flow of $1.531 billion therefore improved substantially from Q2’s $1.092 billion outflow but declined 61.6% year over year.
The composition of operating cash flow is critical. Changes in operating assets and liabilities provided approximately $2.590 billion of cash, equivalent to 41% of reported operating cash flow. Accounts payable, accrued liabilities, and other liabilities contributed $3.991 billion, while deferred revenue contributed $1.255 billion. These sources were partly offset by receivables, inventory, and prepaid or other asset movements.
Operating cash flow before those working-capital movements was approximately $3.673 billion. That exceeded Q2’s approximately $3.294 billion but was below the approximately $4.155 billion recorded a year earlier. Approximately 76% of the sequential operating-cash-flow improvement came from the increase in the working-capital contribution. This does not make the cash generation artificial: supplier financing and customer prepayments are legitimate elements of the business model. It does make extrapolation less reliable.
Days payable outstanding increased from 58 to 66 sequentially. Total inventory also increased despite the decline in finished-vehicle inventory days. Those measures cover different populations: inventory includes raw materials, work in process, and products beyond finished passenger vehicles. Accordingly, the delivery-production gap should not be used as a substitute for the actual cash-flow statement when explaining inventory-related cash generation.
The free-cash-flow surprise was approximately evenly divided between spending and operations. Against Bloomberg’s estimates, capex was $3.218 billion lower. The consensus free-cash-flow and capex figures imply operating cash flow of approximately $2.960 billion, compared with the actual $6.263 billion. This arithmetic is indicative because consensus line items can reflect different contributing analyst populations. Nevertheless, it shows that the favorable result was not exclusively an earnings-quality improvement.
The reduction in full-year capex guidance is significant but still implies an acceleration in Q4 spending. Tesla spent $13.014 billion through September. Reaching approximately $20 billion would require roughly $6.986 billion in Q4, approximately 48% above Q3. If Q4 operating cash flow merely repeated Q3’s $6.263 billion, quarterly free cash flow would be approximately negative $723 million. Under that illustration, full-year free cash flow would remain positive at approximately $1.160 billion.
The new guidance is therefore compatible with positive full-year cash generation and a renewed quarterly outflow. It should not be interpreted as a commitment to consistently positive quarterly free cash flow. The call did not provide a formal full-year free-cash-flow target or a precise split between permanent capital efficiency and spending deferred into later periods.
Cash and short-term investments totaled $45.447 billion. Subtracting reported debt and finance leases produces approximately $35.924 billion of net cash and investments before other obligations. The balance sheet provides substantial capacity to fund development. However, trailing-12-month free cash flow declined to $3.303 billion from $6.834 billion a year earlier, while the investment agenda expanded. Liquidity strength and demonstrated investment returns remain separate questions.
The $30 billion borrowing capacity represents progress from Q2, when management was still describing efforts to secure facilities. The company does not plan to draw on the new facilities during 2026. Available borrowing capacity is not equivalent to cash already held, and the call did not disclose sufficient detail on pricing, maturities, covenants, or draw conditions. Funding long-lived semiconductor and robotics assets with shorter-term financing would create refinancing and duration risk if commercialization were delayed.
ROBOTAXI: DEMONSTRATED EXPANSION, BUT ECONOMIC SCALE REMAINS AHEAD
Robotaxi provided the most important prospective growth discussion, but the current operating base remains small relative to Tesla’s consolidated business. The shareholder update reported nearly 2 million cumulative unsupervised miles through quarter-end. Cybercab entered service in Austin on September 3. Management described an approximately 10-fold increase in the Austin Cybercab fleet since launch and an 8-fold sequential increase in cumulative unsupervised mileage.
Those figures demonstrate rapid expansion from a low base. They do not disclose active fleet size, paid miles, empty repositioning miles, revenue per ride, revenue per available vehicle-hour, or contribution profit. Cumulative mileage also differs from the current weekly mileage run rate. Exponential growth in a cumulative metric should not be directly translated into an identical growth rate in quarterly revenue.
Emmanuel Rosner asked how many miles would be required to generate gross profit. Management did not provide a breakeven mileage threshold. Musk instead said, “It’s not going to move the needle this quarter,” and indicated that the business could become noticeable around Q2 2027 and potentially significant in Q3 or Q4. This establishes a timing aspiration, not a quantified revenue or profit forecast.
Scale arithmetic illustrates the gap. Even 10 million cumulative miles would correspond to only $10 million of gross fare revenue at an assumed $1 per paid mile, before considering unpaid mileage or the fact that the measure is cumulative rather than quarterly. A $1 billion annual revenue business at that price would require 1 billion paid miles annually. At an assumed 100 paid miles per vehicle per day, approximately 27,400 continuously operating vehicles would be required. Those are illustrative operating assumptions, not current Tesla metrics.
The manufacturing opportunity is potentially significant. The shareholder update listed Cybercab capacity above 125,000 vehicles annually, and Moravy said the line’s ultimate capability was substantially higher. He also described approximately 50% fewer parts than previous Tesla vehicles. Fewer components and an integrated vehicle-service design could reduce manufacturing complexity and cost. However, burst production tests do not establish sustained yield, uptime, supplier readiness, or realized unit cost.
Management’s statement that production is currently being matched to Robotaxi service requirements is particularly revealing. It suggests that deployment readiness, software capability, and operational infrastructure may constrain fleet growth before vehicle assembly does. The claim that software can scale to millions of vehicles over several months should not be interpreted as a manufacturing forecast for millions of new Cybercabs.
The $0.30 cost-per-mile goal remains unachieved. Taneja stated, “Are we at our goal of $0.30 today? No. But do we see a path to get to that? Yes, we do.” The disclosure did not establish whether the target comprehensively includes depreciation, insurance, remote assistance, cleaning, charging infrastructure, repairs, customer support, and empty miles, or precisely how the denominator is defined. Until those definitions are available, the target cannot support a dependable margin forecast.
Tesla’s manufacturing integration and elimination of an onboard driver could provide structural advantages. However, removing the driver does not eliminate the rest of the transportation cost base. High utilization requires charging, cleaning, maintenance, reliable pickup and drop-off execution, balanced geographic demand, and sufficient ride density. Lower prices can accelerate demand and improve utilization, but can also transfer productivity gains to customers rather than shareholders.
The predominance of Tesla-owned Cybercabs also makes the strategy more capital-intensive than a pure software platform. Musk stated that “the vast majority of the Cybercab stuff will be essentially Tesla owned and transport as a service.” Tesla therefore retains exposure to fleet financing, depreciation, residual values, utilization, and operating liability. The potential reward is greater control of the customer experience and a larger share of lifetime vehicle economics.
The regulatory discussion was less definitive than the question implied. The question concerning expansion outside Texas referred to NHTSA review, but the answer focused primarily on technical portability and the planned Dallas launch. The call did not provide a jurisdiction-by-jurisdiction approval framework, detailed federal compliance pathway, or quantified limits on deployment.
Software remains a current constraint as well. Elluswamy explicitly stated, “It’s not purely regulatory or something like that. It is technology-driven.” Expansion into longer operating hours, higher-speed roads, more weather conditions, and broader geographic coverage remained work in progress. Management hopes those constraints will increasingly become regulatory rather than technical during Q1 or Q2 2027. That transition is an objective, not an accomplished milestone.
Safety assertions require exposure-adjusted evidence. The call’s objective of avoiding injuries does not establish statistically demonstrated superiority across all operating conditions. Comparisons require consistent definitions of incidents, reporting completeness, mileage exposure, geography, time of day, road type, and operating restrictions. Successful operation in a constrained environment is commercially important, but does not automatically validate unrestricted deployment.
CUSTOMER AUTONOMY AND EUROPEAN APPROVALS
Tesla expects some customer-owned Model Y vehicles to enter the Robotaxi fleet around Q2 2027, subject to geofencing and Tesla’s fleet-management infrastructure. This is narrower than unrestricted unsupervised driving for all customer vehicles. Geographic eligibility, hardware compatibility, maintenance condition, insurance, owner compensation, and liability allocation remain material unresolved economic variables.
The company is also targeting limited customer Cybercab deliveries by the end of 2026. That timing is not necessarily inconsistent with the Q2 2027 customer-vehicle network milestone because the products, operating environments, and ownership arrangements may differ. Nevertheless, the call did not clearly reconcile the practical rights and operating restrictions attached to early external Cybercab ownership.
European FSD availability expanded to 9 EU countries, with 4 approvals added since Q2. The shareholder update reported more than 100,000 European customers and over 160 million kilometers of use. Musk suggested EU-wide approval could arrive within months and expressed surprise if it extended beyond Q1 2027, while acknowledging that Tesla does not control the process. This should be treated as a probabilistic catalyst rather than a committed delivery date.
Broader approval could improve both vehicle demand and software monetization. However, management also described incentives intended to increase European fleet penetration before approval. That creates a timing trade-off between upfront vehicle economics and future software opportunity. The incremental value depends on eventual paid adoption, not merely the number of vehicles delivered ahead of authorization.
OPTIMUS: INDUSTRIAL POTENTIAL WITH A MORE EXPLICIT DEVELOPMENT BURDEN
The Optimus discussion was notable for the specificity of the remaining problems. Musk acknowledged that “there’s still quite a lot of work to do with regard to the AI and the robot for it to be truly useful for open-ended tasks.” The unresolved issues span software architecture, training data, hand dexterity, sensor durability, mechanical wear, onboard compute, and supply-chain readiness.
Early production has begun in Fremont, with much of a production line designed for approximately 1 million annual units installed. Management expects at least approximately 1 year, potentially longer, to approach that annualized rate. Installed equipment designed for 1 million units should not be treated as achieved capacity, and an exit production rate of approximately 20,000 units per week would not imply 1 million actual deliveries during the preceding year.
The data strategy also differs fundamentally from Tesla’s vehicle advantage. FSD can learn from a large customer-owned fleet that already performs economically useful work. Optimus must create its own embodied training base. Management discussed producing approximately 10,000 to 20,000 robots for practice and reinforcement-learning activity. Those robots initially function as development infrastructure rather than external revenue-generating products.
Changing hardware during training introduces additional complexity. Improvements to hands, sensors, actuators, and compute can require policy adaptation and renewed validation. Simulation can accelerate learning, but real-world contact dynamics, object diversity, wear, and reliability remain important. The call’s description of parallel progress across manufacturing, hardware, and software is consistent with an aggressive development program, not with a fully validated commercial platform.
AI5 integration is targeted around April 2027. This is earlier and more specific than the Q2 discussion of approximately mid-2027 volume availability, although both were qualified expectations. Management described roughly an order-of-magnitude improvement in compute capability. More compute can expand model capacity and control sophistication, but does not independently solve mechanical reliability, data quality, energy consumption, or safe interaction.
The most actionable commercialization guidance was external delivery toward the end of 2027, initially for industrial applications involving dangerous, repetitive, or undesirable tasks. This is a more credible initial market than unconstrained household use because task definitions, environments, and willingness to pay can be more clearly established. Even so, customers will evaluate productive hours, successful task completion, supervision requirements, repair frequency, and liability, not simply purchase price.
No sufficiently specific unit-cost disclosure was provided. Taneja said costs were trending toward where Cybercab costs might ultimately settle, but neither endpoint was quantified. That comparison does not support a defensible Optimus gross-margin forecast. Customer economics must incorporate uptime and labor substitution actually achieved rather than assuming that theoretical 24-hour availability equals 24 productive hours.
The Texas Optimus factory is already under construction before the product’s design and commercial performance are fully settled. This can shorten the path to scale if development succeeds, but increases exposure to tooling changes, idle capacity, and rework if it does not. Optimus therefore remains a valuable but highly uncertain option rather than a dependable 2027 earnings contributor.
TERAFAB, CAPITAL ALLOCATION, AND SPACEX
Terafab introduced the largest incremental capital-allocation concern. Musk described investment “in the tens of billions” and said it would “probably be north of $100 billion long term.” He also stated that the allocation between Tesla and SpaceX remained to be determined. Those figures describe the project’s potential scale, not a disclosed contractual spending obligation borne entirely by Tesla.
The milestones also require careful interpretation. Equipment commissioning at the Austin research facility is expected in the 1st half of 2027, with an initial test chip targeted around May or June. The opening remarks referenced useful volume around Q3 2028, while the subsequent answer characterized real production as late 2028. An analyst’s reference to Q2 2028 should not supersede management’s actual wording. The appropriate interpretation is an ambitious late-2028 commercialization objective with considerable uncertainty.
Producing an initial test chip demonstrates a fundamentally different capability from producing economically competitive chips at commercial yield. The investment case requires evidence on process technology, defect density, yields, wafer throughput, packaging reliability, memory integration, power efficiency, and cost. None of those operating metrics was quantified.
The strategic rationale is understandable. Tesla wants to reduce semiconductor constraints across vehicles, robots, and compute infrastructure. However, logic manufacturing, memory production, advanced packaging, and chip design require distinct capabilities. Integrating them can improve coordination while simultaneously increasing organizational complexity and capital exposure.
The semiconductor timeline also means Terafab cannot be assumed to supply the initial late-2027 Optimus commercialization wave. Earlier deployments must rely on external manufacturing arrangements or other existing supply paths. Terafab therefore represents a later-stage scaling strategy rather than a demonstrated solution to the next year’s hardware requirements.
Capital allocation is becoming increasingly central to the equity thesis. Q3 capex and R&D together totaled approximately $7.493 billion, equivalent to 26.7% of revenue. These expenditures are accounted for differently and should not be combined into an earnings adjustment, but they illustrate the breadth of the investment program. Vehicles, Robotaxi fleets, robotics factories, energy storage, solar, compute, battery materials, and semiconductor manufacturing are competing for capital and management attention.
The potential SpaceX transaction adds governance uncertainty. Tesla declined to provide substantive merger discussion on the call. No exchange ratio, valuation, financing structure, minority-shareholder protection, or definitive agreement was disclosed. Potential operational synergies should therefore not be assigned a precise value. Semiconductor cost sharing, intellectual-property ownership, related-party arrangements, and capital commitments would require particular scrutiny in any transaction.
GUIDANCE CHANGES AND THE FORWARD CATALYST CALENDAR
The clearest financial revision was the reduction in 2026 capex from more than $25 billion on the July 22 call to approximately $20 billion. This is a reduction exceeding approximately $5 billion relative to the earlier threshold. The company has not withdrawn its expectation of increasing investment over subsequent years. The revision improves the near-term cash outlook while leaving open whether spending was avoided, optimized, or shifted.
Operating-expense guidance was effectively reiterated: development costs are expected to continue rising. Energy commentary became more constructive on pricing and future margins, but no new numerical normalized-margin target replaced Q2’s low-to-mid-20% framework. The 5 million vehicle objective for approximately 2030 remains an ambition rather than detailed annual volume guidance. No numerical Q4 revenue, EPS, consolidated operating-margin, or full-year free-cash-flow guidance was provided.
Near-term catalysts include the planned Dallas Cybercab launch in November, additional market expansion, broader operating hours and road coverage, limited external Cybercab deliveries by year-end, and an Optimus demonstration potentially within approximately 1 to 2 months. The planned expansion to 400 MW of training compute by year-end is another infrastructure milestone, although installed compute should not be confused with demonstrated improvements in commercial model performance.
The 2027 calendar contains the more consequential valuation tests: potential EU-wide supervised FSD approval by Q1; AI5 integration into Optimus around April; initial customer-owned Robotaxi participation around Q2; a financially noticeable Robotaxi contribution beginning around Q2; potentially greater Robotaxi materiality in Q3 or Q4; and initial external Optimus deliveries toward year-end. Research-fab commissioning and test-chip production provide additional technical milestones but remain several stages removed from commercial semiconductor economics.
INVESTMENT IMPLICATIONS AND SCENARIO FRAMEWORK
The quarter strengthens the case for Tesla as a differentiated automotive and energy platform with an expanding recurring-software business. It does not yet establish that autonomy and robotics can support the level of investment now contemplated. The key distinction is between technological progress, commercial adoption, and returns on invested capital. Q3 provided evidence of the first 2 in selected businesses, but limited evidence of the 3rd across the newer initiatives.
The strongest near-term investment evidence is the improvement in credit-excluded automotive profitability, rapid growth in the recurring FSD customer base, and services gross-profit expansion. These developments can improve earnings without requiring immediate success in general-purpose robotics or advanced semiconductor manufacturing. They should receive greater weight than unsupported extrapolations of future transportation market share.
The principal counterweight is that gross-profit improvement is being consumed by development spending while capital expenditure continues to outpace the current recurring cash-earnings base. Energy adjustments and working-capital inflows complicate the headline recovery. A durable rerating requires evidence that recurring gross profit can grow faster than both operating costs and the capital needed to sustain the strategy.
An illustrative 2027 base case, assigned a 50% probability, assumes consolidated revenue of $115 billion to $125 billion and operating margins of 4% to 6%, implying operating income of approximately $4.6 billion to $7.5 billion. This scenario assumes continued FSD subscription growth, automotive margins broadly around current levels, energy margins below the unusually favorable Q3 result, and a growing but still limited Robotaxi contribution. Optimus remains primarily an investment activity. These are analytical underwriting assumptions, not management guidance or consensus estimates.
An illustrative bull case, assigned a 25% probability, assumes revenue of $130 billion to $145 billion and operating margins of 8% to 10%, implying approximately $10.4 billion to $14.5 billion of operating income. This requires stronger vehicle production, sustained software retention, improved energy pricing and throughput, and commercially meaningful Robotaxi scaling during the 2nd half of 2027. The critical evidence would be disclosed paid-mile economics and recurring profit growth that exceeds the increase in development spending.
An illustrative bear case, assigned a 25% probability, assumes revenue of $95 billion to $110 billion and operating margins of 0% to 2%, implying operating income between breakeven and approximately $2.2 billion. This scenario combines renewed automotive pricing pressure, weaker subscription retention, energy margins reverting toward the earlier normalized range, and continued development spending despite commercialization delays. Elevated capex would then create a material financing requirement even with substantial starting liquidity.
Confidence in these scenarios is limited because Robotaxi economics, FSD churn, Optimus costs, and Tesla’s share of semiconductor investment are not sufficiently disclosed. A defensible stock-price target or probability-weighted equity return cannot be derived from the call alone without a verified contemporaneous valuation and explicit assumptions for dilution, discount rates, and capital allocation. Operating scenarios should not be presented as precise equity-value forecasts.
The appropriate portfolio implication is limited rather than concentrated exposure. An illustrative 0.5% to 1.0% NAV position is more consistent with the current evidence than a core allocation based on unproven robotics or transportation profit pools. At 1.0% NAV, a 20% adverse price move represents approximately 20 basis points of portfolio loss before gaps and execution costs. A 20% price-based risk limit can serve as a maximum-loss discipline, but thesis deterioration should trigger reassessment earlier.
The relevant underwriting horizon is approximately 12 to 18 months, covering the transition from current FSD monetization to the promised 2027 Robotaxi contribution. Exit or material reduction triggers include sustained deterioration in automotive margins despite favorable mix, recurring FSD growth failing to convert into revenue, negative free cash flow driven by spending without corresponding commercial milestones, or a material increase in capital commitments before project-level economics become visible.
Portfolio diversification should not be inferred solely from Tesla’s presence in several end markets. Automotive demand remains exposed to consumer financing conditions; energy growth increasingly depends on data-center investment; autonomy and robotics depend on AI capability and compute availability; and the expanded capital program increases sensitivity to financing conditions. A portfolio already concentrated in AI infrastructure, long-duration growth, or capital-intensive technology could gain more correlated risk than the business labels imply.
The final investment conclusion is balanced but demanding. Q3 reduced concern about immediate automotive profitability and liquidity, while strengthening the evidence for FSD monetization. It did not resolve the central valuation question: whether the recurring profits generated by vehicles, software, energy, and transportation will justify the capital committed to the next phase. The strongest basis for a more constructive stance would be retained subscription revenue, repeatable margins excluding discrete adjustments, disclosed Robotaxi contribution economics, and commercialization that improves cash generation rather than merely expanding capacity.
SOURCE BASIS AND LIMITATIONS
Financial comparisons use Tesla’s Q3 2026 shareholder update, the October 21 earnings-call transcript, and the accompanying Bloomberg earnings notice. Consensus comparisons consistently use the supplied Bloomberg figures. Prior-guidance comparisons use the July 22 Q2 2026 earnings-call transcript. Current financial statements are unaudited. Management’s competitive claims, production targets, regulatory expectations, and commercialization timelines are forward-looking assertions rather than independently established outcomes. Normalization sensitivities and 2027 scenarios are explicitly analytical assumptions.
COMPANY EMPLOYEES ON THE CALL
• Elon Musk, Chief Executive Officer • Vaibhav Taneja, Chief Financial Officer • Ashok Elluswamy, Vice President, AI Software • Lars Moravy, Vice President of Vehicle Engineering • Travis Axelrod, Head of Investor Relations
RESEARCH ANALYSTS ON THE CALL
• Alexander Perry, Bank of America • Andrew Percoco, Morgan Stanley • Colin Rusch, Oppenheimer • Edison Yu, Deutsche Bank • Emmanuel Rosner, Wolfe Research • Pierre Ferragu, New Street Research • Tom Narayan, RBC Capital Markets
Key Read-Throughs
KEY READ-THROUGHS FROM TESLA’S Q3 2026 EARNINGS CALL
Tesla’s October 21 call provides its strongest cross-market signals in battery supply, electrical infrastructure, semiconductor equipment, and autonomous transportation. The central distinction is between growing demand for enabling infrastructure and still-unproven returns from the businesses consuming that infrastructure. Battery suppliers and electrical-equipment manufacturers can monetize deployment before Tesla establishes attractive Robotaxi or robotics economics. Conversely, transportation platforms and competing vehicle manufacturers face increasing competitive pressure, but the call does not support immediate, industry-wide earnings reductions. The most actionable conclusions concern specific revenue opportunities, competitive mechanisms, and commercialization schedules, rather than extrapolations of Tesla’s market-share ambitions. Impact assessments below distinguish segment exposure from consolidated earnings; they are not stock-price forecasts.
ENERGY STORAGE AND BATTERY SUPPLY
U.S.-MANUFACTURED LFP CELLS HAVE A CLEARER REVENUE PATH THAN MANY DOWNSTREAM AI APPLICATIONS (READ-THROUGH 1)
Affected company: LG Energy Solution (373220: South Korea). Direction: Positive. Magnitude: Meaningful for its U.S. stationary-storage business; moderate at the consolidated level. Confidence: High in the demand linkage, with production-ramp execution remaining the principal uncertainty.
Supporting evidence: Musk stated, “We’re actually almost sold out of all megapacks for 2027,” while Taneja described “extreme demand from data centers.” Tesla also began delivering Megapacks containing internally manufactured LFP cells. The accompanying update lists 7 GWh of Nevada LFP capacity in early ramp and 50 GWh of planned annual capacity at the Texas Megafactory.
The transmission mechanism is unusually direct. LG Energy Solution has separately confirmed a $4.3 billion agreement to supply Tesla with stationary-storage LFP prismatic cells through dedicated production lines in Lansing, with production scheduled across 2027–2030. Tesla’s backlog commentary strengthens the demand underpinning that existing agreement. Higher cell shipments improve factory utilization, spread fixed costs across more production, and increase the economic value of manufacturing assets originally developed around automotive demand. The $4.3 billion is a multiyear supply agreement, not an incremental order announced on this call and not simply the construction cost of a new factory.
Tesla’s cell insourcing does not invalidate this read-through. Even at stated capacity, its 7 GWh Nevada operation would equal only 14% of the Texas Megafactory’s planned 50 GWh capacity, before considering Tesla’s other storage factories. Those figures are capacity comparisons, not production forecasts, but they demonstrate why internal manufacturing and external procurement can expand simultaneously.
The near-term catalyst is stronger confidence in contracted storage demand and the Lansing ramp, rather than immediate Q4 revenue recognition. The larger earnings transmission occurs from 2027 as qualified production converts into deliveries. The geographic implication is selective: U.S.-based LFP manufacturing has a clearer route to Tesla’s domestic expansion than an undifferentiated basket of global battery capacity. The investment case depends on production yield, customer qualification, and delivery schedules, not merely announced factory capacity.
STORAGE DEMAND IS STRENGTHENING, BUT TESLA’S 33.1% MARGIN IS NOT A VALID PEER BENCHMARK (READ-THROUGH 2)
Affected company: Fluence Energy (FLNC: United States). Direction: Positive for revenue opportunity; negative for any valuation argument that mechanically extrapolates Tesla’s reported storage margin. Magnitude: Moderate potential revenue benefit because storage is Fluence’s core business; no defensible margin uplift from this evidence alone. Confidence: High in the demand signal and the accounting distinction.
Supporting evidence: Tesla deployed 13.7 GWh of storage, reported record storage order intake, and described its 2027 Megapack availability as almost fully committed. However, energy revenue declined 16% year over year, while gross margin increased from 20.4% to 33.1%. Taneja attributed the sequential margin improvement primarily to tariff refunds and warranty true-downs associated with vendor reimbursement. The written update also identified tariff-related customer refunds as a revenue headwind.
Fluence directly addresses the same growing demand for utility-scale storage and data-center power management. Customers facing deployment deadlines have an incentive to qualify alternative suppliers when a major incumbent’s delivery schedule is heavily committed. This expands the opportunity for suppliers with available manufacturing capacity, acceptable warranties, and bankable delivery commitments. Fluence’s existing data-center storage offering makes this a relevant commercial exposure rather than a generic clean-energy association.
The negative implication concerns profitability assumptions. Tesla’s margin expansion does not establish that industry pricing increased sufficiently to support comparable peer margins. Refunds and warranty reimbursements are company-specific, while customer refunds complicate the revenue denominator. Applying 33.1% to Fluence would confuse an accounting outcome with a market-clearing economic return.
Tesla’s new Texas capacity also means that near-term supply tightness should not be treated as permanent scarcity. Additional capacity can expand the market while limiting future pricing power. Fluence must convert the demand opportunity into profitable orders rather than simply maximize backlog.
The near-term trading catalyst is stronger confidence in storage bookings, especially data-center-related awards. The fundamental catalyst is delivery conversion over the next 12–24 months. The disciplined conclusion is positive on addressable demand, but not a blanket upgrade to normalized storage margins or evidence that every integrator will gain share.
ELECTRICAL INFRASTRUCTURE AND POWER GENERATION
THE CLEANEST AI-POWER BENEFICIARIES SELL THE ELECTRICAL SYSTEM AROUND THE BATTERY (READ-THROUGH 3)
Affected companies: Eaton (ETN: Ireland), Schneider Electric (SU: France), and Siemens Energy (ENR: Germany). Direction: Positive. Magnitude: Moderate for relevant electrical-infrastructure and power-generation businesses; modest incremental consolidated impact from Tesla’s disclosures alone. Confidence: High in the physical demand mechanism, without assuming specific Tesla contract awards.
Supporting evidence: Tesla described exceptional data-center demand for Megapack, almost fully committed 2027 availability, and continued investment in manufacturing and compute infrastructure. The accompanying update targets 400 MW of training compute by year-end and identifies grid constraints and power availability as drivers of storage demand.
Battery installations require electrical protection, switching, distribution, controls, and integration with the customer’s wider power system. Eaton and Schneider participate in those equipment and control categories. Their opportunity does not depend on a particular battery supplier winning every storage project. A broader build-out of storage-equipped data centers and industrial facilities increases demand for the surrounding electrical infrastructure.
Siemens Energy has an additional exposure through on-site generation and grid equipment. Its disclosed collaboration with Eaton combines generation, electrical infrastructure, and battery storage in modular data-center designs. That commercial architecture illustrates why storage and dispatchable generation can be complementary rather than mutually exclusive.
The important technical distinction is that batteries can buffer demand, improve reliability, and shift available energy across time, but cannot provide sustained net generation. Rapid storage deployment therefore does not eliminate the need for generation or grid investment. It can make a broader power system more usable and accelerate the commissioning of assets that would otherwise be constrained.
The near-term impact is corroboration of an existing order-cycle thesis, not a newly disclosed Tesla purchase order for these companies. The longer-duration benefit is increased electrical content per facility and demand across multiple customers over 2027–2029. The cross-portfolio attraction is lower dependence on which autonomy, robotics, or AI application ultimately achieves the highest return on invested capital. Equipment demand can arrive before those downstream returns are proven.
AUTONOMOUS TRANSPORTATION AND MOBILITY PLATFORMS
TESLA’S OWNED-FLEET MODEL IS A DISINTERMEDIATION THREAT, NOT AUTOMATICALLY NEW SUPPLY FOR RIDESHARE PLATFORMS (READ-THROUGH 4)
Affected companies: Lyft (LYFT: United States), Uber Technologies (UBER: United States), and Alphabet (GOOGL: United States), through Waymo. Direction: Negative competitive read-through. Magnitude: Potentially meaningful for Lyft, moderate for Uber’s mobility economics, and meaningful for Waymo’s standalone economics but small for Alphabet’s near-term consolidated earnings. Confidence: High in the competitive mechanism; the eventual scale remains uncertain.
Supporting evidence: Musk stated that “the vast majority of the Cybercab stuff will be essentially Tesla owned and transport as a service.” Tesla described rapid Austin fleet expansion, a planned Dallas launch in November, and a prospective Robotaxi financial contribution becoming noticeable around Q2 2027 and more significant later in 2027. Asked about pricing below competing transportation services, management emphasized the absence of an onboard driver and Tesla’s manufacturing integration.
The transmission mechanism is direct competition for customer demand. If Tesla owns the vehicles, controls dispatch, and maintains the customer relationship, its autonomous fleet does not automatically become supply available through Uber or Lyft. In overlapping markets, the platforms may face lower ride conversion, greater promotional spending, or pressure on the margin retained per trip. Competitive effects can begin before Tesla achieves nationwide scale because ride-hailing economics are locally concentrated.
Lyft’s less diversified business mix makes pressure on mobility economics relatively more consequential. Uber has a broader business portfolio and autonomous-vehicle partnerships, but those defenses do not guarantee access to Tesla’s fleet or preserve existing economics in every market. Lyft also has a substantive defense through its Waymo relationship and Flexdrive fleet-management capabilities. The risk is therefore not that either company lacks an autonomy strategy; it is that Tesla’s integrated model could capture both fleet economics and customer distribution.
Waymo faces a different transmission mechanism. A manufacturing-integrated competitor can pressure fares, accelerate geographic investment requirements, and raise the fleet utilization needed to earn attractive returns. This is a competitive risk to Waymo, not evidence that Tesla has established superior safety, broader operating capability, or lower fully allocated costs.
The immediate trading catalysts are Dallas deployment, fleet density, waiting times, and expanded operating hours. The more important fundamental period begins in 2027. Taneja explicitly acknowledged that Tesla has not reached its $0.30 cost-per-mile target, and Elluswamy said remaining constraints are still partly technological. These qualifications argue against immediate, large consolidated earnings reductions for competitors, while preserving a credible longer-term threat to pricing and distribution economics.
SEMICONDUCTOR EQUIPMENT
TERAFAB’S MOST DEFENSIBLE BENEFICIARIES ARE EQUIPMENT SUPPLIERS, NOT ASSUMED OWNERS OF ITS FUTURE ECONOMIC VALUE (READ-THROUGH 5)
Affected companies: Applied Materials (AMAT: United States), Lam Research (LRCX: United States), KLA (KLAC: United States), and ASML (ASML: Netherlands). Direction: Positive for addressable equipment demand. Magnitude: Potentially moderate across the multiyear project; currently low visibility into company-specific incremental earnings. Confidence: High at the equipment-category level, with individual awards and revenue allocation unconfirmed.
Supporting evidence: Musk described Terafab capital requirements as “in the tens of billions” through early 2028 and said spending would “probably be north of $100 billion long term.” Taneja stated that most orders for the initial research-fab equipment had already been placed. Equipment commissioning is expected during the 1st half of 2027, with an initial test chip around May or June and real production targeted for late 2028.
A semiconductor facility requires deposition, etch, lithography, inspection, metrology, and other process equipment before it can demonstrate competitive manufacturing economics. Applied Materials, Lam Research, KLA, and ASML participate in these essential categories. Their opportunity can therefore precede Tesla’s achievement of commercial yields or attractive chip costs.
The sequencing is the key value-add insight. Equipment vendors can recognize revenue as contractual delivery and acceptance conditions are satisfied, while the fab owner continues to bear utilization, yield, process-development, and financing risk. Suppliers are not immune to cancellations or delayed acceptance, but their commercial exposure is fundamentally different from underwriting the eventual profitability of the entire fab.
The headline investment figures should not be multiplied by assumed vendor shares. Total project spending includes buildings, utilities, infrastructure, and other costs. The call did not disclose the process mix, technology-node allocation, equipment bill of materials, or supplier-level awards. It also distinguished initial research-fab orders from the much larger prospective production build-out.
The near-term catalyst is supplier confirmation of orders or shipment schedules. The more meaningful revenue opportunity extends through 2027–2028 and beyond. This is a positive industry-demand signal, but not sufficient evidence for assigning a specific earnings increment to each named vendor or treating the full long-term spending aspiration as committed backlog.
FOUNDRIES AND CUSTOM SILICON
TESLA’S 2027 CHIP REQUIREMENTS STILL DEPEND ON EXTERNAL MANUFACTURING (READ-THROUGH 6)
Affected companies: Taiwan Semiconductor Manufacturing Company (2330: Taiwan) and Samsung Electronics (005930: South Korea). Direction: Positive for continuity of external manufacturing demand and a counterweight to premature disintermediation concerns. Magnitude: Modest for TSMC’s consolidated earnings; potentially more meaningful for Samsung’s relevant foundry programs than for Samsung overall. Confidence: High in the timing mismatch between chip demand and internal-fab readiness.
Supporting evidence: Tesla targets AI5 integration into Optimus around April 2027, with substantially greater compute capability than AI4. By contrast, the Austin research fab is initially expected to establish whether it can produce a test chip around May or June 2027, with real semiconductor production discussed for late 2028.
The chronology prevents Terafab from being treated as a demonstrated replacement for external foundries supplying the initial 2027 product wave. A research test chip is not equivalent to qualified, high-yield commercial output. Tesla’s vehicle and robotics requirements therefore continue to rely on established manufacturing arrangements during the intervening period.
TSMC and Samsung have disclosed or publicly identified roles in Tesla’s custom-silicon supply chain. Samsung’s previously announced $16.5 billion agreement extending through 2033 also demonstrates that Tesla’s manufacturing strategy has included substantial external commitments. This quarter’s call did not disclose cancellation of those arrangements or a replacement sourcing allocation.
For TSMC, the implication is primarily preservation and potential expansion of customer demand, not a transformational consolidated earnings event. For Samsung, successful Tesla production can contribute to foundry utilization and customer validation, although profitability still depends on pricing, yields, and execution.
The near-term catalyst is delivery against AI5 qualification and integration milestones. The fundamental window is 2027–2028, before Tesla’s own manufacturing capability could plausibly become commercially relevant. Longer-term insourcing remains a strategic risk, but the call provides no basis for treating it as an immediate reduction in external wafer demand. More broadly, customer-designed chips can shift value away from merchant chip designs while still supporting foundry revenue; chip design and chip manufacturing should not be conflated.
PASSENGER VEHICLES AND AUTOMOTIVE SOFTWARE
FSD MONETIZATION RAISES THE COMPETITIVE HURDLE FOR NON-TESLA EV MANUFACTURERS (READ-THROUGH 7)
Affected companies: Volkswagen (VOW3: Germany) and Hyundai Motor (005380: South Korea). Direction: Negative incremental competitive pressure. Magnitude: Moderate for overlapping EV products and software investment requirements; modest for near-term consolidated earnings. Confidence: High in the differentiation and monetization pressure, without assuming a specific market-share loss.
Supporting evidence: More than 75% of Tesla’s North American deliveries included paid FSD subscription enrollment, compared with approximately 55% in Q2. Management identified FSD as a major vehicle-demand driver. Tesla also reported Model Y as Europe’s leading BEV and South Korea’s leading passenger vehicle based on preliminary data, while describing the largest passenger-vehicle backlog in 4 years.
The transmission mechanism extends beyond competing on battery range or vehicle manufacturing cost. Strong paid software adoption gives Tesla a potential recurring contribution stream after the initial vehicle sale. If customers retain those subscriptions, Tesla can support customer acquisition, product development, or vehicle pricing with economics that a hardware-only competitor cannot replicate as readily.
Volkswagen faces this pressure across European EV segments where Model Y competes. Hyundai faces a particularly relevant domestic signal in South Korea, alongside competition in export markets. The strategic response can require greater software development spending, licensing payments, feature bundling, or vehicle discounts. Each route can constrain the improvement in EV returns that incumbent manufacturers are seeking.
The distinction between evidence and inference is important. High attachment among Tesla purchasers does not independently prove that FSD caused every incremental sale, and the call did not provide retention data sufficient to establish lifetime software profitability. Nor did it establish that competing driver-assistance systems cannot improve. The high-conviction conclusion is a higher competitive investment and differentiation hurdle, not inevitable share loss.
The near-term catalyst is broader European FSD availability, with management expressing hope for EU-wide approval by Q1 2027. The larger fundamental effect depends on continued paid retention and whether software materially influences purchase decisions across markets. This is not evidence of an industry-wide EV demand acceleration: Tesla’s own Q3 deliveries remained approximately 2% below the prior year.
COMMERCIAL VEHICLES
SEMI PRODUCTION MAKES TESLA A MORE CREDIBLE COMPETITOR IN SELECTED FLEET REPLACEMENT CYCLES (READ-THROUGH 8)
Affected companies: PACCAR (PCAR: United States) and Daimler Truck (DTG: Germany). Direction: Negative incremental competitive pressure, primarily in North American heavy-duty applications. Magnitude: Small near-term earnings impact; potentially moderate over several fleet purchasing cycles in suitable applications. Confidence: High that competitive intensity increases, but not that Tesla has established superior fleet economics.
Supporting evidence: Tesla stated that Semi production began during Q3 at its Nevada facility. The accompanying update lists 25,000 units of annual manufacturing capacity and describes a top variant capable of 500 miles at a full 82,000-pound gross combination weight, with claimed energy consumption of 1.7 kWh per mile.
Moving onto a dedicated production line makes Tesla more relevant to fleet procurement than a limited demonstration program. For suitable routes, fleet customers can compare vehicle purchase price, energy costs, maintenance, charging availability, payload, and uptime against incumbent products. A credible additional bidder can pressure pricing and increase product-development requirements even before it achieves a large market share.
PACCAR is exposed through its North American truck franchises, while Daimler Truck is exposed through Freightliner. The initial competitive mechanism is most credible in predictable, high-utilization operations with feasible depot charging. It is less immediate in applications where route variability, charging delays, payload constraints, or service coverage materially weaken electric-truck economics.
Incumbents are not standing still. Daimler Truck already manufactures battery-electric trucks, including its eActros products, and established manufacturers retain service networks, financing capabilities, and fleet relationships. Tesla’s stated range and efficiency should not be treated as independent proof of lower total cost of ownership. The 25,000-unit figure is manufacturing capacity, not a delivery forecast.
The near-term catalysts are actual production rates, customer acceptance, field uptime, and charging deployment. The fundamental effect is more likely to emerge over 2027–2030 than in the next quarterly earnings cycle. The call also does not establish commercially ready autonomous trucking; attributing immediate driver-cost elimination to Semi would overstate the evidence.
CROSS-PORTFOLIO CONCLUSION
The clearest positive exposure is to verified enabling infrastructure: LG Energy Solution’s contracted U.S. storage-cell supply, electrical equipment surrounding storage and compute facilities, and semiconductor manufacturing equipment. The clearest negative exposure is to businesses facing an increasingly integrated competitor, particularly ride-hailing distribution and selected vehicle categories. These are asymmetric read-throughs: suppliers can benefit before Tesla proves downstream profitability, while competitors can experience localized pricing pressure before Tesla reaches nationwide scale.
Several broader extrapolations do not clear the same evidence threshold. The reduction in Tesla’s 2026 capex guidance does not establish a broad AI-infrastructure spending downturn because no sufficiently detailed purchasing bridge was provided. Optimus’s installed production-line ambition does not justify assuming comparable supplier shipments or economy-wide labor substitution in 2027. Similarly, storage demand does not establish an industry-wide margin windfall, and Tesla’s product-level demand strength does not establish a generalized recovery in global automotive demand.
Report record
- Sector
- Consumer Discretionary
- Fiscal period end
- September 30, 2026
- Report date
- October 21, 2026
- Analysis
- 6793 words
- Read-throughs
- 3054 words
- Content fingerprint (PDF)
b7670e62a532- Content fingerprint (analysis)
99f5fb920647- Content fingerprint (read-throughs)
599b4951edfe
Prepared from the company's earnings release and earnings call transcript. Figures as reported by the company. For information only. Not investment advice.
More from Tesla, Inc.
No other reports yet.
More in Consumer Discretionary
No other reports yet.
All Consumer Discretionary reports
Follow @AtlasPeakRes on X for new earnings reports as they publish.