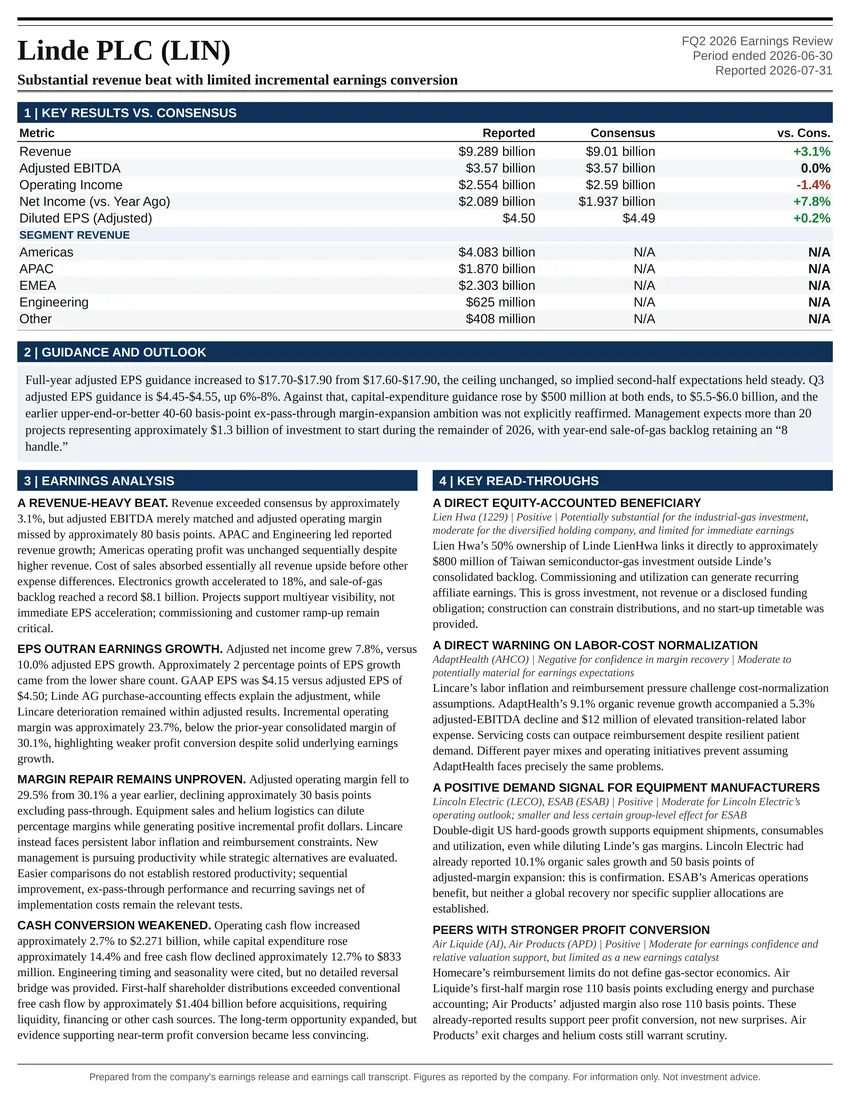
Substantial revenue beat with limited incremental earnings conversion
Earnings Reports
Air Products and Chemicals Inc FQ3 2026 Earnings Report
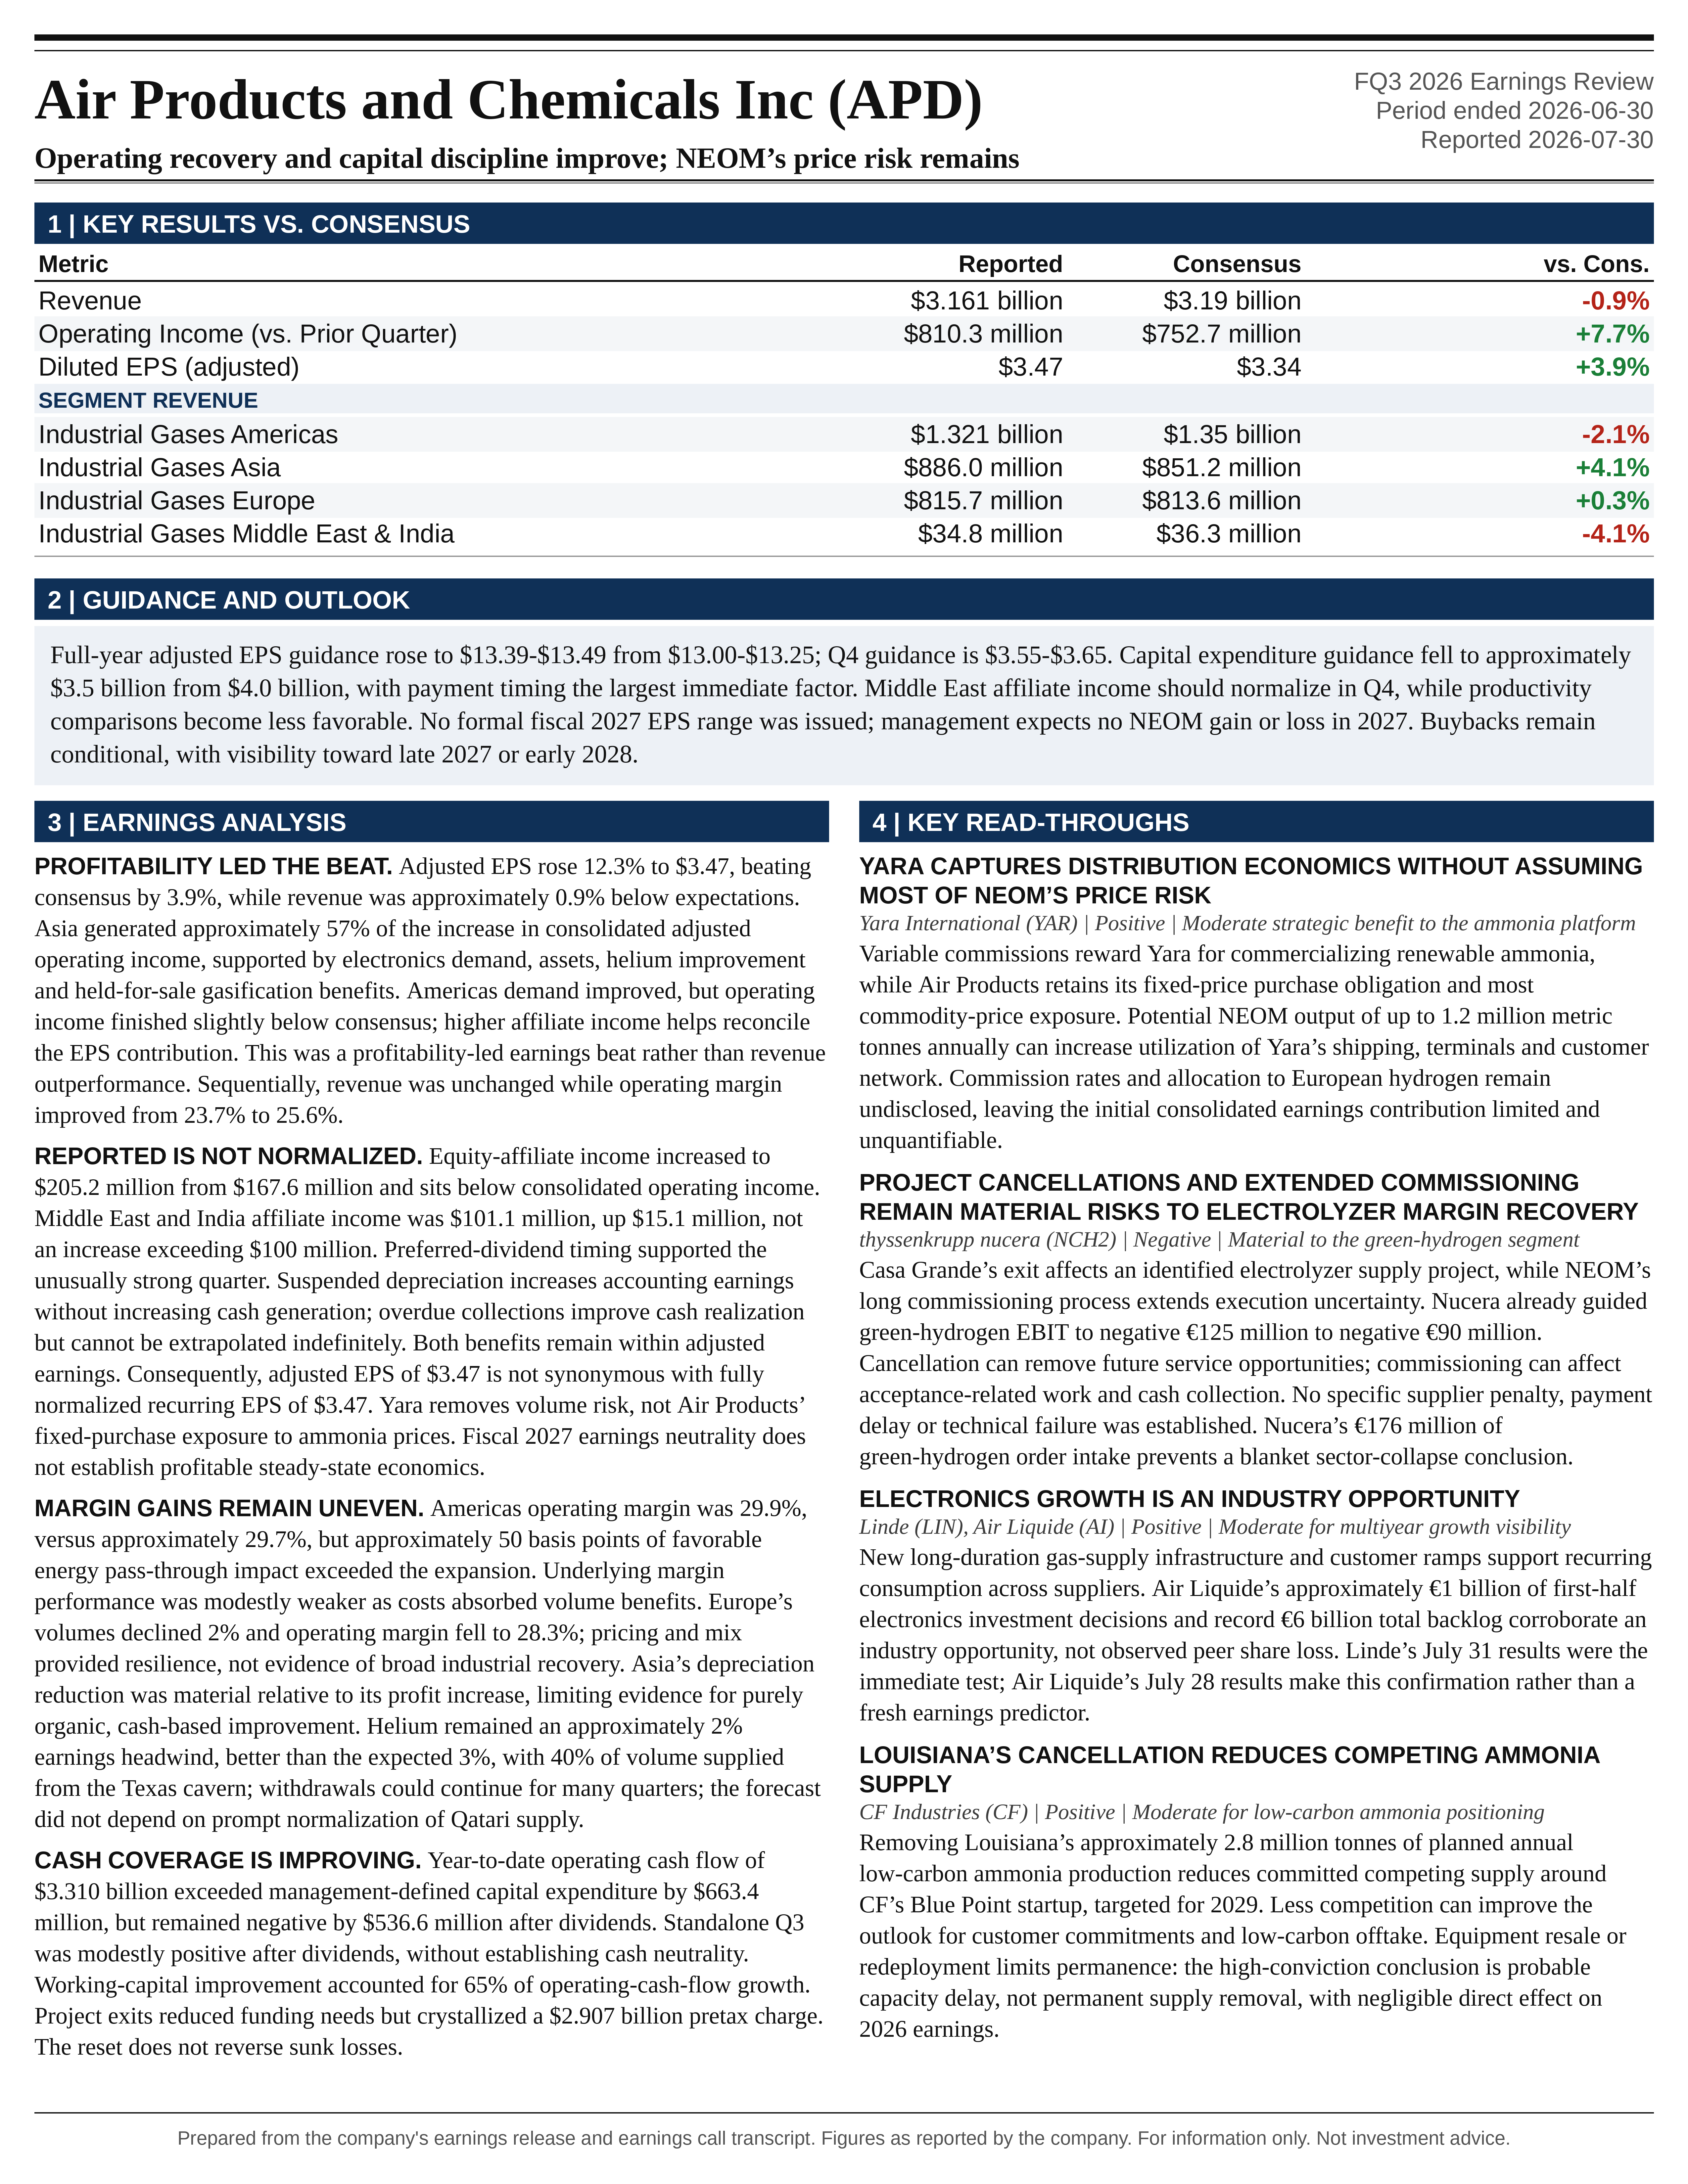
Air Products and Chemicals Inc (APD) FQ3 2026 earnings: Operating recovery and capital discipline improve; NEOM’s price risk remains. Full earnings analysis, key read-throughs, and the one-page exhibit from Atlas Peak Research.
Air Products and Chemicals Inc (APD)
Sector: Materials · FQ3 2026 · Period end June 30, 2026 · Reported July 30, 2026
Air Products’ fiscal Q3 2026 earnings call supports a constructive hold, with selective accumulation dependent on valuation rather than an unconditional re-rating of the business.
Download the one-page report (PDF)
View one-page exhibit
Download analysis (.md)
Download read-throughs (.md)
Post to X
One-Page Exhibit
Earnings Analysis
EXECUTIVE CALL SUMMARY: Air Products and Chemicals Inc. (07/30/26)
Air Products’ fiscal Q3 2026 earnings call supports a constructive hold, with selective accumulation dependent on valuation rather than an unconditional re-rating of the business. Operating execution improved, earnings guidance increased, and the withdrawal from several capital-intensive clean-energy projects materially reduced prospective funding requirements. However, reported earnings growth benefited from lower depreciation, collection of overdue amounts, favorable currency, and unusually strong equity-affiliate income. The Yara agreement substantially improves NEOM’s physical distribution arrangements but does not eliminate Air Products’ exposure to ammonia prices. The investment case is therefore strengthening through better capital allocation and industrial-gas execution, not through demonstrated resolution of every legacy project risk.
Adjusted EPS of $3.47 increased 12.3% from $3.09 and exceeded Bloomberg consensus of $3.34 by $0.13, or 3.9%. Adjusted operating income increased 9.3% to $810.3 million, with operating margin expanding to 25.6% from 24.5%. Revenue increased 4.6% to $3.161 billion but was approximately 0.9% below consensus. This was a profitability-led earnings beat rather than broad-based revenue outperformance. Asia generated approximately 57% of the increase in consolidated adjusted operating income, reflecting electronics demand, new assets, helium improvement, and benefits associated with gasification assets classified as held for sale.
Full-year adjusted EPS guidance increased to $13.39-$13.49 from $13.00-$13.25. The midpoint increased by $0.315, or 2.4%, to $13.44, approximately 1.6% above the pre-release consensus of $13.23. Q4 guidance of $3.55-$3.65 also exceeded consensus at the midpoint. Nevertheless, expected Q4 EPS growth of approximately 5%-8% represents a deceleration from Q3 and the 14% year-to-date increase. Management explicitly expects the unusually favorable Middle East affiliate contribution to normalize in Q4, while productivity comparisons become less favorable and macroeconomic assumptions remain cautious.
The most important strategic development was the distinction between eliminating volume risk and retaining price risk at NEOM. Eduardo Menezes stated, “you should see that as a way to eliminate the volume risk. We still retain the price risk.” The absence of an expected fiscal 2027 earnings impact provides near-term protection against a feared earnings drag, but it is not evidence of profitable steady-state economics. A lengthy commissioning period, confidential contractual provisions, and the timing of full offtake obligations remain central to interpreting that guidance.
Cash generation improved substantially, but the definition matters. Year-to-date operating cash flow of $3.310 billion exceeded management-defined capital expenditures of $2.646 billion by $663.4 million. After $1.200 billion of dividends, that measure remained negative by $536.6 million. The standalone Q3 calculation was modestly positive after dividends, indicating genuine progress without establishing that the company had already reached sustained annual cash neutrality. The reduction in fiscal 2026 capital expenditure guidance to approximately $3.5 billion from $4.0 billion is favorable, although management attributed much of the immediate reduction to payment timing rather than permanent cost elimination.
Financial comparisons below refer to adjusted continuing-operations results unless explicitly identified as GAAP. The earnings assessment reflects information available at the July 30 call, supplemented by the company’s current and prior earnings releases, the June project-exit announcement, and the December 2025 Air Products-Yara announcement. Consensus comparisons refer to the accompanying Bloomberg earnings notice.
QUARTERLY PERFORMANCE AND THE COMPOSITION OF THE BEAT
The quarter demonstrated improved earnings conversion, but consolidated revenue growth remained moderate. The earnings release attributed rounded sales growth of 5% to 3% higher volumes, 1% pricing, and 1% favorable currency. Operating income increased $69.2 million against a $138.3 million revenue increase, implying approximately 50% incremental operating-profit conversion. That calculation is mathematically strong but should not be treated as a sustainable incremental margin: depreciation reductions, geographic mix, affiliate accounting, and energy pass-through effects complicate the underlying operating-leverage assessment.
Sequential performance was also favorable. EPS increased 8.4% from Q2’s $3.20, while adjusted operating income increased 7.7% from $752.7 million. Revenue was essentially unchanged from Q2’s $3.172 billion, and operating margin improved from 23.7% to 25.6%. The combination indicates better profit realization rather than a sequential acceleration in consolidated sales. It also follows a strong Q2, when adjusted EPS and operating income each increased approximately 19% year over year. Q3 therefore extended the recovery but did not accelerate its annual growth rate.
The EPS result exceeded the prior management guidance range of $3.25-$3.35 by $0.12 at the upper end and $0.17 at the midpoint. Helium accounted for only part of that outperformance: the actual earnings headwind was approximately 2%, versus management’s expected 3%. Improved on-site volumes and equity-affiliate contributions were also material. The quarter should not be characterized as merely a helium-driven beat, but neither should the entire upside be attributed to recurring industrial-gas operating growth.
The broader historical comparison is favorable. Fiscal 2025 adjusted EPS was $12.03, down approximately 3% from the preceding year. The new fiscal 2026 midpoint of $13.44 implies 11.7% growth, marking a meaningful reversal. However, the magnitude of the improvement reflects both operational recovery and favorable comparisons following prior portfolio disruptions. It does not independently establish a durable double-digit earnings growth algorithm.
EARNINGS QUALITY AND NORMALIZATION
Equity-affiliate income increased to $205.2 million from $167.6 million, a $37.6 million improvement, or 22.4%. This contribution is economically important because it sits below consolidated operating income. Affiliate income represented approximately 20% of combined adjusted operating income and affiliate income, meaning that a substantial portion of earnings depends on joint-venture distributions, contractual arrangements, and counterparties rather than wholly owned operating assets.
A simplified adjusted pretax bridge illustrates the composition of the earnings increase. Adjusted operating income contributed $69.2 million, affiliate income contributed $37.6 million, lower interest expense contributed $12.0 million, and adjusted other non-operating income contributed approximately $1.6 million. Together, these explain approximately $120.4 million of adjusted pretax improvement. Operating income therefore accounted for approximately 57% of the pretax increase, with affiliates and financing effects providing the remainder. A slightly higher adjusted effective tax rate, approximately 18.6% versus 18.1%, and higher noncontrolling-interest earnings reduced the conversion into attributable net income.
The Middle East affiliate contribution requires particular normalization. The transcript contains an analyst reference that could be misread as equity income increasing by more than $100 million. The financial statements show that Middle East and India affiliate income was $101.1 million, up $15.1 million from $86.0 million, not an increase exceeding $100 million. Sequentially, it increased from $79.2 million. Melissa Schaeffer attributed the unusually strong quarter partly to contractual preferred-dividend timing and stated, “we will see the normal run rate reconfigured in Q4 this year.” Annualizing the Q3 level would therefore contradict explicit management commentary.
The Americas also contributed meaningfully through affiliates, with affiliate income increasing to $56.2 million from $37.8 million. This distinction helps reconcile the positive regional EPS attribution cited by RBC with Americas operating income finishing slightly below the Bloomberg segment consensus. Regional EPS contributions and reported segment operating income are not equivalent measures, particularly where joint ventures are significant.
The gasification assets held for sale introduce another normalization issue. Management described approximately 1%-1.5% of total-company benefit from suspended depreciation and another 1%-1.5% from overdue collections. The response did not explicitly define the denominator for those percentages. If they refer to percentage-point contributions to EPS growth, the combined effect would correspond to approximately $0.06-$0.09 per share against the prior-year EPS base. That is an illustrative interpretation, not a company-provided EPS reconciliation.
The economic distinction is more important than the precise translation. Stopping depreciation increases accounting earnings without directly increasing operating cash generation. Collecting overdue amounts improves cash realization, but catch-up collections should not be extrapolated indefinitely. Both benefits can remain within company-reported adjusted earnings while still warranting separate treatment in an assessment of sustainable growth. Consequently, adjusted EPS of $3.47 is not synonymous with fully normalized recurring EPS of $3.47.
REGIONAL OPERATING PERFORMANCE
The Americas delivered sales of $1.321 billion, up 4.8%, and operating income of $395.4 million, up 5.7%. The release identified 7% volume growth, partially offset by 2% lower energy cost pass-through. Growth was supported by existing HyCO facilities, stronger U.S. refinery production, and a new asset connected to the Gulf Coast hydrogen pipeline. These are strategically attractive drivers because they leverage an established production and distribution system rather than requiring entry into an unproven market.
Americas profitability nevertheless showed cost pressure. Operating margin was 29.9%, versus approximately 29.7% previously. Management reported approximately 50 basis points of favorable margin impact from lower energy pass-through, exceeding the reported margin expansion. On that basis, underlying margin performance excluding the pass-through effect was modestly weaker. Fixed-cost inflation, distribution and dislocation expenses, and project-development costs absorbed part of the volume benefit. Revenue was approximately 2.1% below consensus, and operating income was approximately 0.6% below consensus. The region’s demand improvement was real, but its operating-profit delivery was not an unqualified beat.
The Americas pricing discussion also requires separation of product effects. Management indicated that non-helium pricing improved, while helium weakness offset that benefit. The limited packaged-gas presence constrains the breadth of discretionary price actions compared with a business possessing a larger cylinder-gas portfolio. Productivity, contract escalators, and liquid-bulk pricing therefore remain important defenses against inflation. Strong refinery hydrogen volumes do not automatically translate into proportionate margin expansion when maintenance and distribution costs rise.
Asia was the strongest reported segment. Sales increased 9.4% to $886.0 million, exceeding consensus by 4.1%. Operating income increased 18.3% to $256.4 million, approximately 6.9% above consensus. Operating margin increased to 28.9% from approximately 26.8%. The release attributed sales growth to 6% higher volumes, 2% favorable currency, and 1% higher energy cost pass-through. Electronics demand, new on-site assets, and improved helium volumes supported the result.
Asia’s apparent operating leverage should nevertheless be adjusted for the gasification accounting benefits. Segment depreciation and amortization declined to $117.2 million from $126.7 million, while operating income increased $39.6 million. The depreciation reduction is therefore material relative to the profit increase, although it cannot all be assigned to the held-for-sale assets without a more detailed reconciliation. The region offers the strongest combination of structural demand and project growth, but its 18% reported profit increase overstates the evidence for purely organic, cash-based improvement.
Europe remained the weakest major demand environment. Sales increased 5.9% to $815.7 million, but the release attributed growth to 3% higher energy pass-through, 3% favorable currency, and 2% pricing, offset by 2% lower volumes. Operating income increased only 2.4% to $230.7 million, slightly below consensus. Operating margin declined to 28.3% from approximately 29.2%, including approximately 50 basis points of adverse energy pass-through impact. Even after allowing for that denominator effect, profitability did not fully preserve its prior-year margin. Pricing and business mix are providing resilience, not evidence of a broad European industrial recovery.
Middle East and India reported operating income of only $8.0 million, broadly unchanged, but this understates the region’s economic importance because most of its earnings are recorded through affiliates. Corporate and Other reported an operating loss of $80.2 million, improved from $83.1 million, despite sales declining 28% to $103.1 million. Corporate productivity helped offset weaker equipment activity, but the operating loss increased sequentially from $77.4 million. Cost control remains supportive without providing a uniformly improving quarterly trajectory.
GUIDANCE REVISION AND THE FORWARD EARNINGS HURDLE
The full-year guidance increase is substantive. The new lower bound of $13.39 exceeds the prior upper bound of $13.25 by $0.14. The range narrowed from $0.25 to $0.10, a 60% reduction, reflecting greater visibility with most of the fiscal year completed. The new midpoint exceeds the pre-release consensus by $0.21. It is therefore more than a cosmetic tightening around an unchanged earnings expectation.
The original fiscal 2026 guidance, issued in November 2025, was $12.85-$13.15. Against fiscal 2025 EPS of $12.03, that implied approximately 6.8%-9.3% growth, with a midpoint near 8.1%. The analyst’s reference to beginning the year at approximately 9% growth should therefore be understood as a rounded characterization rather than the original midpoint. The current $13.44 midpoint is $0.44, or 3.4%, above the original $13.00 midpoint.
The revision contains both realized outperformance and a stronger remaining-quarter expectation. First-half adjusted EPS was $6.37. Combining that result with the previous annual midpoint of $13.125 and the previous Q3 midpoint of $3.30 implied a residual Q4 expectation of approximately $3.455. The new Q4 midpoint is $3.60, an increase of approximately $0.145. On this arithmetic, approximately $0.17 of the $0.315 annual midpoint increase comes from Q3 exceeding its prior midpoint, and approximately $0.145 comes from a higher implied Q4 result. The earlier Q4 figure was a mechanical residual, not separately issued quarterly guidance.
The Q4 outlook is favorable but appropriately less exuberant than the headline annual increase. Guidance of $3.55-$3.65 compares with $3.39 in the prior year and consensus of $3.52. At the midpoint, expected growth is approximately 6.2% year over year and 3.7% sequentially. The sequential increase despite affiliate normalization implies continued support from operating factors, but the annual growth deceleration indicates that Q3’s combination of favorable items is not assumed to repeat unchanged.
Management identified market volumes as the largest driver of the improvement relative to earlier expectations, particularly in Americas HyCO and Asian electronics. New assets contributed approximately 3% to year-over-year growth in the discussion, while pricing and productivity remained supportive. However, management simultaneously incorporated “no significant market growth” into areas affected by macroeconomic uncertainty. This is not necessarily inconsistent: specific customer ramps and new asset contributions can support earnings while broad industrial activity remains subdued.
No formal fiscal 2027 EPS range was issued. The direction of travel is positive, but the earnings bridge faces more difficult productivity comparisons, normalization of affiliate income, potential removal of sold-asset earnings, and uncertainty over depreciation and interest expense as projects transition into operation. The fiscal 2026 growth rate should not be carried forward automatically.
HELIUM: BETTER EXECUTION, CONTINUING PRICE PRESSURE
Helium’s approximately 2% earnings headwind was better than the expected 3%, reflecting stronger electronics-related volume and pricing in Asia, partially offset by weaker U.S. space activity. The result demonstrates that regional mix and customer additions can improve the earnings outcome even while the global business remains under pressure. It does not establish that helium has returned to a uniformly favorable pricing cycle.
The pricing mechanism is lagged. Management explained that much of the current pressure reflects contracts negotiated over more than 1 year after an earlier period of tight supply. The headwind is increasingly concentrated in Europe and North America, particularly healthcare and MRI customers. Current supply disruption therefore does not necessarily create an immediate earnings windfall: realized prices depend on contract renewal timing, customer mix, and the balance between supplier costs and customer commitments.
The Texas cavern is a meaningful competitive asset. Menezes stated, “40% of all the volume we sold during this quarter came from our cavern in Texas.” Management indicated that inventory withdrawals could continue for many quarters and that the forecast did not depend on a prompt normalization of Qatari supply. Storage, diversified sourcing, liquefaction capability, and container availability allow Air Products to preserve customer service during shortages and strengthen its position in long-term contract negotiations.
That resilience has limits. Inventory withdrawal is not equivalent to recurring production, and eventual replenishment economics remain relevant. The call did not disclose cavern inventory, the cost of withdrawn material, future replenishment costs, or the cash-flow implications of restoring inventory. Consequently, the durability of the supply advantage is supported qualitatively but cannot be fully modeled from the disclosures.
New electronics-related helium contracts are strategically attractive because some have durations comparable with large on-site agreements. However, management indicated that associated customer projects may start in 1, 2, or 3 years. Those commitments support future visibility rather than immediate earnings recognition. The analyst’s suggestion that the annual helium penalty might be approximately $105-$110 million, rather than $150 million, was not explicitly confirmed as revised company guidance and should not be treated as such.
ELECTRONICS BACKLOG AND THE QUALITY OF FUTURE GROWTH
The approximately $3 billion traditional industrial-gas backlog is the clearest positive indicator of the company’s strategic repositioning. Management requires projects to have reached final investment decision after review of risk-adjusted returns before inclusion. The backlog therefore represents a more advanced commitment set than an unqualified opportunity pipeline. More than $1.5 billion of electronics project wins were secured during the preceding 6 months, while management described approximately 2/3 or more of prospective opportunities as electronics-related.
These disclosures have different denominators. The $3 billion figure is a project-investment backlog, not contracted annual revenue. The $1.5 billion figure represents recent wins, not necessarily incremental current-year capital spending or earnings. The approximately 2/3 figure refers to opportunities, not current sales or established earnings exposure. Combining them into a single revenue growth forecast would overstate the available information.
The growth opportunity appears market-led rather than solely attributable to the management transition. Menezes acknowledged that “the market is going through a supercycle.” A legacy Taiwan program dates to 2022, while most other projects entered the portfolio more recently. Samsung was identified in the prior earnings release, and the current release described a separate Taiwan semiconductor expansion involving 4 large air-separation units. Customer identities not disclosed by the company should not be inferred from analyst suggestions.
The strategic advantage is the restoration of a familiar industrial-gas model: build, own, and operate technically demanding assets for major customers under long-term contracts. This offers a more established risk framework than committing large amounts of capital to emerging commodity markets without matching sales-price protection. Nevertheless, the call did not disclose project-level returns, take-or-pay terms, power-cost escalation provisions, or minimum-volume protections. “Traditional” should therefore be interpreted as a more proven business model, not a guarantee of attractive economics.
Electronics concentration also changes the risk mix. Growth becomes more dependent on semiconductor fabrication investment, customer commissioning schedules, Taiwan and South Korea exposure, and large-customer concentration. Long-term contracts may reduce some demand volatility, but delays in customer ramps can still affect utilization, capital efficiency, and earnings timing. The backlog strengthens medium-term visibility while increasing exposure to the semiconductor capital-spending cycle.
LOUISIANA, CASA GRANDE, AND THE ECONOMICS OF EXITING
The June 30 decision to exit Louisiana, Casa Grande, and smaller clean-energy distribution projects is favorable for prospective capital allocation but represents a substantial realization of prior economic losses. The Q3 charge was $2.907 billion pretax and approximately $2.212 billion after tax, or $9.92 per share. GAAP results consequently included an operating loss of $2.097 billion and a diluted continuing-operations loss of $6.47 per share, despite adjusted EPS of $3.47.
The charge should not be dismissed simply because it is excluded from adjusted earnings. Fiscal 2025 already included approximately $3.7 billion of business and asset action charges. Combined with the Q3 2026 charge, approximately $6.6 billion of such charges has been recognized across those periods. These amounts are not all current-period cash outflows, but they demonstrate the scale of unsuccessful capital commitments and support continued scrutiny of investment governance.
The appropriate economic test for cancellation is prospective rather than retrospective. If expected future returns no longer justify remaining expenditure, stopping the project can increase equity value even after substantial sunk costs. The June announcement explicitly stated that expected Louisiana returns did not meet the company’s criteria. The positive implication is avoidance of further unattractive investment, not reversal of the capital already lost.
The abandoned Louisiana plan was substantial. The December 2025 announcement contemplated an estimated $8-$9 billion project, with Yara potentially acquiring approximately 25% of project assets and purchasing hydrogen under a 25-year agreement. Cancellation therefore represents a meaningful change from the earlier commercialization strategy. However, the amount of remaining Air Products-funded expenditure avoided was not fully quantified on this call. The original project cost should not be equated with cash savings from cancellation.
Asset recovery provides upside but remains uncertain. Management highlighted air-separation equipment, hydrogen purification equipment, and ammonia production units as potentially reusable or saleable. The ammonia units were described as having 4,000 tons per day of capacity. Redeploying industrial-gas equipment could reduce future project expenditure, while selling an integrated ammonia package could generate proceeds and potentially create associated hydrogen and nitrogen supply business.
The approximately $1 billion recovery figure raised by an analyst was not reaffirmed as a firm target. Management emphasized maximizing value rather than meeting a specific deadline. Recoverable proceeds, avoided future spending through redeployment, and new commercial opportunities are distinct sources of value and should not be added together without checking for overlap. Comparisons with sales of operating ammonia plants also require caution because uninstalled equipment lacks the permits, integration, operating history, and commissioning certainty of a producing facility.
The remaining legacy portfolio still consumes capital. Management stated that several underperforming projects would continue because of contractual obligations and project status, while being “not expected to contribute materially to our future operating income.” That is an important constraint on forecasting returns from aggregate capital expenditure. Edmonton received no updated startup date or cost estimate, so the call provided no incremental evidence that its execution risk had diminished.
NEOM AND YARA: DISTRIBUTION RISK REDUCED, ECONOMIC RISK RETAINED
The Yara agreement resolves an important physical constraint. Air Products is obligated to lift ammonia produced by NGHC, and ammonia cannot simply be vented if storage becomes full. A failure to move product could therefore interrupt production and create additional operational and contractual problems. Yara’s shipping, terminals, trading capabilities, and customer network provide a practical route to market for ammonia not used by Air Products to produce renewable hydrogen in Europe.
The December 2025 announcement described Yara as transporting more than 4 million metric tonnes of ammonia annually, supported by 12 vessels and 18 import terminals. That infrastructure gives substance to management’s claim that the arrangement addresses volume placement. The agreement converts an internally difficult logistics and commercialization problem into a relationship with an established market participant.
It does not constitute a fixed-price offtake hedge. Menezes stated, “Most of the price risk will sit with us.” Yara is compensated through a variable commission structure intended to reward higher-value placement of renewable ammonia. The arrangement aligns incentives to capture a green premium but does not establish a guaranteed minimum margin for Air Products. Physical sales can occur at economically unattractive prices.
The underlying exposure is an asymmetry between a fixed purchase obligation and uncertain realized sales prices. Air Products described its purchase price from NGHC as effectively fixed, while sales prices depend on ammonia market conditions and the market’s willingness to pay for renewable attributes. Conventional ammonia prices are influenced by natural-gas costs, supply additions, operating rates, and regional demand. A decline in conventional production costs can therefore compress Air Products’ selling margin even if the NEOM plant operates exactly as designed.
The fixed purchase price also creates potential upside. Higher conventional energy costs or a durable renewable premium could improve the spread over time. Management deliberately does not seek to lock all sales into contracts matching the full 30-year purchase commitment, preserving exposure to that potential appreciation. The consequence is continuing commercial risk: shorter sales contracts must be renewed against a much longer purchase obligation.
The scale of the exposure is material. The earlier project announcement identified offtake of up to 1.2 million metric tonnes annually. At that volume, a $100 per metric tonne change in net realized price after distribution and marketing costs would change annual pretax contribution by approximately $120 million. Assuming a 20% tax rate and approximately 223 million diluted shares, the EPS sensitivity would be approximately $0.43, or 3.2% of the fiscal 2026 guidance midpoint. This is a steady-state sensitivity, not a fiscal 2027 forecast, and it excludes separate joint-venture accounting effects and any volume diverted into European hydrogen production.
The purchase obligation should not be scaled down to Air Products’ approximately 33% ownership interest in NGHC. Equity ownership and commercial offtake are different exposures. Air Products can have a minority economic interest in the production company while remaining responsible for lifting substantially all relevant production. That distinction is essential to assessing risk alongside proportionately adjusted leverage measures.
Management’s fiscal 2027 assurance was clear but narrow. Menezes stated, “I can confirm that our expectation is to have no gain or loss in 2027.” Schaeffer separately indicated no large cash-flow impact, with most equity funding already contributed and the project approximately 73% project-financed. The income-statement statement is stronger than the cash-flow statement: no expected earnings impact does not imply literally no cash movement.
The explanation centers partly on commissioning. Menezes clarified that commissioning means “being at full production capacity” and emphasized a long process for a technically novel plant. Physical construction being more than 90% complete does not establish imminent full output, accounting deconsolidation, or activation of every purchase obligation. A prolonged ramp may defer earnings exposure while also delaying returns on capital already committed.
The hypothetical question about full production in 2027 was not answered with a quantified profit or loss. Consequently, zero expected fiscal 2027 impact cannot be extrapolated into a steady-state breakeven assumption. Fixed purchase terms, volume obligations during commissioning, freight economics, commission rates, green-premium realization, and longer-term earnings sensitivities remain insufficiently disclosed for a complete project valuation.
A potential future sale of the equity stake would not necessarily remove the offtake exposure. Management distinguished joint-venture exit provisions from the separate 30-year commercial contract and suggested that a back-to-back agreement could be needed to transfer substantial volume exposure. A future strategic transaction should therefore be assessed contract by contract rather than assumed to eliminate the entire NEOM commitment.
CASH FLOW, CAPITAL EXPENDITURE, AND SHAREHOLDER RETURNS
Year-to-date operating cash flow increased 65.8% to $3.310 billion from $1.996 billion. The improvement materially exceeded adjusted earnings growth, but much of the difference reflects cash conversion rather than an equivalent acceleration in operating profitability. Aggregate working-capital outflows narrowed from approximately $1.070 billion to $210.8 million, an improvement of $858.7 million. That accounts for approximately 65% of the $1.314 billion increase in operating cash flow.
Cash taxes also declined to $388.8 million from $856.1 million. The tax and working-capital effects should not be added mechanically because their statement classifications and related adjustments require reconciliation. The overall conclusion is that liquidity improved significantly, but the 66% operating-cash-flow growth rate is not a reliable recurring earnings growth proxy.
Management-defined capital expenditure also differs from consolidated additions to property, plant, and equipment. The measure includes certain affiliate investments but excludes NGHC expenditure financed by project debt or other partners rather than Air Products. Year-to-date management-defined expenditure was $2.646 billion, compared with $3.355 billion of consolidated plant and equipment additions. The adjustment for NGHC spending not funded by Air Products was $817.1 million.
Using operating cash flow less management-defined capital expenditure produces $663.4 million of cash generation before dividends. Deducting dividends produces a $536.6 million deficit. By contrast, consolidated operating cash flow less consolidated plant and equipment additions was negative $44.9 million before dividends and before other investment categories. These calculations measure different funding perimeters. The management measure is useful for assessing Air Products-funded investment, but its positive result should not be confused with positive post-dividend consolidated free cash flow.
The standalone quarter was better than the year-to-date position. Subtracting the first-half statements from the 9-month statements produces Q3 operating cash flow of $1.305 billion and management-defined capital expenditure of $857.8 million. The resulting $447.4 million surplus exceeded quarterly dividends of $403.0 million by approximately $44.4 million. This provides evidence that cash neutrality is becoming achievable, although the margin of coverage remains modest and payment timing can materially affect quarterly outcomes.
The $500 million reduction in fiscal 2026 capital expenditure guidance is a 12.5% decrease. Against year-to-date spending, the new $3.5 billion forecast implies approximately $853.8 million of Q4 expenditure, broadly similar to Q3. Prepared remarks cited payment timing, lower expected maintenance, and canceled projects; the CFO’s Q&A emphasized timing as the largest immediate factor. The fiscal 2026 reduction should therefore not be capitalized entirely as a permanent annual saving.
The longer-term objective is more important for equity value. Management described approximately $1.5 billion of annual traditional industrial-gas investment and eventual total capital expenditure of approximately $2.0-$2.5 billion after remaining legacy projects come on stream. Relative to fiscal 2026’s $3.5 billion forecast, that represents a potential annual reduction of $1.0-$1.5 billion. It could materially improve cash available for dividends, debt reduction, and repurchases, but remains contingent on completing legacy obligations and avoiding replacement commitments of similar scale.
Share repurchases are not an immediate catalyst. Management described visibility toward late 2027 or early 2028, with high-return projects, dividend growth, and opportunistic acquisitions ahead of buybacks in the allocation sequence. The guidance is conditional, not an announced authorization or commitment to a specific repurchase volume. EPS forecasts should not incorporate material buyback accretion solely from these comments.
BALANCE SHEET, RETURN ON CAPITAL, AND JAZAN
Management reported adjusted net debt to EBITDA of 2.1 times using its NGHC-adjusted framework. The balance sheet showed approximately $17.7 billion of debt, including related-party debt, and approximately $1.0 billion of cash, implying roughly $16.7 billion of consolidated net debt before management’s adjustments. The difference demonstrates why the 2.1-times ratio cannot be compared mechanically with an unadjusted peer leverage ratio.
Expected NGHC deconsolidation could reduce reported net debt to approximately $11.0-$11.5 billion once the relevant construction and commissioning conditions are satisfied. That would be an accounting perimeter change, not a cash inflow or repayment of an equivalent amount of obligations. Commercial offtake risk can remain even when project debt is no longer fully consolidated. The analyst’s question about approximately $4.7 billion of previously disclosed debt versus approximately $5.25 billion in the presentation was not resolved with a detailed numerical reconciliation.
Return on capital improved to 11.7%, up 60 basis points year over year and sequentially higher. Stronger earnings contribute positively, but project optimization and reductions in the capital base can also affect the metric. Without a constant-capital reconciliation, the increase cannot be attributed entirely to better operating productivity. A sustainable improvement would require new assets earning attractive returns, stronger cash realization, and fewer subsequent impairments, not merely a smaller recorded investment base.
Jazan remains a meaningful geopolitical exposure. Management indicated that the analyst’s approximately $1.35 annual EPS contribution estimate was in the appropriate range, although somewhat high. That order of magnitude is approximately 10% of the fiscal 2026 EPS guidance midpoint. The CFO explained that the contribution is associated with a financing receivable and declines over the agreement’s life, so it should not be modeled as permanently flat operating earnings.
Management expected no financial impact from the reported attack and confirmed no employee injuries. That is reassuring for the immediate outlook but does not eliminate wider regional risk. The question concerning third-party insurance was not answered with coverage details, exclusions, or limits. Contractual resilience, physical operating resilience, counterparty payment capacity, and insurance recoverability remain separate considerations.
VALUATION AND INVESTMENT IMPLICATIONS
The quarter improves the probability of a successful transition toward a more conventional industrial-gas investment profile. Positive evidence includes stronger on-site demand, a growing electronics backlog, further corporate productivity, reduced exposure to Louisiana funding, and improving cash coverage. Negative evidence includes the contribution from accounting-related earnings benefits, continuing cost pressure, weak European volumes, and the unresolved steady-state economics of NEOM.
The sell-side reaction was positive but not uniformly bullish. Mizuho raised its target to $355 from $345, RBC maintained an outperform stance with a $358 target, and Citi retained a neutral rating with a $315 target. Expressed against the new fiscal 2026 EPS midpoint, those prices correspond to approximately 26.4 times, 26.6 times, and 23.4 times earnings, respectively. These are reference calculations, not representations of the analysts’ actual valuation methodologies or forecast years.
The Bloomberg notice reported 15 buy recommendations, 9 holds, and no sells. The stock therefore did not enter the event with uniformly pessimistic expectations. The approximately 3% premarket increase indicates favorable initial reception, but it is not a closing-price return or evidence that the strategic improvement remained unpriced. A meaningful part of the capital-allocation reset had already been announced on June 30.
An illustrative 12-18-month scenario framework supports valuation discipline. These scenarios are analytical assumptions, not management guidance or consensus forecasts. A 50% base-case probability assumes fiscal 2027 EPS of $14.40, approximately 7.1% above the fiscal 2026 midpoint, reflecting continued new-asset growth and pricing offset by less favorable productivity and affiliate comparisons. Applying a 23-times multiple produces approximately $331 per share.
A 25% bull-case probability assumes fiscal 2027 EPS of $15.00, approximately 11.6% growth, supported by stronger electronics ramps, further helium improvement, successful capital reduction, and greater confidence in post-2027 NEOM economics. A 26-times multiple produces $390 per share. This outcome requires both stronger earnings and a lower perceived risk premium; earnings delivery alone would not justify the entire increase.
A 25% bear-case probability assumes fiscal 2027 EPS of $13.00, approximately 3.3% below the fiscal 2026 midpoint, reflecting weaker industrial demand, delayed customer ramps, removal of favorable earnings items, and continuing legacy-project uncertainty. A 19-times multiple produces $247 per share. The multiple compression captures potential concern about longer-term cash obligations even if NEOM remains earnings-neutral during fiscal 2027.
The probability-weighted value is approximately $325 before dividends. These multiples are explicit valuation assumptions rather than verified current peer benchmarks. At an illustrative $290 entry, the base case implies approximately 14% price appreciation, the bull case approximately 34%, and the bear case approximately 15% downside; probability-weighted appreciation is approximately 12% before dividends. The resulting framework favors selective accumulation around $285-$290 or below rather than paying a full premium multiple before remaining risks are resolved.
For a diversified portfolio, an initial 0.5%-1.0% NAV position would be more consistent with the unresolved contractual and execution risks than a high-conviction core allocation. A 10% price stop would imply a planned position loss of approximately 0.05%-0.10% of NAV, although overnight gaps and geopolitical events can exceed that limit. Fundamental deterioration should override price-based patience. Exposure should not be increased solely because headline EPS rises if cash conversion or project economics weaken.
Portfolio diversification benefits are also conditional. Air Products offers less direct exposure to semiconductor product pricing than a chip manufacturer, but the incremental growth strategy increases dependence on semiconductor fabrication investment and Asian customer execution. A technology-heavy portfolio may therefore receive less diversification than the industrial classification suggests. Saudi exposure, ammonia economics, industrial activity, and long-duration equity valuation add separate risk factors. Actual portfolio correlation cannot be quantified without holdings and factor exposures.
CATALYSTS, REVIEW TRIGGERS, AND EXIT CONDITIONS
The nearest operating catalyst is delivery against Q4 EPS guidance of $3.55-$3.65 while Middle East affiliate income normalizes. A result supported by on-site volumes, non-helium pricing, and cash conversion would strengthen confidence in recurring earnings. A result dependent on additional collections, asset accounting, or favorable affiliate timing would provide less evidence of durable improvement.
The next major valuation catalyst is the fiscal 2027 outlook. The relevant disclosures are the recurring EPS bridge, expected project startup contributions, capital expenditure, maintenance requirements, and post-dividend cash coverage. Further electronics awards are supportive, but conversion of awarded projects into attractive earnings and cash returns is more important than backlog growth alone.
NEOM commissioning milestones and the eventual fiscal 2028 earnings framework are critical beyond the near-term guidance horizon. Evidence of binding customer contracts, measurable renewable premiums, and transparent net realization would reduce uncertainty. Earlier-than-expected purchase exposure, weak achieved pricing, or a prolonged capital-intensive ramp would undermine the de-risking thesis.
Asset monetization offers a separate catalyst, but proceeds should be evaluated net of taxes, remaining obligations, lost earnings, and replacement investment. A gasification sale can reduce complexity and improve liquidity while also removing current earnings contributions. Louisiana equipment recovery can create value without constituting a recurring profit stream.
The investment thesis would weaken materially if the expected capital-expenditure decline fails to occur, post-dividend cash deficits persist despite project cancellations, electronics assets are delayed without adequate contractual protection, or NEOM begins producing material losses without an offsetting improvement in the core business. A Jazan disruption with financial consequences would also require immediate reassessment. These are exit or reduction triggers, not reasons to extend the holding period indefinitely.
The central conclusion is that the quarter increased confidence in Air Products’ operating recovery and capital discipline while leaving a material distinction between reported earnings growth and normalized economic returns. The strongest investment argument is improving cash generation from a refocused industrial-gas portfolio. The weakest argument is that the Yara agreement has transformed NEOM into a fully hedged, conventional on-site gas investment. Valuation should reward the former without assuming the latter.
COMPANY EMPLOYEES ON THE CALL
• Eduardo Menezes, Chief Executive Officer. • Megan Britt, Vice President, Investor Relations. • Melissa Schaeffer, Executive Vice President and Chief Financial Officer.
RESEARCH ANALYSTS ON THE CALL
• Duffy Fischer, Goldman Sachs. • John McNulty, BMO Capital Markets. • Jeff Zekauskas, JPMorgan. • Chris Parkinson, Wolfe Research. • Vincent Andrews, Morgan Stanley. • James Hooper, Bernstein. • David Begleiter, Deutsche Bank. • Laurence Alexander, Jefferies. • Kevin McCarthy, Vertical Research Partners. • John Roberts, Mizuho Securities. • Joshua Spector, UBS Investment Bank. • Alex, surname and formal title not identified, Citi, speaking on behalf of Patrick Cunningham. Patrick Cunningham was announced by the operator but did not personally ask the question in the transcript. • Arun Viswanathan, RBC Capital Markets. • Mike Harrison, Seaport Research Partners.
Key Read-Throughs
KEY READ-THROUGHS FROM AIR PRODUCTS AND CHEMICALS’ Q3 2026 EARNINGS CALL
Air Products’ July 30, 2026 call reinforces a market characterized by selective investment growth rather than a broad industrial recovery. Semiconductor infrastructure is attracting substantial capital and generating incremental gas demand, while European industrial activity remains weak and several hydrogen projects have failed to meet commercial return requirements. The most consequential cross-company implications concern contractual risk allocation: Yara gains access to renewable-ammonia distribution economics without assuming most of Air Products’ commodity-price exposure; competing ammonia producers benefit from delayed capacity additions; and electrolyzer suppliers face continued uncertainty around project conversion and commissioning. The strongest near-term trading relevance was for Linde ahead of its July 31 results. Several other developments were confirmations of previously announced transactions rather than entirely new catalysts. Timing below is assessed from the July 30 call date, and country labels identify primary equity-listing markets.
AMMONIA, FERTILIZERS, AND COMMODITY DISTRIBUTION
YARA CAPTURES DISTRIBUTION ECONOMICS WITHOUT ASSUMING MOST OF NEOM’S PRICE RISK (READ-THROUGH 1)
Affected company: Yara International (YAR: Norway). Direction: Positive. Magnitude: Moderate strategic benefit to the ammonia platform; initially limited and unquantifiable consolidated earnings contribution.
The clearest favorable read-through is the asymmetry between Yara’s role and Air Products’ obligations. Menezes described the agreement as “a way to eliminate the volume risk,” while explicitly stating, “Most of the price risk will sit with us.” Yara receives variable compensation linked to commercialization, including incentives to obtain higher prices for renewable ammonia. Air Products retains the fixed-price purchase obligation and most of the exposure to the difference between that purchase price and achieved market realization. Yara therefore gains a commercial opportunity without taking on an equivalent 30-year merchant-price commitment.
The transmission mechanism is increased utilization of an established ammonia trading, shipping, terminal, and customer network. The earlier partnership announcement identified potential NEOM output of up to 1.2 million metric tonnes annually, against Yara’s existing ammonia transportation activity exceeding 4 million tonnes annually. Full NEOM output would therefore represent a potentially meaningful addition relative to that platform, although Yara will market only the volume not used by Air Products for European hydrogen production. The comparison is a scale indicator, not a forecast of incremental throughput or revenue. Commission rates, transport costs, customer commitments, and the allocation between ammonia and hydrogen applications remain undisclosed.
The agreement also strengthens Yara’s ability to supply internal fertilizer production and external customers from a more diversified sourcing network. However, this does not make Yara’s overall ammonia strategy capital-light. Its separately announced $1.3 billion Gulf Coast Ammonia acquisition raised planned 2026 capital expenditure to $2.5 billion and adds operating and commissioning exposure. The favorable distinction is specifically that the NEOM marketing arrangement does not replicate Air Products’ principal commodity-price obligation.
Near-term catalyst: Final execution of the agreement removes negotiation uncertainty, but much of the strategic direction was already known from December 2025 and Yara’s July announcements. Yara had already reported Q2 results on July 17, so the Air Products call is not a leading indicator of that completed quarter. Longer-duration effect: Incremental distribution earnings and improved sourcing flexibility as NEOM ramps. Air Products’ expectation of no fiscal 2027 earnings impact does not establish that Yara’s commission income will also be zero, but it argues against assuming an immediate full-capacity earnings contribution.
LOUISIANA’S CANCELLATION REDUCES COMPETING AMMONIA SUPPLY, BUT EQUIPMENT RESALE LIMITS THE PERMANENCE OF THE BENEFIT (READ-THROUGH 2)
Affected company: CF Industries (CF: United States). Direction: Positive for the longer-term competitive supply outlook. Magnitude: Moderate for low-carbon ammonia positioning; negligible direct effect on 2026 earnings.
Air Products confirmed the exit from its Louisiana project after expected returns failed to meet investment criteria. The earlier Air Products-Yara proposal contemplated approximately 2.8 million tonnes of annual low-carbon ammonia production, with completion expected by 2030. Removing that project from the committed development pipeline reduces prospective competition for ammonia customers and low-carbon offtake commitments. For scale, CF Industries’ Blue Point project is designed for approximately 1.4 million tonnes annually and targeted production beginning in 2029.
The transmission mechanism is improved prospective supply-demand balance and less competition for long-term customer commitments during the period when CF’s new capacity is expected to enter service. The benefit is especially relevant to the low-carbon ammonia market, where supply additions can precede the emergence of customers willing to pay sufficiently attractive premiums. CF’s existing production network also benefits directionally from fewer competing export tonnes, although a specific ammonia-price or EBITDA uplift cannot be established from this cancellation alone.
The important qualification is that Air Products intends to sell or redeploy equipment rather than permanently destroy productive capacity. Menezes emphasized commercializing ammonia assets “as a full unit,” potentially alongside new hydrogen and nitrogen supply contracts. Accordingly, the high-conviction conclusion is a reduction in committed supply and probable delay in competing capacity, not permanent removal of 2.8 million tonnes from the global industry. A new owner could eventually reconstruct part of the supply opportunity elsewhere.
Near-term catalyst: Limited incremental trading novelty because the cancellation was announced on June 30. The July call added information about asset recovery and potential redeployment. Longer-duration effect: More favorable competitive conditions around 2029-2030, subject to replacement projects and equipment resale. The negative counter-signal is that an experienced operator could not justify its project economics; this supports conservative assumptions for low-carbon premiums rather than automatically validating CF’s investment returns.
HYDROGEN EQUIPMENT AND RENEWABLE PROJECT DEVELOPERS
PROJECT CANCELLATIONS AND EXTENDED COMMISSIONING REMAIN MATERIAL RISKS TO ELECTROLYZER MARGIN RECOVERY (READ-THROUGH 3)
Affected company: thyssenkrupp nucera (NCH2: Germany). Direction: Negative for project-conversion confidence and the timing of green-hydrogen profitability. Magnitude: Material to the green-hydrogen segment; the incremental consolidated financial effect is unquantified.
The relationship is direct, not merely thematic. Thyssenkrupp nucera was awarded the alkaline-electrolyzer supply for Air Products’ Casa Grande facility, originally described as a 10-metric-tonne-per-day green liquid-hydrogen project. It is also the supplier of the large electrolysis package at NEOM. Air Products’ confirmation of the Casa Grande exit therefore concerns an identified supplier project, while Menezes’ expectation of “a long commissioning process” at NEOM is relevant to an identified major equipment installation.
The transmission mechanism differs by project stage. Casa Grande’s cancellation removes the prospect of an operating reference site and associated future service or expansion opportunities. Any effect on remaining equipment revenue, cancellation compensation, or receivables depends on contractual terms and work already recognized. NEOM’s commissioning period affects the timing of demonstrated operating performance and potentially acceptance-related activities, service mobilization, and cash collection. The call does not establish a specific acceptance-payment delay, supplier penalty, or technical failure, so none should be booked mechanically into estimates.
The significance is reinforced by nucera’s own May 12 results. Its green-hydrogen business already carried fiscal-year EBIT guidance of negative €125 million to negative €90 million, and the company had disclosed higher project costs and enhancements ahead of commissioning. Air Products’ commentary therefore supports continued caution toward a rapid margin recovery. A project being substantially constructed is not equivalent to the supplier having completed all technical and economic obligations.
Counterevidence prevents a blanket sector-collapse conclusion. Nucera’s Q2 order intake reached €316 million, including €176 million in green hydrogen, and its backlog increased to €732 million. The negative read-through is consequently about execution risk, the credibility of project pipelines, and earnings conversion, not an assertion that all electrolyzer demand is disappearing.
Near-term catalyst: Subsequent supplier updates on remaining contract exposure, commissioning expenditure, and revised cost estimates. Casa Grande’s June announcement means the cancellation itself was not new on July 30. Longer-duration effect: Greater value should attach to orders with committed financing and credible product offtake than to announced project capacity. NEOM’s operating performance will also influence confidence in the commercial replication of large electrolyzer installations.
ACWA BENEFITS FROM REDUCED PRODUCT-EVACUATION RISK, NOT FROM AN AUTOMATIC ACCELERATION IN PROJECT DISTRIBUTIONS (READ-THROUGH 4)
Affected company: Acwa, formerly ACWA Power (2082: Saudi Arabia). Direction: Positive for NEOM project-risk reduction, with continuing uncertainty around earnings and cash timing. Magnitude: Meaningful at the project level; the consolidated benefit cannot be quantified from the call.
Acwa holds an approximately 33.3% economic interest in NGHC. Air Products explained that it must lift the ammonia produced and cannot simply dispose of unsold output in the manner of excess industrial gas. Menezes specifically identified the danger of a “tankful event,” which could force production interruption. Yara’s distribution network reduces that physical bottleneck risk and thereby improves the operating resilience of the project in which Acwa is invested.
The mechanism is not a direct transfer of Yara commissions to Acwa. It is a reduction in the probability that inadequate shipping, storage, or market access interrupts plant operations and undermines the realization of contracted project revenue. Acwa’s exposure is also different from Air Products’ merchant offtake exposure: the production venture sells under the long-term arrangement with Air Products, while Air Products retains most downstream price risk. Weak ammonia prices therefore should not automatically be translated into an equivalent realized-price decline for the venture.
Commissioning remains the gating factor. Menezes clarified that completion for the relevant transition means “being at full production capacity.” Construction progress above 90% does not establish that the plant has achieved contracted performance, completed operating tests, or become capable of making unrestricted equity distributions. Debt service, operating costs, working capital, and financing conditions sit between physical production and cash reaching shareholders.
Near-term catalyst: Commissioning and operating-performance disclosures during 2026-2027, rather than a mechanical earnings upgrade following the Yara announcement. Longer-duration effect: Better confidence in the ability to operate the asset continuously and realize its contracted economics. Air Products’ expectation of no fiscal 2027 earnings impact is company-specific and should not be applied automatically to Acwa’s accounting or distributions.
INDUSTRIAL GASES AND SEMICONDUCTOR INFRASTRUCTURE
ELECTRONICS GROWTH IS AN INDUSTRY OPPORTUNITY, NOT SIMPLY AIR PRODUCTS REGAINING SHARE (READ-THROUGH 5)
Affected companies: Linde (LIN: United States) and Air Liquide (AI: France). Direction: Positive. Magnitude: Moderate for multiyear growth visibility; limited basis for an immediate, precisely quantified EPS revision.
Air Products reported more than $1.5 billion of electronics project wins in 6 months, an approximately $3 billion traditional industrial-gas backlog, and an opportunity pipeline with approximately 2/3 or more linked to electronics. Menezes explicitly attributed the environment to a market “going through a supercycle.” The call also identified current earnings contributions from newly operating assets and stronger electronics-related helium demand. This combination of contracted investment and operating demand is stronger evidence than an increase in uncommitted project inquiries alone.
Independent peer disclosures support an industry interpretation. Air Liquide’s July 28 results identified approximately €1 billion of first-half electronics investment decisions and a record €6 billion total backlog. Linde’s previously reported Q1 Asia-Pacific volume growth was supported by electronics and project startups. Air Products’ success therefore does not require a thesis that competing gas suppliers are losing aggregate growth opportunities. Multiple suppliers are securing business within a growing market.
The transmission mechanism is new long-duration gas-supply infrastructure, followed by customer ramp-up and recurring consumption. Higher utilization of existing facilities can contribute earlier, while new plants require construction and commissioning before meaningful earnings recognition. These backlog figures represent capital commitments, not annual gas revenue. They should not be multiplied directly into near-term sales estimates or treated as contemporaneous equipment orders.
There is also a competitive qualification. Air Products’ renewed focus on approximately $1.5 billion of annual traditional industrial-gas investment adds an increasingly active bidder for future projects. That can constrain the extent to which stronger demand translates into higher returns on new awards. The call establishes a larger opportunity set and stronger competition, not observed peer share loss or pricing deterioration.
Near-term catalyst: Linde’s scheduled July 31 results provided the clearest immediate test of electronics volumes, new awards, and guidance implications. Air Liquide had already reported on July 28, making the Air Products call corroboration rather than a fresh earnings predictor. Longer-duration effect: Greater visibility into contracted growth through customer expansions, with returns dependent on award pricing, customer ramp schedules, and capital discipline.
HELIUM SHORTAGES FAVOR RELIABLE CONTRACTED SUPPLIERS, NOT NECESSARILY AN IMMEDIATE SPOT-PRICE WINDFALL (READ-THROUGH 6)
Affected company: Linde (LIN: United States). Direction: Positive for customer retention and long-term contracting; only modest, unquantified near-term earnings upside is supported. Magnitude: Meaningful within helium, smaller at consolidated group level.
Air Products disclosed that 40% of quarterly helium volume came from its Texas cavern and that it could continue withdrawals for many quarters. Despite constrained Qatari supply, the company maintained deliveries and secured new long-duration electronics agreements. The earnings headwind was approximately 2%, better than the expected 3%, but remained negative because contractual price resets continued to affect realized pricing.
This supports the value of diversified sourcing, inventory, logistics, and reliable delivery rather than a simple commodity-price thesis. Customers operating semiconductor fabs place substantial value on uninterrupted supply. A supplier capable of meeting commitments during shortages can preserve existing business and win multiyear contracts, converting temporary supply stress into a more durable customer relationship.
Linde’s own May call provides the necessary company-specific link. It described its helium customer base as approximately 85%-90% contracted, emphasized diversified supply, and prioritized new multiyear agreements rather than significant spot sales. It also stated that its guidance did not include improvement in helium relative to its earlier assumptions. Air Products’ better-than-expected result therefore strengthens the case that reliable supply can create incremental commercial opportunity, but does not establish the magnitude of Linde’s benefit.
The critical limitation is that Air Products’ inventory position, realized prices, and customer contracts cannot be transferred to Linde. Likewise, a shortage can raise procurement costs while selling prices adjust only gradually. The high-conviction positive read-through is stronger competitive positioning for a well-supplied incumbent, not a large immediate margin expansion inferred from spot-market quotations.
Near-term catalyst: Linde’s July 31 commentary on helium pricing, available volumes, and guidance assumptions. Longer-duration effect: Customer commitments signed during the disruption can extend the benefit beyond the shortage itself. Inventory replenishment economics and the duration of supply disruption remain important offsets.
EUROPEAN VOLUME WEAKNESS LIMITS THE CASE FOR A BROAD INDUSTRIAL-GAS REACCELERATION (READ-THROUGH 7)
Affected companies: Linde (LIN: United States) and Air Liquide (AI: France). Direction: Negative for European volume-driven upside, but not sufficient to establish a consolidated earnings downgrade. Magnitude: Moderate regional headwind; smaller group impact because of diversification, pricing, and productivity.
Menezes stated that “the industrial market in Europe is not growing.” Air Products’ earnings release made the distinction clearer: European sales increased approximately 6%, but volumes declined 2%, with currency, pricing, and energy pass-through explaining the reported growth. Operating income increased only approximately 2%, while operating margin declined. Revenue growth therefore overstated the improvement in underlying physical demand.
The transmission mechanism is weaker utilization and less incremental contribution against fixed operating costs. Merchant gases and customer-linked on-site volumes are exposed to industrial production, while inflation in labor, maintenance, distribution, and power can continue even when demand is flat. The resulting earnings burden must be offset through price increases, contractual protections, productivity, or favorable mix.
For Linde, this is consistent with its earlier Q1 disclosure of 3% lower EMEA volumes, particularly in chemicals, energy, and manufacturing. Air Products’ June-quarter experience provides additional evidence against assuming that the region had already entered a broad recovery. For Air Liquide, the implication is more restrained: its July 28 results already demonstrated strong margin improvement and continued profit growth, so weaker regional demand does not invalidate its operating-performance targets.
Near-term catalyst: The relevant question for subsequent peer updates is whether organic volumes improve, not whether reported revenue rises because of energy or currency. Longer-duration effect: Continued divergence between Asian electronics, selected Americas industrial markets, and Europe. This favors geographically diversified, contractually protected suppliers over a blanket thesis that all industrial-gas earnings will accelerate together. The call is not a sufficient basis for an indiscriminate short position in European industrial companies.
SEMICONDUCTOR MANUFACTURING
SAMSUNG’S GAS INFRASTRUCTURE VALIDATES A LONG-DATED FAB EXPANSION, NOT AN IMMEDIATE EQUIPMENT-ORDER OR EARNINGS SURPRISE (READ-THROUGH 8)
Affected company: Samsung Electronics (005930: South Korea). Direction: Positive for capacity-execution visibility and supply assurance. Magnitude: Meaningful for the relevant manufacturing expansion; limited incremental near-term group earnings information.
The call identified Samsung among the large electronics projects supporting Air Products’ backlog. The verified April 29 supply announcement specifies that Air Products will build, own, and operate facilities supplying nitrogen, oxygen, argon, and hydrogen to Samsung’s Pyeongtaek expansion. Importantly, those facilities are expected to enter service in phases from 2028 through 2030.
The transmission mechanism is the establishment of essential utility infrastructure for future manufacturing capacity. Committing to high-purity gas supply indicates that the expansion is progressing beyond a purely conceptual capacity plan. The build-own-operate model also places ownership of the dedicated gas-production assets with Air Products, while Samsung secures the required supply through a commercial relationship. This supports execution visibility, although it does not establish the total economic cost of Samsung’s commitments or a reduction in its overall capital budget.
The timing distinction is essential. The gas infrastructure schedule does not imply an immediate increase in Samsung’s 2026 or 2027 wafer output, nor does it identify a new award to a particular semiconductor-equipment supplier. Equipment orders, delivery, installation, gas availability, process qualification, and commercial production occur at different stages. Air Products’ award can corroborate an existing expansion without creating a fresh upstream order catalyst.
The call’s strong Asian helium and electronics commentary also supports supply-chain resilience, but does not establish Samsung-specific production volumes, yields, market share, or semiconductor selling prices. Samsung had released its own Q2 results earlier on July 30, making this primarily an independent infrastructure confirmation rather than a prediction of that quarter’s earnings.
Near-term catalyst: Limited incremental trading information unless Samsung changes the construction or ramp schedule. Longer-duration effect: Greater confidence in enabling capacity during 2028-2030, accompanied by the eventual requirement to earn adequate returns on the larger manufacturing base. The relevant cross-portfolio exposure is semiconductor capital-spending execution, not an immediate read-through to every equipment supplier or AI-related equity.
Report record
- Sector
- Materials
- Industry
- Industrial Gases
- Fiscal period end
- June 30, 2026
- Report date
- July 30, 2026
- Analysis
- 6138 words
- Read-throughs
- 2966 words
- Content fingerprint (PDF)
3c9cefa691e4- Content fingerprint (analysis)
f7054c4eee47- Content fingerprint (read-throughs)
142f31cd99fb
Prepared from the company's earnings release and earnings call transcript. Figures as reported by the company. For information only. Not investment advice.
More from Air Products and Chemicals Inc
No other reports yet.
All Air Products and Chemicals Inc reports
More in Materials
Follow @AtlasPeakRes on X for new earnings reports as they publish.