Operating recovery and capital discipline improve; NEOM’s price risk remains
Earnings Reports
Linde PLC FQ2 2026 Earnings Report
Linde PLC (LIN) FQ2 2026 earnings: Substantial revenue beat with limited incremental earnings conversion. Full earnings analysis, key read-throughs, and the one-page exhibit from Atlas Peak Research.
Linde PLC (LIN)
Sector: Materials · FQ2 2026 · Period end June 30, 2026 · Reported July 31, 2026
Linde’s Q2 2026 results support a hold stance rather than an aggressive increase in exposure. The quarter strengthened the long-term growth case through accelerating electronics demand, improving industrial volumes and a record $8.1 billion sale-of-gas backlog.
Download the one-page report (PDF)
View one-page exhibit
Download analysis (.md)
Download read-throughs (.md)
Post to X
One-Page Exhibit
Earnings Analysis
EXECUTIVE CALL SUMMARY: Linde plc (07/31/26)
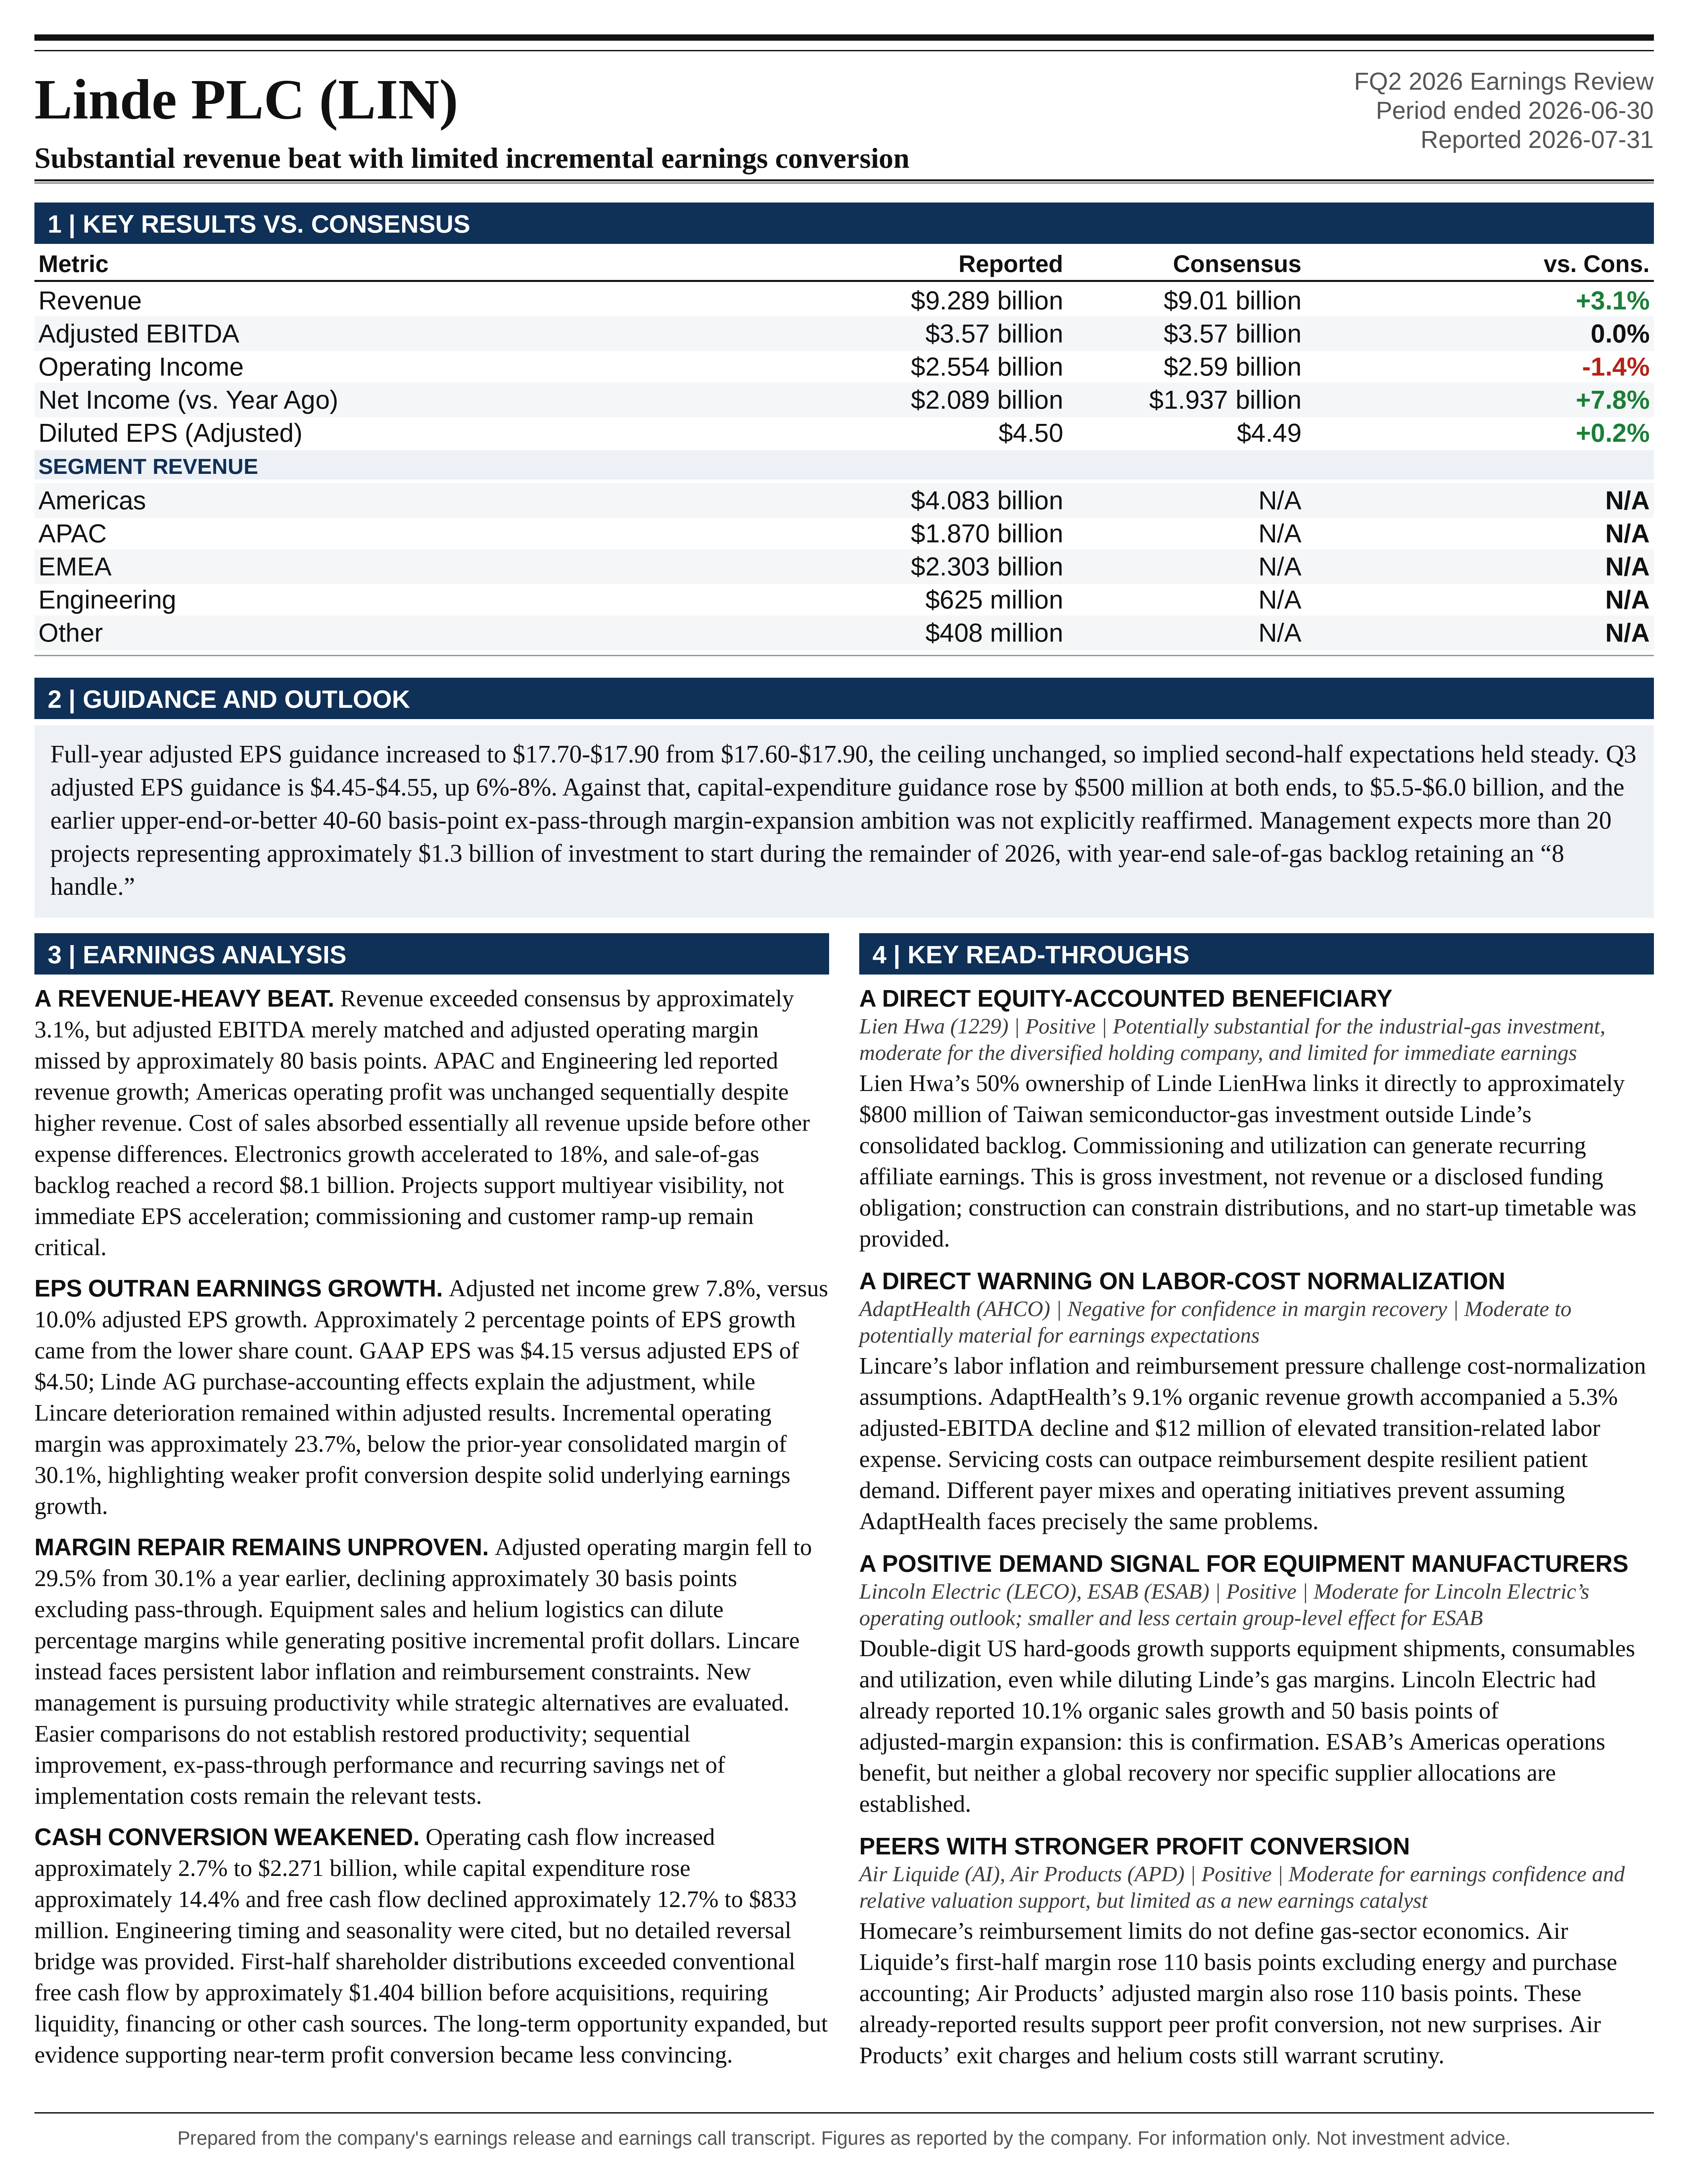
Linde’s Q2 2026 results support a hold stance rather than an aggressive increase in exposure. The quarter strengthened the long-term growth case through accelerating electronics demand, improving industrial volumes and a record $8.1 billion sale-of-gas backlog. However, it weakened the near-term earnings-quality case through margin compression, deteriorating US homecare profitability and slower cash conversion. The central investment question is no longer whether Linde can secure attractive growth projects. It is whether those projects, the recovering base business and corrective operating actions can restore margin expansion while funding a larger investment program.
Adjusted EPS of $4.50 increased 10% year over year but exceeded the Bloomberg consensus figure by only $0.01. Revenue of $9.289 billion exceeded consensus by approximately 3.1%, yet adjusted EBITDA merely matched expectations and adjusted operating margin missed by approximately 80 basis points. This was a substantial revenue beat with limited incremental earnings conversion, not a broad-based earnings beat. Operating cash flow increased approximately 3%, while free cash flow declined approximately 13%.
The full-year EPS revision was similarly limited. Guidance increased from $17.60-$17.90 to $17.70-$17.90, raising the midpoint by $0.05 to $17.80 without changing the ceiling. That midpoint increase exactly matches Q2 EPS exceeding the previous quarterly guidance midpoint by $0.05. Mechanically, the implied second-half earnings expectation was unchanged. Management explicitly declined to incorporate a sustained economic recovery into guidance.
The most consequential historical comparison is with the Q1 call. In May, CFO Matt White expressed confidence that full-year margin expansion, excluding cost pass-through, would reach the upper end or exceed the customary 40-60 basis-point range. Q2 instead produced a 30-basis-point decline on that basis. The July call did not explicitly reaffirm the earlier quantified ambition. Management continued to support the long-term margin-expansion thesis, but the near-term discussion shifted toward remediation, easier comparisons and additional cost actions.
The reported share-price decline of as much as 8.2% therefore appears more consistent with a reassessment of earnings quality, operating execution and valuation support than with the modest numerical shortfall in annual guidance alone. The favorable interpretation is that a strong industrial-gas franchise is experiencing a concentrated homecare problem and economically acceptable sales-mix dilution. The unfavorable interpretation is that persistent cost inflation, weaker cash conversion and a higher investment burden are reducing the reliability of the premium-compounder model. The next earnings report needs to distinguish between those interpretations.
QUARTERLY PERFORMANCE AND EARNINGS QUALITY
Revenue increased from $8.495 billion in Q2 2025 to $9.289 billion, a 9.3% increase using the disclosed dollar figures. Adjusted operating profit increased from $2.556 billion to $2.744 billion, or 7.4%. Adjusted net income increased from $1.937 billion to $2.089 billion, or 7.8%, while adjusted EPS increased from $4.09 to $4.50, or 10.0%.
The gap between net-income and EPS growth reflects a meaningful contribution from share repurchases. Dividing adjusted net income by adjusted EPS implies approximately 464 million diluted shares in Q2 2026 versus approximately 474 million a year earlier, a reduction of approximately 2%. Although these estimates are affected by rounding, they indicate that approximately 2 percentage points of EPS growth came from the lower share count. The quarter demonstrated solid underlying profit growth, but not 10% growth in the earnings pool itself.
The incremental operating margin on the year-over-year revenue increase was approximately 23.7%, below the prior-year consolidated margin of 30.1%. This calculation incorporates currency, acquisitions, energy pass-through and business mix, so it is not a pure measure of organic operating leverage. Nevertheless, it captures the central financial issue: incremental revenue generated less operating profit than the existing revenue base.
The year-over-year sales bridge further qualifies the headline growth. Management attributed approximately 2 percentage points to currency, 1 percentage point to acquisitions, 1 percentage point to Engineering and 1 percentage point to cost pass-through. Underlying sales increased 4%, consisting of 2% pricing and 2% volume growth. Almost half of the volume increase came from project start-ups. The remainder reflected activity in the US, China, Korea, India and Advanced Materials, rather than a synchronized global recovery.
Historical comparisons nevertheless show a genuine improvement. In Q2 2025, underlying sales grew only 1%, with 2% pricing offset by a 1% volume decline. Q1 2026 delivered 3% underlying growth, comprising 2% pricing and 1% volume growth. Q2 therefore extended the progression from declining volumes to modest growth and then a more visible recovery. The improvement is real, but the scale of the existing-business recovery remains considerably smaller than the 9% reported revenue growth suggests.
Sequentially, revenue increased approximately 5.8% and adjusted operating profit increased approximately 4.3%. EPS increased approximately 3.9% from $4.33. Underlying sales increased 4%, including 3% volume growth and 1% pricing, but management attributed more than half of the sequential volume increase to seasonality. The sequential acceleration should not be extrapolated as an equivalent structural improvement in industrial demand.
Against the Bloomberg estimates accompanying the call, revenue exceeded expectations by approximately $279 million, while adjusted operating profit exceeded expectations by approximately $14 million using the issuer’s exact reported profit. Adjusted EBITDA of approximately $3.57 billion matched consensus. Reported cost of sales was approximately $300 million above the notice’s estimate, absorbing essentially all of the revenue upside before other expense differences. GAAP operating profit of $2.554 billion was below the approximately $2.59 billion estimate.
GAAP EPS was $4.15, compared with adjusted EPS of $4.50. The release identifies Linde AG purchase-accounting effects as the adjustment underlying the quarter’s reported-to-adjusted earnings difference. The Lincare deterioration remained within adjusted results. This distinction matters because the operational problem was not removed through non-GAAP presentation.
MARGIN PERFORMANCE AND THE CHANGE FROM PRIOR EXPECTATIONS
Adjusted operating margin declined to 29.5% from 30.1% a year earlier and 30.0% in Q1. Excluding cost pass-through, the year-over-year decline was approximately 30 basis points. Approximately half of the reported decline therefore reflected the denominator effect of higher pass-through revenue, while the remainder represented adverse economics or business mix.
Management’s opening acknowledgment was unusually direct: “we are not satisfied with our margin performance for this quarter.” That statement appropriately distinguishes a technically defensible explanation for margin dilution from an acceptable overall outcome.
The sources of compression have different investment significance. Higher energy pass-through increases reported revenue without necessarily changing operating profit dollars. Higher hard-goods and electronics-equipment sales can reduce percentage margins while strengthening customer relationships and generating future gas demand. Helium logistics disruption can produce positive incremental profit dollars at a lower percentage margin. Lincare, by contrast, faces a more fundamental mismatch between labor and operating-cost inflation and reimbursement-linked revenue.
Treating all of these items as temporary would overstate the visibility of recovery. Equipment mix can normalize as gas sales follow installations, but continued equipment growth can also sustain dilution. Helium logistics costs may recede, but selling prices may normalize simultaneously. Homecare cost inflation and reimbursement constraints may persist unless operational changes or portfolio restructuring materially alter the economics.
The contrast with May guidance is material. On the Q1 call, White said full-year margin expansion should be “at the upper end or even above” the traditional 40-60 basis-point range, subsequently clarifying that the expectation excluded pass-through. The Q2 discussion offered no equivalent quantified reaffirmation. Instead, White emphasized weaker second-half 2025 comparisons and additional actions already underway.
This does not establish a formally quantified margin-guidance cut. It does establish a higher burden of proof. Easier comparisons can improve reported year-over-year performance without demonstrating that the underlying business has returned to its previous productivity trajectory. The relevant tests are sequential improvement, ex-pass-through performance and the magnitude of recurring savings net of implementation costs.
REGIONAL AND BUSINESS-SEGMENT PERFORMANCE
Americas revenue increased 7.1% to $4.083 billion, while operating profit increased 5.2% to $1.272 billion. Reported margin declined from 31.7% to 31.2%. Underlying sales increased 4%, split between 2% pricing and 2% volume growth, principally in electronics and manufacturing.
The sequential comparison is more revealing. Americas operating profit was unchanged from Q1 despite higher revenue, and reported margin declined from 31.6%. The largest regional business therefore failed to translate recovering activity into sequential profit growth. Management attributed the principal problem to US homecare and stated that Americas margins excluding that business would have increased 20 basis points year over year, excluding pass-through, and remained flat sequentially.
Americas pricing also moderated from 4% year over year in Q1 to 2% in Q2, while sequential pricing was flat. Management attributed some variation to escalation timing and emphasized that pricing remained consistent with expectations. Flat sequential pricing is not sufficient evidence of a deterioration in pricing power, but the moderation increases the importance of productivity and volume conversion when labor and other costs remain inflationary.
APAC revenue increased 13.0% to $1.870 billion, while operating profit increased 8.4% to $531 million. Reported margin declined from 29.6% to 28.4%, although it improved from 28.0% in Q1. Excluding pass-through, margin declined 70 basis points year over year but improved approximately 100 basis points sequentially.
APAC volume growth remained 6% for the second consecutive quarter, compared with a 1% decline in Q2 2025. However, the composition limits its usefulness as a pure demand indicator. Management identified positive base volumes, electronics-equipment sales and ramping ASEAN projects as contributors. The presentation also highlighted helium dislocation costs as a margin headwind. APAC is demonstrating strong growth, but the current sales mix produces less margin leverage than a comparable increase in mature merchant-gas demand would likely generate.
EMEA revenue increased approximately 6.5% to $2.303 billion, while operating profit increased approximately 5.5% to $823 million. Reported margin declined from 36.1% to 35.7%, but improved 10 basis points year over year excluding pass-through. Underlying sales increased only 1%, comprising approximately 2% pricing and a 1% volume decline.
EMEA remains a productivity-led rather than demand-led earnings contributor. Volume contraction improved from approximately 3% in Q1 and 4% in Q2 2025, but activity remained below the prior-year level. The region’s reported revenue growth materially overstates the recovery in underlying demand. Positive ex-pass-through margin performance despite weaker volumes nonetheless supports the resilience of the core industrial-gas operating model.
Engineering revenue increased approximately 13.4% to $625 million, and operating profit increased approximately 11.1% to $100 million. Margin was 16.0%, compared with 16.3% a year earlier and 19.5% in Q1. Management attributed profitability to project timing and the mix of intercompany and third-party plant sales. The sequential margin decline should therefore not automatically be treated as a structural deterioration.
Engineering order intake of $871 million exceeded quarterly revenue, producing a book-to-bill ratio of approximately 1.39. Third-party equipment backlog increased to $3.0 billion from $2.8 billion in Q1, although it remained below the $3.2 billion reported a year earlier. This supports near-term activity but does not establish a uniformly accelerating engineering cycle.
Global Other generated $408 million of revenue and $18 million of operating profit. Reconciliation of the prior-year segment figures implies an approximately $13 million loss in Q2 2025, making the year-over-year improvement approximately $31 million, or roughly 16% of consolidated operating-profit growth. The presentation attributed improvement to Advanced Materials and corporate-cost benefits. The entire increase should not be capitalized as recurring semiconductor-materials growth, because corporate expenses also contributed.
LINCARE: THE PRINCIPAL OPERATING AND PORTFOLIO ISSUE
Lincare is the most important company-specific negative emerging from the call. Management described persistent labor-cost inflation, reimbursement pressure and insufficient improvement from portfolio pruning. A new management team is pursuing operational improvements and productivity measures while strategic alternatives are evaluated.
The issue was not entirely new. On the May call, management disclosed that US homecare was relatively flat and that a policy change introduced in late 2025 had reduced services associated with a particular equipment category. That effect was expected to persist for several quarters. The July development was the more explicit recognition that the cumulative profitability impact had become a material obstacle to group margin performance.
The distinction between demand resilience and earnings resilience is central. Demographics can support patient demand while reimbursement mechanisms prevent revenue per patient from keeping pace with labor, delivery and service costs. Stable healthcare revenue therefore does not imply stable profitability. Lincare has materially different pricing and service economics from a large on-site industrial-gas contract.
Management did not answer directly whether Lincare was currently profitable. Nor did it disclose standalone revenue, operating margin or an exact full-year profit headwind. Those omissions limit both a turnaround valuation and a disposal analysis.
The exchange with Jeffrey Zekauskas suggests a quarterly headwind potentially around $40 million. Zekauskas proposed a $30 million quarterly impact, and White indicated the relevant figure was approximately 30% higher. However, the question also referenced an annual estimate, and no formal numerical bridge was supplied. Approximately $39 million is therefore a reasonable interpretation of the quarterly exchange, not a separately issued company forecast.
For scale, recovery of $40 million of quarterly operating profit would represent approximately $0.06-$0.07 of quarterly EPS assuming a 25% tax rate and approximately 464 million diluted shares. Sustained across a full year, that would equate to approximately $0.26 per share, or roughly 1.5% of the current annual EPS midpoint. This is an illustrative sensitivity rather than a forecast of recoverable earnings.
The strategic language was significant. Lamba said the business was being evaluated “both in part and as a whole” and needed to “earn its place in the portfolio.” Partial disposals, a broader sale or continued restructuring are therefore plausible outcomes. None was announced, and no timetable was provided.
A disposal could improve consolidated margin percentage without increasing absolute earnings. Its economic attractiveness would depend on the sale multiple, retained overhead, taxes, separation costs, remaining earnings and use of proceeds. A low valuation for a challenged asset could crystallize a weak return even if the remaining portfolio appears cleaner. Conversely, redeploying proceeds into attractive industrial-gas projects or sufficiently undervalued shares could improve long-term per-share value.
The immediate investment requirement is evidence that operational actions are stabilizing profitability. A strategic review is optionality, not a substitute for that evidence.
GUIDANCE: A HIGHER FLOOR WITHOUT A HIGHER SECOND-HALF OUTLOOK
The guidance progression is consistent with reduced downside risk rather than a materially higher earnings trajectory. Initial 2026 guidance issued in February was $17.40-$17.90. In May, the floor increased to $17.60 while the ceiling remained $17.90. In July, the floor increased again to $17.70, with the ceiling still unchanged.
The midpoint has increased from $17.65 initially to $17.75 in May and $17.80 currently. The latest midpoint increase was approximately 0.3%. This is modest relative to the strengthening electronics outlook, improving volumes and record backlog.
Q2 EPS reached the top of the prior $4.40-$4.50 quarterly range. Using Q1 EPS of $4.33, the previous annual midpoint and previous Q2 midpoint implied second-half EPS of $8.97. Using actual Q2 EPS of $4.50 and the new annual midpoint also implies $8.97. The annual raise therefore does not mechanically require any improvement in expected second-half earnings.
Management confirmed that interpretation: “we’re leaving the back-half guidance assumption the same as before.” Improving base volumes were acknowledged, but management wanted additional quarters of evidence before incorporating the trend.
Q3 guidance of $4.45-$4.55 implies a midpoint of $4.50, unchanged sequentially and approximately 6%-8% above the prior-year quarter. Management expects currency to be neutral year over year but approximately 1% unfavorable sequentially. Excluding that sequential currency headwind, the midpoint represents approximately $0.05 of improvement from Q2. That is consistent with modest operating progress, not an immediate earnings step-change.
At the Q3 midpoint, annual guidance implies approximately $4.37-$4.57 of Q4 EPS, with a midpoint of $4.47. Compared with Q4 2025 EPS of $4.20, the midpoint implies approximately 6.4% growth. These are analytical residuals, not separately issued Q4 guidance, and quarterly versus annual share-weighting differences can create minor discrepancies.
The guidance framework therefore contains near-term deceleration from the 10% EPS growth achieved in both Q1 and Q2. It incorporates corrective actions but does not assume a major cyclical recovery or a large incremental helium windfall.
There are important source inconsistencies. The Bloomberg notice lists Q3 consensus EPS of $4.47, which is below the $4.50 guidance midpoint. The accompanying analyst commentary nevertheless describes Q3 guidance as below expectations. Those statements may reflect different forecasts, timing or individual analyst models, but the displayed consensus number does not support calling Q3 a numerical consensus miss. Full-year guidance is more straightforward: the $17.80 midpoint is approximately $0.08, or 0.4%, below the notice’s $17.88 consensus.
The call transcript also describes annual growth of 8%-9% as excluding a 1% currency benefit. The written release, presentation and comparison with 2025 EPS of $16.46 establish that approximately 8%-9% is reported growth including the assumed benefit. Constant-currency growth is approximately 7%-8%. The written materials provide the internally consistent interpretation.
ELECTRONICS AND BACKLOG: STRONGER VISIBILITY, NOT IMMEDIATE EARNINGS
Electronics was the clearest positive operating development. End-market growth accelerated to 18% from 10% in Q1, supported by project start-ups and demand associated with AI hardware. The presentation’s end-market growth definition excludes currency, pass-through, acquisitions and nonrecurring equipment sales. The 18% figure is therefore a cleaner demand indicator than APAC’s equipment-influenced aggregate volume growth.
The $1 billion Arizona award increased sale-of-gas backlog from $7.1 billion in Q1 to a record $8.1 billion. Linde’s separate announcement specifies 2 new SPECTRA air-separation units and associated infrastructure, complementing 3 existing units and supplying ultra-high-purity nitrogen, oxygen and argon to 2 additional semiconductor fabs.
The award strengthens an existing industrial-gas complex rather than establishing an isolated supply position. That can improve network density, operational coordination and opportunities for incremental specialty-gas sales. However, the disclosed economics do not establish unusually high returns relative to other on-site projects.
Customer identity also requires precision. An analyst referred to TSMC during the call, but management’s prepared remarks and the official project announcement described a major semiconductor manufacturer without naming it. The analyst’s identification should not be presented as an explicit management confirmation.
Construction had already started under reimbursable letters of intent while final supply contracts were completed. The backlog addition therefore represents formalization of work already progressing, not an entirely new construction program beginning on the announcement date. Reimbursability reduces some pre-contract exposure, but detailed termination protections and customer obligations were not disclosed.
Management expects more than 20 projects representing approximately $1.3 billion of investment to start up during the remainder of 2026, while year-end sale-of-gas backlog retains an “8 handle.” Starting from $8.1 billion, deducting $1.3 billion of commissioning would leave approximately $6.8 billion before additions. Ending at $8.0-$8.9 billion would require approximately $1.2-$2.1 billion of additional net awards, ignoring currency, cancellations and other adjustments.
That is a meaningful commercial target. It implies replenishment at least comparable to the expected commissioning outflow. It remains an expectation dependent on contract conversion, not an already secured year-end balance.
Backlog definitions are essential. The $8.1 billion sale-of-gas backlog represents project investment supported by long-term supply agreements. It is not future revenue. The $3.0 billion Engineering backlog represents future third-party plant sales. The combined $11.1 billion headline adds different economic measures and should not be used as a uniform revenue-coverage statistic.
White described annual revenue relative to project capital as historically ranging from 20%-50%, depending on gas type and energy pass-through or tolling. Applied illustratively to $1 billion of investment, that suggests approximately $200-$500 million of annual revenue after ramp-up. It is not project-specific guidance. A higher revenue-to-capital ratio driven by pass-through does not necessarily indicate superior economic returns.
Management reiterated that projects meet post-tax, unlevered, double-digit IRR criteria. It also rejected the assumption that electronics on-sites inherently generate better investment returns than other end markets: “we don’t really see much disparity in on-site returns by end market.” Higher purity and redundancy requirements can require additional capital, offsetting some apparent pricing advantage.
The more differentiated opportunity lies in incremental specialty, rare and process gases supplied around semiconductor clusters. Those products can provide attractive additional margin opportunities, but their scale and timing were not quantified.
Projects typically require approximately 2-3 years of execution, followed by customer ramp-up. The backlog supports multiyear growth visibility, not an immediate 2026 EPS acceleration. Commissioning timing, utilization, customer readiness and total installed cost remain critical to realized returns.
TAIWAN JV: ADDITIONAL EXPOSURE WITH DIFFERENT ACCOUNTING
The Taiwan joint venture plans approximately $800 million of investment in air-separation and hydrogen-production facilities serving new fabs and advanced packaging. These projects are excluded from the consolidated sale-of-gas backlog.
The Q1 call identified the Taiwan operation as a nonconsolidated 50% joint venture. The announced investment therefore represents approximately $400 million of proportionate economic exposure at that ownership level, not necessarily an equivalent cash contribution by Linde. Funding arrangements were not disclosed.
Neither the entire $800 million nor the venture’s eventual revenue should be added to consolidated backlog, capital expenditure or sales. The projects add economic growth potential through Linde’s ownership interest, but the accounting presentation differs from wholly consolidated operations.
The combination of US and Taiwan awards broadens geographic exposure while potentially increasing concentration in the same customer and semiconductor investment cycle. Geographic diversification does not eliminate customer-capex concentration.
MANUFACTURING, AEROSPACE AND COMMERCIAL SPACE
Manufacturing improvement was led by the US, with additional growth in APAC. US packaged-gas sales increased at a mid-to-high-single-digit rate, while hard goods increased at a double-digit rate. Those patterns are consistent with greater fabrication, construction and industrial activity.
Hard-goods growth is a useful leading indicator because customers often acquire equipment and consumables as activity expands. However, the same general pattern was already visible on the Q1 call. Q2 strengthened evidence that the recovery was continuing rather than introducing an entirely new inflection.
Aerospace contributed more than 33% of manufacturing growth. That is an important contributor, but it should not be equated entirely with commercial-space launches. Linde also serves commercial aviation and associated materials and coating applications. Management’s positive Advanced Materials commentary reflected aerospace, commercial-space activity and other applications.
Data-center construction provides another route to AI-related demand through fabrication, welding, metals and construction activity. Together with semiconductor gases, this creates several channels of exposure to the same capital-spending cycle. Those channels are operationally distinct but not necessarily independent portfolio risk factors.
Metals and mining were stronger in the US and Brazil, while chemicals and energy growth depended substantially on APAC project contributions. Management did not describe a broad global chemicals recovery. Elsewhere, conditions remained uneven or broadly flat.
The commercial-space outlook remained a $1 billion-plus opportunity by approximately 2030, rather than a newly increased target. Higher base capital expenditure indicates that Linde is investing ahead of expected customer demand, but the call did not disclose a current revenue base sufficient to calculate the required growth rate reliably.
Make-versus-buy behavior is a significant qualification. Large space customers with access to capital may build their own atmospheric-gas facilities. Linde can still participate through plant sales and operating-and-maintenance arrangements, but the resulting revenue duration, capital intensity and margin structure differ from recurring gas supply.
Management emphasized that it would pursue both models: “we will play for both sale of gas, as well as sale of plant.” That supports continued participation in customer spending, but does not make the economics interchangeable.
Hydrogen may be more resistant to customer insourcing at present. White stated that the observed vertical-integration dynamic primarily involved atmospheric gases rather than hydrogen. Nevertheless, Linde’s opportunity depends on launch frequency, vehicle size and propellant choice, not simply the number of launches. Commercial-space growth is attractive optionality, but its ultimate profit pool remains sensitive to technology and customer decisions.
HELIUM AND MIDDLE EAST DISRUPTION
The helium discussion supports a competitive-positioning thesis more strongly than a near-term windfall thesis. Linde cited diversified sources, cavern storage, logistics capabilities and tank availability as advantages in maintaining contracted supply and signing additional long-term customers.
Those capabilities can produce enduring benefits if customers place greater value on reliability after disruption. However, higher pricing was accompanied by increased sourcing and logistics costs. White stated: “the contribution on a dollar basis, it is positive,” while explaining that the gross-up in revenue and costs was dilutive to percentage margin.
This distinction prevents opposing errors. Margin dilution does not establish that the incremental helium business is destroying profit dollars. Conversely, higher helium prices do not establish that Linde is earning a large scarcity-driven margin windfall.
The May call indicated that approximately 85%-90% of helium sales were contracted. That structure limits a simple read-through from spot prices to near-term company earnings and makes contract repricing, mix and supply-cost timing important.
Guidance assumptions were unchanged from the earlier framework. Management did not incorporate a material new helium benefit into the annual outlook, despite better pricing and customer wins. That leaves possible upside, but not a disclosed earnings reserve of known size.
Lamba expected normalization to extend beyond the resolution of Strait of Hormuz disruption because production, shipping, tank positioning and logistics must recover together. Importantly, he declined to confirm that 2027 would necessarily benefit: “Helium will be normalized next year. I think we’ll have to wait and see what that means.”
Normalization could improve volumes and reduce dislocation costs while also reducing scarcity pricing. The net earnings effect remains uncertain. A 2027 model should not automatically include the full benefit of both lower costs and sustained peak pricing.
The wider regional impact also extends beyond helium. Management described reduced industrial activity in hydrocarbon-dependent Asian markets, including India, parts of ASEAN, Australia and, to a lesser extent, China. Resolution could improve demand, but the call provided no quantified recovery contribution.
CASH FLOW, CAPITAL EXPENDITURE AND RETURNS
Cash conversion was weaker than earnings growth. Operating cash flow increased from $2.211 billion to $2.271 billion, approximately 2.7%. Capital expenditure increased from $1.257 billion to $1.438 billion, approximately 14.4%. Free cash flow consequently declined from $954 million to $833 million, approximately 12.7%.
Free cash flow represented approximately 39.9% of adjusted net income, compared with 49.3% a year earlier. Operating cash flow still exceeded adjusted net income, which is reassuring, but a larger share of cash generation was absorbed by investment.
Against the Bloomberg notice’s estimates, operating cash flow was approximately $929 million below expectations and free cash flow approximately $1.127 billion below expectations. The majority of the free-cash-flow shortfall therefore came from operating cash flow rather than capital expenditure alone.
Management attributed part of the weakness to unfavorable Engineering timing and reiterated that first-half cash generation is seasonally lower. Those explanations are plausible in a project business, where collections and recognized earnings do not necessarily coincide. However, the call did not provide a detailed cash bridge sufficient to verify the amount or timing of reversal.
Combining the Q1 and Q2 releases produces first-half operating cash flow of $4.511 billion, capital expenditure of $2.780 billion and free cash flow of $1.731 billion. Shareholder distributions totaled $3.135 billion. Dividends and net repurchases therefore exceeded conventional free cash flow by approximately $1.404 billion before acquisitions.
This is not evidence of immediate financial distress. It does show that current-period cash remaining after all capital expenditure did not fully fund shareholder returns. The difference requires balance-sheet liquidity, financing or other cash sources. Buybacks contributed to EPS growth, but they should be assessed alongside the investment program and funding requirements.
Management’s “available cash flow” measure deducts base capital expenditure rather than total capital expenditure. It is useful for showing cash available before discretionary growth investment, but it is not equivalent to cash available after all investment. The presentation showed approximately $1.3 billion of first-half base capital expenditure, $1.9 billion of secured growth investment and $3.1 billion of shareholder returns.
Full-year capital-expenditure guidance increased by $500 million at both ends, from $5.0-$5.5 billion to $5.5-$6.0 billion. The midpoint increased approximately 9.5%. Management attributed the increase to new project wins and commercial-space-related base investment.
After first-half spending of $2.780 billion, the new range implies second-half capital expenditure of approximately $2.720-$3.220 billion. The immediate spending burden is therefore manageable relative to the first-half pace, but higher investment raises the importance of operating-cash-flow recovery.
Reported return on capital was 23.5%, compared with approximately 24% in the Q1 discussion and 24.2% for 2025. The measure remains strong, but its direction is worth monitoring as more capital enters construction and early ramp-up. A temporary decline from growth investment differs economically from deterioration in mature-asset returns. The call did not fully separate those effects.
2027 EARNINGS FRAMEWORK AND SCENARIOS
Management reiterated an EPS algorithm of 8%-12% growth from operating actions and capital allocation, provided the macro environment does not subtract materially from those drivers. This was not formal 2027 guidance. Applied to the current $17.80 midpoint, it would imply approximately $19.22-$19.94 of 2027 EPS.
The algorithm already incorporates capital allocation and operating execution. Project growth, productivity, pricing and buybacks should not all be added again on top of the stated range. Incremental macro recovery or exceptional helium performance would need to be demonstrably additional.
An illustrative base case, assigned a 55% probability, assumes 2026 EPS within $17.70-$17.90 and 2027 EPS of approximately $19.20-$19.90. Lincare stabilizes, equipment-related dilution becomes less pronounced, project commissioning proceeds broadly as expected and underlying volumes remain modestly positive. This case requires better execution but not a strong global industrial recovery.
An illustrative bull case, assigned a 25% probability, assumes 2026 EPS of approximately $17.90-$18.10 and 2027 EPS of $20.10-$20.50. US manufacturing strength broadens, electronics remains strong, helium cost normalization outpaces price erosion and Lincare improves materially or is restructured on attractive terms. Earnings exceed the ordinary algorithm because several favorable developments occur together.
An illustrative bear case, assigned a 20% probability, assumes 2026 EPS of approximately $17.30-$17.60 and 2027 EPS of $17.80-$18.70. Homecare remediation disappoints, industrial recovery remains narrow, project ramps slip and inflation absorbs pricing and productivity. This case does not require a severe recession; continued execution shortfalls could be sufficient.
These analytical scenarios produce probability-weighted 2027 EPS of approximately $19.5. They are not company guidance, consensus forecasts or a share-price target. Their principal implication is that the earnings outlook remains constructive, while the distribution has become more dependent on margin repair and cash conversion.
VALUATION, PORTFOLIO IMPLICATIONS AND DECISION CRITERIA
The earnings call does not establish that the shares became inexpensive after the reported decline. An 8.2% drawdown is not itself a valuation argument. The Bloomberg notice’s cited targets of $559, $575 and $600 are mechanically equivalent to approximately 31.4x, 32.3x and 33.7x the updated 2026 EPS midpoint, although those calculations do not reproduce the analysts’ actual valuation methodologies.
At those earnings multiples, small changes in confidence can matter more than modest annual EPS revisions. Approximately 10% EPS growth combined with a 10% multiple contraction produces essentially flat price performance before dividends. Each 1x change in the multiple applied to approximately $19.5 of 2027 EPS changes indicated equity value by approximately $19.5 per share.
The positive investment case rests on recurring industrial-gas relationships, project underwriting discipline, network advantages, electronics exposure and a credible multiyear growth pipeline. The negative case rests less on collapsing demand than on lower operating leverage, an unresolved noncore business, cash-conversion pressure and the possibility that a premium valuation requires more consistent execution than the current quarter delivered.
Linde can diversify direct semiconductor product and technology risk, but it does not eliminate AI-capital-spending exposure. Semiconductor fabs, data-center construction and related metals and fabrication activity connect several growth channels to a common investment cycle. In a portfolio already concentrated in AI infrastructure, Linde should not automatically be classified as an independent defensive offset.
The appropriate action is to retain appropriately sized core exposure while deferring aggressive additions until operating evidence improves or valuation provides sufficient protection without assuming a rapid margin recovery. A portfolio-specific position size, absolute entry level and price stop cannot be established without a verified entry valuation, holdings and risk budget. For scale, a hypothetical 1% NAV allocation with a 10% adverse-price exit threshold would budget approximately 10 basis points of NAV loss before slippage or gaps; actual losses could exceed that amount.
The next scheduled reporting catalyst, identified on the call as October, should provide evidence on sequential Lincare improvement, ex-pass-through margins, additional cost actions and second-half cash generation. Year-end backlog is another measurable test: achieving an $8 billion-plus balance after the planned commissioning would validate continued commercial replenishment. Early 2027 guidance will test whether the 8%-12% algorithm remains achievable without relying on an assumed helium windfall.
The principal thesis-break conditions are continued deterioration in homecare despite intervention, failure of core gas margins to improve, operating cash flow persistently lagging earnings without a clear reversal, or project delays and cost overruns that undermine expected investment returns. A portfolio disposal that improves margin optics while destroying economic value would also warrant a negative reassessment.
Conversely, simultaneous improvement in margins and cash conversion, continued positive base volumes and successful backlog replenishment would substantiate the view that Q2 represented a repairable execution setback rather than a deterioration in the industrial-gas franchise. The long-term opportunity expanded during the quarter. The evidence supporting near-term profit conversion became less convincing.
COMPANY EMPLOYEES ON THE CALL
• Juan Pelaez, Head of Investor Relations. • Matt White, Chief Financial Officer. • Sanjiv Lamba, Chief Executive Officer.
RESEARCH ANALYSTS ON THE CALL
• Abigail Eberts, Wells Fargo. • Arun Viswanathan, RBC Capital Markets. • David Begleiter, Deutsche Bank. • James Hooper, Bernstein. • Jeffrey Zekauskas, JPMorgan. • John McNulty, BMO Capital. • Josh Spector, UBS. • Kevin McCarthy, Vertical Research Partners. • Laurent Favre, BNP Paribas. • Matthew DeYoe, Bank of America. • Patrick Cunningham, Citi. • Patrick “Duffy” Fischer, Goldman Sachs Group. • Vincent Andrews, Morgan Stanley.
Key Read-Throughs
KEY READ-THROUGHS FROM LINDE’S Q2 2026 EARNINGS CALL
Linde’s call supports selective exposure to semiconductor infrastructure, US fabrication activity and established industrial-gas networks, rather than a broad global cyclical recovery trade. Electronics growth of 18%, double-digit US hard-goods growth and substantial new gas-supply commitments provide tangible evidence of customer investment and industrial activity. Conversely, Lincare demonstrates that resilient healthcare demand does not protect profitability when reimbursement fails to keep pace with service costs. The most actionable implications concern direct ownership relationships, identifiable customer infrastructure and businesses exposed to the same operating pressures. The analysis below uses the information available at the July 31, 2026 call; subsequent reporting dates are identified as catalysts from that historical vantage point, not as events still pending today. Countries denote corporate domicile, and magnitude refers to fundamental business impact rather than a predicted share-price move.
SEMICONDUCTOR INFRASTRUCTURE: A DIRECT EQUITY-ACCOUNTED BENEFICIARY OUTSIDE LINDE’S CONSOLIDATED BACKLOG (READ-THROUGH 1)
Affected company: Lien Hwa Industrial Holdings Corporation (1229: Taiwan). Direction: positive. Magnitude: potentially substantial for the industrial-gas investment, moderate for the diversified holding company, and limited for immediate earnings.
The clearest less-obvious beneficiary is Lien Hwa Industrial Holdings, which owns 50% of Linde LienHwa Industrial Gases. Its 2025 consolidated financial statements identify that ownership interest and account for the investment using the equity method. Lamba disclosed that the Taiwan joint venture would invest approximately $800 million to build, own and operate air-separation and hydrogen-production facilities supplying semiconductor fabs and advanced packaging. He explicitly stated that these projects were “not included in the backlog.”
The transmission mechanism is direct ownership of the awarded operating business, not a thematic association with semiconductor spending. New facilities create additional contracted gas-supply capacity; commissioning and customer utilization subsequently generate affiliate earnings attributable to Lien Hwa. The investment therefore provides exposure to the semiconductor expansion through a business that is not separately listed and is absent from Linde’s consolidated sales and sale-of-gas backlog.
The accounting distinction is essential. The $800 million represents gross project investment, not revenue, profit or a cash distribution to either shareholder. At 50% ownership, approximately $400 million describes Lien Hwa’s proportionate economic exposure to the investment program, not a disclosed equity-funding obligation. The actual shareholder contribution depends on venture-level borrowing, retained cash and financing arrangements. Incremental earnings enter through the equity-accounted investment; future dividends depend on cash generation and capital requirements.
Near-term relevance is principally recognition of the holding company’s exposure and clarification of project funding and commissioning milestones in subsequent disclosures. No project-specific start-up timetable was provided. The fundamental effect is longer duration: a larger installed base of essential semiconductor infrastructure can increase recurring affiliate earnings after construction and ramp-up. Near-term cash distributions could remain constrained while that capacity is built.
The principal cross-portfolio implication is that Lien Hwa offers a different ownership route to the same semiconductor investment cycle, not independent diversification from it. Fab delays, weaker utilization or customer concentration would affect both the venture’s returns and the value of the holding-company exposure. Nevertheless, this is a higher-conviction beneficiary than an equipment supplier whose participation in the projects has not been disclosed.
SEMICONDUCTOR MANUFACTURING: TANGIBLE EXECUTION EVIDENCE FOR TSMC’S EXPANSION, NOT AN ADDITIONAL CUSTOMER CAPEX ANNOUNCEMENT (READ-THROUGH 2)
Affected company: Taiwan Semiconductor Manufacturing Company (2330: Taiwan). Direction: positive for capacity-execution confidence. Magnitude: moderate for multiyear infrastructure readiness, but small for immediate earnings revisions.
Linde added $1 billion of electronics investment to its backlog to support advanced-node fabs in Arizona, alongside the approximately $800 million Taiwan joint-venture program. Lamba emphasized that construction had already begun under “reimbursable LOIs while the supply contracts were finalized.” This is stronger evidence of implementation than an expression of customer interest: essential utility infrastructure was already being built before final contract execution.
The TSMC relationship has an established factual basis. Linde’s Q2 2024 call explicitly identified its Phoenix Phase 1 supply system as serving TSMC. On the current call, Matthew DeYoe congratulated management on securing the TSMC business. However, Linde’s new project announcement and prepared remarks did not explicitly name the customer. The connection is therefore strongly supported by the existing relationship, geography and analyst identification, but the new award should not be characterized as an unambiguous management confirmation of customer identity.
The economic channel is reliable access to ultra-high-purity nitrogen, oxygen, argon and, in Taiwan, hydrogen. Gas purity, redundancy and supply continuity are prerequisites for operating advanced fabs and packaging facilities. Expanding the gas network reduces an identifiable infrastructure constraint on customer capacity deployment. The Arizona announcement specifies 2 additional air-separation units supplementing 3 existing units, supporting the interpretation of a deepening supply relationship rather than an isolated installation.
This is principally corroboration of an expansion already disclosed by the customer. TSMC had reported on July 16 and announced a larger 2026 capital budget and further Arizona investment before Linde’s call. The gas award strengthens confidence that supporting infrastructure is progressing; it does not independently establish a further increase in TSMC’s spending plan.
The outsourced structure also matters. Linde’s $1 billion investment is not automatically an additional $1 billion of TSMC capital expenditure. Linde owns the gas assets and earns a return through the supply arrangement. The customer obtains infrastructure and operating services through contractual payments rather than necessarily owning the production equipment.
Near-term trading relevance is limited to execution confidence and subsequent customer capacity updates. The more meaningful fundamental effect unfolds as fabs qualify and utilization increases over several years. No specific incremental wafer output, start-up date or EPS contribution was disclosed.
The negative qualification is that infrastructure readiness does not eliminate overseas manufacturing costs, future depreciation or utilization risk. Nor does this announcement automatically create fresh orders for every semiconductor-equipment company: some upstream equipment may already have been ordered, and gas-project construction does not identify tool suppliers. The high-conviction conclusion is improved evidence of physical execution, not a blanket upgrade to the entire semiconductor supply chain.
HOME MEDICAL EQUIPMENT: A DIRECT WARNING ON LABOR-COST NORMALIZATION AND REIMBURSEMENT-CONSTRAINED MARGINS (READ-THROUGH 3)
Affected company: AdaptHealth Corporation (AHCO: United States). Direction: negative for confidence in margin recovery. Magnitude: moderate to potentially material for earnings expectations, with a more immediate catalyst than most other read-throughs.
Lincare’s deterioration is directly relevant to other US home medical equipment providers. Lamba attributed the pressure to “labor cost inflation and changes in reimbursement environment.” White added that pricing in the business was “probably not keeping up with what it needs to be.” These statements identify a specific economic problem: service-delivery costs can rise faster than reimbursement-linked revenue even when patient demand remains stable.
AdaptHealth has substantial exposure to home respiratory and related equipment services. Its own May 5 results made Linde’s warning particularly relevant. AdaptHealth reported 9.1% organic revenue growth, but adjusted EBITDA declined 5.3%. It also disclosed $12 million of elevated labor expense associated with a major customer transition, stating that most variable costs should normalize by the end of Q2.
The precise transmission mechanism is weaker incremental profitability when patient servicing, delivery, staffing and administrative requirements grow faster than realized reimbursement. Additional revenue does not necessarily produce attractive incremental EBITDA if each patient requires more labor or if operating costs remain elevated after the initial onboarding period. Lincare’s experience provides independent evidence that cost normalization in this operating environment cannot simply be assumed.
The near-term catalyst was AdaptHealth’s August 4 earnings release, scheduled only days after Linde’s call. The critical issue at that event was whether transition-related labor expenses had normalized as expected and whether revenue growth was converting into EBITDA and cash flow. Linde’s commentary raised the evidentiary hurdle for accepting that recovery without detailed operating support.
Magnitude can be illustrated without transferring Lincare’s losses into AdaptHealth’s model. If an additional $10 million of quarterly expense persisted for 4 quarters, the annual burden would be $40 million, approximately 5.7% of AdaptHealth’s $705 million annual adjusted-EBITDA guidance midpoint. This is a sensitivity, not a forecast, but it demonstrates why relatively modest cost persistence can materially affect earnings expectations.
The important limitation is that the businesses have different payer mixes, product portfolios, contracts and operating initiatives. Lincare’s experience does not prove that AdaptHealth faced the same reimbursement change or that its customer-transition costs would persist. AdaptHealth’s strong organic growth is also counterevidence against an industry-wide demand problem.
The high-conviction negative read-through is therefore concentrated on profitability and cash conversion, not patient demand. The longer-duration distinction is between providers that can improve service productivity and those whose reimbursement structures leave them exposed to sustained cost inflation. Lincare’s strategic review should not be treated as an automatic acquisition opportunity for competitors, because no disposal process, buyer or transaction economics were disclosed.
WELDING AND FABRICATION: LINDE’S LOW-MARGIN SALES MIX IS A POSITIVE DEMAND SIGNAL FOR EQUIPMENT MANUFACTURERS (READ-THROUGH 4)
Affected companies: Lincoln Electric Holdings (LECO: United States) and ESAB Corporation (ESAB: United States). Direction: positive. Magnitude: moderate for Lincoln Electric’s operating outlook; positive for ESAB’s Americas welding operations, with a smaller and less certain group-level effect.
Linde reported double-digit growth in US hard goods and mid-to-high-single-digit growth in packaged gases. Lamba described hard-goods sales as “a good leading indicator” of manufacturing recovery and said customer feedback supported continued momentum in the second half. Manufacturing strength included aerospace and construction associated with data centers.
The transmission mechanism differs between the distributor and the manufacturer. More welding equipment and consumables can dilute an industrial-gas distributor’s percentage margin because those products carry lower margins than gas. For welding manufacturers, however, the same activity supports equipment shipments, consumable demand and potentially factory utilization. Linde’s adverse sales mix is therefore not automatically adverse for the companies manufacturing the products being sold.
The simultaneous improvement in gases and hard goods strengthens the signal. Equipment purchases alone could reflect channel restocking or sporadic capital spending. Greater packaged-gas demand alongside hard-goods growth is more consistent with active fabrication and customer throughput, although it does not eliminate inventory effects.
For Lincoln Electric, this was confirmation rather than a prediction of an unreleased quarter. The company had reported on July 30, showing 10.1% organic sales growth and a 50-basis-point increase in adjusted operating margin. Its management also cited improved demand and capital spending in the Americas and APAC. Linde’s next-day commentary increased confidence that the improvement extended beyond a single manufacturer’s product execution.
ESAB offered the more immediate event opportunity from the July 31 vantage point because its earnings release was scheduled for August 6. Its Q1 commentary had already described US acceleration, while global core organic sales declined approximately 1%. Linde’s evidence supported a more constructive assessment of US demand, but not an assumption that European and Asian weakness had disappeared or that the group would match Linde’s hard-goods growth rate.
The near-term mechanism is continued sell-through and subsequent distributor replenishment. The longer-duration mechanism is a larger installed base of fabrication equipment generating recurring consumable demand, supported by aerospace, industrial investment and data-center construction.
Supplier allocation remains undisclosed. The call does not establish how much of Linde’s growth belonged to Lincoln Electric or ESAB, and it does not identify either as the supplier on a particular transaction. The conclusion rests on shared product and end-market exposure.
The portfolio distinction is also important: this is a stronger signal for US fabrication-linked businesses than for a generalized global manufacturing recovery. Linde explicitly did not identify a fundamental improvement in chemicals and energy. US welding exposure should therefore not be treated as interchangeable with European chemical or broad industrial demand exposure.
INDUSTRIAL GASES: LINDE’S MARGIN PROBLEM SHOULD NOT BE EXTRAPOLATED TO PEERS WITH STRONGER PROFIT CONVERSION (READ-THROUGH 5)
Affected companies: Air Liquide (AI: France) and Air Products and Chemicals (APD: United States). Direction: positive for relative fundamental positioning versus an indiscriminate sector downgrade. Magnitude: moderate for earnings confidence and relative valuation support, but limited as a new earnings catalyst.
Linde stated that Americas margins excluding US homecare would have increased 20 basis points year over year, excluding pass-through. Management also said consolidated margins would have increased without the homecare impact. Meanwhile, underlying sales rose 4%, pricing increased 2%, electronics grew 18%, and base industrial activity improved in selected markets.
These disclosures separate a company-specific portfolio problem from the economics of industrial-gas supply. Lincare’s reimbursement constraints are not representative of contractual gas pricing, on-site supply arrangements or industrial merchant distribution. Applying Linde’s consolidated margin decline across the sector would therefore mix materially different business models.
Peer results available before the call reinforced that distinction. Air Liquide’s July 28 report showed first-half operating-margin expansion of 110 basis points excluding energy and purchase-accounting effects. It reiterated a 100-basis-point improvement objective for 2026 and reported a record €6 billion investment backlog, including substantial electronics commitments.
Air Products had reported on July 30, delivering 12% adjusted EPS growth and a 110-basis-point improvement in adjusted operating margin. It also disclosed a new Taiwan semiconductor supply agreement involving 4 air-separation units. Those results demonstrate that Linde’s margin deterioration was not an industry-wide outcome.
The transmission mechanism for Air Liquide is continued merchant-gas demand, US industrial activity through Airgas, and conversion of its own electronics projects into recurring supply revenue. For Air Products, it is greater utilization, new on-site contributions and its separately awarded semiconductor projects. Linde’s market commentary corroborates those demand drivers; it does not transfer Linde’s contracts or backlog to competitors.
Near-term trading relevance was primarily relative performance if Linde’s sharp decline triggered sector-wide selling. Neither peer’s already published results should be presented as a forthcoming earnings surprise. The next fundamental tests were subsequent 2026 trading updates and project execution.
Air Products also requires a separate capital-allocation assessment. Its July results included substantial charges associated with project exits. Strong underlying gas demand does not erase those losses or establish equivalence with Air Liquide’s earnings quality.
Helium is an additional qualification rather than a clean bullish catalyst. Linde said pricing was improving, but dislocation costs absorbed part of the benefit; White emphasized that incremental profit dollars were positive while percentage margins were diluted. Air Products also reported distribution and dislocation costs, alongside improved helium volumes in Asia. The supported conclusion is that reliable networks can gain business, but higher helium prices cannot be translated directly into equivalent profit growth.
The longer-duration implication is favorable for suppliers with dense networks, disciplined project selection and demonstrable cash conversion. It is not a blanket endorsement of every industrial-gas equity or of an automatic helium earnings windfall in 2027.
SPACE INFRASTRUCTURE: ESTABLISHED LIQUID-HYDROGEN SUPPLIERS HAVE A MORE DEFENSIBLE OPPORTUNITY THAN A GENERIC SPACE OR HYDROGEN THEME (READ-THROUGH 6)
Affected company: Air Products and Chemicals (APD: United States). Direction: positive for the established liquid-hydrogen business. Magnitude: meaningful at the relevant operating franchise, but small at group level and limited for immediate earnings revisions.
Linde reaffirmed a commercial-space opportunity exceeding $1 billion by approximately 2030 and increased investment partly to support space customers. The more differentiated disclosure concerned customer insourcing. White said vertical integration was occurring primarily in atmospheric gases and added: “We are not seeing it in the hydrogen side.”
That distinction matters economically. Large launch customers can increasingly consider owning oxygen or nitrogen plants, shifting value from recurring gas supply toward plant construction and operating services. Liquid hydrogen requires a different production, liquefaction, storage and distribution infrastructure. Linde’s observation supports the relative durability of outsourced hydrogen supply, although it does not establish a permanent barrier to insourcing.
Air Products has verified exposure rather than merely a hydrogen-related narrative. NASA’s November 2025 awards allocated it a maximum contract value of approximately $144.4 million to supply liquid hydrogen to facilities including Kennedy Space Center, Cape Canaveral, Marshall and Stennis. The contracts began in December 2025, with a 2-year base period and options potentially extending service through November 2030.
The transmission mechanism is additional physical hydrogen consumption from testing and launch activity, supported by specialized infrastructure and existing customer relationships. Higher throughput can improve asset utilization, while reliability requirements can favor established suppliers. The relevant demand driver is hydrogen-consuming activity, not the total number of space launches irrespective of propulsion technology.
This is not a new contract catalyst created by Linde’s call. The NASA awards were already public, include maximum quantities and values rather than guaranteed revenue recognition, and depend partly on option exercise. The $144.4 million multiyear ceiling is also small relative to Air Products’ group revenue. Linde’s $1 billion-plus space opportunity must not be assigned to Air Products or treated as an incremental industry-wide revenue pool of identical composition.
The near-term evidence to monitor was actual delivery activity and utilization, rather than broad space-sector announcements. The longer-duration effect extends through the launch and infrastructure expansion cycle toward 2030.
The negative boundary is equally important: this evidence does not establish attractive economics for every hydrogen-production technology or every proposed hydrogen project. Launch customers procure dependable molecules at acceptable cost. The high-conviction beneficiary is the established liquid-hydrogen supply franchise, not an undifferentiated basket of hydrogen developers.
Report record
- Sector
- Materials
- Industry
- Industrial Gases
- Fiscal period end
- June 30, 2026
- Report date
- July 31, 2026
- Analysis
- 5525 words
- Read-throughs
- 2800 words
- Content fingerprint (PDF)
4ba56276a49f- Content fingerprint (analysis)
663ad3e9481f- Content fingerprint (read-throughs)
2dbcdc30a0a0
Prepared from the company's earnings release and earnings call transcript. Figures as reported by the company. For information only. Not investment advice.
More from Linde PLC
No other reports yet.
More in Materials
Follow @AtlasPeakRes on X for new earnings reports as they publish.