Operating Execution Improved Materially, but a Durable Earnings Acceleration Is Not Yet Established
Earnings Reports
eBay Inc. FQ3 2026 Earnings Report
eBay Inc. (EBAY) FQ3 2026 earnings: Sustained marketplace growth, with monetization per GMV dollar still compressing. Full earnings analysis, key read-throughs, and the one-page exhibit from Atlas Peak Research.
eBay Inc. (EBAY)
Sector: Consumer Discretionary · FQ3 2026 · Period end September 30, 2026 · Reported October 28, 2026
eBay’s Q3 2026 results strengthen the evidence that its marketplace repositioning is producing sustained growth, but the investment conclusion is more favorable on operating execution than on incremental valuation upside.
Download the one-page report (PDF)
View one-page exhibit
Download analysis (.md)
Download read-throughs (.md)
Post to X
One-Page Exhibit
Earnings Analysis
EXECUTIVE CALL SUMMARY: eBay Inc. (10/28/26)
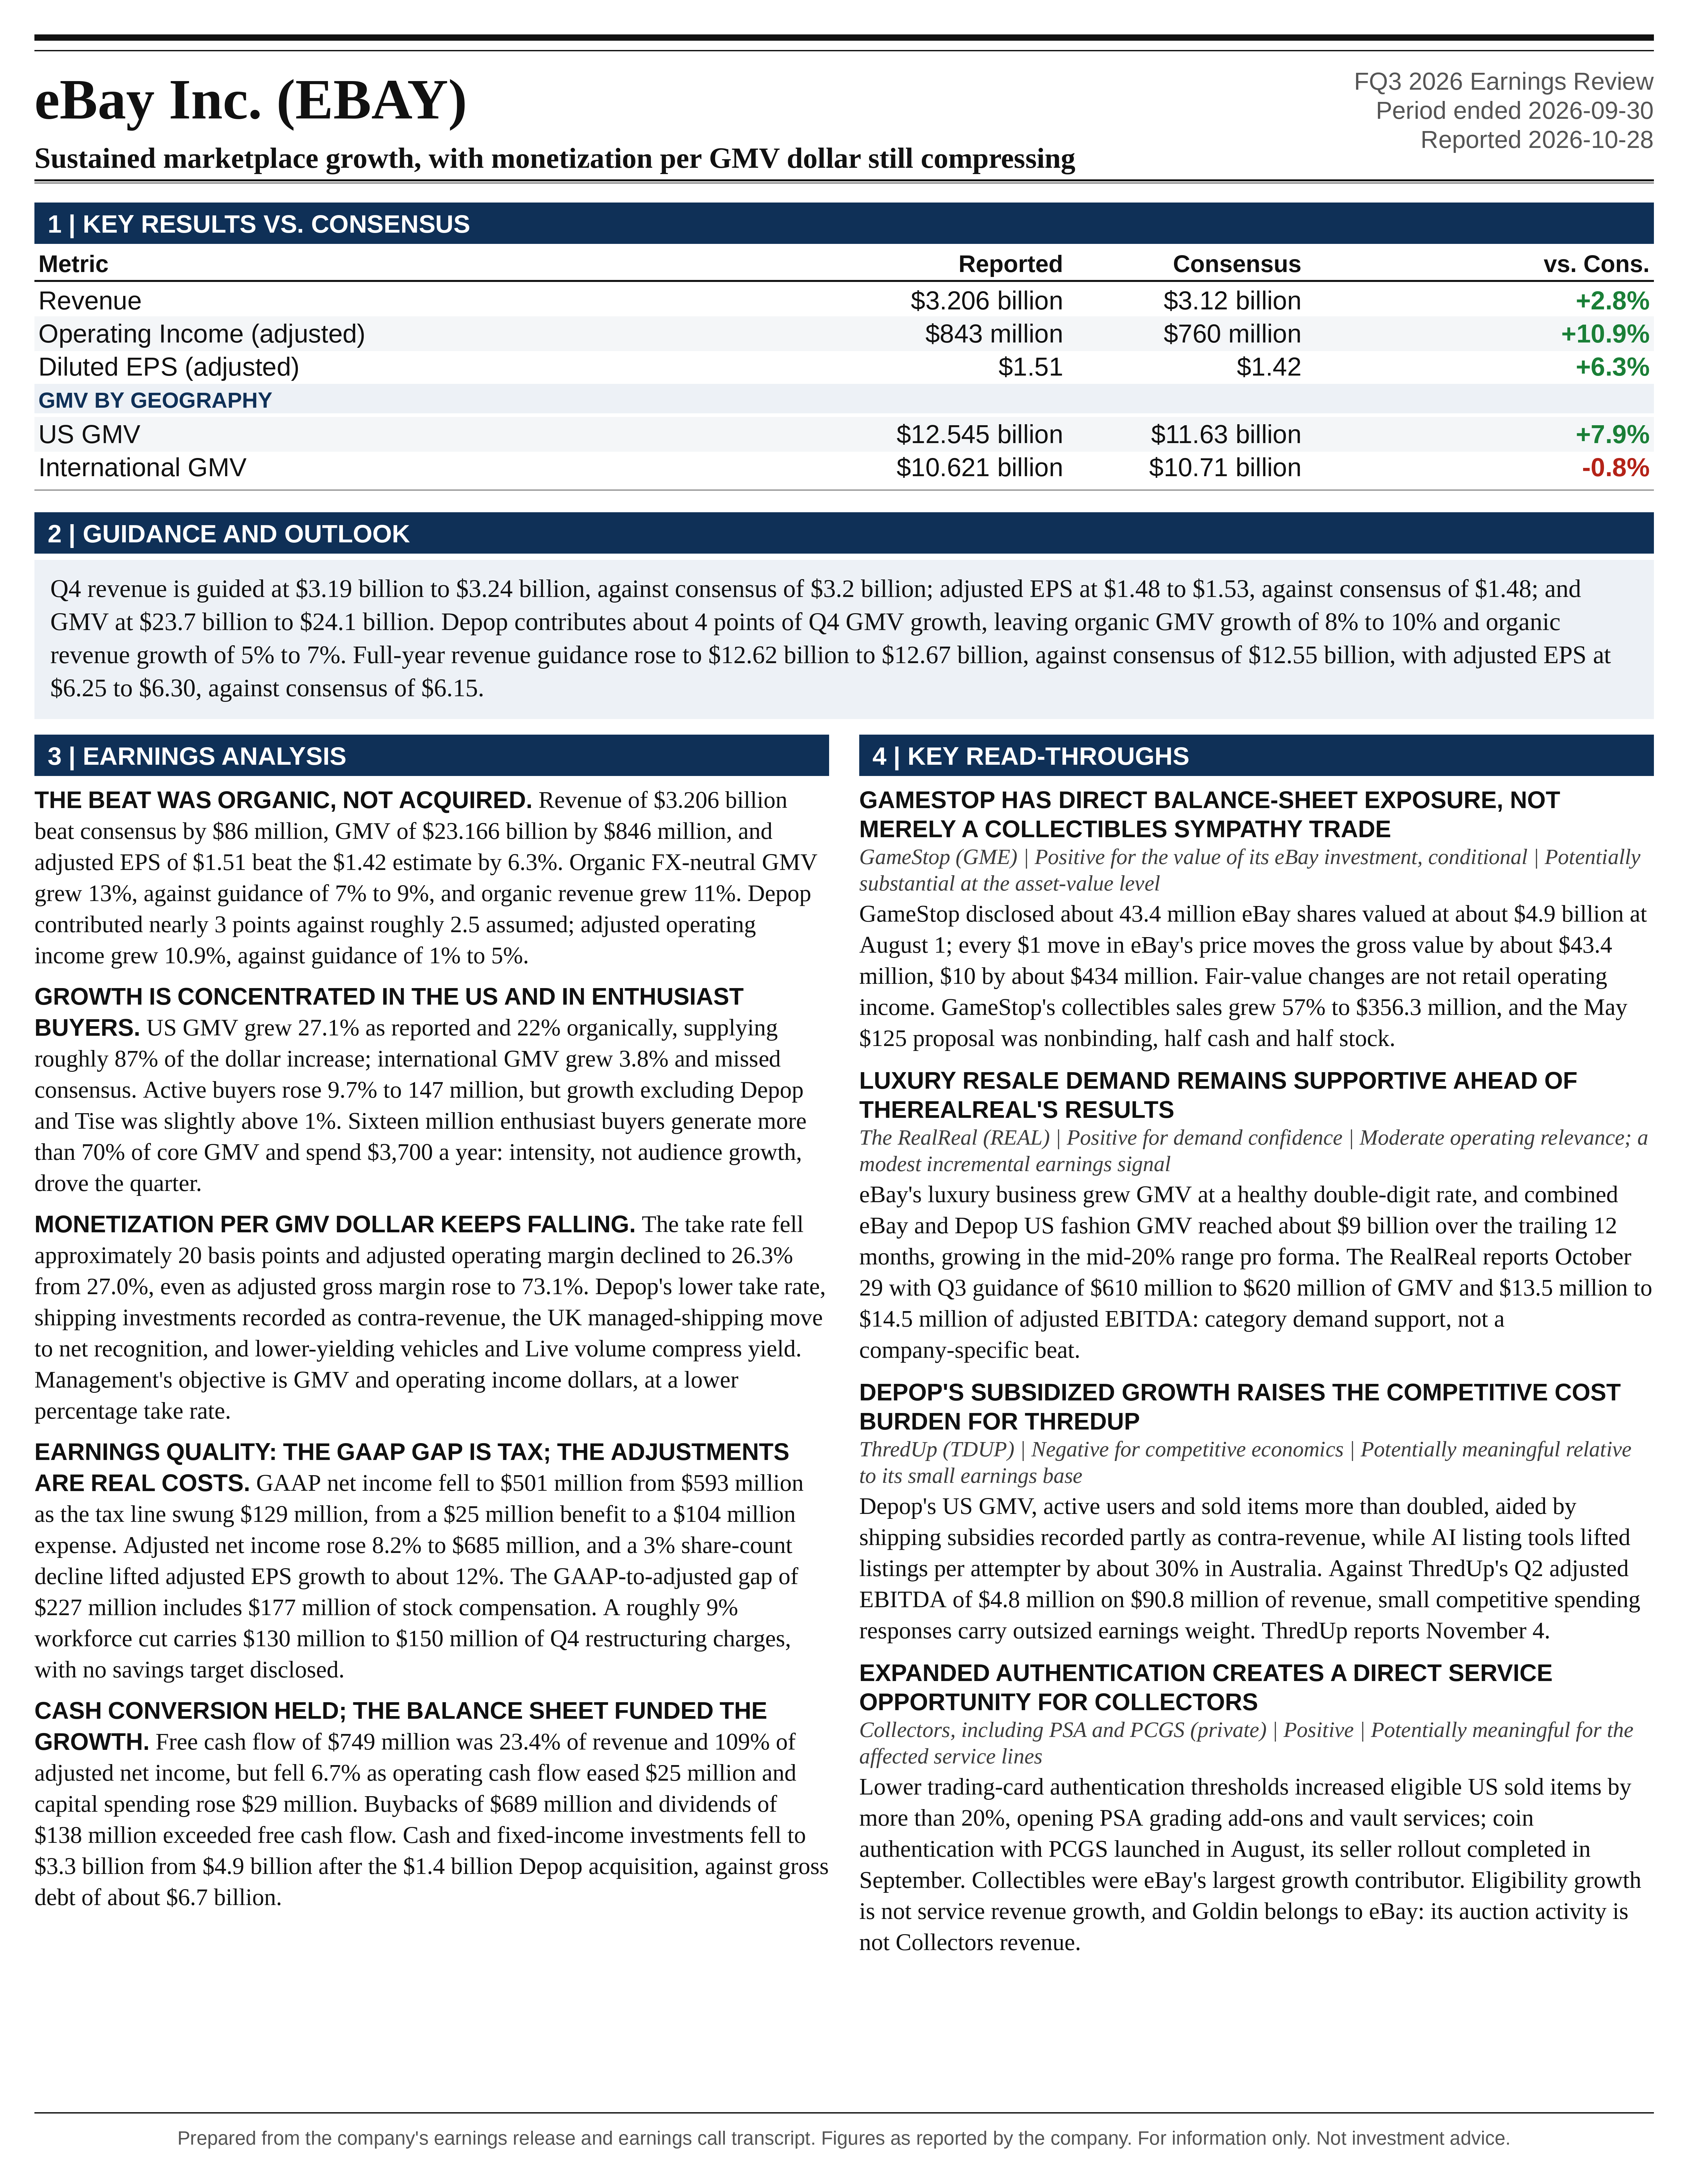
eBay’s Q3 2026 results strengthen the evidence that its marketplace repositioning is producing sustained growth, but the investment conclusion is more favorable on operating execution than on incremental valuation upside. Revenue of $3.206 billion, GMV of $23.166 billion, and adjusted EPS of $1.51 exceeded both management guidance and the quarter-specific Bloomberg consensus. The principal positive was the strength of the existing marketplace: organic FX-neutral GMV grew 13%, substantially above the previously guided 7% to 9%, while organic FX-neutral revenue grew 11%. Depop contributed additional growth, but the acquisition was not the primary explanation for the quarter’s outperformance.
The central qualification is that stronger transaction activity is translating into progressively less revenue and earnings per dollar of GMV. Consolidated take rate declined approximately 20 basis points, adjusted operating margin fell to 26.3% from 27.0%, and free cash flow declined 6.7% despite double-digit adjusted operating income growth. Management is deliberately accepting lower monetization and elevated investment to develop Live, vehicles, C2C selling, and Depop. That approach can create value, but higher GMV alone does not establish attractive incremental returns.
The Q4 outlook is constructive rather than transformational. Revenue guidance of $3.19 billion to $3.24 billion and adjusted EPS guidance of $1.48 to $1.53 modestly exceed consensus at their midpoints. However, organic GMV growth is expected to moderate to 8% to 10%, organic revenue growth to 5% to 7%, and adjusted operating income growth to 6% to 10%. The full-year outlook was raised, but a substantial portion of the increase reflects Q3 outperformance already delivered. The call did not establish a new, quantified 2027 earnings acceleration or margin expansion commitment.
At the provided reference price of $118.02, the shares trade at approximately 18.8 times the midpoint of updated 2026 adjusted EPS guidance. That valuation supports a neutral or hold assessment rather than an aggressive incremental purchase. Confidence in the improvement in marketplace execution is high. Confidence that the current investment cycle will produce materially faster earnings growth in 2027 is medium, primarily because standalone profitability, customer acquisition costs, subsidy dependence, and incremental returns for the fastest-growing businesses remain insufficiently disclosed.
SOURCE BASIS AND COMPARABILITY
The principal evidence consists of the October 28 earnings call and filed earnings release, the August 5 Q2 call and official presentation, the April 29 Q1 call, the company’s stockholder letter containing recast 2025 earnings, and the event-specific Bloomberg earnings notice. Historical earnings comparisons use the recast figures following retrospective adoption of the internal-use software accounting standard.
Several inconsistencies in the reference material require correction. The earnings notice labels 13% revenue growth as organic FX-neutral growth, whereas management explicitly reports 13% total FX-neutral growth and 11% organic FX-neutral growth. The filed release gives recast Q3 2025 adjusted EPS of $1.35, rather than the $1.36 cited in the notice. Accordingly, adjusted EPS growth was 11.9% on the recast comparison. The transcript header’s $1.48 EPS and approximately $3.203 billion revenue estimates differ from the notice’s explicitly identified Q3 estimates of $1.42 and $3.12 billion. The quarter-specific notice provides the appropriate Q3 consensus baseline; the header figures are not treated as Q3 pre-results forecasts.
Buyer growth also has distinct measurement bases. Reported active buyers increased approximately 9.7% to 147 million, but acquisition-adjusted pro forma growth was 4%, and growth excluding Depop and Tise was only slightly above 1%. These figures are not contradictory. They measure different business perimeters. Similarly, eBay’s GMV definition includes shipping fees and taxes and is not adjusted for returns or cancellations. GMV therefore measures paid marketplace activity, not retained merchandise sales or net economic value after fulfillment and customer remediation.
Q3 PERFORMANCE AGAINST EXPECTATIONS AND HISTORY
Revenue of $3.206 billion exceeded Bloomberg consensus by $86 million, or 2.8%. GMV exceeded the $22.32 billion estimate by $846 million, or 3.8%. Adjusted EPS exceeded the $1.42 estimate by $0.09, or 6.3%. Free cash flow of $749 million exceeded the $701.3 million estimate by 6.8%, although its year-over-year decline remains important.
Performance relative to management’s August guidance was stronger still. Revenue exceeded the $3.095 billion midpoint by $111 million, or 3.6%, and exceeded the upper end by 2.8%. GMV exceeded the $22.2 billion midpoint by $966 million, or 4.4%, and exceeded the upper end by 3.4%. Adjusted EPS exceeded the $1.39 midpoint by $0.12, or 8.6%. Adjusted operating income of $843 million increased 10.9%, versus the prior expectation for 1% to 5% growth. The 26.3% operating margin exceeded the previously guided 25.1% to 25.6% range despite incremental investment.
The acquisition contribution was somewhat stronger than anticipated, but most of the GMV growth surprise was organic. The August outlook assumed approximately 2.5 percentage points of GMV growth from Depop; the actual contribution was nearly 3 percentage points. Against that relatively modest acquisition upside, organic GMV growth of 13% exceeded the prior 7% to 9% range by approximately 4 percentage points at the upper end. Organic revenue growth of 11% similarly exceeded the prior 7% to 9% outlook. The quarter therefore represents meaningful core execution rather than merely an acquisition-driven beat.
Nevertheless, the growth trajectory moderated relative to Q2. Organic FX-neutral GMV growth slowed from 14% to 13%, organic revenue growth from 14% to 11%, adjusted operating income growth from 16% to 11%, and adjusted EPS growth from 17% to approximately 12%. Focus-category GMV growth slowed from 26% to 24%, while first-party advertising growth slowed from 24% to 16% on an FX-neutral basis. Revenue increased 2.3% sequentially, but adjusted operating income and adjusted EPS each declined approximately 5.6%. Seasonality and acquisition timing affect these comparisons, but the aggregate conclusion is clear: Q3 substantially exceeded expectations while still showing moderation from the earlier growth peak.
GEOGRAPHIC PERFORMANCE AND BUYER QUALITY
The revenue and GMV upside was heavily concentrated in the US. US GMV of $12.545 billion exceeded consensus by approximately $915 million and grew 27.1% as reported, or 22% organically. International GMV of $10.621 billion missed consensus by approximately $89 million and grew 3.8% as reported, with organic FX-neutral growth also approximately 4%. The US accounted for roughly 87% of the consolidated dollar increase in reported GMV.
This geographic concentration qualifies management’s description of broad-based strength. Growth was broad across US categories and positive across multiple international markets, but its magnitude was highly uneven. US organic GMV growth also moderated from 24% in Q2 to 22%. International organic growth remained approximately unchanged at 4%, suggesting that weaker reported international growth relative to Q2 reflected currency effects more than a sudden deterioration in underlying activity.
Management described some improvement in UK consumer sentiment but continued selectivity, alongside a more difficult German spending environment. Focus categories and C2C remained stronger than the overall international marketplace. This supports the effectiveness of the strategic initiatives, but it does not prove that macroeconomic weakness explains the entire international growth gap. Market structure, competitive intensity, category exposure, and customer acquisition execution remain relevant alternative explanations.
The buyer data show deeper engagement more clearly than broad global audience expansion. Active buyers excluding Depop and Tise were approximately 136 million, essentially unchanged sequentially at the reported precision and up slightly more than 1% year over year. US organic active buyers grew 6%, unchanged from Q2’s growth rate. Global enthusiast buyers increased more than 2%, compared with nearly 3% in Q2, while US enthusiast buyers again grew 9%.
Enthusiast spending increased to approximately $3,700 on a trailing-12-month basis from approximately $3,600 in Q2. These 16 million buyers generate more than 70% of core marketplace GMV and visit more than daily on average. That concentration supports retention, organic traffic, and monetization efficiency. It also concentrates economic exposure in highly engaged customers whose spending can be sensitive to collectible prices, discretionary budgets, and category enthusiasm.
The comparison between 13% quarterly organic GMV growth and approximately 1% trailing active-buyer growth indicates that spending intensity, frequency, category mix, and average selling prices are major contributors. It does not permit an exact quarterly spend-per-buyer calculation because the measurement periods differ. The reported active-buyer beat versus consensus is also less informative than the headline suggests unless the consensus acquisition perimeter is confirmed.
FOCUS CATEGORIES, COLLECTIBLES, AND MOTORS
Focus-category GMV grew 24%, outperforming the remainder of the marketplace by 19 percentage points. The implied approximately 5% growth in the remaining marketplace is positive, but materially below the strategic categories. Focus categories, C2C, and recommerce collectively represented 72% of GMV excluding Depop, versus approximately 70% in Q2. These categories overlap and should not be added together as independent businesses.
Collectibles remained the largest growth contributor. Trading cards sustained strong growth despite more difficult comparisons, supported by Pokémon-related activity, sports calendars, and broader engagement. Coins, comics, and memorabilia also contributed. The expansion beyond trading cards matters because it reduces dependence on any single release cycle, although many collectible categories remain exposed to common discretionary-spending and asset-price factors.
The operating infrastructure is becoming more differentiated. The card-scanning tool surpassed 130 million cumulative scans, compared with more than 80 million reported at Q2. Integration of TCGplayer and Goldin transaction data can improve valuation guidance, pricing confidence, and listing conversion. However, cumulative scans are an engagement measure, not a measure of unique users, incremental transactions, or revenue. The call did not quantify how much scanning activity converted into incremental GMV.
Authentication expansion has a more direct economic rationale. Lower trading-card thresholds increased eligible sold items by more than 20% in the US and extended access to grading and storage services. Coin authentication through Professional Coin Grading Service broadens the same trust proposition into another enthusiast category. The principal opportunity is to increase transaction probability and participation in categories where authenticity uncertainty suppresses demand. The associated inspection and logistics costs are real, particularly when authentication is provided without a separate customer charge.
TCGplayer exceeding $1 billion in trailing GMV and expanding seller registration into the UK and Canada supports international category expansion. Goldin’s record quarter demonstrates access to premium inventory. Neither disclosure establishes standalone profitability or the return on acquisition capital. High-profile auctions are useful evidence of marketplace capability, but individual multimillion-dollar transactions remain immaterial relative to consolidated quarterly GMV exceeding $23 billion.
Motors provides a different growth mechanism. Parts and accessories benefit from fitment confidence, returns improvements, and the affordability of recycled OEM components. Management’s observation that previous free-return launches improved conversion without increasing return rates is encouraging, although broader rollout could produce different outcomes across categories and geographies.
Vehicles create substantial GMV from relatively few transactions and carry lower monetization rates. Secure Purchase Express and dealer onboarding reduce transaction friction and expand the addressable seller population. The highlighted $5 million Porsche transaction demonstrates execution at the high end but represents only approximately 0.02% of quarterly GMV. The $500,000 vehicle protection ceiling should not be confused with full insurance of that transaction.
The CFO articulated the financial objective directly: “We’re very focused on pursuing opportunities overall that can add GMV and operating income dollars, even if they carry a lower percentage take rate.” That is economically appropriate if incremental capital requirements and risk-adjusted returns are attractive. It also means that headline GMV growth becomes a less reliable standalone indicator of shareholder value as vehicles increase in mix.
EBAY LIVE: MATERIAL SCALE, INCOMPLETE INCREMENTALITY EVIDENCE
eBay Live has progressed beyond a small experimental format. Management described a multibillion-dollar annualized GMV run rate and growth well into the triple digits across 7 markets. However, the call did not disclose the exact run rate, annualization window, quarterly GMV, revenue, or contribution margin. The disclosure establishes material scale but does not support a precise estimate of Live’s share of quarterly growth.
Self-service seller onboarding addresses a previously identified supply constraint. Multistreaming allows sellers to bring audiences from external social platforms, while the redesigned Live hub improves discovery within eBay. These developments can increase inventory availability, content hours, and customer acquisition without requiring eBay to originate every audience relationship.
The broader category opportunity is credible. Management cited fashion, handbags, watches, home and garden, coins, and other collectibles in addition to trading cards. Live can be effective where product demonstration, scarcity, seller expertise, entertainment, and community influence purchase decisions. That opportunity is broader than pack-opening formats, although the call did not disclose category-level economics.
Management’s strongest evidence for integration with the core marketplace was that Live sellers generated approximately twice as much GMV on the core marketplace as in Live events. It also reiterated that participating buyers spend approximately 70% more than comparable buyers. These observations support complementary use cases, but they do not establish that all associated spending is incremental. Sellers choosing Live and buyers adopting it may already have stronger engagement or more attractive inventory. Cohort selection, spending substitution, and the duration of the observed uplift remain unresolved.
AI moderation and pre-event screening are important scaling investments, not ancillary features. More sellers and broadcasting hours expand the surface area for inaccurate descriptions, prohibited conduct, disputes, and reputational harm. Real-time extraction of item details could eventually reduce listing work and improve discovery, but the immediate disclosed use is trust. Automated listing and discovery benefits should remain prospective until commercial outcomes are measured.
DEPOP: STRONG EARLY OPERATING SIGNALS, SUBSIDY-DEPENDENT ECONOMICS STILL UNRESOLVED
Depop was acquired on July 30, making Q3 its first reporting quarter within eBay but not a full quarter of consolidation. The transaction involved approximately $1.4 billion of cash consideration, including preliminary purchase-price adjustments, rather than only the initially announced $1.2 billion headline price. The cash-flow statement records $1.321 billion paid net of acquired cash.
Operating momentum was strong. US GMV, monthly active users, and sold items more than doubled year over year on a pro forma basis. Trailing active buyers reached approximately 11 million, compared with close to 9 million in Q2, while active sellers reached approximately 5 million. Management reported stronger buying and selling activity in new cohorts and improved repurchase, relist, and resell rates.
These measures are more informative than acquisition-driven consolidated buyer growth because they indicate improving activity within Depop itself. Customers who both buy and sell are particularly valuable because sales proceeds can fund subsequent purchases and inventory turnover can reinforce participation. Depop Balance supports that mechanism by allowing proceeds to remain available within the platform.
The principal unresolved issue is the cost of generating the activity. Marketing and shipping affordability are explicit growth inputs. The CFO stated that “a significant portion of our velocity-driving shipping investments are recognized as contra-revenue.” Consequently, stronger merchandise activity can coexist with weaker recognized revenue yield even before marketing expenses are considered.
Carrier-rate savings are a tangible synergy because they can reduce the economic cost of offering the same shipping benefit. Nevertheless, the call did not disclose acquisition cost per buyer, contribution profit per order, subsidy-adjusted retention, payback periods, or lifetime value after fulfillment support. Strong repurchase rates are encouraging but do not establish attractive lifetime value if repeat activity remains materially subsidized.
The distinction between structural savings and subsidies is critical. Lower underlying parcel costs can permanently improve the transaction economics of low-priced goods. Continuing to fund below-cost shipping can also increase activity, but the durability depends on whether customer behavior persists when support is reduced. The most important future evidence is therefore improving contribution profit alongside continued cohort retention, rather than GMV growth in isolation.
The acquisition also changes reported growth mechanics. Depop contributed nearly 3 percentage points of Q3 consolidated GMV growth and is expected to contribute approximately 4 percentage points in Q4. Part of that increase reflects a full quarter of consolidation rather than further acceleration in underlying growth. Management expects Q4 pro forma growth to be similar to Q3, not materially faster. The acquisition contribution should not be mistaken for organic growth of the combined company.
The prior August call targeted Depop becoming accretive to consolidated adjusted operating income in 2028, including synergies. The October call did not explicitly reaffirm or withdraw that milestone. Absence of repetition is not a guidance cut, but the current discussion does not establish an earlier profitability inflection. Positive operating income contribution in 2028 would also not, by itself, demonstrate an adequate return on the approximately $1.4 billion acquisition cost or compensation for foregone interest income.
Cross-platform inventory integration remains a test rather than a proven revenue synergy. Dedicated Depop modules adjacent to eBay search results have progressed toward experiments with individual listings inside search. That could increase seller velocity by matching Depop inventory with eBay demand, but it could also shift transactions between brands or complicate customer experience. Incremental combined-company contribution profit is the relevant measure.
Management’s statement that the distinction between investments in eBay and Depop is becoming “a little more blurred” reflects real shared capabilities but weakens external visibility into capital allocation. Combined US fashion GMV of approximately $9 billion, growing in the mid-20% range pro forma, demonstrates scale. It does not resolve the profitability contribution of each platform or establish market-share gains against Vinted and other competitors.
AI, LISTING PRODUCTIVITY, AND AGENTIC COMMERCE
The strongest AI evidence concerns measurable seller workflow improvements rather than speculative distribution opportunities. Magical Listing is available to new and reactivated listers across 6 major markets, with broader active-seller rollout underway. In Australia, management reported approximately 30% or greater improvement in listings per attempter and approximately 33% shorter listing time.
The economic mechanism is credible because non-new inventory is heterogeneous. Condition, specifications, photographs, pricing, and shipping requirements often require manual interpretation. Reducing those tasks can unlock supply that otherwise would not be listed. This is a more direct use case than applying AI to already standardized retail catalogs.
However, listing productivity is not equivalent to transaction productivity. More listings can improve selection, but low-quality or duplicative listings can also increase search friction. The relevant outcomes are incremental sold items, sell-through, transaction contribution, and retention after accounting for inference costs, customer support, and errors. Management reported improvements in conversion and sell-through from pricing recommendations but did not quantify the enterprise-level financial contribution.
AI-generated shipping estimates and delivery promises extend the opportunity beyond listing descriptions. Better package dimensions, weights, and delivery estimates can reduce seller effort and improve conversion. Incorrect estimates can produce surcharges, disputes, or customer remediation. The benefit therefore depends on accuracy and exception costs, not only speed.
Agentic referrals remain small. The CEO said, “We believe that this traffic will be largely incremental to eBay,” while acknowledging that the channel is “very, very small today.” The disclosed attraction is a higher incidence of new and reactivated buyers, followed by approximately 50% of new referred buyers returning directly for subsequent purchases.
That pattern would be strategically valuable if sustained because it suggests third-party agents could serve as acquisition channels rather than permanently controlling the customer relationship. The statement that “85% of our traffic is organic” also indicates substantial existing direct demand. However, sample size, cohort age, acquisition economics, and the precise denominator for subsequent purchasing were not disclosed. The evidence supports optionality, not a material near-term revenue forecast.
The longer-term risk is that external agents capture discovery, monetization, or customer ownership. eBay’s differentiated inventory, authentication, payments, and fulfillment capabilities provide bargaining assets, but no disclosed commercial framework establishes how economics will be shared. The appropriate conclusion is that internal AI already has measurable operational applications, while external agentic commerce remains an early opportunity with unresolved economics.
ADVERTISING, PAYMENTS, AND MONETIZATION
Advertising revenue reached $607 million, approximately 19% of consolidated revenue, and grew 16%, or 15% on a pro forma basis. First-party advertising contributed $575 million. The business remains a significant earnings support because it monetizes seller demand for discovery without requiring a corresponding increase in merchandise value.
The slowdown from 24% first-party FX-neutral growth in Q2 to 16% in Q3 deserves attention. Management cited lapping attribution changes and faster growth in categories with lower advertising penetration. Those explanations are plausible and do not, by themselves, indicate weaker advertiser demand. They do mean that advertising is providing less incremental support to blended monetization than earlier in the year.
Approximately 1.3 billion of 2.7 billion listings were promoted, and 6 million sellers used at least 1 promoted-listing product. Seller adoption increased from 5.7 million in Q2, but the rounded listing counts do not demonstrate expanding promoted-listing penetration. Future growth must therefore come from some combination of additional adoption, better conversion, new formats, offsite distribution, and pricing or auction efficiency.
The AI placement engine can optimize ad density by shopper context rather than applying uniform loading. That potentially improves both seller returns and buyer experience. The constraint is that advertising monetization must not degrade organic discovery or merely transfer seller margin to the platform without increasing overall transaction value. Sustainable advertising growth requires incremental seller value, not simply more paid placement.
Pay-by-bank expansion into Germany and France and broader balance functionality can reduce payment processing costs and improve customer convenience. High average order values increase the potential savings from lower-cost payment rails. However, adoption, cost savings, and retained economics were not quantified. Financial services is currently a modest contributor, not a demonstrated replacement for the earnings impact of take-rate pressure elsewhere.
SHIPPING: STRUCTURAL CAPABILITY VERSUS ACCOUNTING EFFECT
Shipping is becoming a shared operating capability across the portfolio. International Shipping launches in the UK and Germany allow sellers to access buyers in more than 190 markets while shipping domestically to an eBay hub. Management estimates that UK customers can save up to 30% relative to the previous global shipping program. The “up to” qualifier is important: it does not establish the average saving or the saving across all transaction types.
Managed shipping and pickup/drop-off options can improve the economics of low-priced goods, where delivery costs represent a large share of total purchase cost. The UK network includes more than 50,000 carrier locations, while a limited US metropolitan drop-off test is beginning in Q4. Broader availability could increase listings and transaction velocity, but the US program remains experimental, with adoption, service quality, and unit economics still under evaluation.
Shipping also creates a reporting distortion. The UK managed-shipping transition from gross to net revenue recognition reduces reported revenue and take rate without necessarily reducing profit by the same amount. Conversely, Depop shipping subsidies recorded as contra-revenue are real economic spending. Both reduce recognized revenue yield, but only the former is principally a presentation issue. Treating all shipping-related take-rate pressure as accounting would overstate underlying profitability.
Gross-to-net presentation can mechanically increase gross margin percentages by removing low-margin pass-through revenue and associated costs. Some apparent margin improvement can therefore coexist with unchanged transaction economics. The call did not provide enough detail to allocate the 60-basis-point gross margin improvement among presentation, payments, advertising, shipping efficiency, and other mix effects.
OPERATING MARGINS, EARNINGS QUALITY, AND RESTRUCTURING
Adjusted operating income increased to $843 million from $760 million, while revenue increased by $386 million. The resulting incremental adjusted operating margin was approximately 21.5%, below the prior-year operating margin of 27.0%. This is positive profit conversion, but not operating leverage in the conventional margin-expansion sense.
Adjusted gross margin increased from 72.5% to 73.1%, while adjusted operating margin declined from 27.0% to 26.3%. The implied adjusted operating expense ratio therefore increased approximately 130 basis points. Using the rounded gross margin disclosures, gross profit increased approximately $299 million, of which approximately $216 million was absorbed by higher operating expenses. Roughly 72% of incremental gross profit was reinvested or consumed by expense growth.
GAAP sales and marketing expense increased 23.3% to $747 million, rising from approximately 21.5% to 23.3% of revenue. Management attributed the increase to strategic priorities, including Depop, supported partly by efficiencies in core marketplace marketing. The consolidated numbers nevertheless show that the efficiency gains were redeployed rather than retained as a higher operating margin.
Adjusted EPS growth also exceeded underlying net income growth. Adjusted net income increased 8.2% to $685 million, while diluted shares declined approximately 3% to 453 million. Share reduction helped lift adjusted EPS growth to approximately 12%. The quarter was not merely a buyback-driven result because operating income increased nearly 11%, but repurchases remain a meaningful component of per-share growth.
GAAP earnings present a different comparison. Continuing net income declined from $593 million to $501 million, and GAAP EPS declined from $1.27 to $1.11. The principal explanation was the tax comparison rather than an operating profit decline. GAAP pretax income increased $37 million, but the tax line moved from a $25 million benefit to a $104 million expense, a $129 million adverse swing. Adjusted earnings appropriately remove much of that comparability distortion, although the adjusted tax rate also increased from 16.5% to 17.5%.
The $227 million difference between GAAP and adjusted operating income included $177 million of stock compensation and related payroll taxes, $25 million of acquired-intangible amortization, and $28 million of transaction-related costs, partly offset by a $3 million credit in restructuring and executive bonuses. These adjustments are economically different. Stock compensation is recurring compensation, acquisition amortization reflects purchased assets, and transaction costs reflect capital-allocation activity. The adjusted result should not be interpreted as earnings free of those economic obligations.
The approximately 9% workforce reduction is intended to redirect resources toward higher-growth initiatives. The release anticipates $130 million to $150 million of Q4 restructuring expense, excluded from adjusted earnings. No annualized savings target, cash payment schedule, or retained-margin commitment was disclosed.
The first analyst question directly tested whether the restructuring would provide sufficient investment capacity without a noticeable long-term margin impact. Management answered primarily by emphasizing operating income dollars and portfolio opportunity rather than committing to margin protection. That distinction matters. The restructuring is not evidence of a quantified future earnings windfall, and potential savings should not be counted both as funding for growth investment and as incremental profit.
CASH FLOW, BALANCE SHEET, AND CAPITAL RETURNS
Q3 free cash flow of $749 million represented approximately 23.4% of revenue and 109% of adjusted net income. Those are healthy absolute conversion measures. However, free cash flow declined from $803 million because operating cash flow decreased $25 million to $875 million and capital expenditures increased $29 million to $126 million. The $54 million decline therefore has a straightforward operating-cash-flow and investment bridge.
Year-to-date cash generation was substantially stronger. Free cash flow increased to $1.973 billion from $1.006 billion, while operating cash flow increased to $2.394 billion from $1.315 billion. Approximately $670 million of the $1.079 billion operating-cash-flow improvement reflected a smaller cash drag from changes in assets and liabilities. The improvement is real, but a large portion reflects cash timing and balance-sheet movements rather than a matching increase in recurring earnings.
Reported free cash flow also excludes $77 million of financing-classified cash payments for employee award tax withholding in Q3 and $266 million year to date. An analytical cash-after-award-withholding measure would therefore be $672 million for Q3 and $1.707 billion year to date. These are not company-reported free cash flow figures. They illustrate cash available after a recurring employee-equity-related funding requirement and should not be confused with an additional deduction of the current-period stock compensation expense.
The company reported $689 million of repurchase activity and $138 million of dividends, totaling $827 million. The cash-flow statement records $664 million of repurchase payments, making cash buybacks and dividends $802 million. The cash figure exceeded reported free cash flow by $53 million and exceeded cash after award withholding by $130 million. The distinction between reported repurchase activity and cash settlement should be retained rather than combining inconsistent measures.
Cash and fixed-income investments declined from $4.9 billion at Q2 to $3.3 billion, while gross debt remained approximately $6.7 billion. Depop’s acquisition and capital returns explain the strategic use of liquidity, but the lower cash balance reduces interest income and financial flexibility. Approximate net debt is $3.4 billion before considering equity investments, leases, or other adjustments. The $800 million equity investment portfolio provides additional asset value but is not equivalent to unrestricted cash.
Customer funds of approximately $1.624 billion are matched by customer obligations and should not be added to corporate liquidity or deducted in enterprise-value calculations. This distinction becomes more important as wallet and balance products grow.
The approximately $2 billion annual buyback target remains unchanged and represents approximately 3.8% of the provided market capitalization. The annualized $1.24 dividend represents a 1.1% yield at $118.02. Together, those imply approximately 4.9% of gross capital return, but the buyback component is not equivalent to net share reduction because employee issuance offsets part of the repurchases.
GUIDANCE REVISIONS AND THE Q4 EARNINGS BRIDGE
Full-year revenue guidance is now $12.62 billion to $12.67 billion, with a $12.645 billion midpoint approximately 0.8% above the provided Bloomberg consensus. Adjusted EPS guidance is $6.25 to $6.30, with a $6.275 midpoint approximately 2.0% above consensus. Full-year GMV guidance is $91.5 billion to $91.9 billion.
The August framework called for consolidated FX-neutral GMV growth of 11.5% to 12.5% and revenue growth of 11% to 12%. The current release indicates approximately 14% GMV growth and 12% to 13% revenue growth. The upgrade is therefore larger for merchandise activity than for monetization, consistent with the quarter’s mix and investment trends.
The EPS comparison can be quantified using recast 2025 adjusted EPS of $5.49. August’s 10% to 12% growth framework implied approximately $6.04 to $6.15. The new $6.25 to $6.30 range implies approximately 13.8% to 14.8% growth. The midpoint increased approximately $0.18, of which approximately $0.12 corresponds to Q3’s outperformance against the prior quarterly midpoint. The remaining approximately $0.06 suggests a modest improvement beyond the completed quarter, although annual and quarterly weighted-average share counts prevent treating that residual as an exact Q4 revision.
The operating income bridge also improved. Applying the Q4 revenue and margin endpoints produces approximately $820 million to $849 million of adjusted operating income. Combined with $2.643 billion earned through Q3, this mechanically implies approximately $3.463 billion to $3.492 billion for 2026, or approximately 12.8% to 13.8% growth against the recast 2025 base. This is an analytical implication, not a separately issued annual operating income range, but it is above August’s 10% to 12% growth framework.
Q4 guidance nonetheless embeds meaningful moderation. GMV is expected to grow 12% to 14% FX-neutral, including approximately 4 percentage points from Depop, leaving 8% to 10% organic growth. Revenue is expected to grow 7% to 9% FX-neutral, including approximately 2 percentage points from Depop, leaving 5% to 7% organic growth.
At the guidance midpoints, GMV increases approximately 3.2% sequentially, but revenue increases only approximately 0.3%. The implied revenue-to-GMV yield is approximately 13.45%, compared with 13.84% in Q3 and approximately 13.96% in Q4 2025. Thus, the midpoint implies approximately 39 basis points of sequential and 51 basis points of year-over-year take-rate compression.
Management identified Depop’s lower recognized take rate, the UK shipping accounting transition, and category and ASP mix as the principal drivers. These explanations mean that slower revenue growth should not automatically be interpreted as weaker transaction demand. They also mean that strong transaction growth should not automatically be capitalized at the historical marketplace earnings yield.
The Q4 revenue midpoint exceeds the notice’s approximately $3.2 billion consensus by only 0.5%, while the EPS midpoint exceeds $1.48 by approximately 1.7%. The adjusted operating margin midpoint is approximately 25.95%, essentially consistent with the recast 26.0% margin in Q4 2025 but below Q3. This is a reasonable continuation outlook, not a large forward earnings surprise.
2027 OUTLOOK AND THE KEY UNDERWRITING QUESTION
Management’s preliminary 2027 language was deliberately qualitative: “We are planning our business around healthy consolidated year-over-year growth across GMV, revenue, non-GAAP operating income, and non-GAAP earnings per share.” This is not a commitment to double-digit growth, margin expansion, or a particular earnings threshold.
Trading-card growth is expected to moderate as unusually strong 2026 activity is lapped. Some acquisition and shipping-accounting comparisons should become less distorting over time, but their anniversary does not automatically improve unit economics. Depop’s lower take rate and any continuing subsidies remain economically relevant after the acquisition enters the comparison base. Similarly, vehicles and Live can continue to depress blended monetization even as they add operating income dollars.
Net interest income is expected to face modest pressure from the lower cash balance and interest-rate assumptions, while the adjusted tax rate is expected to remain relatively stable. Consequently, operating income growth remains the central earnings driver, with repurchases providing partial support rather than an unlimited offset.
The key underwriting question is whether shipping savings, marketing efficiencies, restructuring, advertising, and AI productivity can improve retained contribution profit faster than collectible growth normalizes and newer businesses absorb investment. The call provides credible operating mechanisms for that outcome but insufficient quantified evidence to establish it.
VALUATION AND INVESTMENT IMPLICATIONS
At $118.02 and approximately $52.52 billion of equity value, eBay trades at approximately 18.8 times updated 2026 adjusted EPS and approximately 27.5 times the midpoint of GAAP EPS guidance. Approximate enterprise value is $55.9 billion using gross debt less cash and fixed-income investments, before separate adjustments for equity stakes and leases. That represents approximately 4.4 times updated annual revenue.
Annualizing Q3 free cash flow would imply approximately a 5.7% equity free-cash-flow yield, but that is a sensitivity rather than a forecast. Seasonality, restructuring cash payments, working-capital movements, and the investment cycle make a simple quarterly annualization unreliable. The valuation is therefore better framed around sustainable earnings and normalized cash generation than a single-quarter cash multiple.
The following 12-month scenarios are analytical assumptions, not management guidance or consensus forecasts. Confidence in the scenario probabilities is medium because 2027 investment intensity remains undisclosed.
A base case with 50% probability assumes consolidated GMV growth of approximately 8% to 10%, revenue growth of 6% to 8%, and adjusted EPS of approximately $6.80. This assumes continued marketplace gains, manageable collectible normalization, and broadly stable operating profitability. An 18 times multiple produces approximately $122 per share, or approximately 4% price upside from the reference price.
A bull case with 25% probability assumes GMV growth of approximately 13% to 15%, revenue growth of 10% to 12%, improving profit conversion, and adjusted EPS of approximately $7.25. This requires Live and Depop to retain strong momentum while shipping and marketing efficiencies increasingly offset growth spending. A 22 times multiple produces approximately $160 per share, or approximately 35% upside.
A bear case with 25% probability assumes GMV growth of approximately 3% to 5%, revenue growth of 0% to 3%, and adjusted EPS of approximately $5.90. This incorporates weaker collectible demand, persistent subsidies, limited buyer expansion, and insufficient cost offsets. A 15 times multiple produces approximately $89 per share, or approximately 25% downside.
The probability-weighted value is approximately $123 per share. Including an unchanged annual dividend produces an illustrative expected total return of approximately 5.4%. That is not an unusually attractive return relative to the downside and execution uncertainty. The scenario framework therefore supports holding a modest existing position rather than adding aggressively at $118.02.
Valuation sensitivity is greater than the near-term earnings beat alone suggests. At $6.80 of earnings, a change of 1 multiple point changes value by $6.80 per share, approximately 5.8% of the reference price. By comparison, a 100-basis-point operating margin change on the current annual revenue base represents approximately $126 million of pretax operating income, or approximately $0.23 per share after applying a 17.5% tax rate and the Q3 diluted share count. Multiple confidence can therefore dominate modest earnings revisions.
A $105 to $110 entry range would improve the illustrative probability-weighted total return to approximately 13% to 19%, assuming the operating thesis remains intact. That range is valuation-based, not a claimed technical support level. An initial allocation of 0.5% to 1.0% of NAV would be proportionate to the current evidence. A 12% loss limit from actual entry would imply approximately 6 to 12 basis points of portfolio risk before gaps or slippage.
The exposure is principally profitable consumer internet, discretionary marketplace spending, recommerce, collectibles, and execution-dependent capital allocation. It is not a pure defensive value position, and it can overlap with other consumer-platform holdings and asset-price-sensitive discretionary businesses. Portfolio-specific concentration and correlation cannot be quantified without holdings data.
CATALYSTS, REVIEW TRIGGERS, AND EXIT DISCIPLINE
The next major catalyst is Q4 holiday execution and the formal 2027 outlook accompanying full-year results in early 2027. The critical evidence will be whether organic GMV remains within or above 8% to 10%, whether revenue conversion stabilizes after the identified accounting effects, and whether incremental profit improves as restructuring and shared operating capabilities take effect.
During 2027, the acquisition anniversary, broader Magical Listing deployment, Live self-service adoption, and cross-platform inventory tests should provide additional evidence. The most consequential potential positive surprise is not simply faster Depop GMV. It is stronger combined contribution profit with lower acquisition and shipping support per retained customer.
A thesis review should be triggered by organic GMV growth falling below 5% for 2 consecutive quarters without a clear temporary explanation, materially worsening margin guidance, continued low buyer growth accompanied by weakening enthusiast spending, or deteriorating Depop retention when subsidies are reduced. These are analytical risk thresholds, not company targets.
An exit or material reduction would be warranted if earnings growth becomes predominantly dependent on repurchases while operating income stagnates, if reported cash conversion remains weak after identifiable timing effects, or if the acquisition’s profitability timetable slips without stronger long-term return evidence. Conversely, sustained high-single-digit or better organic GMV growth alongside improving contribution economics would support a higher valuation and greater position size.
The quarter’s decisive contribution is stronger evidence that eBay can grow its marketplace through differentiated inventory, trust, seller tools, and new transaction formats. The unresolved issue is how much of that growth will accrue to shareholders rather than be recycled into subsidies, marketing, and operating complexity. Q3 materially improved confidence in demand and execution. It did not yet resolve the earnings conversion question.
COMPANY EMPLOYEES ON THE CALL
• John Egbert, Vice President, Investor Relations. • Jamie Iannone, President and Chief Executive Officer. • Peggy Alford, Chief Financial Officer.
The transcript also attributes remarks to an unidentified speaker whose name, title, and employee status cannot be established.
RESEARCH ANALYSTS ON THE CALL
• Michael Morton, MoffettNathanson. • Nathan Feather, Morgan Stanley. • Deepak Mathivanan, Cantor Fitzgerald. • Ken Gawrelski, Wells Fargo. • Colin Sebastian, Baird. • Bernie McTernan, Needham. • Brian Pitts, BMO Capital Markets, as identified in the transcript. • Mark Mahaney, Evercore ISI.
Key Read-Throughs
KEY READ-THROUGHS FROM EBAY’S Q3 2026 EARNINGS CALL
eBay’s results provide stronger evidence of expanding recommerce participation, sustained collectibles activity, and improving transaction infrastructure than of a broad acceleration in discretionary consumption. Organic GMV growth of 13%, focus-category growth of 24%, and Depop’s more than doubling of US GMV support selected marketplace and service-provider exposures. However, shipping subsidies, lower monetization, and intensified investment create competitive pressure for smaller platforms and substitution risk for incumbent payment channels. The most actionable implications are GameStop’s direct financial exposure to eBay, supportive luxury-resale demand ahead of The RealReal’s earnings, and a more demanding competitive environment for ThredUp. Ownership changes are particularly important: InPost is no longer a standalone listed exposure, and Depop’s growth no longer accrues to Etsy. Magnitudes below refer to fundamental exposure, not predicted share-price moves.
SPECIAL SITUATIONS AND GAMING RETAIL
GAMESTOP HAS DIRECT BALANCE-SHEET EXPOSURE, NOT MERELY A COLLECTIBLES SYMPATHY TRADE (READ-THROUGH 1)
Affected company: GameStop (GME: United States). Direction: Positive for the value of its eBay investment, conditional on sustained valuation support; mixed for its broader acquisition strategy. Magnitude: Potentially substantial at the asset-value level.
Call evidence: eBay reported 13% organic GMV growth, 11% adjusted operating income growth, and adjusted EPS of $1.51, exceeding its prior $1.36 to $1.42 guidance. Updated annual adjusted EPS guidance reached $6.25 to $6.30. These results strengthen the operating foundation of an asset in which GameStop has a large direct investment.
GameStop’s September 8 earnings release disclosed approximately 43.4 million eBay shares, valued at approximately $4.9 billion as of August 1. Assuming that last-disclosed holding remains unchanged, every $1 movement in eBay’s share price changes the gross investment value by approximately $43.4 million; a $10 movement changes it by approximately $434 million. This is a much more direct transmission mechanism than assuming that stronger eBay trading-card activity automatically produces a comparable increase in GameStop retail sales.
The accounting distinction matters. Changes in the investment’s fair value can affect GameStop’s GAAP earnings, but they do not represent retail operating income, adjusted EBITDA, or operating cash generation. A stronger eBay share price therefore improves GameStop’s asset value without necessarily improving its underlying store economics.
There is also overlapping operating exposure. GameStop had already reported 57% collectibles sales growth to $356.3 million, representing 45.1% of quarterly sales. eBay’s strong trading-card commentary corroborates that previously reported category strength; it is not a prediction of GameStop’s completed quarter. Conversely, eBay’s explicit expectation that trading-card growth will moderate in 2027 argues against extrapolating extraordinary category growth indefinitely. Portfolios holding both companies have overlapping collectibles exposure as well as GameStop’s embedded eBay equity exposure.
Near-term catalyst: eBay’s post-results valuation and subsequent disclosure of GameStop’s investment carrying value. Longer-duration implication: stronger standalone eBay performance supports the investment asset but increases the economic hurdle for acquiring the company attractively. GameStop’s May proposal of $125 per share was explicitly nonbinding and comprised 50% cash and 50% GameStop stock. It should not be treated as a contractual cash floor or a conventional signed-deal arbitrage spread.
FASHION RESALE AND DIGITAL MARKETPLACES
LUXURY RESALE DEMAND REMAINS SUPPORTIVE AHEAD OF THEREALREAL’S RESULTS (READ-THROUGH 2)
Affected company: The RealReal (REAL: United States). Direction: Positive for demand confidence. Magnitude: Moderate operating relevance, but only a modest incremental earnings signal because the categories and business models are not identical.
Call evidence: eBay’s luxury business delivered another quarter of “healthy double-digit GMV growth.” Management also reported continued strength in US luxury, while combined eBay and Depop US fashion GMV reached approximately $9 billion over the trailing 12 months, growing in the mid-20% range on a pro forma basis.
The most relevant evidence for The RealReal is the luxury-specific commentary, not Depop’s faster growth in affordable fashion. It supports continued consumer willingness to transact in authenticated secondhand handbags, watches, jewelry, and apparel. The transmission mechanism is stronger buyer demand and inventory sell-through, potentially supporting consignor activity, commission revenue, and utilization of authentication and processing infrastructure.
The RealReal had already reported Q2 GMV growth of 22% and revenue growth of 17%, with adjusted EBITDA of $13.5 million. Its Q3 guidance called for GMV of $610 million to $620 million, revenue of $194 million to $198 million, and adjusted EBITDA of $13.5 million to $14.5 million. eBay’s subsequent quarter provides additional evidence that the relevant resale categories remained healthy. It reduces concern about a broad luxury-resale demand break; it does not establish that The RealReal will exceed those ranges.
The important distinction is between resale demand and demand for newly manufactured luxury goods. Stronger secondhand activity can reflect affordability, inventory recirculation, and substitution away from new products. It is therefore not a clean positive read-through to luxury brand wholesale orders or full-price retail sell-through.
Competitive counterevidence remains relevant. eBay is expanding authentication and reducing transaction friction, which can narrow the trust advantage of specialist platforms. The RealReal’s full-service consignment proposition remains differentiated because it handles physical intake, processing, pricing, and selling. The call supports the category demand outlook more strongly than it supports any conclusion about relative market share.
Near-term catalyst: The RealReal’s October 29, 2026 earnings release. The actionable signal is supportive demand confirmation immediately ahead of that event, not an independently established earnings-beat forecast. Longer-duration implication: authenticated resale appears capable of sustaining demand even when consumers are selective about discretionary spending.
DEPOP’S SUBSIDIZED GROWTH RAISES THE COMPETITIVE COST BURDEN FOR THREDUP (READ-THROUGH 3)
Affected company: ThredUp (TDUP: United States). Direction: Negative for competitive economics and the ease of achieving margin expansion. Magnitude: Potentially meaningful relative to its small earnings base; no demonstrated market-share loss or quantified revenue reduction.
Call evidence: Depop’s US GMV, monthly active users, and sold items more than doubled. Management attributed growth partly to shipping affordability, stating that lower shipping costs made lower-priced products economical and increased purchasing frequency. eBay’s carrier rates have already lowered Depop’s average parcel cost. The CFO also emphasized that a significant portion of shipping investment is recorded as contra-revenue.
The transmission mechanism is a stronger competitive proposition at the same affordability-sensitive purchase occasions served by ThredUp. Depop can combine lower shipping costs, targeted subsidies, and increasing seller liquidity with the financial resources of a much larger parent. ThredUp must compete through some combination of selection, convenience, customer acquisition spending, promotions, and delivery economics. That raises the threshold for converting category growth into retained profit.
The AI listing improvements add another competitive channel. eBay reported approximately 30% or greater increases in listings per attempter and materially shorter listing times in Australia. Reducing the effort required for consumers to sell directly weakens part of the convenience advantage of managed resale. It does not eliminate ThredUp’s differentiated clean-out service, but it improves the alternative available to sellers who are willing to transact themselves.
The financial sensitivity is material. ThredUp’s Q2 revenue was $90.8 million and adjusted EBITDA was $4.8 million. As a scale illustration, an incremental expense equal to 1% of that revenue would absorb approximately 19% of quarterly adjusted EBITDA, before offsets. This is not a forecast of additional spending; it demonstrates why relatively small competitive responses can have a large earnings effect.
The geographic and customer evidence is particularly important. ThredUp’s August outlook reflected uncertainty affecting its most price-sensitive buyers and contemplated approximately 7% Q3 revenue growth at the midpoint. Depop’s subsequent US acceleration shows that affordability-sensitive resale activity is not uniformly weak. Platform economics, shipping costs, merchandising, and acquisition strategy can materially influence outcomes. The disparity does not prove that Depop gained ThredUp’s customers, but it makes a purely macroeconomic explanation for slower growth less complete.
Counterevidence limits the bearish conclusion. ThredUp’s Q2 buyers and orders were already growing more than 20%, and its September 29 launch on Whatnot creates an additional distribution channel. eBay’s strong Live results validate that channel’s broader potential, although they do not establish the economics of ThredUp’s implementation.
Near-term catalyst: ThredUp’s November 4, 2026 results, especially promotional intensity, shipping economics, buyer retention, and the early contribution from live selling. Longer-duration implication: sustained category expansion can coexist with pressure on smaller platforms’ margins. The high-conviction negative is greater competitive spending pressure, not a claim that the business must contract.
EUROPEAN PARCEL LOGISTICS
LOCKER ADOPTION SUPPORTS INPOST, WITH FEDEX NOW THE RELEVANT LISTED OWNERSHIP EXPOSURE (READ-THROUGH 4)
Affected companies: FedEx (FDX: United States) and InPost (PRIVATE: Luxembourg). Direction: Positive for InPost’s network utilization and strategic relevance; modestly positive for FedEx’s investment exposure. Magnitude: More meaningful within the affected delivery network than at FedEx group level.
Call evidence: eBay is increasing the visibility and affordability of UK pickup and drop-off services across more than 50,000 carrier locations, with approximately 95% of UK buyers living within 1 mile of a location. Management described targeted promotions intended to increase adoption and improve transaction velocity for lower-priced goods. UK C2C GMV continued to grow at a healthy double-digit rate.
The supplier relationship is established: InPost’s customer-facing materials confirm that eBay buyers can select its lockers and shops at checkout. Greater adoption can increase parcels handled through that network. Higher parcel density can improve utilization of existing lockers, transport routes, and sorting infrastructure, potentially reducing cost per parcel. The mechanism is therefore more attractive than a generic claim that all parcel carriers benefit equally from higher online spending.
Ownership changes materially affect the investment mapping. InPost’s October transaction notice recorded consortium ownership of 98.49% and specified delisting from Euronext Amsterdam on October 23. FedEx holds 37% of the ownership consortium under the announced structure. The former standalone InPost listing should not be presented as a currently available public-equity trade.
FedEx’s benefit is indirect through the value and eventual earnings or distributions of its investment, subject to the ownership structure and accounting treatment. InPost parcel revenue must not be added proportionally to FedEx revenue, and the eBay relationship does not constitute a new direct FedEx shipping contract.
Several limitations constrain magnitude. The 50,000-location figure covers multiple carriers, not InPost alone. eBay did not disclose carrier allocation, parcel counts, pricing, or contractual minimums. Promotional shipping can also reduce revenue per parcel. The investment case depends on whether additional density and lower delivery costs outweigh pricing concessions and expansion capital.
Near-term catalyst: UK holiday-season adoption through Q4 2026, rather than an immediate, quantifiable FedEx EPS revision. Longer-duration implication: marketplace integration favors accessible, lower-cost out-of-home delivery networks. The call supports this structural delivery model but does not identify the carrier beneficiaries of eBay’s limited US drop-off test.
COLLECTIBLES AUTHENTICATION AND SERVICES
EXPANDED AUTHENTICATION CREATES A DIRECT SERVICE OPPORTUNITY FOR COLLECTORS (READ-THROUGH 5)
Affected company: Collectors, including PSA and PCGS (PRIVATE: United States). Direction: Positive. Magnitude: Potentially meaningful for the affected service lines; consolidated revenue and profit effects cannot be quantified.
Call evidence: Lower trading-card authentication thresholds increased the number of eligible sold items in the US by more than 20% and made those items eligible for PSA grading add-ons and vault services. eBay also launched coin authentication with PCGS in August, completing the seller rollout in September. Management reported that trading-card growth remained strong and that collectibles were its largest growth contributor.
The transmission mechanism is unusually direct because named commercial relationships already exist. PCGS gains an expanded marketplace authentication channel in collectible coins. PSA benefits from a larger population eligible to purchase integrated grading and storage-related services. Reducing the steps between transaction, grading, storage, and resale can increase service attachment and repeat activity.
The eligibility statistic must be interpreted carefully. A more than 20% increase in eligible items is not equivalent to 20% growth in PSA revenue, paid grading submissions, or Collectors earnings. Optional-service conversion, fee schedules, capacity, and customer behavior were not disclosed. Nor should every trading-card authentication inspection be automatically attributed to PSA merely because PSA supplies the associated grading and vault services.
The broader implication is that trust and transaction infrastructure can capture economic value even when marketplace fee rates decline. As more categories require confidence in authenticity and condition, specialist service providers can participate in activity across multiple transaction channels rather than depending entirely on the economics of a single retail format.
The ownership boundary is also important. Goldin belongs to eBay, while PSA acquired the former eBay vault through the earlier transaction framework. Goldin’s record auction activity should not be credited to Collectors as auction-house revenue. Collectors is private, so there is no current standalone listed grading-company exposure to substitute mechanically.
Near-term catalyst: A full Q4 contribution from the completed coin-authentication rollout and expanded trading-card eligibility. Longer-duration implication: integrated authentication and grading become more deeply embedded in resale workflows. Trading-card normalization in 2027 remains a volume risk, but broader service penetration and additional categories provide a distinct growth mechanism beyond collectible-price appreciation.
PAYMENTS AND FINANCIAL INFRASTRUCTURE
PAY-BY-BANK AND CLOSED-LOOP BALANCES CREATE A SMALL BUT CLEAR CARD-RAIL SUBSTITUTION SIGNAL (READ-THROUGH 6)
Affected companies: Visa (V: United States), Mastercard (MA: United States), and TrueLayer (PRIVATE: United Kingdom). Direction: Negative for incremental card-rail monetization where substitution occurs; positive for bank-payment adoption and TrueLayer’s established eBay relationship. Magnitude: Small and unquantifiable for Visa and Mastercard at group level; strategically more significant for the specialist provider.
Call evidence: Following its UK launch, eBay expanded pay-by-bank into Germany and France. The CFO said German transactions generated high average order values and carried lower processing costs than other payment methods. Depop also introduced balance features allowing sellers to retain proceeds and use them for subsequent purchases. TrueLayer’s February announcement independently establishes its role as eBay’s UK pay-by-bank partner.
The transmission mechanism is the substitution of account-to-account payments or internally retained balances for transactions that otherwise would have used cards. Where a card transaction is displaced, the associated card-network transaction and payment-volume economics are reduced. Reusing sales proceeds within the marketplace can also reduce the need for a fresh external card payment on a subsequent purchase.
The economically important development is not simply the availability of another checkout button. eBay controls checkout, seller proceeds, and parts of the buyer-protection experience. It therefore has both the incentive and the operational ability to encourage payment methods that lower its costs while retaining customer trust. Expansion beyond the UK indicates that this is becoming a broader operating capability rather than an isolated market experiment.
The scope of the negative must remain disciplined. eBay’s total processing savings are not equivalent to lost Visa or Mastercard revenue. Merchant payment costs also include issuing-bank interchange, acquiring, processing, fraud, and other expenses. Adoption rates, displaced payment methods, and transaction allocation were not disclosed. Some bank payments may substitute for non-card methods, while a better checkout experience may generate incremental purchases.
The call also does not establish that every continental European transaction is processed by TrueLayer. Its verified UK relationship supports direct exposure to adoption there; additional country-level provider allocations should not be inferred without confirmation. Similarly, no specific acquiring or processing revenue loss can be assigned to another payment provider from this disclosure alone.
Near-term catalyst: No material network-wide earnings revision is justified by this call alone. The relevant evidence will be payment-mix disclosures and adoption during Q4 2026 and 2027. Longer-duration implication: large marketplaces are developing credible alternatives to card-funded checkout, creating competitive pressure on payment costs even before alternative rails become large enough to affect consolidated network growth materially.
Report record
- Sector
- Consumer Discretionary
- Industry
- Internet & Direct Marketing Retail
- Fiscal period end
- September 30, 2026
- Report date
- October 28, 2026
- Analysis
- 6323 words
- Read-throughs
- 2520 words
- Content fingerprint (PDF)
730d8929863d- Content fingerprint (analysis)
3f8d51edf135- Content fingerprint (read-throughs)
22dbec794300
Prepared from the company's earnings release and earnings call transcript. Figures as reported by the company. For information only. Not investment advice.
More from eBay Inc.
No other reports yet.
More in Consumer Discretionary
All Consumer Discretionary reports
Follow @AtlasPeakRes on X for new earnings reports as they publish.