Strong Franchise, but the Earnings Acceleration Has Not Arrived
Earnings Reports
Galaxy Digital Inc. FQ3 2026 Earnings Report
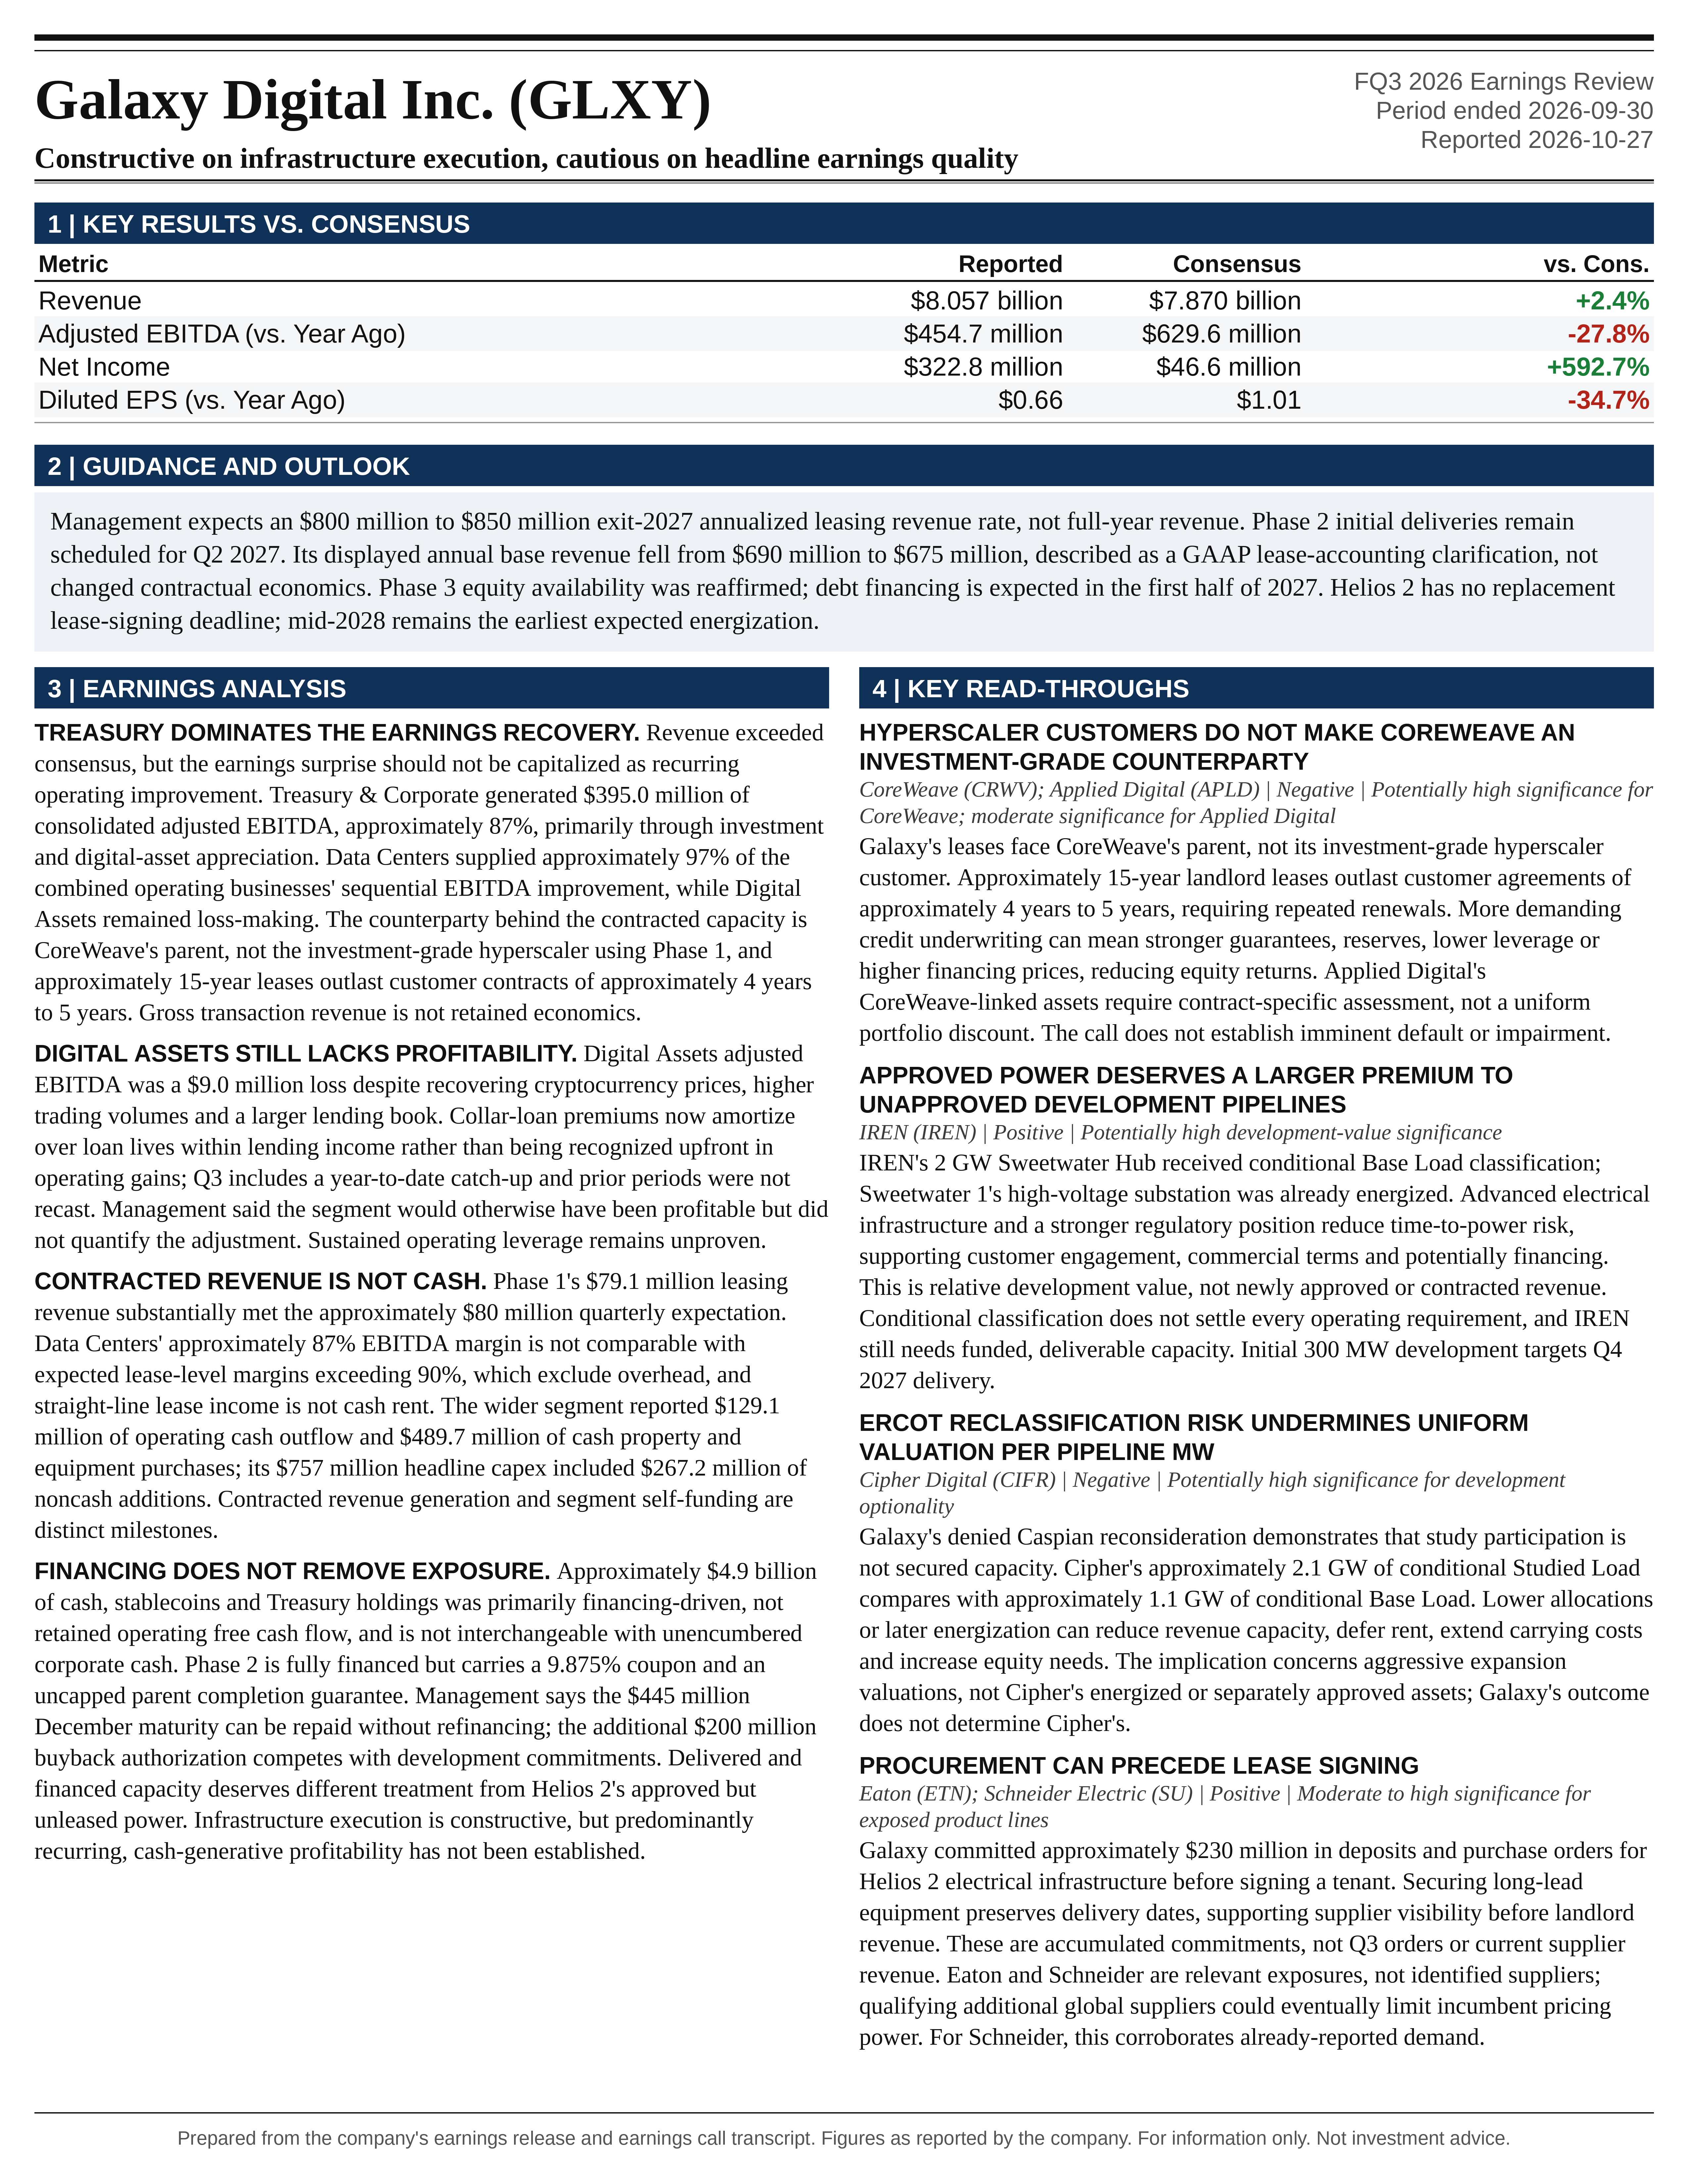
Galaxy Digital Inc. (GLXY) FQ3 2026 earnings: Constructive on infrastructure execution, cautious on headline earnings quality. Full earnings analysis, key read-throughs, and the one-page exhibit from Atlas Peak Research.
Galaxy Digital Inc. (GLXY)
Sector: Financials · FQ3 2026 · Period end September 30, 2026 · Reported October 27, 2026
Galaxy’s Q3 2026 results strengthen the case that Helios can become a substantial contracted earnings business, but they do not establish that the company has already transitioned to predominantly recurring, cash-generative profitability.
Download the one-page report (PDF)
View one-page exhibit
Download analysis (.md)
Download read-throughs (.md)
Post to X
One-Page Exhibit
Earnings Analysis
EXECUTIVE CALL SUMMARY: Galaxy Digital Inc. (10/27/26)
Galaxy’s Q3 2026 results strengthen the case that Helios can become a substantial contracted earnings business, but they do not establish that the company has already transitioned to predominantly recurring, cash-generative profitability. The most important operating achievement was the first full quarter of Phase 1 leasing revenue, which substantially met prior guidance. The most important qualification was that Treasury & Corporate still generated approximately 87% of consolidated adjusted EBITDA, primarily through investment and digital-asset appreciation. The appropriate investment interpretation is constructive on infrastructure execution, cautious on headline earnings quality, and conditional on financing, counterparty protection, and cash conversion.
Net income was $322.8 million, compared with an $85.3 million loss in Q2 and $505.1 million of income in Q3 2025. Adjusted EBITDA reached $454.7 million, versus a $77.3 million loss sequentially and $629.6 million in the prior-year quarter. Against the Bloomberg consensus supplied with the earnings notice, revenue exceeded expectations by approximately 2.4%, while net income exceeded expectations by $276.2 million. However, the earnings surprise should not be capitalized as a recurring operating improvement. Treasury & Corporate accounted for approximately 89% of the sequential increase in adjusted EBITDA.
The underlying operating businesses nevertheless improved materially. Digital Assets and Data Centers together generated $150.4 million of adjusted gross profit and $59.7 million of adjusted EBITDA, compared with $85.8 million and approximately $1.0 million in Q2. Approximately 97% of the improvement in their combined adjusted EBITDA came from Data Centers. Digital Assets remained loss-making on an adjusted EBITDA basis despite recovering cryptocurrency prices, higher trading volumes, and a larger lending book. The quarter therefore demonstrated the earnings contribution of an operating data center more clearly than it demonstrated operating leverage across the financial-services franchise.
The central forward milestone is management’s expectation to exit 2027 at an annualized leasing revenue rate of $800 million to $850 million. This represents approximately 2.5 times to 2.7 times the current rounded annualized Phase 1 revenue base. Phase 2 remains fully financed, with initial data hall deliveries expected in Q2 2027. However, annualized leasing revenue is not annual cash rent, and neither measure is distributable equity cash flow. Straight-line lease accounting, construction spending, expensive project debt, amortization, and reserve requirements materially separate reported EBITDA from cash available to shareholders.
The call also reset expectations for the unleased Helios 2 development. Management explicitly declined to provide a new lease-signing deadline after abandoning the transaction contemplated during the summer. That decision may protect long-term economics and credit quality, but stronger negotiating leverage remains a management assessment rather than an executed financial outcome. The investment case should assign substantial value to delivered and financed capacity, a conditional value to approved but unleased power, and a materially lower probability-weighted value to projects still dependent on ERCOT allocation.
RESULTS, CONSENSUS, AND EARNINGS QUALITY
Reported revenue of $8.057 billion exceeded the supplied Bloomberg estimate of $7.870 billion by approximately $187 million. Net income of $322.8 million was approximately 6.9 times the $46.6 million consensus estimate. No comparable adjusted EBITDA consensus was supplied, so the quarter cannot be described as an adjusted EBITDA beat of a specified magnitude.
Revenue requires particular care because Galaxy reports substantial digital-asset transaction activity on a gross basis. The $8.057 billion revenue line is also distinct from the broader $8.688 billion measure of revenues and gains from operations, which includes $551.7 million of operating gains and $79.1 million of data center leasing revenue. Comparing the broader measure with a consensus estimate for the narrower revenue line would overstate the revenue surprise. Adjusted gross profit is more informative about retained economics than gross trading revenue, although it remains sensitive to investment gains.
The sequential recovery was substantial but concentrated. Consolidated adjusted gross profit increased from $43.4 million to $569.3 million. Treasury & Corporate moved from a $42.5 million adjusted gross loss to $418.9 million of adjusted gross profit, contributing approximately 88% of the increase. Data Centers contributed another $58.9 million of improvement, while Digital Assets contributed $5.6 million. This is not a quarter in which broadly distributed recurring revenue growth explains the headline result.
The year-over-year comparison is considerably less favorable. Revenue declined 71.6%, adjusted gross profit declined 21.9%, adjusted EBITDA declined 27.8%, and net income declined 36.1%. Diluted EPS fell from $1.01 to $0.66. These declines partly reflect an unusually strong Q3 2025 comparison, when trading volumes increased 140% sequentially and Galaxy executed the sale of more than 80,000 bitcoin for a client. That historical transaction supports treating the comparison as unusually demanding, but its disclosed notional size does not establish an exact amount of nonrecurring profit that can be removed from the prior-year results.
The current historical supplement shows Digital Assets adjusted gross profit of $317.9 million in Q3 2025, compared with $71.3 million this quarter. Treasury & Corporate adjusted gross profit, by contrast, increased modestly from $408.1 million to $418.9 million. Consequently, the year-over-year earnings decline was not principally a deterioration in Treasury & Corporate investment results. It reflected a much smaller contribution from the Digital Assets operating franchise, partly offset by the new leasing business.
The year-to-date perspective also limits extrapolation. Q3 net income largely recovered the $301.6 million cumulative loss incurred in the first 6 months, leaving 9-month net income of only $21.1 million. This compares with $240.3 million in the corresponding 2025 period. The quarter was a strong recovery, not evidence that the current quarterly profit level has become a stable annual earnings base.
The distinction between consolidated and operating-business EBITDA is critical. Treasury & Corporate contributed $395.0 million of the $454.7 million total, leaving $59.7 million from Digital Assets and Data Centers before the separate Treasury & Corporate burden. As an illustrative sensitivity, eliminating Treasury & Corporate’s $418.9 million adjusted gross profit while retaining the remaining reported cost structure would leave approximately $35.9 million of consolidated adjusted EBITDA. This is not a company-reported normalized earnings measure, but it demonstrates how substantially headline profitability depends on investment returns.
EPS also requires an ownership and dilution bridge. Galaxy’s $0.83 adjusted EPS is not a conventional operating EPS measure that simply excludes unusual expenses. It assumes exchange of outstanding noncontrolling partnership interests into Class A shares. The release reports a GAAP diluted share denominator of approximately 255.7 million and an adjusted EPS denominator of approximately 452.3 million. Consolidated net income cannot be divided directly by the public Class A share count without adjusting for noncontrolling interests, taxes, and dilutive instruments. A valuation based on consolidated earnings and an incomplete equity denominator would materially misstate shareholder economics.
DIGITAL ASSETS: COMMERCIAL PROGRESS WITHOUT ESTABLISHED SUSTAINABLE PROFITABILITY
Digital Assets adjusted gross profit increased 8.6% sequentially to $71.3 million, following $49.0 million in Q1 and $65.7 million in Q2. Adjusted EBITDA improved from a $19.4 million loss in Q1 to a $10.5 million loss in Q2 and a $9.0 million loss in Q3. The direction is favorable, but profitability remains below the level implied by describing the franchise as already producing durable recurring earnings.
Global Markets adjusted gross profit increased 7.9% to $52.6 million. Trading volumes rose 12%, outperforming the broader market according to the company’s published release. The transcript alternately describes industry volumes as declining and approximately flat, so an exact market-share gain cannot be calculated from the call. The supported conclusion is relative volume outperformance, not a quantified increase in market share.
Total trading counterparties increased only modestly, from 1,741 to 1,763. The combination of 12% volume growth and approximately 1% counterparty growth suggests that higher activity within the existing franchise was more important than a dramatic expansion in the customer base. Galaxy’s breadth across spot, derivatives, financing, and structured transactions plausibly supports deeper client engagement, but the release does not disclose enough product-level profitability to identify the principal source of incremental trading economics.
The contrast between cryptocurrency price appreciation and operating profit growth is instructive. Management cited a bitcoin increase exceeding 40% during the quarter, but Global Markets gross profit rose less than 8%. Cryptocurrency prices influence client wealth, collateral values, financing demand, and sentiment, but transaction activity and retained spreads do not move proportionately with asset prices. A bullish cryptocurrency price environment is therefore insufficient by itself to establish sustained operating leverage.
The lending business expanded more rapidly. Average loans increased 27% sequentially to $1.831 billion, from $1.438 billion. However, the current balance was only approximately 3.5% above Q3 2025. This was a substantial recovery from the immediately preceding quarter rather than an equally dramatic increase relative to the prior-year business scale.
An important accounting clarification materially affects interpretation of lending growth. The historical supplement states that, beginning in Q3, premiums on collar loans are amortized over the life of the loan and classified within lending income. Previously, they were recognized upfront within operating gains. Q3 includes a year-to-date catch-up, and prior periods were not recast. Consequently, the increase in reported lending income cannot be read as a clean measure of organic spread growth, pricing improvement, or higher recurring loan profitability.
Management stated that, without the accounting change, “we would have been profitable in that segment just this quarter.” That assertion is directionally encouraging, but the exact adjustment needed to bridge the reported $9.0 million EBITDA loss to profitability was not separately quantified. The appropriate treatment is to recognize a comparability issue without assuming a specific normalized profit margin. Sustainable profitability still requires subsequent periods demonstrating that gross profit growth exceeds technology, personnel, licensing, and infrastructure investment.
The reported cost structure reinforces that requirement. The difference between Digital Assets adjusted gross profit and adjusted EBITDA was approximately $80.4 million in Q3, compared with $76.2 million in Q2. On a static-cost basis, gross profit would need to rise approximately $9.0 million, or 12.6% from Q3, to reach adjusted EBITDA breakeven. This is an analytical threshold rather than guidance, and actual requirements will change with investment spending and accounting effects.
LENDING STRATEGY, CAPITAL EFFICIENCY, AND NEW FINANCIAL PRODUCTS
Management’s most important lending statement was that “you can't really just grow a lending business ad infinitum with a finite balance sheet.” The intended response is to expand loan syndication, externally funded financing facilities, structured credit, and originate-to-distribute capabilities. If successful, this could allow transaction volume and fee income to grow faster than Galaxy’s retained balance-sheet exposure.
That strategy is economically relevant because capital is increasingly being allocated to data centers. A lending business that requires proportional growth in retained equity would compete directly with construction commitments, liquidity buffers, and buybacks. External capital can improve capital efficiency, but only if the retained first-loss exposure, warehouse commitments, liquidity support, and distribution risk are controlled.
The existing GOFR structure illustrates that distinction. Galaxy’s prior company disclosures described a $100 million commitment of its own capital as first-loss protection, subject to applicable terms. External funding therefore does not automatically make the business capital-light or remove credit exposure. Loan origination growth must be evaluated alongside retained risk, funding duration, collateral liquidity, liquidation procedures, borrower concentration, and the resilience of on-chain infrastructure.
A further risk is that institutional distribution capacity can weaken precisely when collateral values fall and borrowers need refinancing. On-chain execution may improve settlement and transparency, but it does not eliminate correlated collateral declines, oracle failures, smart-contract vulnerabilities, or liquidity gaps. The risk-adjusted value of the lending franchise depends on performance through stress, not only on origination growth during a cryptocurrency recovery.
The first compute-linked derivatives transaction is strategically interesting but not yet financially material on the disclosed evidence. It extends Galaxy’s financial intermediation capabilities toward a market linked to its infrastructure activities. However, a repeatable compute derivatives franchise would require robust reference pricing, standardized contract terms, effective hedging, enforceable settlement, and sufficient market depth. No meaningful revenue, notional volume, or profitability contribution was disclosed. It should be valued as an early commercial experiment rather than an established earnings stream.
ASSET MANAGEMENT, STAKING, AND INSTITUTIONAL INFRASTRUCTURE
Asset Management & Infrastructure Solutions adjusted gross profit increased 10.6% sequentially to $18.7 million. AUM increased to approximately $5.9 billion, while assets under stake increased 64% to approximately $4.6 billion. These balance increases materially exceeded the growth in recognized gross profit.
Management attributed the gap partly to timing: quarter-end balances incorporate late-quarter asset additions, whereas fees reflect activity throughout the quarter. That explanation supports a potential revenue benefit in subsequent periods if balances persist. It does not establish that fee revenue will increase proportionately with quarter-end AUM because product mix, fee schedules, performance fees, institutional pricing, and staking economics also matter.
The historical comparison is again more restrained than the sequential figures. AUM remained approximately 32.6% below Q3 2025, and assets under stake remained approximately 30.9% below the prior-year level. Asset Management & Infrastructure Solutions gross profit was approximately 19% below Q3 2025. The current quarter therefore represents a recovery and an evolving product mix rather than an unambiguous new operating peak.
Reported platform asset totals also contain overlap. The company disclosed approximately $1.2 billion included in both Alternatives and assets under stake. Those assets can produce distinct management and staking fees, so the overlap does not invalidate the commercial opportunity. However, adding AUM and assets under stake does not produce a measure of unique externally supplied capital. These balances also include certain Galaxy-affiliated assets, seed investments, and unfunded commitments in closed-end vehicles.
Asset Management generated more than $160 million of net inflows during Q3, supported by the Sharplink Onchain Yield Fund launch. That is positive evidence of distribution capability, but it is modest relative to the approximately $1.5 billion sequential increase in AUM. Market appreciation and other balance movements remain important. Likewise, the more than $400 million of gross staking inflows cited on the call covers both Q3 and the period after quarter-end. It should not be treated as Q3 net inflows or used to derive a precise organic growth rate for the quarter.
SWEEP approaching $300 million of AUM is a useful early indicator of demand for tokenized liquidity management. The strategic value is access to institutional workflows and the potential to combine cash management, collateral movement, and on-chain financing. The absolute balance remains small relative to Galaxy’s consolidated earnings requirements, and no product-specific fee rate or contribution margin was disclosed. Its current importance is product validation and relationship development, not near-term transformation of group profitability.
The BNY relationship is another meaningful validation point, but it was already disclosed with the prior quarter’s results. Q3 commentary primarily reinforced its strategic significance rather than announcing an entirely new client win. BNY’s scale as a custodian should not be confused with assets committed to Galaxy, contractual minimum revenue, or an immediately accessible addressable market.
Management described a potentially attractive commercial model involving upfront infrastructure development work followed by recurring platform services. Institutions that require ownership of core technology can pay Galaxy to help build it, while outsourcing other functions such as staking or selected infrastructure services. This could create a combination of implementation revenue, recurring licensing or service revenue, and trading or financing cross-sell.
The risks are equally material. Large financial institutions have long procurement cycles, substantial negotiating power, and the ability to internalize strategic functions. Bespoke development can produce a services-heavy revenue mix rather than software-like margins. Evidence of a scalable platform will require recurring revenue disclosure, repeat deployments, implementation efficiency, retention, and demonstrable cross-sell, rather than partnership announcements alone.
Management appropriately limited the near-term contribution, stating, “It's not going to dominate our revenue in the next 12 months.” The opportunity was framed over 24 months to 36 months. That timing argues against using an institutional tokenization narrative to justify a near-term earnings multiple unsupported by current profits.
GalaxyOne remains similarly early. Assets on the platform were described as exceeding $125 million, with expanded brokerage and wealth-management capabilities expected to begin rolling out in Q1 2027. Its economic significance will depend on funded customers, average balances, acquisition costs, retention, product usage, and contribution margins. None of those operating measures was disclosed in sufficient detail to support a material near-term earnings forecast.
HELIOS PHASE 1: DELIVERY AGAINST GUIDANCE, BUT NOT YET FREE CASH FLOW
Phase 1 generated $79.1 million of leasing revenue in Q3, substantially meeting the approximately $80 million quarterly expectation provided with Q2 results. All 133 MW of critical IT capacity had been delivered by the end of Q2. The quarter therefore validates the transition from construction to revenue recognition, rather than reflecting additional capacity delivered during Q3.
Data Centers adjusted gross profit increased from $20.1 million to $79.1 million, and adjusted EBITDA increased from $11.5 million to $68.7 million. The approximately 87% segment EBITDA margin on leasing revenue is strong. It should not, however, be compared directly with the company’s expected lease-level margin exceeding 90%, because lease-level margins exclude overhead. The difference does not by itself demonstrate a miss against project-level guidance.
Pass-through operator economics also matter. Data center operator revenue of $9.9 million was offset by an equal amount of operator costs. Those amounts increase reported revenue but do not increase adjusted gross profit. Comparing Galaxy’s reported data center margins with peers requires consistent treatment of electricity, operating reimbursements, and landlord overhead.
The most important accounting distinction is between recognized rent and cash rent. Galaxy’s Q2 filing states that operating lease income is recognized on a straight-line basis. Its disclosed schedule of future minimum lease income for operating leases included approximately $259.1 million for 2027, materially below the approximately $315 million annual Phase 1 revenue figure in the investor presentation. The schedule and presentation have different measurement purposes, but the difference illustrates why annualized GAAP leasing revenue should not be treated as annual cash collections.
The Q3 historical supplement provides an even clearer cash-flow qualification. Data Centers reported $129.1 million of operating cash outflow, including a $152.2 million working-capital outflow, and $489.7 million of cash property and equipment purchases. Operating cash flow less cash capital expenditure was therefore approximately negative $618.8 million for the segment. This analytical measure includes the development business and should not be interpreted as standalone Phase 1 operating performance.
The call’s $757 million capital expenditure figure also differs from cash spending. The supplement reports $489.7 million of cash purchases and $267.2 million of noncash property and equipment additions, which approximately reconcile to the headline figure. Treating all $757 million as current-quarter cash expenditure would overstate immediate cash usage. Conversely, excluding noncash additions from the assessment of construction commitments would understate the scale of ongoing investment.
The correct conclusion is that Phase 1 has established a meaningful contracted operating contribution while the wider data center segment remains heavily dependent on external financing and parent capital. Contracted revenue generation and segment self-funding are distinct milestones.
PHASE 2 AND THE 2027 OUTLOOK: GUIDANCE RECONCILIATION
Management expects Phase 2 to add 260 MW of critical IT capacity, with initial data hall deliveries beginning in Q2 2027. That commencement timing is unchanged from the prior quarter. Construction was described as on schedule and within budget, with spending expected to accelerate and a significant portion of remaining expenditures concentrated in the first half of 2027.
The $800 million to $850 million exit-2027 annualized leasing revenue target provides an important intermediate earnings marker. If maintained through a full quarter, that pace would correspond to approximately $200 million to $212.5 million of quarterly leasing revenue. It is not guidance for $800 million to $850 million of recognized revenue during calendar 2027.
There is also a genuine disclosed change in the Phase 2 presentation. The Q2 investor deck showed $690 million of average annual base revenue, while the Q3 deck shows $675 million of annual base revenue, a $15 million or 2.2% reduction in the displayed figure. The labeling and explanatory footnote also changed. The current presentation refers to anticipated annual revenue at full turnover, including escalators, and explains that each hall is leased through the end of a base term commencing with delivery of the final hall.
Management characterized the difference as accounting clarification rather than a change in contractual economics: “It's simply a clarification of the recognition under lease accounting for GAAP purposes.” That distinction should be preserved. The reported revenue assumption has changed and models should reflect the current presentation, but the available evidence does not establish a reduction in contracted cash rent, capacity, or economic consideration.
The prior delivery schedule nevertheless creates a reconciliation question. Galaxy’s August commentary anticipated 7 of 8 Phase 2 halls operating by year-end 2027, with the final hall following in early 2028. A simplistic model allocating the $675 million full-turnover revenue equally across 8 halls and adding $315 million for Phase 1 would imply approximately $906 million at 7-hall delivery, above the new $800 million to $850 million exit rate.
That calculation is not proof of a construction delay because equal hall economics, recognition timing, and annualization methodology may be inappropriate assumptions. It does show that the public numbers do not fully reconcile without an updated hall-level revenue schedule. The current exit-rate guidance should take precedence over a mechanical hall-count extrapolation, and the earlier 7-hall expectation should not be assumed unchanged merely because initial delivery remains scheduled for Q2.
There is a separate disclosure inconsistency in the aggregate long-term revenue descriptors. The Q2 earnings release cited anticipated average annual revenue exceeding $1.2 billion across the contracted phases, while both the Q2 and Q3 investor presentations used the broader formulation of more than $1 billion. The current “more than $1 billion” language is therefore not independently sufficient evidence of a newly announced aggregate revenue cut. Phase-specific figures, contractual cash schedules, and the new exit-rate guidance are more useful than comparing these rounded descriptions.
Phase 3 requires a further funding distinction. Management reaffirmed that its equity funding is available and that debt financing is expected to be pursued in the first half of 2027. This is not equivalent to saying Phase 3 is fully financed on the same basis as Phases 1 and 2. The equity commitment appears unchanged, but debt pricing, covenants, available leverage, and closing conditions remain future execution items.
HELIOS 2: LEASING OPTIONALITY VERSUS EXECUTION RISK
Helios 2 should be distinguished from Phase 2 of Helios 1. Helios 1 comprises the 800 MW gross-power development contracted to CoreWeave across 3 phases, totaling 526 MW of critical IT capacity. Helios 2 is the separate approximately 830 MW of approved gross-power capacity that remains unleased. Confusing these categories would overstate contracted capacity and understate the remaining commercialization requirement.
Management’s explanation for abandoning the summer transaction was more substantive than a simple delay. It cited tightening power availability, competing project delays, stronger demand for 2028 capacity, more selective financing markets, and concerns over the actual protection offered by investment-grade credit enhancements.
The clearest statement of capital discipline was that Galaxy is “not going to compromise on terms just to meet an announcement date.” The strongest credit observation was that “an investment-grade wrap that doesn't actually achieve investment-grade protection for both our debt and our equity isn't really an investment-grade wrap.” These comments correctly distinguish a high-quality name attached to a transaction from enforceable protection across the full economic exposure.
For shareholders, relevant protections include the duration and scope of guarantees, coverage of construction-period obligations, rent and termination payments, operating expenses, assignment rights, and the allocation of residual risk after lenders are repaid. A structure that protects project debt but leaves equity exposed to a weak operating counterparty may improve debt execution without providing equivalent protection to common shareholders.
The economic case for waiting is plausible. If fewer competing projects can deliver in 2028 through 2030, approved power can become more valuable. Direct investment-grade counterparties could also support better financing terms, lower required reserves, or reduced sponsor equity commitments. These benefits can outweigh a modestly lower headline rent if they improve risk-adjusted equity returns.
However, waiting has costs. Carrying costs continue, procurement commitments increase, counterparties can change requirements, and the time available for design, construction, commissioning, and acceptance contracts. Management’s approximately 1.75-year window to mid-2028 is the total development window, not simply the time available to negotiate a lease.
The signing timetable is now less definite than earlier commentary. The call referred to a prior summer aspiration and an analyst’s recollection of a 12-month objective discussed in February. Management did not reaffirm a specific date, stating, “I wouldn't peg a specific time.” The correct modeling response is to remove confidence in a dated signing catalyst while retaining mid-2028 as management’s earliest expected energization timing. No specific replacement signing deadline was established.
COREWEAVE CREDIT: DIVERSIFICATION AT THE CUSTOMER LEVEL DOES NOT CREATE A HYPERSCALER GUARANTEE
The CoreWeave discussion was among the call’s most consequential disclosures. Galaxy’s existing leases face CoreWeave’s parent company, not the investment-grade hyperscaler whose workloads currently occupy Phase 1. The presence of a large hyperscaler customer does not give Galaxy a direct claim against that customer.
Management explained that Galaxy faces “CoreWeave's residual equity and interest in those contracts after their site-level GPU secured financings.” Economically, this highlights dependence on CoreWeave’s ability to generate cash after substantial secured financing obligations. The statement does not establish the complete legal priority of every lease claim, but it clearly rejects the interpretation that Galaxy possesses a direct investment-grade customer guarantee.
Parent-level exposure has a genuine benefit: it provides access to CoreWeave’s broader customer portfolio rather than concentrating Galaxy on the customer temporarily allocated to a specific facility. However, customer diversification is not equivalent to diversification of Galaxy’s legal counterparty. All existing contracted Helios capacity remains exposed to CoreWeave’s overall financing, liquidity, operating execution, and customer renewal performance.
There is also a duration mismatch. Galaxy’s base leases extend approximately 15 years, while management described CoreWeave’s customer contracts as generally closer to 4 years to 5 years. CoreWeave must renew or replace customer commitments multiple times during Galaxy’s lease duration. Long lease terms improve revenue visibility only to the extent that the tenant remains able and willing to perform.
The possibility of transferring a lease to a customer-linked special-purpose vehicle could improve or weaken credit quality depending on the structure. A direct, enforceable investment-grade obligation may be preferable to parent exposure. A narrowly capitalized vehicle with limited guarantees, restrictive cash waterfalls, or shorter customer contracts may not be. Galaxy’s consent rights are valuable, but the relevant question is the post-transfer claim and cash-flow protection, not the use of an SPV itself.
These disclosures argue against valuing the existing CoreWeave leases at the same discount rate as leases directly guaranteed by a major investment-grade hyperscaler. They also explain why management is emphasizing stronger counterparty protection for Helios 2.
ERCOT, PERMITTING, AND THE QUALITY OF THE POWER PIPELINE
Galaxy’s more than 5.7 GW gross-power pipeline contains materially different development stages. Approximately 1.63 GW at Helios 1 and Helios 2 has previously approved capacity and conditional Base Load classification. Caspian, Selene, and Helios 3 represent approximately 2.6 GW of conditional Studied Load capacity subject to allocation. Additional expansion opportunities complete the broader pipeline.
These categories should not receive a common valuation per MW. Base Load classification means the projects are modeled in the study rather than competing for further capacity allocation, according to Galaxy’s September update. Studied Load projects remain subject to allocation. Both classifications were issued within an ongoing audit and community-impact review process.
Caspian’s outcome was a tangible negative development. Galaxy sought Base Load treatment for its 700 MW project, received Studied Load classification, and disclosed that its reconsideration request had been denied. The project remains in Batch Zero, but its capacity and energization schedule have greater uncertainty than the company initially sought. This should affect probability-weighted development value even if it does not change current earnings.
Management identified December 2026 audit results and expected April 2027 allocation clarity as important milestones. April should be treated as management’s current expectation based on communications with ERCOT, not an unconditional regulatory completion guarantee. The draft call references a September gubernatorial directive, whereas the company’s published September update identifies the relevant directive as dated August 3. The substantive issue is the continuing review and conditional classification, not the transcription of the directive’s month.
Management believes existing permits allow construction to continue and that outstanding approvals should not prevent anticipated energization. Remaining matters were described as relating primarily to backup generation and selected site utilities rather than cooling. That is reassuring but does not remove every commercial dependency. Tenant acceptance, lender conditions, insurance requirements, and operational resilience may depend on backup capability even where basic energization is legally possible.
Galaxy has committed approximately $230 million in deposits and purchase orders for Helios 2 electrical infrastructure, versus more than $180 million disclosed in August. This provides evidence of proactive procurement and may protect the schedule. It also increases exposure before a lease is signed. Deposits and purchase orders are not identical to cash paid, and their recoverability depends on cancellation rights, equipment standardization, supplier performance, and alternative deployment opportunities.
PROJECT FINANCING, LIQUIDITY, AND ECONOMIC RETURNS
The completed Phase 2 financing reduces near-term funding uncertainty, but its cost is substantial. Galaxy’s July financing disclosures specify $3.507 billion of senior secured notes carrying a 9.875% coupon, maturing in August 2031. Interest at the original principal balance is approximately $346.3 million annually. The announced amortization rate is 4% of original principal, approximately $140.3 million annually when applicable, with initial amortization deferred until the specified period after project completion.
Those terms explain why a high lease-level EBITDA margin should not be equated with a high distributable equity margin. Applying a 90% margin to the current $675 million Phase 2 revenue figure produces approximately $607.5 million of lease-level accounting EBITDA before overhead. Initial-principal interest plus the stated annual amortization amount would total approximately $486.6 million. This comparison is not a debt-service coverage calculation because the revenue figure is not the relevant annual cash-rent schedule. It nevertheless demonstrates that financing obligations absorb a substantial portion of project economics.
The construction cost estimate remains approximately $4.0 billion, or $15.4 million per MW of critical IT capacity. Phase 1’s disclosed $1.8 billion construction cost equates to approximately $13.5 million per critical IT MW. The difference does not independently establish cost inflation because scope and specifications may differ, but it reinforces the need to evaluate each phase’s return separately rather than applying a uniform campus yield.
At $4.0 billion of cost and the illustrative $607.5 million accounting EBITDA figure, the apparent EBITDA-to-cost ratio is approximately 15.2%. That is not an equity IRR or a cash yield. Construction timing, straight-line rent recognition, financing reserves, maintenance expenditure, taxation, amortization, and terminal value all intervene before shareholder returns can be assessed.
The financing also contains a material parent exposure that qualifies the description of Phase 2 as fully funded. The July 28 filing discloses an uncapped completion guarantee from Galaxy Digital Holdings LP if available financing and contributed capital are insufficient to satisfy the conditions for rent commencement. Secured financing therefore reduces the base-case capital requirement without eliminating construction-overrun exposure. On a $4.0 billion project, a hypothetical 10% cost increase would equal $400 million before potential offsets, approximately 13% of current consolidated book equity.
Firm-wide cash, stablecoins, and Treasury holdings totaled approximately $4.9 billion, compared with $2.5 billion at June-end. The increase was primarily financing-driven, not retained operating free cash flow. The composition was approximately $1.325 billion of cash and equivalents, $812 million of stablecoins, and $2.756 billion of Treasury securities. Those categories should not be treated as interchangeable with unencumbered corporate cash.
The data center cash-flow statement shows approximately $2.75 billion invested in securities during the quarter and approximately $760 million of segment cash at quarter-end. A substantial portion of group liquidity therefore sits alongside project financing and construction requirements. The precise unrestricted corporate surplus cannot be determined by subtracting a few headline obligations from the consolidated liquidity total.
Management’s statement that the $445 million December 2026 exchangeable-note maturity can be repaid without refinancing is important evidence against an immediate liquidity crisis. However, repayment still consumes resources that could otherwise support construction contingencies, financial-services risk capital, and buybacks. The availability of cash does not make competing capital uses economically costless.
The expected accounting progression also matters. As construction proceeds are deployed, interest income on temporary investments will decline. More borrowing costs will be capitalized rather than expensed, potentially improving current GAAP earnings relative to a fully expensed presentation while adding to the asset base and future depreciation. Capitalization does not reduce cash interest obligations. The Q3 data center EBITDA reconciliation already removes $24.3 million of non-operating income, so the runoff of that income should not automatically be modeled as an equivalent reduction in adjusted EBITDA.
TREASURY INVESTMENTS, BUYBACKS, AND BALANCE-SHEET RESILIENCE
Treasury & Corporate ended Q3 with approximately $1.717 billion of net digital-asset and investment exposure. The presentation identifies approximately $538 million of bitcoin exposure, $128 million of ether, $108 million of Solana, $77 million of other tokens, $841 million of venture and fund investments, and $25 million of other liquid investments. Nearly half of the reported exposure is therefore venture and fund investments rather than readily monetizable cash.
The approximately $559 million increase in total exposure from Q2 is not itself a measure of investment profit. Purchases, sales, capital movements, and valuation changes can all affect the balance. Likewise, investment appreciation should not be added to a valuation separately if it is already reflected in the investment portfolio’s carrying value.
The AI-related portfolio commentary supports the possibility of meaningful investment upside. Management cited more than $80 million deployed across 11 companies through 17 investments, with a current unrealized multiple of 3.4 times. That multiple is a cumulative valuation observation, not a quarterly realized return. Its economic significance depends on investment timing, ownership, dilution, realization prospects, and how much of the exposure belongs directly to Galaxy rather than managed vehicles.
The targeted $250 million to $300 million successor venture fund could convert investment performance into a larger fee-paying capital base. A first close is expected toward the end of Q4. However, the 2.25 times gross multiple cited for the preceding fund is not a net investor return, an annualized return, or realized carry. Fundraising success and cash realizations remain distinct catalysts.
Book equity increased approximately 10% sequentially to $2.991 billion, but remained approximately 5.7% below the prior-year quarter and 1.4% below year-end 2025. Meanwhile, assets increased to $16.417 billion. Gross assets relative to equity rose from approximately 4.0 times at June-end to 5.5 times at September-end. This is not a regulatory leverage ratio because the balance sheet contains trading assets, collateral, and associated liabilities, but it demonstrates the increasing scale of obligations supported by the equity base.
Capital allocation has also become more concentrated in operations. Approximately 48% of equity was allocated to Data Centers, 33% to Digital Assets, and 19% to Treasury & Corporate. This creates a stronger operating orientation, but less residual flexibility to absorb simultaneous construction problems and financial-market stress.
Galaxy completed its initial $200 million repurchase authorization by October 15 and authorized an additional $200 million. Approximately $79 million was spent during Q3. The new authorization is a dollar amount, not an authorization to repurchase 200 million shares, and it does not obligate the company to spend the full amount.
Buybacks can create value if shares trade materially below conservatively estimated intrinsic value and liquidity remains adequate. However, the new $200 million capacity equals approximately 6.7% of current book equity, making it a meaningful discretionary allocation alongside the December debt maturity and development commitments. Management’s stated ordering of business funding first, liquidity reserves second, and opportunistic repurchases thereafter is appropriate.
The statement that repurchases more than offset compensation-related dilution should not be read as eliminating total dilution risk. Convertible securities and partnership exchanges materially affect the economic share count and EPS calculations. Buybacks, compensation issuance, convertible dilution, and changes in partnership ownership require separate reconciliation.
INVESTMENT IMPLICATIONS, SCENARIOS, AND CATALYSTS
The quarter supports a more differentiated valuation approach rather than a blanket re-rating. Delivered Phase 1 capacity has now demonstrated contracted revenue recognition. Phase 2 deserves value for an executed lease, secured financing, and visible construction progress, but still requires completion, cash conversion, and counterparty-risk discounts. Helios 2 should be valued as approved but uncontracted development capacity. Studied Load and other pipeline projects warrant lower, probability-weighted values net of future capital requirements.
The Digital Assets franchise should be valued on sustainable earnings and returns on required capital, not on gross trading revenue or the assumption that all institutional tokenization activity becomes high-margin software revenue. Treasury investments should be assessed separately using realizable value, liquidity, tax, and valuation-risk adjustments. Corporate costs, project and corporate debt, completion guarantees, partnership interests, and convertible claims must then be reconciled without double counting.
Illustrative operating scenarios provide a framework for assessing the next 12 months to 18 months. These probabilities are analytical judgments, not management guidance or market-implied forecasts.
A base case with a 50% probability assumes Phase 2 begins delivery in Q2 2027, Galaxy achieves the stated $800 million to $850 million exit-2027 leasing revenue rate, and Digital Assets approaches breakeven without yet producing substantial normalized profits. Helios 2 remains a credible 2028 development, but a satisfactory lease and financing structure are required before assigning it contracted-asset value.
A bull case with a 25% probability assumes stronger or earlier Phase 2 turnover, producing a roughly $900 million to $990 million exit leasing revenue rate, together with an economically attractive Helios 2 agreement backed by direct investment-grade credit or equivalent enforceable protection. This revenue outcome would require delivery or recognition ahead of the current base schedule. Institutional infrastructure wins and sustained digital-asset profitability would broaden the earnings base and reduce dependence on treasury gains.
A bear case with a 25% probability assumes construction, approval, or tenant-acceptance delays reduce the exit leasing revenue rate to approximately $600 million to $700 million. Helios 2 signing is deferred or requires weaker economics, while cryptocurrency weakness reduces trading activity, fee balances, and treasury marks. In that environment, buybacks would appropriately become secondary to liquidity preservation and construction commitments.
Using the midpoints of those illustrative ranges produces a probability-weighted exit leasing revenue rate of approximately $810 million. This is not a full-year revenue forecast, cash-flow estimate, or share-price target. The principal valuation asymmetry is that a shortfall can simultaneously defer rent, extend construction-period financing costs, and increase sponsor capital requirements, whereas upside rent is still subject to debt service and other claims.
The most immediate catalysts are December audit outcomes and resolution of the $445 million note maturity. Q4 venture fundraising and additional staking partner launches provide smaller operating milestones. Q1 2027 GalaxyOne product releases may demonstrate distribution progress, but their near-term earnings contribution remains unquantified. The more consequential 2027 milestones are Phase 3 debt financing, expected April power-allocation clarity, and the beginning of Phase 2 deliveries in Q2.
A Helios 2 lease announcement could be the largest discrete valuation catalyst, but its quality matters more than its date. The critical disclosures would be tenant identity, guarantee structure, capacity, rent commencement, cash escalators, construction responsibility, termination provisions, required sponsor equity, financing availability, and residual shareholder protection. A large headline contract value without those details would not fully resolve the present investment uncertainty.
The call does not support underwriting a rapid return to inexpensive credit. Management’s expectation that current credit stress will eventually ease is a macroeconomic view, not a financing commitment. The investment case should remain viable under elevated financing costs and selective lender appetite. Scarce power can improve rents, but higher interest rates and tighter capital structures can absorb that benefit before it reaches equity.
Portfolio diversification should also be assessed economically rather than by segment labels. Contracted data center rents reduce direct dependence on cryptocurrency transaction volumes. Nevertheless, Galaxy retains correlated exposure to risk appetite, private technology valuations, AI capital spending, speculative-grade financing, and liquidity conditions. A portfolio already concentrated in cryptocurrency intermediaries, neoclouds, AI developers, or leveraged infrastructure would receive less diversification from Galaxy than its combination of financial services and real assets initially suggests.
The appropriate action is to avoid increasing exposure solely on the strength of the headline earnings beat. A new position requires a verified valuation that discounts CoreWeave credit, construction contingencies, cash-rent timing, and uncontracted pipeline risk. Without a verified share price and a complete debt, cash-flow, and diluted-share valuation bridge, a defensible absolute price target cannot be established.
If a valuation discount independently supports entry, a provisional 0.5% portfolio allocation, with a maximum of 1.0% before the major financing and leasing milestones, would limit concentration in the unresolved execution risks. A 30% adverse price scenario would imply approximately 15 to 30 basis points of portfolio loss at those sizes, before gap risk or correlated losses elsewhere. A 20% drawdown should trigger immediate reassessment rather than an automatic averaging-down decision.
Fundamental exit or reduction triggers should include a material departure from the Phase 2 delivery schedule, cost overruns that impair liquidity buffers, deterioration in CoreWeave’s ability to meet lease obligations, an adverse change in approved-power treatment, or evidence that Digital Assets cannot move toward profitability without persistent treasury gains. Conversely, successful Phase 2 delivery, transparent cash-rent conversion, investment-grade Helios 2 contracting, and sustained operating profits would justify reducing the current execution discount.
Overall, Q3 demonstrated that Galaxy’s infrastructure strategy is producing real operating revenue and that its financing capacity remains substantial. It did not yet demonstrate a mature, predominantly recurring cash-flow model. The investment opportunity lies in converting financed development and institutional relationships into durable shareholder cash flows. The investment risk lies in paying for that conversion before credit, construction, cash conversion, and capital-allocation outcomes are sufficiently established.
SOURCE AND REPORTING BASIS
Financial comparisons reflect Galaxy’s Q3 2026 earnings release, current historical financial supplement, Q2 and Q3 investor presentations, prior-quarter lease disclosures, July financing disclosures, and September ERCOT update. Consensus comparisons use the Bloomberg notice accompanying the transcript. Current comparative figures are used where the historical supplement differs from earlier rounded releases. All dollar amounts are in US dollars. The initial draft contains inconsistent Q&A speaker labels; quotations with uncertain attribution are identified as management commentary rather than assigned to a potentially incorrect executive.
COMPANY EMPLOYEES ON THE CALL
• Michael Novogratz, Founder and Chief Executive Officer. • Christopher Ferraro, President and Chief Investment Officer. • Tony Paquette, Chief Financial Officer. • Taylor Reinhardt, Head of Investor Relations. • An unidentified company-side speaker also appears in the draft transcript; name and title were not established.
RESEARCH ANALYSTS AND OTHER QUESTIONERS ON THE CALL
• William Copps, Piper Sandler, speaking on behalf of Patrick Moley. • James Yarrow, Goldman Sachs. • Peter Christiansen, Citi. • James Faucette, Morgan Stanley. • Devin Ryan, Citizens Bank. • Edward Engel, CompassPoint. • Brett Knoblauch, Cantor Fitzgerald. • Jonathan Petersen, Jefferies. • Joseph Vafi, Canaccord Genuity. • Chris Brendler, Rosenblatt Securities. • Benjamin Summers, BTIG. • Michael Kim, Bloomberg. • Bill Papanastasiou, Chardan Capital Markets. • Martin Toner, ATB Cormark Capital Markets.
Key Read-Throughs
KEY READ-THROUGHS FROM GALAXY DIGITAL’S Q3 2026 EARNINGS CALL
Galaxy’s October 27 call provides stronger evidence of a divergence within AI infrastructure than of a uniform acceleration across the sector. Approved power, credible delivery schedules, and financeable counterparties are becoming more valuable, while conditional power pipelines and weakly protected tenant exposures warrant greater discounts. Demand remains strong, but financing and physical delivery increasingly determine which companies capture that demand profitably. In digital assets, the important divergence is between recovering asset prices and relatively subdued transaction activity, alongside evidence that established financial institutions can retain customer relationships while adopting blockchain infrastructure. The highest-conviction implications concern relative competitive positioning and earnings quality, not indiscriminate upgrades to AI or cryptocurrency equities. Country labels below identify primary listing markets; impact magnitudes refer to business or valuation significance, not predicted share-price moves.
AI CLOUD AND DATA CENTER INFRASTRUCTURE
HYPERSCALER CUSTOMERS DO NOT MAKE COREWEAVE AN INVESTMENT-GRADE COUNTERPARTY (READ-THROUGH 1)
Affected companies: CoreWeave (CRWV: US); Applied Digital Corporation (APLD: US). Direction and magnitude: Negative for investment-grade-equivalent valuation assumptions attached to CoreWeave exposure. Potentially high significance for CoreWeave’s financing economics and moderate significance for the valuation of Applied Digital’s CoreWeave-linked assets. The call does not establish an imminent default or impairment.
Call evidence: Management clarified that Galaxy’s existing leases face CoreWeave’s parent company, not the investment-grade customer currently using the facility. Galaxy described its economic exposure as “CoreWeave's residual equity and interest in those contracts after their site-level GPU secured financings.” It also explained that CoreWeave’s customer agreements generally last approximately 4 years to 5 years, materially shorter than Galaxy’s approximately 15-year base leases.
The transmission mechanism is through credit underwriting, financing availability, and the allocation of residual cash flows. A major hyperscaler’s presence at a facility does not automatically give the landlord a direct claim against that hyperscaler. CoreWeave must service substantial financing obligations and renew or replace customer contracts repeatedly during the landlord’s lease term. Consequently, headline contracted revenue cannot be valued as though it were an unconditional, duration-matched obligation of the ultimate investment-grade customer. More demanding landlords and lenders can require stronger guarantees, additional reserves, lower leverage, or higher pricing, reducing the equity returns available from new capacity.
Galaxy’s explanation for abandoning its contemplated summer transaction reinforces this distinction: “an investment-grade wrap that doesn't actually achieve investment-grade protection for both our debt and our equity isn't really an investment-grade wrap.” This is a significant negative read-through for structures whose investment-grade characterization protects lenders more comprehensively than residual shareholders.
Applied Digital is relevant because Polaris Forge 1 is leased to CoreWeave, but its exposure must be assessed contract by contract. Its October results also identified investment-grade hyperscaler tenants elsewhere in its portfolio and previously completed $1.59 billion of project notes carrying a 7% coupon. Galaxy’s comments therefore do not justify applying a uniform CoreWeave credit discount across Applied Digital’s entire business or assuming its financing has become unavailable.
The near-term trading issue is scrutiny of new financing and lease structures, particularly the identity of the obligor, guarantee duration, termination payments, and cash distributions to equity. The longer-duration issue is the mismatch between long landlord commitments and shorter underlying compute contracts. An important positive offset is that Galaxy’s existing Phase 2 remains funded and on schedule: the additional 260 MW of critical IT capacity supports CoreWeave’s future delivery capability. That is execution reassurance on an existing commitment, not a new CoreWeave backlog award.
APPROVED POWER DESERVES A LARGER PREMIUM TO UNAPPROVED DEVELOPMENT PIPELINES (READ-THROUGH 2)
Affected company: IREN Limited (IREN: US). Direction and magnitude: Positive for the relative strategic value of Sweetwater’s advanced power position. Potentially high development-value significance, but limited immediate earnings impact.
Call evidence: Galaxy said forward power availability had become more constrained because of competing-project delays and more difficult approvals, while demand for capacity beginning in 2028 had strengthened. Management argued that more than 800 MW of secured power at Helios 2 had become more valuable despite the absence of a signed lease. Its active discussions were increasingly focused on investment-grade hyperscalers seeking future capacity.
IREN’s September disclosure provides a directly relevant comparison. Its 2 GW Sweetwater Hub received conditional Base Load classification, comprising 1,400 MW at Sweetwater 1 and 600 MW at Sweetwater 2. The high-voltage substation at Sweetwater 1 had already been energized, and construction of an initial 300 MW gross-power development was underway with delivery targeted for Q4 2027.
The transmission mechanism is reduced time-to-power risk relative to less advanced competitors. When prospective customers prioritize delivery certainty, a developer with advanced electrical infrastructure and a stronger regulatory position can obtain more serious customer engagement, better commercial terms, and potentially more attractive financing. The asset becomes valuable because it can support a credible operating schedule, not merely because its owner controls land or has submitted a large interconnection request.
The qualification is that conditional Base Load classification is not unconditional approval of every construction, community, or operating requirement. Nor does 2 GW of gross power equal 2 GW of critical IT capacity or contracted revenue. IREN still needs to convert its power position into funded, deliverable, economically attractive capacity.
The near-term catalysts are regulatory confirmation, customer commitments, and construction milestones. The fundamental benefit is concentrated in 2027 through 2030. Galaxy’s call strengthens the relative case for advanced power positions such as Sweetwater, but it does not establish that IREN’s previously disclosed capacity is newly approved or that all of it should immediately receive a contracted-data-center valuation.
ERCOT RECLASSIFICATION RISK UNDERMINES UNIFORM VALUATION PER PIPELINE MW (READ-THROUGH 3)
Affected company: Cipher Digital (CIFR: US). Direction and magnitude: Negative for aggressive valuations of its Studied Load expansion portfolio. Potentially high significance for development optionality, with much smaller direct implications for already energized or separately approved assets.
Call evidence: Galaxy sought Base Load treatment for Caspian, received Studied Load classification, and disclosed that its reconsideration request was denied. Caspian remains in the process, but Galaxy expects greater clarity on allocation and energization timing only in 2027. The call also distinguished approximately 1.6 GW of previously approved Helios capacity from approximately 2.6 GW of potential capacity subject to the study.
Cipher’s publicly reported September site breakdown similarly separates approximately 1.1 GW of conditional Base Load from approximately 2.1 GW of conditional Studied Load. The latter includes Mikeska, Apollo, Stingray Phase 2, and McLennan. Approximately 66% of that particular 3.2 GW classification pool therefore sits in the more conditional category. This is not the same as saying 66% of Cipher’s entire operating and development portfolio lacks approval.
The transmission mechanism is through the probability, timing, and capital intensity of commercialization. A lower allocation can reduce ultimate revenue capacity. A later energization date defers rent, extends carrying costs, and can require additional equity before operations begin. A customer may also require stronger completion protections or decline to commit until the regulatory position is clearer. These effects reduce risk-adjusted development value even when underlying demand for compute remains strong.
Galaxy’s unsuccessful Caspian appeal is important because it demonstrates that a developer’s desired classification is not necessarily obtainable through reconsideration. It is evidence against treating study participation as equivalent to secured capacity. It is not evidence that Cipher will receive the same outcome, and it should not be applied to Cipher’s energized sites or its separately approved projects.
The near-term catalysts are final classifications and audit outcomes. Later allocation and energization decisions are more fundamental. Galaxy’s expected April 2027 milestone should not be assumed to guarantee an identical schedule for every Cipher project. The actionable distinction is between valuing approved assets and valuing a probability-weighted pipeline, rather than taking a blanket negative view on Texas development.
FINANCING CAPACITY IS BECOMING A COMPETITIVE ADVANTAGE FOR ESTABLISHED DATA CENTER OWNERS (READ-THROUGH 4)
Affected company: Digital Realty Trust (DLR: US). Direction and magnitude: Positive for relative competitive positioning and medium-term leasing economics. Moderate potential earnings significance over several years; limited basis for an immediate current-year estimate increase.
Call evidence: Galaxy said financing markets had become more selective and would increasingly favor developers with proven execution, high-quality counterparties, and structures that appropriately allocate risk. Management also described stronger demand from hyperscalers, frontier laboratories, and neoclouds for 2028 capacity, alongside delays at competing developments.
The transmission mechanism favors developers capable of financing construction before tenants need delivery. Financially constrained competitors can own attractive sites yet remain unable to convert them into completed supply. An established developer can capture demand through new leases, development partnerships, or selectively acquired projects. Reduced competing supply also supports pricing for available capacity and renewals, although existing long-term leases generally cannot be repriced immediately.
Digital Realty’s previously reported results demonstrate relevant capabilities rather than merely theoretical exposure. Its Q2 disclosures showed a record signed-but-not-commenced backlog of approximately $1.4 billion of annualized GAAP base rent at its ownership share, cash renewal increases of 25.4%, and net debt to adjusted EBITDA of 4.7 times. Galaxy’s commentary corroborates the durability of favorable market conditions; it does not create additional Digital Realty bookings beyond those already disclosed.
The distinction between financing cost and headline development yield is economically material. A 100-basis-point difference in annual financing cost on $1 billion changes pretax cash interest by $10 million before amortization and other obligations. Access to lower-cost, flexible capital can therefore offset a less aggressive headline rental yield and produce superior equity economics.
The near-term trading catalyst is the next leasing, development, and funding update, particularly whether customers are committing earlier and whether financing constraints are affecting competitive supply. The longer-duration benefit is stronger access to scarce, deliverable projects. Higher market interest rates remain a valuation headwind for Digital Realty itself, so the strongest conclusion is relative competitive advantage rather than immunity from rate-driven multiple compression.
ELECTRICAL EQUIPMENT AND DATA CENTER SUPPLY CHAINS
PROCUREMENT CAN PRECEDE LEASE SIGNING, SUPPORTING EQUIPMENT DEMAND BEFORE DEVELOPER REVENUE (READ-THROUGH 5)
Affected companies: Eaton Corporation (ETN: US); Schneider Electric (SU: France). Direction and magnitude: Positive for electrical infrastructure order visibility and demand durability. Moderate to high significance for exposed product lines, but no company-specific Galaxy award can be assigned from the call.
Call evidence: Galaxy disclosed approximately $230 million of deposits and purchase orders for Helios 2 electrical infrastructure, primarily long-lead equipment, despite not having signed a tenant lease. Management emphasized the ability to “place deposits, lock up future capacity” and described Phase 2 construction spending as accelerating toward the first half of 2027.
The transmission mechanism is the sequencing of development. Transformers, switchgear, power distribution, protection equipment, and related electrical systems must be secured before a data center can be commissioned. Developers with capital may commit to equipment before completing tenant negotiations to preserve delivery dates. Consequently, a delayed lease announcement does not necessarily mean that procurement has stopped or that upstream equipment demand has disappeared.
This creates a potentially important divergence between landlord and supplier indicators. A developer’s reported leasing revenue can remain years away while equipment suppliers already have order commitments. Conversely, those commitments are not equivalent to current supplier revenue, and the $230 million is an accumulated commitment figure rather than a disclosed Q3 order flow. It should not be added wholesale to any supplier’s quarterly bookings.
Eaton and Schneider are relevant because of their established electrical distribution and power-management exposures, not because Galaxy identified either as a supplier. Schneider’s October 16 results already reported exceptionally strong data center demand and increased visibility into 2027 and 2028. Galaxy’s call is therefore corroborating customer-side evidence for Schneider, not an advance signal of an unreported Q3 beat. For Eaton, it supports the durability of the demand environment underlying its electrical orders and backlog.
The near-term catalyst is order conversion, delivery schedules, and pricing in subsequent supplier updates. The longer-duration implication is that securing electrical infrastructure is becoming an earlier, more capital-intensive part of data center development. The principal counterweight is Galaxy’s disclosure that it is qualifying additional global suppliers. Scarcity supports incumbent demand, but expanding alternative supply can eventually limit pricing power. The evidence supports electrical equipment visibility more directly than a blanket upgrade to accelerator shipment forecasts.
DIGITAL-ASSET EXCHANGES AND BROKERAGE
RISING CRYPTOCURRENCY PRICES DO NOT AUTOMATICALLY TRANSLATE INTO A SPOT-TRADING EARNINGS SURGE (READ-THROUGH 6)
Affected companies: Coinbase Global (COIN: US); Robinhood Markets (HOOD: US). Direction and magnitude: Negative for price-driven extrapolations of cryptocurrency transaction revenue. Moderate significance for Coinbase’s spot-trading economics and Robinhood’s cryptocurrency business, with a smaller and less certain implication for Robinhood’s diversified consolidated earnings.
Call evidence: Management cited a bitcoin increase exceeding 40%, yet described traditional cryptocurrency activity as “slow and tepid.” Galaxy’s own trading volumes increased 12%, while the published earnings commentary described broader spot-market volumes as declining. Global Markets adjusted gross profit increased only approximately 8%, and the Digital Assets segment remained loss-making on an adjusted EBITDA basis.
The transmission mechanism runs through turnover, customer mix, and realized monetization rather than asset prices alone. Higher cryptocurrency prices increase customer wealth and can support balances, but transaction revenue requires trading activity. A recovery driven by passive ownership, institutional positioning, or a relatively narrow group of assets need not generate the retail turnover and fee intensity associated with a broad speculative cycle.
Galaxy’s results also indicate that relative share gains and product breadth may matter more than aggregate market growth. Its institutional trading, derivatives, and financing businesses can perform differently from consumer spot brokerage. Galaxy’s outperformance therefore does not establish that Coinbase or Robinhood lost share, and its gross-profit growth rate should not be applied directly to either company.
The highest-conviction negative implication is narrower: cryptocurrency price appreciation is insufficient evidence for aggressive spot-transaction revenue upgrades. Coinbase’s derivatives, subscription, stablecoin, and institutional businesses can offset weaker spot monetization. Robinhood’s equities, options, interest income, and other products provide additional offsets. The call does not support a blanket earnings-miss prediction.
This is an immediate trading consideration around Robinhood’s October 27 results and Coinbase’s upcoming Q3 disclosure. Some of the volume information may already be reflected in public exchange data and investor expectations. Galaxy adds confirmation from an institutional intermediary, not proof of a new consensus shortfall. Over a longer horizon, the evidence favors platforms capable of generating financing, derivatives, and recurring-service revenue alongside spot trading.
CUSTODY BANKS AND INSTITUTIONAL FINANCIAL INFRASTRUCTURE
TOKENIZATION CAN REINFORCE INCUMBENT CUSTODIANS RATHER THAN DISINTERMEDIATE THEM (READ-THROUGH 7)
Affected company: The Bank of New York Mellon Corporation (BNY: US). Direction and magnitude: Positive for strategic positioning, client retention, and service expansion. Potentially moderate longer-duration significance, but low near-term earnings materiality.
Call evidence: Galaxy described its BNY relationship as validation of its institutional capabilities and explained that some large financial institutions want to own core infrastructure while outsourcing selected components. Galaxy can be paid to help build those capabilities and subsequently provide recurring services. Management explicitly cautioned that the opportunity was “not going to dominate our revenue in the next 12 months,” placing greater emphasis on the following 24 months to 36 months.
The transmission mechanism is retention of the customer relationship and expansion of the servicing package. BNY’s disclosed collaboration combines its digital-asset custody framework with Galaxy’s staking capabilities and infrastructure development expertise. Custody, fund accounting, tax reporting, payments, and client reporting can remain within BNY’s institutional model while specialized functions are supplied by a partner.
This is a constructive counterpoint to the assumption that blockchain adoption necessarily transfers value away from incumbent custodians to cryptocurrency-native platforms. Institutions can adopt new settlement and ownership infrastructure without abandoning their established governance, controls, and servicing providers. Successful integration can protect existing relationships and create incremental fee opportunities around assets that become tokenized.
The benefit is not automatic. Regulatory review, implementation costs, procurement cycles, fee-sharing arrangements, and client adoption all affect profitability. Galaxy’s infrastructure revenue is partly BNY’s expenditure, and a partnership announcement does not establish a high-margin recurring revenue stream for either party.
The near-term catalysts are production availability, regulatory progress, and identifiable client adoption rather than the original partnership announcement, which predates this call. The longer-duration catalyst is evidence that new digital services retain or expand institutional servicing mandates. The most defensible read-through is protection and extension of BNY’s franchise, not an immediate earnings acceleration.
ASSET MANAGEMENT AND TOKENIZED CASH
TOKENIZED LIQUIDITY PRODUCTS OFFER A DEFENSIVE DISTRIBUTION OPPORTUNITY FOR ESTABLISHED ASSET MANAGERS (READ-THROUGH 8)
Affected company: State Street Corporation (STT: US). Direction and magnitude: Positive for longer-term distribution and product relevance. Current direct earnings impact is very small; strategic significance is greater than the present revenue contribution.
Call evidence: Galaxy said the State Street Galaxy Onchain Liquidity Sweep Fund, SWEEP, was approaching $300 million of AUM and characterized this as an early indication of institutional product-market fit. The product provides tokenized liquidity management, with the launch documentation describing 24/7 on-chain cash management through stablecoins, subject to available liquidity.
The transmission mechanism is access to a new distribution and collateral-management channel while preserving the economics of a professionally managed investment product. Capital held for settlement or awaiting deployment on-chain can be moved into a yield-bearing liquidity vehicle without requiring the investor to return fully to traditional operating infrastructure. State Street can participate through investment management and securities servicing rather than allowing the entire relationship to migrate to a cryptocurrency-native provider.
The more important strategic implication is defensive as well as additive. If institutional cash and collateral management increasingly operate on programmable rails, established managers need products that remain usable within those workflows. A functioning tokenized product helps preserve access to client cash balances and creates potential integration into financing, treasury, and collateral systems.
The current scale should not be overstated. Even an illustrative annual fee of 50 basis points on $300 million would generate only $1.5 million of gross annual product revenue before expenses and revenue sharing. That is not a material standalone earnings driver for State Street. The illustrative calculation is a scale test, not the disclosed fee allocation to State Street.
The near-term catalyst is continued net asset growth, broader institutional use, and integration into actual treasury or collateral workflows. The longer-duration opportunity is a defensible role in the infrastructure of tokenized financial markets. Galaxy’s update is evidence of post-launch adoption, not a new fund launch or proof that tokenization has already reached financially transformative scale.
Report record
- Sector
- Financials
- Industry
- Capital Markets
- Fiscal period end
- September 30, 2026
- Report date
- October 27, 2026
- Analysis
- 7112 words
- Read-throughs
- 3013 words
- Content fingerprint (PDF)
e7e8ae831b83- Content fingerprint (analysis)
f7612b96aa59- Content fingerprint (read-throughs)
83b9fc48c314
Prepared from the company's earnings release and earnings call transcript. Figures as reported by the company. For information only. Not investment advice.
More from Galaxy Digital Inc.
No other reports yet.
All Galaxy Digital Inc. reports
More in Financials
Record Asset Gathering, but First-Half Earnings Momentum Cooled
A stronger revenue floor, but reported returns remain cyclically elevated
Follow @AtlasPeakRes on X for new earnings reports as they publish.