Strong Franchise, but the Earnings Acceleration Has Not Arrived
Earnings Reports
Morgan Stanley FQ3 2026 Earnings Report
Morgan Stanley (MS) FQ3 2026 earnings: Record Asset Gathering, but First-Half Earnings Momentum Cooled. Full earnings analysis, key read-throughs, and the one-page exhibit from Atlas Peak Research.
Morgan Stanley (MS)
Sector: Financials · FQ3 2026 · Period end September 30, 2026 · Reported October 14, 2026
Morgan Stanley’s Q3 2026 results support a selectively positive investment view, with modest initial long exposure justified by the durability of wealth asset gathering, continued strength in institutional equities, and identifiable 2027 funding benefits.
Download the one-page report (PDF)
View one-page exhibit
Download analysis (.md)
Download read-throughs (.md)
Post to X
One-Page Exhibit
Earnings Analysis
EXECUTIVE CALL SUMMARY: Morgan Stanley (10/14/26)
Morgan Stanley’s Q3 2026 results support a selectively positive investment view, with modest initial long exposure justified by the durability of wealth asset gathering, continued strength in institutional equities, and identifiable 2027 funding benefits. The quarter does not, however, establish a uniformly higher earnings trajectory. Record client inflows coexisted with sequential earnings contraction, weaker operating margins, a miss against prior Wealth Management net interest income guidance, and pronounced dependence on equities trading. The central investment question is whether unusually strong asset acquisition can become durable, attractively priced recurring revenue before capital markets activity normalizes further.
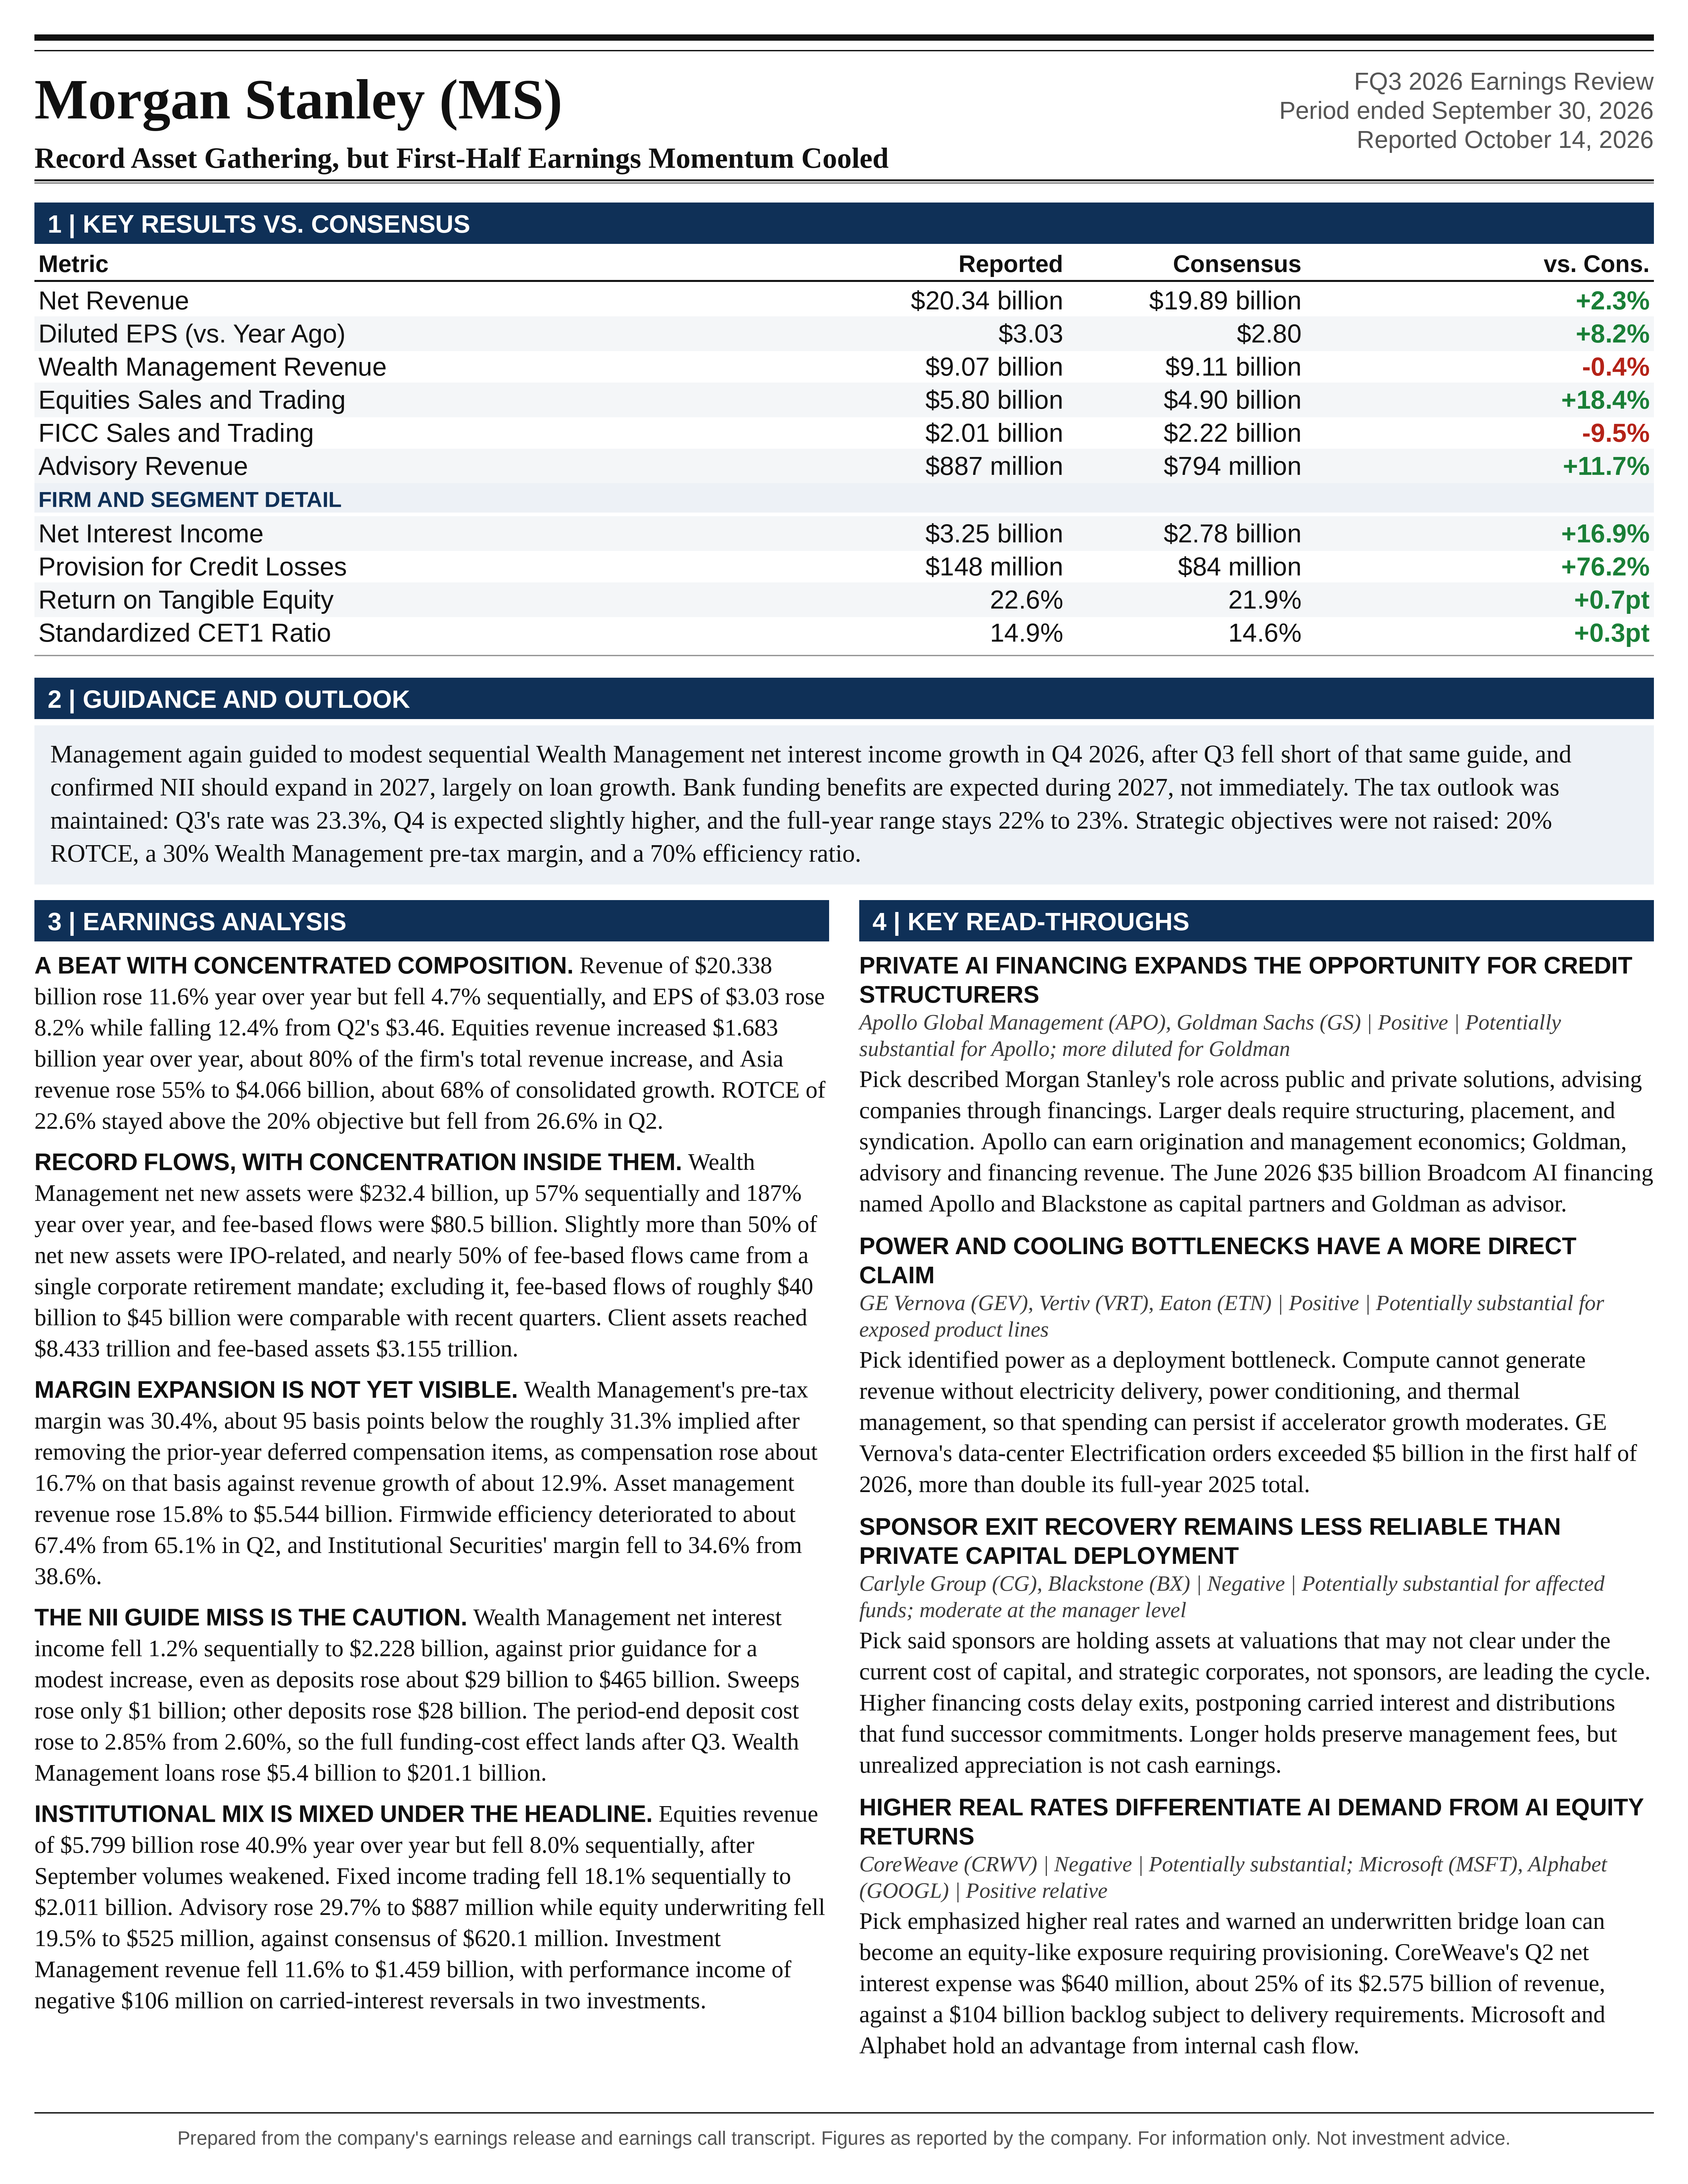
Revenue of $20.338 billion increased 11.6% year over year but declined 4.7% sequentially. EPS of $3.03 increased 8.2% year over year but declined 12.4% from $3.46 in Q2. ROTCE of 22.6% remained comfortably above the firm’s 20% objective, while falling from 26.6% in Q2 and 23.5% in Q3 2025. These results demonstrate a substantially stronger franchise than in earlier cycles, but the direction of quarterly profitability was less favorable than the record asset-gathering statistics suggest.
The most important positive development was Wealth Management’s $232.4 billion of net new assets and $80.5 billion of fee-based flows. The most important qualification is concentration within those records. Slightly more than 50% of net new assets came from IPO-related activity, while nearly 50% of fee-based flows came from a corporate retirement mandate. Excluding that retirement mandate, fee-based flows appear broadly comparable with recent quarterly levels rather than exhibiting the acceleration implied by the headline record. The franchise is successfully acquiring assets, but the timing, retention, fee yield, and incremental profitability of those assets remain incompletely disclosed.
The most important near-term earnings caution was the combination of softer September activity and less favorable expense absorption. Equities revenue increased $1.683 billion year over year, accounting for approximately 80% of the firm’s total revenue increase. Meanwhile, fixed income trading declined, equity underwriting weakened, and Investment Management absorbed a carried-interest reversal. The quarterly efficiency ratio deteriorated to approximately 67.4% from 65.1% in Q2, despite management emphasizing the stronger 66% year-to-date ratio.
The call’s forward-looking message was constructive but more conditional than the Q2 narrative. Management expects modest sequential Wealth Management NII growth in Q4 and further expansion in 2027, principally from lending growth. Bank funding benefits are expected to emerge during 2027 rather than immediately. Investment banking pipelines remain robust, but no quantitative conversion timetable was provided. AI-related investment remains strategically central, although management moved from discussing sharply rising future spending forecasts to acknowledging that spending could plateau around an already very large annual level.
At the 10/14/26 intraday Bloomberg reference price of $179.26, the shares traded at approximately 14.8 times annualized Q3 EPS, 13.5 times annualized year-to-date EPS, and 3.3 times tangible book value. Illustrative 2027 scenarios produce a probability-weighted value of approximately $212 per share and an approximately 21% total return including an unchanged annual dividend. That supports measured exposure, not an unrestricted valuation premium. Confidence is higher in the asset-gathering franchise than in the timing of margin expansion or the sustainability of current equities revenue.
QUARTERLY PERFORMANCE AND EARNINGS QUALITY
Morgan Stanley generated $6.478 billion of pre-tax income, up 7.5% year over year but down 11.8% sequentially. Net income attributable to Morgan Stanley was $4.909 billion, compared with $4.610 billion a year earlier and $5.581 billion in Q2. Revenue growth therefore exceeded profit growth year over year, while the sequential revenue decline translated into a materially larger earnings decline. The quarter was strong in absolute terms but did not demonstrate positive operating leverage on either comparison.
The contrast with year-to-date performance is important. Revenue through September increased 18% to $62.266 billion, pre-tax income increased 29% to $20.837 billion, and EPS increased 32% to $9.93. Year-to-date ROTCE was 25.4%, compared with 21.6% in the corresponding 2025 period. Management’s favorable assessment of the broader earnings trajectory is supported by these cumulative results. The incremental information from Q3, however, was deceleration from an exceptional first half.
The longer historical comparison remains favorable. Relative to Q3 2024, revenue increased approximately 32%, EPS increased approximately 61%, and ROTCE improved from 17.5% to 22.6%. Equities revenue increased approximately 90% over that period. This supports the argument that Morgan Stanley’s earnings capacity has risen structurally. It does not establish that the strongest quarters of 2026 should be treated as a permanent baseline.
The earnings beat was concentrated rather than broad. CNBC’s contemporaneous reporting cited LSEG expectations of $2.91 EPS and $19.95 billion revenue, implying beats of approximately 4.1% and 1.9%, respectively. The same report cited equities revenue approximately $909 million above StreetAccount expectations, against shortfalls of approximately $260 million in fixed income trading and $110 million in investment banking. Those comparisons use different underlying estimate datasets, but directionally indicate that equities supplied more than the entire consolidated revenue surprise.
Share repurchases contributed to per-share growth without being the dominant driver. Average diluted shares declined from approximately 1.590 billion to 1.566 billion year over year. Earnings attributable to common shareholders increased approximately 6.8%, while EPS increased 8.2%. Most EPS growth therefore came from higher earnings, with a smaller contribution from the reduced share count.
The geographic composition also deserves attention. Asia revenue increased 55% to $4.066 billion, while Americas revenue increased approximately 6% and EMEA revenue declined approximately 6%. Asia accounted for approximately 68% of consolidated year-over-year revenue growth. This is a different view of the same business mix, not an incremental contribution to be added to the equities figure. Together, the geographic and product analyses show that the quarter’s growth was more concentrated than the integrated-franchise narrative alone would suggest.
WEALTH MANAGEMENT: RECORD ASSET GATHERING, WITH IMPORTANT QUALIFICATIONS
Wealth Management revenue reached $9.065 billion, up 10.1% year over year and 2.4% sequentially. Pre-tax income reached $2.754 billion, up 10.2% year over year and 2.1% sequentially. Total client assets increased to $8.433 trillion from $8.084 trillion in Q2 and $7.054 trillion a year earlier. Fee-based assets reached $3.155 trillion, compared with $3.022 trillion in Q2 and $2.653 trillion a year earlier.
Net new assets of $232.4 billion represented a 57% sequential increase and a 187% year-over-year increase. First-9-month net new assets totaled $498.9 billion, compared with management’s rounded description of approximately $500 billion. The latest quarter’s inflows equaled approximately 2.9% of beginning-quarter client assets, or 11.5% on a simple annualized basis. That annualized rate illustrates the quarter’s magnitude, not a sustainable forecast.
Approximately $232 billion of the $349 billion sequential increase in Wealth Management client assets came from reported net new assets. Thus, roughly 67% of the asset increase was attributable to the flow measure rather than the residual contribution from market movements and other factors. Fee-based assets increased $133 billion, of which $80.5 billion, or approximately 61%, came from fee-based flows. These are meaningful signs of franchise-driven growth rather than mere participation in rising markets.
The definitions nevertheless matter. Morgan Stanley’s net new asset measure includes interest, dividends, and asset acquisitions, while excluding fees and commissions. It is not equivalent to a narrowly defined measure of externally sourced net sales. Fee-based flows can include transfers from existing brokerage accounts, whereas net new assets measure a different perimeter. Consequently, the ratio of fee-based flows to net new assets cannot be interpreted as a same-quarter conversion rate.
The acquisition mechanism was explained more clearly on this call. Q2 IPO-related inflows were predominantly employee-related. Q3 included subsequent flows from other parts of the ownership structure, including early investors, endowments, fund distributions, and individual recipients of distributed shares. The corporate relationship can therefore generate multiple asset-transfer events over several quarters. A weaker contemporaneous IPO calendar does not necessarily prevent strong wealth inflows from earlier transactions.
This mechanism creates a potentially durable advantage. Morgan Stanley can establish relationships before a liquidity event through workplace services, intermediate the financing event through investment banking, and subsequently provide custody, lending, diversification, tax planning, and investment advice. The economic opportunity is broader than the initial underwriting fee. It includes the possibility of consolidating assets previously held at other institutions after the liquidity event creates a more complex financial relationship.
The evidence does not yet establish the full lifetime economics. Management described retention rates as steady but did not disclose those rates, the proportion of IPO assets converted into fee-based accounts, the timing of conversion, or the fee yield on retained assets. Ted Pick’s statement that financial advisor retention exceeds 99% concerns advisor retention, not client asset retention. Those metrics should not be conflated.
Sharon Yeshaya also resisted treating the recent IPO cohort as a quantified forward pipeline, stating that “there’s nothing material to call out in terms of expectations for those flows as you move forward.” This is an important limit on extrapolation. Assets may remain, migrate into advice, or attract additional held-away assets, but they may also leave through consumption, real-asset purchases, taxes, diversification, or transfers.
The retirement mandate similarly requires normalization. With nearly 50% of $80.5 billion of fee-based flows coming from that mandate, remaining flows were approximately $40 billion to $45 billion. That compares with $39.1 billion in Q2 and $41.9 billion in Q3 2025. The underlying result remains healthy, but the reported doubling of fee-based flows was not evidence of a doubling in recurring individual-account conversion.
Pricing is consequential. A $40 billion mandate generates $40 million of annual revenue at a 0.10% fee but $240 million at a 0.60% fee, before expenses. These are illustrations, not estimates of the actual mandate’s pricing. Institutional retirement assets should not automatically receive the same revenue yield as discretionary high-net-worth advisory accounts. The mandate’s longer-term value could instead arise from access to participants and subsequent personal wealth relationships.
The firm’s $10.5 trillion combined Wealth and Investment Management asset figure also requires care. It is a sum of reported business measures, and official disclosures state that some wealth assets invested in Investment Management products appear in both totals. It is not a fully deduplicated measure of independent client capital. Likewise, the approximately 21 million relationships cited on the call should not automatically be treated as 21 million distinct households.
WEALTH MANAGEMENT PROFITABILITY: SCALE IS VISIBLE, MARGIN EXPANSION IS NOT YET VISIBLE
Asset management revenue increased 15.8% year over year and 5.4% sequentially to $5.544 billion. This was the strongest evidence that prior asset gathering is translating into revenue. Asset management fees represented approximately 61% of Wealth Management revenue, with NII contributing approximately 25% and transactional revenue approximately 13%. The revenue mix is increasingly supported by accumulated client assets, although those fees remain exposed to market levels and product mix.
The pre-tax margin of 30.4% was approximately unchanged from the reported year-earlier level and slightly below Q2’s 30.5%. Record inflows and record revenue therefore did not produce an immediate margin step-up. Management explicitly framed margin expansion as a multiyear consequence of scale rather than a quarterly objective. Yeshaya stated, “The pre-tax margin will expand over time with scale.” That is a directional commitment, not a new numerical target or timetable.
The deferred compensation accounting change makes the year-over-year comparison less favorable than reported margins suggest. Q3 2025 Wealth Management revenue included $206 million of DCP-related gains, while compensation included $222 million of related expense. Removing both produces prior-year adjusted revenue of $8.028 billion and adjusted pre-tax income of approximately $2.515 billion, implying a margin of approximately 31.3%. Compared with that historical adjusted base, the current 30.4% margin is approximately 95 basis points lower.
On the same adjusted comparison, revenue increased approximately 12.9%, but compensation expense increased approximately 16.7%. The accounting transition prevents a perfectly identical presentation across periods, but the disclosed historical adjustments are more informative than assuming the reported 30.3% to 30.4% comparison proves operating leverage. The underlying issue is the pace at which advisor compensation, investment spending, and lower-yielding asset growth absorb incremental revenue.
Transactional revenue was $1.166 billion, essentially unchanged sequentially. The reported year-over-year decline of approximately 11% reverses to approximately 6% growth after removing the prior-year DCP revenue benefit. Self-directed daily average revenue trades declined 14% sequentially, although they remained 8% above the year-earlier level. Record alternatives sales and product breadth helped support transactional revenue despite softer trading activity.
The strategic conclusion remains favorable, but the earnings mechanism is gradual. Larger fee-based balances improve recurring revenue capacity. They do not guarantee immediate margin expansion because advisor payouts are variable, institutional mandates may carry lower fees, and technology and client-acquisition investments are being sustained. Margin expansion should therefore be modeled as conditional on retained assets, product mix, and expense discipline rather than mechanically proportional to headline net new assets.
DEPOSITS, LENDING, AND THE NII GUIDANCE MISS
Wealth Management NII was $2.228 billion, up 11.9% year over year but down 1.2% sequentially. This was below the direction indicated on the Q2 call, when management expected a modest sequential increase in Q3. The miss is economically relevant even though its absolute magnitude was limited, because it occurred alongside strong deposit growth and continued loan expansion.
Deposits increased approximately $29 billion to $465 billion. The composition explains much of the disconnect. Brokerage sweep deposits increased only $1 billion to $147 billion, while other deposits increased $28 billion to $318 billion. Approximately 97% of deposit growth therefore came from outside brokerage sweeps. The quarter did not represent a comparable increase in the relatively attractive sweep funding base.
The period-average weighted deposit cost increased from 2.54% to 2.72%, while the period-end cost increased from 2.60% to 2.85%. The higher exit cost indicates that the full-quarter effect of the deposit mix shift may not have been reflected in Q3’s average funding expense. Future loan growth and asset deployment must overcome that higher funding base for the Q4 NII improvement to materialize.
Management characterized the deposit expansion as deliberate. Yeshaya called it “a very intentional decision, a strategic choice that we’ve made to grow the bank.” The objective is not simply to maximize current-period Wealth Management NII. It is to support eligible institutional assets with a more integrated funding structure and acquire banking relationships that can later broaden into digital or advisor-led relationships.
The timing qualification was explicit: “it’s not immediate.” Management expects the funding benefits to appear through 2027. This should prevent an immediate full run-rate benefit from being inserted into Q4 forecasts. It also argues against counting the same funding improvement in both Wealth Management NII and Institutional Securities profitability without understanding internal transfer pricing and the location of the funded assets.
The cross-selling opportunity is plausible but incompletely measured. Management stated that approximately 33% of bank-first clients eventually become digital or advisor-based clients. No conversion timeframe, acquisition cost, balance retention profile, or incremental relationship profitability was disclosed. The statistic supports the strategic rationale but is insufficient to establish a near-term earnings contribution.
Lending growth provides more concrete support. Wealth Management bank loans increased $5.4 billion sequentially to $201.1 billion, comprising $123.8 billion of securities-based and other lending and $77.3 billion of residential real estate loans. The 2.8% sequential increase was healthy but slower than Q2’s approximately $9 billion increase. Management’s 2027 NII outlook therefore depends on continued balance growth, not solely on favorable rate movements.
The updated guidance is for a modest Q4 increase, subject to rates and client behavior, followed by expansion during 2027 largely on the back of loan growth. The appropriate conclusion is constructive direction with limited magnitude visibility. The prior-quarter miss warrants requiring evidence of deposit stabilization and profitable deployment before assigning a high-confidence NII acceleration.
INSTITUTIONAL EQUITIES: THE PRINCIPAL EARNINGS ENGINE AND A MAJOR CYCLICAL EXPOSURE
Equities revenue of $5.799 billion increased 40.9% year over year but declined 8.0% from Q2’s $6.300 billion. It represented approximately 58% of Institutional Securities revenue and 29% of consolidated revenue. The franchise was the strongest contributor to both reported growth and the earnings surprise.
Prime brokerage led the result through higher financing revenue on higher average client balances. Derivatives benefited from early-quarter activity and risk management, while cash equities benefited from higher client volumes across regions. The breadth across products is encouraging because it suggests that the business is not dependent on a single trading strategy or isolated transaction.
Management’s explanation of structural improvement was specific. Pick emphasized the development of a stronger derivatives franchise connecting cash equities and prime brokerage across regions. Customized hedging and structured exposure can increase the value of the overall client relationship, strengthen financing relationships, and improve execution connectivity. This is a more credible structural argument than simply attributing the result to rising equity markets.
The cyclical qualification was equally explicit: “it would be silly to say that it’s not subject to cycles and investor sentiment.” Management described reduced Asian volumes and weaker activity during September. The quarter therefore ended with less momentum than its full-period average suggests.
Prime brokerage revenue should not be treated as equivalent to a fixed annuity. Financing balances depend on client leverage, asset values, portfolio construction, and willingness to carry risk. Revenue can be more recurring than transaction-based trading, but it remains vulnerable to deleveraging and lower collateral values. Stress can simultaneously reduce financing balances and increase counterparty-management demands.
The structural and cyclical elements consequently coexist. Morgan Stanley appears to have improved product breadth and competitive positioning, but the call did not quantify market-share gains, financing spreads, client concentration, or incremental returns on the additional balance sheet. An assumption that $5.8 billion to $6.3 billion of quarterly equities revenue is permanently recurring would exceed the evidence.
Institutional Securities profitability was less impressive than its revenue growth. Segment revenue increased 17.7% year over year, while pre-tax income increased only 9.1%. Its pre-tax margin declined to approximately 34.6% from 37.3% a year earlier and 38.6% in Q2. Higher execution-related costs, technology spending, and provisions diluted the benefit of strong equities revenue.
FIXED INCOME AND INVESTMENT BANKING: CONSTRUCTIVE BACKLOGS, MIXED REALIZED REVENUE
Fixed income trading revenue declined 7.3% year over year and 18.1% sequentially to $2.011 billion. The weakness reflected lower securitized products performance and reduced structured activity in commodities, partially offset by modestly stronger macro results supported by foreign exchange. Higher rates and geopolitical volatility therefore did not automatically translate into stronger fixed income trading revenue.
Management argued that fixed income’s value extends beyond its directly reported revenue. Its secured lending, structuring, and risk-management capabilities support underwriting, advisory, and equities relationships. That strategic connectivity is plausible, but the incremental cross-business economics were not quantified. It should not substitute for evaluating fixed income’s own revenue, capital consumption, and risk-adjusted profitability.
Investment banking revenue increased only 2.4% year over year to $2.159 billion and declined 11.4% sequentially. Advisory revenue increased 29.7% year over year and 11.2% sequentially to $887 million. In contrast, equity underwriting declined 19.5% year over year and 38.3% sequentially to $525 million. Fixed income underwriting declined 3.2% year over year and 5.2% sequentially to $747 million.
The composition suggests that completed strategic transactions were more resilient than equity issuance. It also demonstrates why robust pipelines cannot be translated directly into near-term revenue acceleration. Advisory completion timing, financing windows, underwriting size, and sponsor willingness to transact all affect realized fees.
The sponsor discussion was unusually candid. Pick acknowledged that strategic corporates, rather than financial sponsors, were leading the current financing cycle. He stated that “it’s the strategic real corporate universe that’s leading the life cycle.” Sponsor monetization remains a potential tailwind, but elevated financing costs and reluctance to accept lower valuations continue to delay exits.
Continuation funds and other financing structures can extend holding periods and reduce pressure to sell. Consequently, pent-up sponsor activity is not necessarily a near-term catalyst. A more durable recovery requires assets to clear at current capital costs and achievable valuations, rather than an assumption that interest rates will return to the conditions prevailing before the tightening cycle.
The investment banking outlook remains favorable in direction but conditional in timing. Management described pipelines as robust and diversified, with strategic activity supported by corporate investment, portfolio repositioning, and capital allocation. No backlog amount, cancellation rate, expected closing schedule, or quantitative revenue guidance was supplied.
AI: GREATER STRATEGIC COMMITMENT, MORE CAUTIOUS SPENDING EXTRAPOLATION
AI was the dominant strategic theme of the call, but the incremental message was more nuanced than a simple acceleration narrative. On the Q2 call, Pick cited data-center spending expectations of approximately $850 billion for 2026, $1.3 trillion for 2027, and potentially $1.5 trillion for 2028. Those figures were descriptions of industry expectations, not Morgan Stanley financial guidance.
On the Q3 call, management described hyperscaler spending as running around $1 trillion annually and acknowledged that “the activity from here may not accelerate.” Pick also stated, “I don’t know that it necessarily accelerates from the $1 trillion that we’re at.” The spending definitions and timeframes are not identical across the calls, so this should not be characterized as a precise numerical forecast reduction. It is nevertheless a clear shift toward emphasizing duration and scale rather than uninterrupted acceleration.
That distinction matters for bank revenue. A large, sustained investment requirement can support substantial financing and advisory activity even without faster annual capex growth. However, spending does not map directly into fee-bearing external financing. Internal cash generation, bilateral financing, private placements, fee compression, and transactions that bypass traditional intermediaries can all reduce the revenue opportunity relative to headline investment totals.
Management’s strategic response remains aggressive. Pick stated, “I would say we are now double overweight.” This was a qualitative description of organizational priority, not a disclosed doubling of capital exposure. It encompasses industry coverage, financing expertise, wealth relationships, internal AI adoption, and risk assessment.
The migration of financing from public to private markets is not necessarily adverse for Morgan Stanley. It can increase the need for structuring, placement, strategic advice, secured lending, and investor matching. At the same time, private transactions can be less transparent, more bespoke, slower to monetize, and more demanding of balance sheet commitments. The firm’s role can broaden while its exposure to liquidity and underwriting risk also increases.
The clearest risk statement concerned financing that fails to perform as intended. Pick discussed the possibility that a bridge or relationship loan “turns into a piece of equity, which eventually gets provisioned.” This directly identifies the risk of temporary intermediation becoming permanent exposure when financing markets close or project economics deteriorate.
Management’s preference for advisory value over indiscriminate balance sheet expansion is appropriate. The disclosure gap is the absence of quantified AI-related lending, underwriting commitments, collateral concentration, or exposure across the data-center and power ecosystem. “Double overweight” is therefore a strategic signal, not a measurable risk allocation.
The integrated model also creates correlated exposure. A material AI slowdown could simultaneously weaken underwriting, reduce prime brokerage balances, lower wealth asset values, delay IPO-related inflows, pressure collateral, and affect private-fund valuations. Multiple revenue channels linked to the same investment cycle are not equivalent to independent diversification.
INVESTMENT MANAGEMENT: POSITIVE FLOWS MASK MIX AND PERFORMANCE PRESSURES
Investment Management was the weakest operating segment. Revenue declined 11.6% year over year and 11.4% sequentially to $1.459 billion. Pre-tax income declined 28.8% year over year and 35.9% sequentially to $259 million. The pre-tax margin fell to approximately 17.8%, compared with 22.0% a year earlier and 24.5% in Q2.
Asset management and related fees increased only 2.0% year over year to $1.565 billion despite a 13.2% increase in ending AUM to $2.046 trillion. Timing differences between average and ending assets explain part of the comparison, but product mix is also relevant. Growth in lower-fee liquidity, overlay, fixed income, and customized strategies does not necessarily offset the revenue effect of outflows from higher-fee equity products.
The financial supplement provides a more qualified flow picture than the prepared remarks. Long-term net inflows were $15.8 billion, comprising $10.0 billion of fixed income inflows and $15.2 billion of alternatives and solutions inflows, offset by $9.4 billion of equity outflows. Year-to-date equity outflows reached $33.5 billion, compared with $13.1 billion in the comparable 2025 period. Equity AUM declined 17% year over year to $224 billion.
The positive contribution from Parametric and fixed income is therefore real, but the overall franchise is not exhibiting uniformly strong organic demand. Year-to-date long-term net inflows of $26.6 billion were 31% below the comparable, recast prior-year figure. Strong liquidity and overlay flows improved total flows but should not be assigned the same economic value as higher-fee long-term mandates.
Performance-based income and other revenue was negative $106 million, compared with positive $117 million a year earlier and positive $130 million in Q2. Management attributed the weakness primarily to carried-interest reversals involving 2 investments in a private fund. This is more concentrated than a broad deterioration across private portfolios, but it is an economic reversal of previously recognized earnings rather than a purely presentational charge.
A normalized earnings adjustment cannot simply add back the revenue reversal at a 100% margin. Compensation declined partly because of lower carried-interest compensation, so revenue and expense effects must be evaluated together. The call did not provide enough detail to isolate a precise after-tax recurring earnings adjustment.
EXPENSES, AI PRODUCTIVITY, AND OPERATING LEVERAGE
Firmwide non-compensation expense was $5.715 billion, unchanged sequentially and up 20.2% year over year. Compensation declined 2.3% sequentially but increased 7.5% year over year. With revenue declining sequentially, the relatively stable non-compensation base contributed to the deterioration in the efficiency ratio.
Information processing and communications expense increased 16.4% year over year and 8.2% sequentially to $1.302 billion. Brokerage, clearing, and exchange fees increased approximately 29% year over year to $1.467 billion. Execution-related expenses also include certain transaction taxes and regulatory charges reported elsewhere. The cost base therefore includes both strategic investment and activity-linked costs that should not be modeled as fixed overhead.
Management offered concrete examples of AI applications, including reconciliation, spreadsheet-based processes, coding, and sales support. These examples support a plausible productivity opportunity. They do not yet establish a quantified savings program, a disclosed payback period, or a firmwide margin benefit attributable specifically to AI.
Headcount also does not indicate immediate aggregate labor substitution. Employees increased to 83,728 from 82,944 in Q2 and 82,398 a year earlier, despite the Q1 workforce action that generated $178 million of severance expense. AI can still improve output per employee while hiring continues, but the quarter does not support a simple claim that AI is already reducing the absolute employee base.
The wealth moat discussion was strongest around distribution scale, differentiated products, client data, cybersecurity, and complex human advice. The countervailing risks are automated cash movement, lower-cost portfolio construction, fee transparency, and higher expectations for digital service. AI may reinforce the value of sophisticated advice while compressing the economics of routine advice and idle cash. No evidence on this call resolves the net effect across the industry.
Tokenized assets were similarly framed as an opportunity for faster transfers and additional advice. Faster mobility can also reduce switching costs and intensify deposit competition. The appropriate investment treatment is strategic optionality with uncertain near-term economics, not an immediate revenue uplift.
CAPITAL, BALANCE SHEET GROWTH, AND CREDIT RISK
The standardized CET1 ratio was 14.9%, unchanged from the latest Q2 comparative in the Q3 supplement. Standardized RWAs increased to $595.8 billion from $589.4 billion. Management emphasized approximately 300 basis points of excess CET1, equivalent to roughly $17.9 billion on current RWAs.
That arithmetic does not represent freely distributable capital. The firm must preserve operating buffers, meet leverage and liquidity requirements, absorb stress losses, and support client activity. Management explicitly described excess capital as capacity to deploy opportunistically, not solely as a source of accelerated repurchases.
The leverage measures are particularly important. The supplementary leverage ratio declined to 4.8% from 4.9% in Q2 and 5.5% a year earlier. Total assets increased approximately 24% year over year to $1.692 trillion, substantially faster than the approximately 10% increase in RWAs. The balance sheet is therefore growing faster than risk-weighted capital consumption alone suggests. No conclusion about regulatory compliance follows without the applicable current thresholds, but leverage capacity may constrain flexibility before the headline CET1 buffer is exhausted.
The firm repurchased $1.540 billion of common stock at an average price of $212.74 during the quarter and maintained the $1.15 quarterly dividend. The annualized dividend is $4.60 per share, or approximately 2.6% at the cited Bloomberg price. Repurchases reduce share count, but their value contribution depends on purchase price relative to sustainable earnings and intrinsic value. Capital return should not be treated as automatically value-accretive at any valuation.
Credit costs increased. Consolidated provisions were $148 million, compared with $98 million in Q2 and approximately zero in Q3 2025. Institutional Securities accounted for $141 million, primarily associated with portfolio growth. Net charge-offs were $106 million firmwide, including $105 million in Institutional Securities, principally involving corporate and commercial real estate loans largely reserved in earlier periods.
The charge-offs should not be counted again as an incremental expense on top of provisions. They primarily consumed existing allowances. The consolidated allowance for loans and commitments increased only $28 million to $2.068 billion after provisions, charge-offs, and other movements.
Exposure growth warrants continued monitoring. Institutional Securities corporate loans increased 45% year over year to $23.0 billion. Total Institutional Securities loans increased 23% to $126.9 billion, while lending commitments increased 23% to $225.1 billion. Securities-based Wealth Management lending also grew rapidly. Current losses are manageable relative to earnings, but a more leveraged client base and larger commitments can increase downside sensitivity if market liquidity deteriorates.
Average trading VaR increased to $61 million from $56 million in Q2 and $59 million a year earlier. That does not indicate a dramatic increase in measured daily market risk. It also does not capture the full range of concentrated counterparty, funding, underwriting, collateral-gap, and private-credit risks.
GUIDANCE: WHAT CHANGED AND WHAT DID NOT
The most concrete guidance change was a renewed expectation for modest sequential Wealth Management NII growth in Q4 after Q3 fell short of the same directional expectation given in July. Management additionally confirmed that NII should expand in 2027, largely because of loan growth. No growth percentage, ending balance target, or net interest margin forecast was provided.
The bank funding strategy remained consistent with earlier commentary, with benefits expected during 2027. This is a delayed earnings opportunity rather than evidence that the entire deposit increase is immediately profitable. The magnitude of the benefit remains undisclosed.
The tax outlook was maintained rather than raised. Q3’s effective tax rate was 23.3%, and management expects Q4 to be slightly higher. The Q2 call had specified a full-year 2026 range of 22% to 23%, which remained unchanged on the Q3 call. The approximately 22.0% year-to-date rate makes a somewhat higher Q4 rate consistent with that annual range. A modest sequential tax headwind should nevertheless be incorporated into Q4 EPS expectations.
The strategic objectives were not formally increased. The January 2026 strategic update identified 20% ROTCE, a 30% Wealth Management pre-tax margin, a 70% efficiency ratio, and more than $10 trillion of combined client assets, subject to a normal market environment. Current performance exceeds several objectives, but management deliberately avoided converting recent strength into materially higher numerical promises.
The Q2 aspiration to grow standalone Wealth Management assets toward $10 trillion also remains distinct from the already-achieved combined Wealth and Investment Management milestone. No deadline was established. At $8.433 trillion, standalone Wealth Management has progressed, but attainment remains dependent on market levels and sustained flows.
Management’s macro framing became more balanced. Strong early-quarter activity gave way to greater concern about energy prices, real interest rates, geopolitical conflict, and elevated asset valuations. The call did not provide quantitative firmwide revenue, EPS, expense, or capital-return guidance for 2027. The principal forward commitments remain directional.
VALUATION AND EXPLICIT SCENARIO ANALYSIS
At the $179.26 intraday reference price, valuation is more appealing on earnings than on tangible book value. The shares traded at approximately 14.8 times annualized Q3 EPS and 13.5 times annualized year-to-date EPS. Neither measure is a consensus forward multiple, and both annualize a period containing unusually strong capital markets activity. Price to tangible book value was approximately 3.3 times, with price to stated book value approximately 2.6 times.
The tangible book premium requires confidence in sustained excess returns. In a simplified residual-income framework, a 3.3 times tangible book valuation, a 10.5% cost of equity, and 4.5% long-term growth imply sustainable ROTCE of approximately 24.4%. That exceeds Q3’s 22.6% but is below the 25.4% year-to-date result. This is a valuation sensitivity, not a complete appraisal, but it demonstrates that the shares still embed meaningful franchise quality.
The following scenarios are independent analytical assumptions, not management guidance or consensus estimates. They use a 12-month investment horizon and 2027 earnings. Each assumes a 23% tax rate, $250 million of annual noncontrolling interests, and $650 million of preferred dividends. The probabilities are judgmental, with medium confidence in the directional operating framework and lower confidence in precise outcomes.
The base case, assigned a 50% probability, assumes $86 billion of revenue, a 66.5% efficiency ratio, $650 million of credit provisions, and 1.54 billion diluted shares. Those assumptions produce approximately $13.50 EPS. A 16 times multiple implies approximately $216 per share and a 23% total return including $4.60 of dividends. Operationally, this requires continued wealth fee growth, realization of some banking benefits, and a normalized but still strong equities franchise. It does not require Q2’s earnings intensity to persist.
The bull case, assigned a 25% probability, assumes $94 billion of revenue, a 64.5% efficiency ratio, $500 million of provisions, and 1.52 billion diluted shares. EPS would be approximately $16.06. An 18 times multiple implies approximately $289 per share and a 64% total return including dividends. This requires strong capital markets, sustained financing balances, successful conversion of wealth assets, and operating leverage that is not yet evident in Q3’s margins.
The bear case, assigned a 25% probability, assumes $74 billion of revenue, a 70% efficiency ratio, $1.5 billion of provisions, and 1.56 billion diluted shares. EPS would fall to approximately $9.64. A 13 times multiple implies approximately $125 per share and a negative 28% total return including an unchanged dividend. The operating conditions would include weaker equity markets, reduced leverage and issuance, slower wealth monetization, funding pressure, and higher credit losses.
The probability-weighted value is approximately $212 per share, implying approximately 21% total return including dividends. The expected return is sensitive to the bull case and to the assigned multiples. Maintaining the present approximately 13.3 times base-case earnings multiple would produce far less upside than the base valuation assumes. The investment case therefore depends partly on confidence that the market will recognize durable earnings quality, not solely on EPS growth.
KEY SENSITIVITIES, CATALYSTS, AND POSITION DISCIPLINE
The earnings sensitivities illustrate why a strong asset-gathering quarter does not eliminate cyclical risk. At the current Wealth Management revenue run rate, a 100-basis-point margin improvement would add approximately $0.18 to annual EPS using Q3’s tax rate and diluted share count. Margin expansion is valuable, but incremental improvements are not sufficient by themselves to offset a major trading downturn.
A 20% reduction in annualized equities revenue, assuming a 50% incremental pre-tax margin, would reduce annual EPS by approximately $1.14. A 10% reduction in Wealth Management asset-management revenue, assuming a 40% incremental margin, would reduce annual EPS by approximately $0.43. These are illustrative sensitivities rather than forecasts, and the exposures can occur together.
Funding costs also matter. An uncompensated 10-basis-point increase in the cost of the $465 billion Wealth Management deposit base would reduce annual EPS by approximately $0.23 before asset repricing, hedging, or balance changes. Actual sensitivity is more complex, but the calculation shows why deposit growth is not inherently accretive.
The earliest operating catalyst is Q4 evidence that NII resumes growth despite the higher-cost deposit mix. The next is continued fee-based inflows after excluding large retirement mandates and IPO-related concentration. Stronger retention and monetization disclosure would improve confidence more than another large unqualified net new asset number.
During 2027, the key catalysts are bank funding benefits, sustained lending growth, advisory backlog conversion, and tangible expense leverage from technology investment. A sponsor exit recovery would be additive but should not be required for the base case. Regulatory clarity could increase capital flexibility, although no specific release of capital or timing should be assumed.
The thesis would weaken if normalized fee-based flows deteriorate materially, NII declines again despite loan growth, Wealth Management margins fall persistently below 30% without a credible investment explanation, or rising credit costs accompany weaker capital markets revenue. A combination of lower equities financing balances, continued deposit repricing, and slower advisory completions would be more concerning than weakness in any isolated metric.
At the cited price, an initial position of approximately 1% of portfolio NAV is consistent with the opportunity and uncertainty. Expansion toward a 2% cap would require confirmation of NII recovery, recurring fee-flow strength, and improved expense absorption. A 12% price stop, approximately $158 from the reference entry, represents a planned loss budget of approximately 12 basis points of NAV at a 1% position or 24 basis points at a 2% position. Gap risk can exceed those planned losses. The bear-case price decline would imply approximately 30 basis points of NAV loss at a 1% position before dividends.
Portfolio treatment should recognize the underlying factors. In a technology-heavy portfolio, Morgan Stanley can add AI investment-cycle, equity-market, financing, and liquidity exposure rather than provide independent diversification simply because it is classified as a financial company. Actual sizing must therefore remain conditional on aggregate exposures and existing holdings.
The overall conclusion is that Q3 strengthened confidence in Morgan Stanley’s ability to acquire and retain valuable client relationships, while weakening the argument for extrapolating first-half earnings momentum without adjustment. The investment opportunity lies in buying a stronger recurring-revenue platform at a reasonable earnings valuation, with explicit protection against the possibility that record asset inflows arrive near a cyclical peak in capital markets activity.
SOURCE BASIS AND COMPARABILITY
The principal sources are Morgan Stanley’s 10/14/26 earnings call, Q3 2026 earnings release and financial supplement, Q2 and Q1 2026 earnings releases, Q3 2025 earnings release, January 2026 strategic update, and the 07/15/26 earnings call transcript. Consensus comparisons are attributed to CNBC’s 10/14/26 reporting. The valuation reference is a Bloomberg intraday price dated 10/14/26, not a closing price. Historical comparisons primarily use the latest Q3 supplement, including recast Investment Management flows and updated capital comparatives. DCP adjustments and all valuation scenarios are explicitly distinguished from reported results.
COMPANY EMPLOYEES ON THE CALL
• Ted Pick, Chairman and Chief Executive Officer. • Sharon Yeshaya, Chief Financial Officer.
RESEARCH ANALYSTS ON THE CALL
• Steven Chubak, Wolfe Research. • Brennan Hawken, BMO Capital Markets. • Glenn Schorr, Evercore ISI. • Christian Bolu, Autonomous Research. • Mike Mayo, Wells Fargo. • Dan Fannon, Jefferies. • Ebrahim Poonawala, Bank of America. • Devin Ryan, Citizens Bank. • Chris McGratty, KBW. • Erika Najarian, UBS. • Scott Siefers, TD Cowen. • Ben Gerlinger, Citi.
Key Read-Throughs
KEY READ-THROUGHS FROM MORGAN STANLEY’S Q3 2026 EARNINGS CALL
Morgan Stanley’s results favor a more selective interpretation of the AI investment and capital markets cycles. The strongest positive implications accrue to firms that arrange complex financing, control client distribution, advise strategic acquirers, or supply constrained power infrastructure. The strongest negative implications concern financing-dependent AI operators, private equity businesses awaiting exits at outdated valuations, and financial companies whose earnings assumptions depend on inexpensive deposits or uninterrupted trading activity. Record wealth inflows and exceptional equities revenue should not be mistaken for uniformly accelerating financial conditions: September activity weakened, wealth funding costs increased, and management acknowledged that AI capital spending may remain enormous without continuing to accelerate. The assessments below concern the direction and materiality of identifiable earnings mechanisms, not guaranteed share-price reactions. Country labels denote corporate domicile.
CAPITAL MARKETS AND ALTERNATIVE ASSET MANAGEMENT
PRIVATE AI FINANCING EXPANDS THE OPPORTUNITY FOR STRUCTURERS AND ORIGINATORS (READ-THROUGH 1)
Affected companies: Apollo Global Management (APO: US); The Goldman Sachs Group (GS: US).
Direction and magnitude: Positive. Potentially substantial for Apollo’s origination and capital-solutions activities; moderate at the consolidated company level. Positive but more diluted across Goldman Sachs’s broader earnings base.
Supporting evidence: Pick described Morgan Stanley’s role across “public solutions or private solutions” and emphasized advising companies throughout the financing lifecycle. When public markets cannot accommodate a transaction, the financing requirement does not necessarily disappear: “Do they raise private capital? How do they do that?” Management also identified secured and securitized lending as additional channels through which AI investment generates business.
Transmission mechanism: A shift toward private financing changes the product mix rather than automatically eliminating intermediation revenue. Larger, more customized transactions require structuring, investor placement, collateral analysis, syndication, and ongoing asset management. Apollo can earn origination and management economics while deploying capital from managed vehicles and affiliates. Goldman can earn advisory, placement, and financing revenue without necessarily retaining the entire exposure.
This relationship is directly observable rather than hypothetical. Apollo’s June 2026 announcement of an initial $35 billion financing solution for Broadcom’s AI infrastructure platform identified Blackstone as a capital partner, Goldman as an advisor and placement agent, and Morgan Stanley as lead advisor to Broadcom. The arrangement demonstrates that banks and private capital firms can participate in the same transaction rather than simply displace each other.
Timing: Transaction completions can affect Q4 2026 and 2027 earnings. The longer-duration opportunity is the development of repeat financing platforms supporting multiple deployments.
Critical qualification: Committed financing is not equivalent to immediately funded, fee-paying assets, and transaction value cannot be multiplied by a standard underwriting fee. The positive read-through is strongest for origination capacity and structuring relevance, not indiscriminate credit expansion. Hardware obsolescence, customer concentration, and residual-value risk remain with whichever entities ultimately retain those exposures.
SPONSOR EXIT RECOVERY REMAINS LESS RELIABLE THAN PRIVATE CAPITAL DEPLOYMENT (READ-THROUGH 2)
Affected companies: The Carlyle Group (CG: US); Blackstone (BX: US).
Direction and magnitude: Negative for the timing of realizations, performance fees, and fundraising supported by distributions. Potentially substantial for affected private equity funds; moderate and uneven at the diversified manager level.
Supporting evidence: Pick described sponsors holding assets at valuations that may not clear under the current cost of capital. He acknowledged that the anticipated sponsor-led recovery had not materialized as expected: “It’s very clear to all of us that it’s the strategic real corporate universe that’s leading the life cycle.” He also cautioned against assuming a return to a low-rate, low-inflation, non-recessionary environment.
Transmission mechanism: Higher financing costs reduce the leverage a buyer can support and increase the operating improvement required to justify a purchase price. Where sellers retain old valuation expectations, transactions are delayed. Delayed exits postpone carried-interest realization and cash distributions to limited partners. Weaker distributions can constrain investors’ capacity or willingness to commit to successor funds, extending the effect beyond the original portfolio.
Carlyle’s private equity activities are directly exposed to this realization cycle. Blackstone faces the same mechanism in private equity and parts of real estate, although its credit, infrastructure, and other activities can benefit from the financing opportunities discussed separately. The implication is therefore negative for realization-sensitive earnings, not uniformly negative for every business within either manager.
Timing: The most immediate risk concerns Q4 realization assumptions and 2027 distributable earnings forecasts. Longer-duration effects arise if weak distributions delay fundraising or require continuation transactions on less attractive terms.
Critical qualification: Longer holding periods can preserve management fees, and continuation funds can provide liquidity. Those offsets do not make unrealized appreciation equivalent to cash earnings. The actionable distinction is between managers benefiting from new deployment and managers whose earnings recovery requires a broad reopening of exits.
STRATEGIC ADVISORY IS BETTER SUPPORTED THAN A GENERALIZED IPO BOOM (READ-THROUGH 3)
Affected companies: Evercore (EVR: US); Lazard (LAZ: US).
Direction and magnitude: Positive. Potentially substantial for advisory revenue and operating leverage, subject to firm-specific mandates and completion timing.
Supporting evidence: Morgan Stanley’s advisory revenue increased approximately 30% year over year to $887 million, while equity underwriting declined approximately 19% to $525 million. Management described active corporate boardroom discussions, portfolio repositioning, and capital allocation priorities. Pick explicitly identified strategic corporates as the leaders of the current transaction cycle.
Transmission mechanism: Strategic buyers can justify transactions through operating synergies, technology access, scale, or portfolio simplification rather than relying predominantly on cheap acquisition financing and multiple expansion. Those objectives generate advisory mandates even when IPO windows are inconsistent. Evercore and Lazard can participate without committing the same amount of underwriting or bridge-loan capital required of a balance-sheet lender.
This distinction is particularly relevant to AI-driven corporate repositioning. Companies deciding whether to acquire capabilities, divest non-core assets, form partnerships, or restructure capital requirements create advisory work even if aggregate AI spending stops accelerating. Complexity can sustain the fee opportunity independently of the number of public offerings.
Timing: Near-term catalysts are announced transactions progressing toward completion and advisory backlog conversion through Q4 2026 and 2027. Longer-duration upside depends on sustained strategic repositioning across sectors.
Critical qualification: Morgan Stanley’s results do not establish that either firm owns the same mandates or will deliver comparable growth. Advisory revenue remains lumpy, and higher rates can still undermine transactions. The high-conviction conclusion is that the composition of activity favors strategic advisory more clearly than it supports a broad-based underwriting acceleration.
STRONG QUARTERLY TRADING REVENUE OVERSTATES THE EVIDENCE FOR THE Q4 STARTING POINT (READ-THROUGH 4)
Affected company: The Goldman Sachs Group (GS: US).
Direction and magnitude: Negative for aggressive near-term trading extrapolation. Moderate potential earnings sensitivity, but insufficient evidence for a firmwide bearish conclusion.
Supporting evidence: Morgan Stanley described unusually brisk July and August activity followed by slower volumes around and after Labor Day. Pick stated that Asian volumes were “drying up” during September and warned that lower volumes mean lower output across the trading ecosystem. Equities revenue declined approximately 8% sequentially despite increasing 41% year over year; fixed income trading declined approximately 18% sequentially.
Transmission mechanism: Quarterly averages can conceal a weaker exit rate. Reduced client turnover lowers execution revenue, while lower risk appetite can constrain derivatives activity and financing balances. Higher geopolitical volatility is not automatically beneficial if clients respond by reducing exposure rather than trading actively through the uncertainty.
Goldman’s global equities, derivatives, and financing franchises make it exposed to these same market-activity channels. However, Morgan Stanley’s experience does not establish Goldman’s exact September performance, and client mix or market-share changes can offset broader conditions.
Timing: The implication concerns Q4 2026 estimates and subsequent management commentary, not an anticipated Q3 surprise. Goldman had already reported Q3 results on 10/13/26.
Critical qualification: Structural financing growth and stronger competitive positioning can coexist with weaker quarterly activity. The negative read-through is to annualizing exceptional trading quarters or treating every increase in volatility as an earnings windfall. It is not evidence that the global equities franchise has structurally deteriorated.
WEALTH MANAGEMENT, BROKERAGE, AND ASSET MANAGEMENT
WORKPLACE DISTRIBUTION CAPTURES VALUE WELL AFTER THE IPO ITSELF (READ-THROUGH 5)
Affected company: The Charles Schwab Corporation (SCHW: US).
Direction and magnitude: Positive. Moderate longer-duration revenue opportunity; limited immediate earnings visibility.
Supporting evidence: Morgan Stanley reported $232.4 billion of net new assets, with slightly more than 50% associated with IPO-related flows. Management explained that Q3 inflows extended beyond employees to early investors, endowments, fund distributions, and other recipients of shares. Yeshaya emphasized that an IPO is “not necessarily just a one-quarter event.”
Transmission mechanism: A workplace relationship can precede a liquidity event and subsequently generate brokerage assets, advisory conversions, lending, retirement consolidation, and assets transferred from other institutions. The economic opportunity persists after the underwriting fee has been recognized and can continue even when the current-quarter IPO calendar slows.
Schwab has directly relevant stock-plan, retirement, brokerage, and advisory capabilities. Its announced private-issuer equity offering extends its involvement into the period before companies go public. Morgan Stanley’s results validate the customer-acquisition model behind those capabilities, although Schwab does not possess Morgan Stanley’s investment banking franchise or identical access to transaction-related relationships.
Timing: The nearest observable catalysts are workplace-related asset inflows and advisory conversions over subsequent quarters. The larger earnings contribution develops over several years as relationships broaden.
Critical qualification: Morgan Stanley’s $232.4 billion of inflows cannot be applied proportionately to Schwab. Assets can remain in low-fee custody, leave after lockups expire, or be consumed. The positive implication is that workplace distribution creates a differentiated acquisition channel, not that every incoming dollar immediately earns a full advisory fee.
DEPOSIT GROWTH IS NOT A RELIABLE PROXY FOR BROKERAGE NII GROWTH (READ-THROUGH 6)
Affected companies: The Charles Schwab Corporation (SCHW: US); Raymond James Financial (RJF: US).
Direction and magnitude: Negative for volume-driven NII upside assumptions. Moderate potential earnings sensitivity; not evidence of an immediate liquidity problem.
Supporting evidence: Morgan Stanley’s Wealth Management deposits increased approximately $29 billion, while NII declined approximately 1% sequentially despite prior guidance for an increase. The accompanying supplement showed brokerage sweep deposits increasing only $1 billion, with other deposits increasing $28 billion. Period-end deposit cost rose from 2.60% to 2.85%.
Transmission mechanism: Deposits acquired through higher-paying products can increase balance-sheet size without improving net interest income. Profitability depends on the spread between marginal funding cost and the return on deployed assets, not simply on deposit growth. Competition for client cash can also reduce the economics of existing deposits or increase the expense of retaining balances.
Schwab and Raymond James both monetize client cash through banking and deposit arrangements. Morgan Stanley’s experience is therefore a warning against applying historical sweep economics to all new funding. As an illustrative sensitivity, a 25-basis-point increase in funding cost on $100 billion of balances reduces annual pre-tax income by $250 million before asset repricing, hedges, or balance changes.
Timing: The immediate relevance is to upcoming earnings disclosures on deposit mix, marginal funding costs, and net interest margins. Longer-duration implications concern the competitive value of client cash as automated cash movement and rate transparency improve.
Critical qualification: Morgan Stanley deliberately chose this funding expansion, and peer asset structures differ. Neither Schwab nor Raymond James must experience the same outcome. The high-conviction negative implication is to simplistic NII forecasts, particularly where rising deposit balances are assumed to be automatically accretive.
ASSET GROWTH CAN CONCEAL DETERIORATING ORGANIC FLOWS AND FEE MIX (READ-THROUGH 7)
Affected company: T. Rowe Price Group (TROW: US).
Direction and magnitude: Negative. Potentially substantial for organic revenue growth and operating leverage.
Supporting evidence: Morgan Stanley highlighted strong Parametric and fixed income flows, but its accompanying supplement showed $9.4 billion of equity outflows in Q3 and $33.5 billion year to date. Investment Management AUM increased approximately 13% year over year, while asset management and related fees increased only approximately 2%. Management also emphasized the distribution advantage created by its wealth platform.
Transmission mechanism: Outflows from higher-fee active equity products can offset substantial asset growth in lower-fee categories. Market appreciation can keep headline AUM elevated while the recurring revenue base weakens. At the same time, scaled distributors can influence product selection, negotiate pricing, and direct flows toward customized solutions or preferred partners.
T. Rowe Price provides independent corroboration rather than merely a hypothetical peer exposure. Its September 2026 disclosure reported $12.2 billion of monthly net outflows and $28.3 billion of quarterly net outflows, including a large defined-contribution target-date withdrawal during September. This reinforces the distinction between strong financial markets and strong organic demand for a particular manager’s products.
Timing: The immediate catalyst is T. Rowe Price’s 10/29/26 earnings release, particularly fee realization, expense flexibility, and the explanation of retirement outflows. The longer-duration issue is whether distribution access and product adaptation can stabilize net flows.
Critical qualification: There is no evidence that T. Rowe Price’s withdrawal and Morgan Stanley’s retirement mandate involved the same client. No direct transfer should be inferred. The negative conclusion rests on independently disclosed outflows and the economics of fee mix, not an assumed competitive win between the firms.
AI SEMICONDUCTORS AND DIGITAL INFRASTRUCTURE
SUSTAINED AI INVESTMENT SUPPORTS SILICON DEMAND WITHOUT VALIDATING ACCELERATING GROWTH (READ-THROUGH 8)
Affected companies: NVIDIA (NVDA: US); Broadcom (AVGO: US).
Direction and magnitude: Positive for multiyear demand durability. High fundamental relevance, but limited incremental near-term estimate support.
Supporting evidence: Pick described hyperscaler investment as running around $1 trillion annually and discussed the possibility of that scale persisting over 5 to 10 years. He identified work with “the chips folks, the data centers or the power providers.” However, he also stated that “the activity from here may not accelerate.”
Transmission mechanism: A sustained, very large deployment requirement supports demand for accelerators, custom compute, networking, and associated infrastructure. Financing innovation can allow customers to undertake deployments that would otherwise exceed their immediate balance-sheet capacity, supporting supplier demand through additional capital channels.
Broadcom’s disclosed AI infrastructure platform provides a direct example: private capital is being organized around compute deployment for Anthropic, with Morgan Stanley acting as lead advisor to Broadcom. NVIDIA benefits from the broader requirement for accelerated computing and networking, but the call does not identify NVIDIA-specific orders or establish its share of the discussed spending.
Timing: The nearer-term catalysts remain supplier order disclosures, delivery schedules, and customer financing commitments. The stronger read-through is multiyear demand duration rather than a call-driven quarterly revenue upgrade.
Critical qualification: Total infrastructure spending includes buildings, power, cooling, and other categories that do not become semiconductor revenue. A stable spending level can also coexist with slower semiconductor growth, changing architecture mix, or lower pricing. The supported conclusion is that financing activity remains consistent with a durable deployment cycle, not that every AI supplier should receive higher growth assumptions.
POWER AND COOLING BOTTLENECKS HAVE A MORE DIRECT CLAIM ON INCREMENTAL INFRASTRUCTURE SPENDING (READ-THROUGH 9)
Affected companies: GE Vernova (GEV: US); Vertiv Holdings (VRT: US); Eaton (ETN: Ireland).
Direction and magnitude: Positive. Potentially substantial for exposed product lines and backlog durability; consolidated magnitude varies by company.
Supporting evidence: Pick described periods when AI deployment may not move quickly enough because of a different bottleneck: “Perhaps it’s power.” He also identified power providers as part of the financing ecosystem and emphasized that investment requirements could remain large even without accelerating annually.
Transmission mechanism: Compute capacity cannot generate revenue without electricity delivery, power conditioning, and thermal management. Spending on those constraints can remain necessary even when customers moderate the growth rate of accelerator purchases. GE Vernova is exposed through generation and grid equipment, Eaton through electrical distribution and power-management products, and Vertiv through critical power and cooling systems.
The distinction between aggregate spending and bottleneck spending is important. These suppliers can benefit from a changing allocation within AI infrastructure budgets, rather than requiring every category to grow at the same rate. GE Vernova’s Q2 disclosure provides independent support: data-center-related Electrification orders exceeded $5 billion in the first half of 2026, more than double its full-year 2025 total.
Timing: Order intake, capacity reservations, and pricing are the near-term indicators. Revenue, service income, and manufacturing productivity benefits are longer-duration, extending into 2027 and beyond.
Critical qualification: A bottleneck can delay customer commissioning and supplier revenue recognition even while strengthening strategic demand. Backlog is not immediately equivalent to cash earnings, and project cancellations remain possible. The positive read-through is strongest for required enabling equipment, not a blanket endorsement of every utility, power developer, or data-center real estate company.
HIGHER REAL RATES DIFFERENTIATE AI DEMAND FROM AI EQUITY RETURNS (READ-THROUGH 10)
Affected companies: CoreWeave (CRWV: US); Microsoft (MSFT: US); Alphabet (GOOGL: US).
Direction and magnitude: Negative and potentially substantial for CoreWeave’s financing-sensitive equity economics. Positive relative competitive implication for Microsoft and Alphabet, but not a standalone consolidated earnings upgrade.
Supporting evidence: Pick emphasized that the relevant challenge is higher real as well as nominal rates. He warned that an underwritten bridge or relationship loan can become an equity-like exposure that ultimately requires provisioning. Management’s willingness to remain active in AI was paired with greater scrutiny of where risk capital is allocated.
Transmission mechanism: A compute operator can have strong contracted demand while still generating weak equity returns if financing costs, depreciation, power costs, and deployment delays consume the economic surplus. Higher rates affect new financing and refinancing, while delayed commissioning postpones revenue against continuing capital costs. The consequence can be slower expansion, lower returns, or greater dilution even without a deterioration in customer demand.
CoreWeave’s own Q2 release illustrates this sensitivity. Net interest expense was $640 million against $2.575 billion of revenue, approximately 25% of revenue, while the company reported a GAAP operating loss. Its approximately $104 billion revenue backlog was expressly subject to delivery and service-availability requirements. Those figures do not establish financial distress, but they demonstrate why backlog cannot be treated as equivalent to distributable equity value.
Microsoft and Alphabet have broader internally generated cash flows and more financing flexibility. That creates a relative advantage when external capital becomes more expensive or selective. It does not mean their AI investments automatically earn attractive returns.
Timing: Financing announcements, funding spreads, commissioning schedules, and capital expenditure guidance are near-term catalysts. The longer-duration issue is the return earned over the useful life of the infrastructure.
Critical qualification: Existing fixed-rate debt does not all reprice immediately, and committed financing or customer prepayments can mitigate risk. This is a negative read-through for financing-dependent equity economics, not a prediction of default or an assertion that Morgan Stanley holds a problematic CoreWeave exposure.
JAPANESE BANKING AND CROSS-BORDER FINANCIAL SERVICES
MUFG HAS A DIRECT PARTICIPATION CHANNEL IN THE GLOBAL CAPITAL MARKETS UPSWING (READ-THROUGH 11)
Affected company: Mitsubishi UFJ Financial Group (8306: Japan).
Direction and magnitude: Positive for earnings diversification and capital markets participation. Moderate consolidated relevance, with substantial relevance to the securities alliance.
Supporting evidence: Pick described Tokyo as “super hot” and explicitly highlighted Morgan Stanley’s partnership with MUFG. He cited the combined franchise’s position in Japanese capital markets, including foreign exchange and equities. Morgan Stanley also reported a 22.6% ROTCE and its 5th consecutive quarter above 20%.
Transmission mechanism: MUFG benefits through its ownership interest in Morgan Stanley and through the operating alliance’s Japanese securities and foreign exchange activities. The partnership combines MUFG’s corporate relationships with Morgan Stanley’s institutional distribution, research, execution, and structuring capabilities. That provides a direct participation channel rather than a generic inference that stronger Asian trading benefits every Japanese bank equally.
The documented Alliance 2.0 framework reinforces the mechanism. Its operating design links MUFG’s foreign exchange activity with Morgan Stanley’s platform and integrates elements of Japanese institutional equities research, sales, corporate access, and execution. Greater activity can therefore improve utilization of shared capabilities while broadening the services offered to existing clients.
Timing: Morgan Stanley’s earnings contribution is relevant to MUFG’s financial reporting, subject to the applicable accounting period, ownership economics, and currency translation. Cross-selling and platform integration are longer-duration drivers.
Critical qualification: Morgan Stanley’s Q3 earnings were lower sequentially despite remaining strong year over year. The implication is support for the durability and breadth of MUFG’s earnings, not an unqualified sequential upgrade. The same relationship also increases MUFG’s exposure to global equity activity and AI-related financing conditions, making it more than a pure Japanese interest-rate investment.
Report record
- Sector
- Financials
- Industry
- Capital Markets
- Fiscal period end
- September 30, 2026
- Report date
- October 14, 2026
- Analysis
- 6427 words
- Read-throughs
- 3315 words
- Content fingerprint (PDF)
2cf95db2addc- Content fingerprint (analysis)
3b651ae6a50f- Content fingerprint (read-throughs)
6fff5c895c62
Prepared from the company's earnings release and earnings call transcript. Figures as reported by the company. For information only. Not investment advice.
More from Morgan Stanley
No other reports yet.
More in Financials
A stronger revenue floor, but reported returns remain cyclically elevated
Franchise strength, with a more qualified earnings and capital-return outlook
Follow @AtlasPeakRes on X for new earnings reports as they publish.