Strong Franchise, but the Earnings Acceleration Has Not Arrived
Earnings Reports
JPMorgan Chase & Co FQ3 2026 Earnings Report
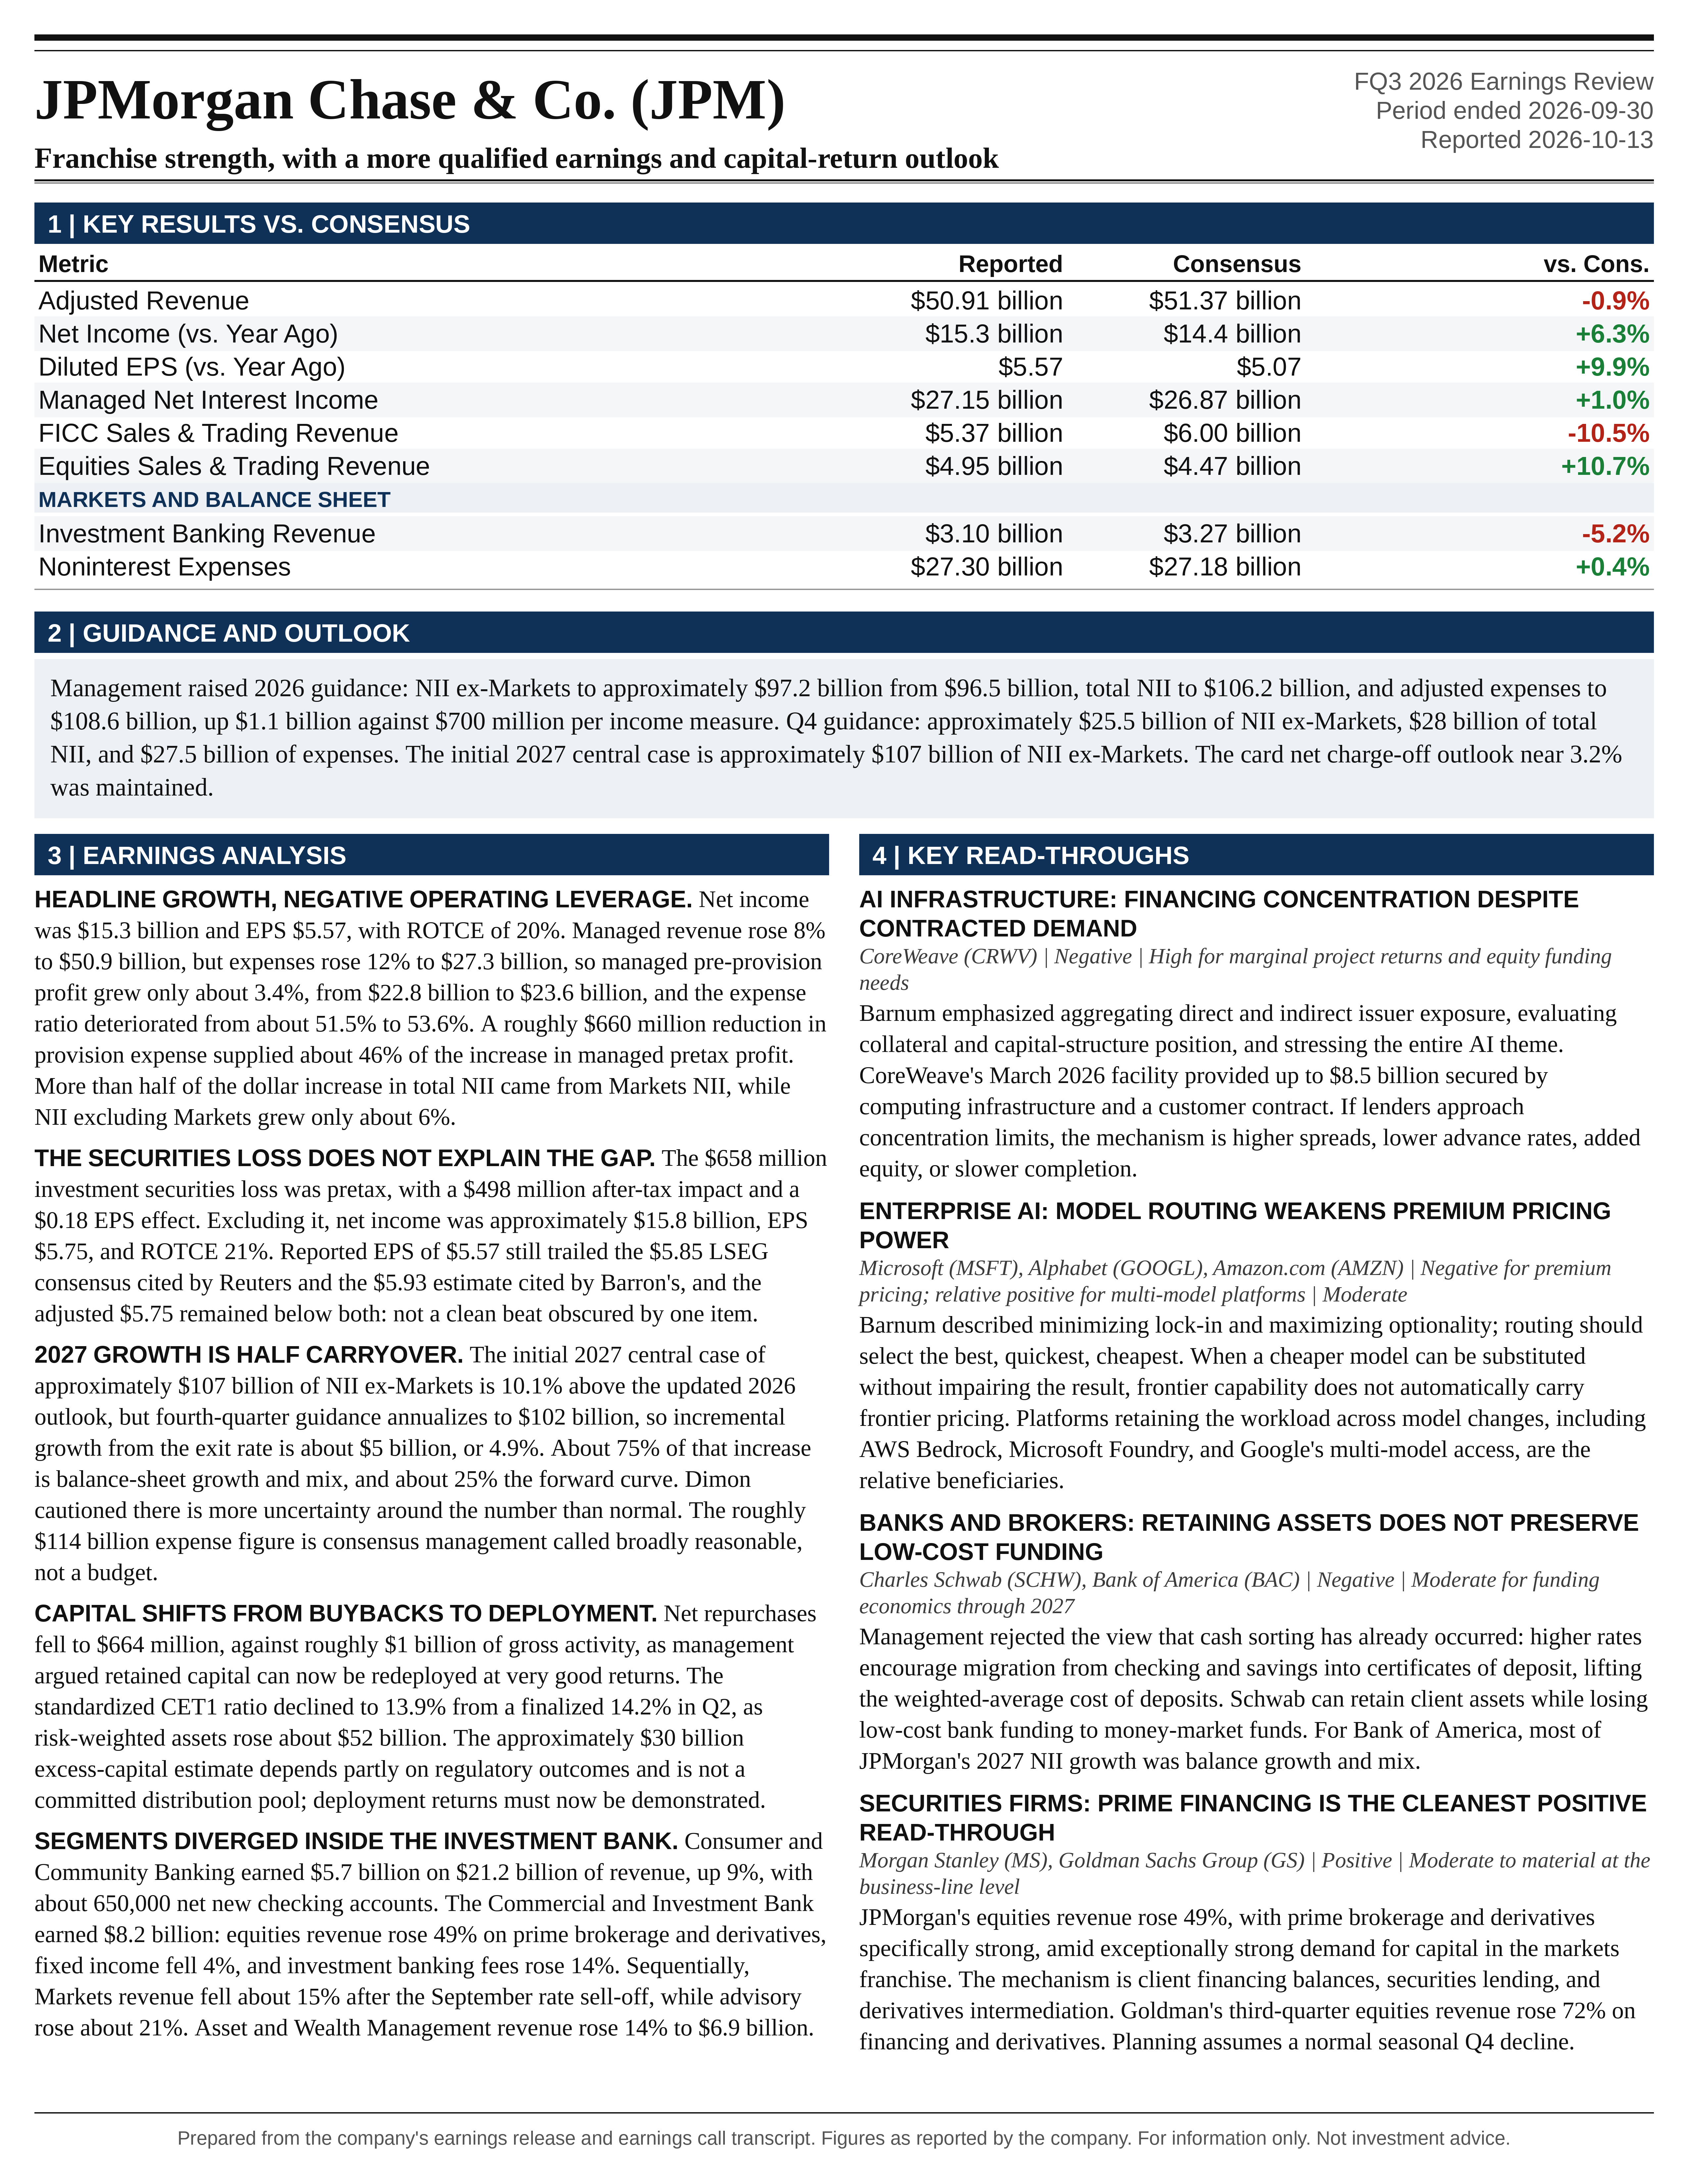
JPMorgan Chase & Co (JPM) FQ3 2026 earnings: Franchise strength, with a more qualified earnings and capital-return outlook. Full earnings analysis, key read-throughs, and the one-page exhibit from Atlas Peak Research.
JPMorgan Chase & Co (JPM)
Sector: Financials · FQ3 2026 · Period end September 30, 2026 · Reported October 13, 2026
JPMorgan’s Q3 2026 call reinforced the strength of the franchise but presented a more qualified earnings and capital-return outlook than the headline growth rates suggested. Net income was $15.3 billion, EPS was $5.57, and return on tangible common equity, or ROTCE, was 20%.
Download the one-page report (PDF)
View one-page exhibit
Download analysis (.md)
Download read-throughs (.md)
Post to X
One-Page Exhibit
Earnings Analysis
EXECUTIVE CALL SUMMARY: JPMorgan Chase & Co. (10/13/26)
JPMorgan’s Q3 2026 call reinforced the strength of the franchise but presented a more qualified earnings and capital-return outlook than the headline growth rates suggested. Net income was $15.3 billion, EPS was $5.57, and return on tangible common equity, or ROTCE, was 20%. Managed revenue increased 8% to $50.9 billion, while expenses increased 12% to $27.3 billion. Customer acquisition, deposit growth, equities trading, investment banking, and wealth management remained strong. However, expense growth exceeded revenue growth, capital-markets activity moderated during the quarter, and management substantially reduced repurchases in favor of retaining capital for organic deployment. The investment conclusion is constructive for medium-term franchise earnings capacity, but mixed for near-term earnings quality, operating leverage, and capital distributions.
The most important forward-looking disclosure was the initial 2027 central case of approximately $107 billion in net interest income excluding Markets, or NII ex-Markets. The composition matters more than the headline: management attributed approximately 75% of growth from the anticipated Q4 annualized run rate to balance-sheet growth and mix, and approximately 25% to the forward interest-rate curve. This supports a franchise-growth thesis rather than a purely rate-driven earnings thesis. Nevertheless, the forecast assumes continued favorable deposit behavior, sustained lending growth, and additional rate increases. Dimon explicitly cautioned, “I mean, I think there’s more uncertainty around that number than normal.” The approximately $114 billion expense figure discussed on the call was prevailing consensus that management considered broadly reasonable, not a completed 2027 budget or formal expense commitment. Pasted text.txt
The principal strategic change was management’s greater confidence that retained capital can be deployed at attractive returns. Dimon stated, “We believe now, which is different than we told you in the past that we can redeploy that capital at very good returns over-time.” That statement changes the interpretation of excess capital: it is increasingly a resource for future business growth rather than an immediately distributable buyback pool. The potential benefit is a larger earnings base; the offset is reduced near-term EPS support and greater exposure to execution, underwriting, and the economic cycle. The call also rejected an immediately visible AI productivity windfall. Barnum stated that “the benefits aren’t observable in our current quarterly earnings,” while separately emphasizing that JPMorgan would not be immune to a major deterioration in AI-related sentiment.
EARNINGS QUALITY AND HISTORICAL COMPARABILITY
The reported results require several accounting distinctions. The $50.9 billion revenue figure cited on the call is managed revenue; GAAP revenue was approximately $50.2 billion. The $658 million investment securities loss was a pretax amount, with a $498 million after-tax impact and a $0.18 EPS effect. Excluding that item, net income was approximately $15.8 billion, EPS was $5.75, and ROTCE was 21%. Consequently, the prepared remarks’ 20% ROTCE and the subsequent discussion of 21% returns are reconcilable as reported and adjusted measures, rather than conflicting descriptions of the same metric. Excluding the securities loss improves operating comparability but does not eliminate its economic significance. No quantified reinvestment payback was provided on the call.
Reported EPS was below the $5.85 LSEG consensus cited by Reuters and the $5.93 estimate cited by Barron’s. The adjusted $5.75 result also remained below both published benchmarks, by approximately 1.7%–3.0%. Differences in consensus definitions prevent treating those percentages as a perfectly standardized adjusted earnings surprise, but the arithmetic establishes that the securities loss alone does not explain the entire gap against published expectations. The quarter therefore should not be characterized as an otherwise clean earnings beat obscured by a discretionary accounting item.
Historical comparisons indicate that EPS growth was stronger than underlying operating-profit growth. Q3 2025 net income was approximately $14.4 billion and EPS was $5.07, making current growth approximately 6% and 10%, respectively. Managed pre-provision profit increased only approximately 3.4%, from $22.8 billion to $23.6 billion. The expense-to-managed-revenue ratio deteriorated from approximately 51.5% to 53.6%; excluding the current securities loss still leaves a ratio of approximately 52.9%. Lower credit costs provided a substantial offset: the approximately $660 million reduction in provision expense accounted for roughly 46% of the increase in managed pretax profit. The quarter thus combined genuine revenue growth with negative operating leverage and a favorable credit-cost comparison. Pasted text.txt
The sequential comparison is also less severe than the reported EPS decline suggests, but it still shows moderation. Q2 reported EPS of $7.70 benefited from substantial Visa-related and other equity-investment gains. Excluding those significant items, Q2 EPS was $6.14 and ROTCE was 23%. Against that more comparable baseline, Q3 adjusted EPS declined approximately 6.4%, and adjusted ROTCE declined to 21%. These adjustments are not a comprehensive recurring-earnings model, but they establish a meaningful distinction: the reported sequential decline overstates the deterioration, while the adjusted comparison still indicates lower earnings momentum.
The NII composition also warrants scrutiny. The financial supplement shows managed NII growth of approximately 13%, versus approximately 6% for NII ex-Markets. More than half of the dollar increase in total NII came from Markets NII. Meanwhile, the net yield excluding Markets was 3.70%, compared with 3.73% a year earlier. The implication is that balance growth, business mix, and Markets-related accounting contributed more to headline NII growth than a broad expansion in core lending and deposit spreads. Markets NII should be assessed together with associated noninterest revenue rather than automatically assigned the same earnings quality as primary-deposit-funded lending income.
2026 GUIDANCE: HIGHER NII, BUT AN EVEN LARGER EXPENSE INCREASE
The updated presentation implies full-year 2026 NII ex-Markets of approximately $97.2 billion, total NII of $106.2 billion, and adjusted expenses of $108.6 billion. The corresponding Q2 guidance was $96.5 billion, $105.5 billion, and $107.5 billion. The latest revisions therefore add $700 million to each NII measure and $1.1 billion to adjusted expenses. On those disclosed lines alone, the expense increase exceeds the NII increase by $400 million. That is not equivalent to an earnings downgrade because management linked higher expenses to elevated activity and related fee revenue, but it prevents interpreting the NII increase as an unqualified improvement in earnings expectations.
The broader guidance progression shows how materially the operating environment has changed. January guidance, reaffirmed with Q1 results, contemplated approximately $95 billion of NII ex-Markets, $103 billion of total NII, and $105 billion of adjusted expenses. Relative to those initial expectations, the latest outlook is higher by approximately $2.2 billion, $3.2 billion, and $3.6 billion, respectively. The January framework also assumed rate cuts, illustrating the sensitivity of annual forecasts to changing interest-rate paths. The card net charge-off forecast improved from approximately 3.4% earlier in the year to 3.2% in Q2 and was maintained on this call. Credit guidance was therefore stable this quarter, not newly improved.
The Q4 guidance itself is supportive: approximately $25.5 billion of NII ex-Markets, $28 billion of total NII, and $27.5 billion of expenses. However, management did not provide a corresponding numerical forecast for trading revenue or investment banking fees. Q4 therefore combines relatively explicit balance-sheet revenue expectations with less certain capital-markets revenue. Moreover, the expense guidance is on an adjusted basis excluding firmwide legal expense, whereas the reported quarterly expense number includes such costs. Expense comparisons should preserve that distinction rather than treating all disclosed figures as identical accounting measures. Pasted text.txt
The central operating question is whether higher spending remains sufficiently variable and productive as activity moderates. Revenue-related compensation and transaction expenses can decline with revenue, limiting downside. Front-office hiring, wage inflation, and broader investment spending can be less immediately flexible. The call attributed expense growth to both categories but did not provide a complete fixed-versus-variable reconciliation. Consequently, strong activity justifies some expenditure growth without establishing that the entire higher cost base will automatically adjust if capital markets weaken.
2027 NII: STRONGER FRANCHISE CAPACITY, WITH MATERIAL CARRYOVER
The $107 billion central case represents approximately 10.1% growth over the updated 2026 NII ex-Markets outlook. However, Q4 guidance annualizes to $102 billion, making incremental growth from the anticipated exit rate approximately $5 billion, or 4.9%. Approximately $4.8 billion of the $9.8 billion calendar-year increase is therefore the mathematical effect of entering 2027 above the 2026 average. This is favorable and economically meaningful, but it is not equivalent to generating 10% additional growth after the Q4 run rate is established. The exit-rate comparison provides a more demanding test of incremental 2027 performance. Pasted text.txt
Barnum’s bridge attributes approximately $1.25 billion of the $5 billion increase from the exit rate to the yield curve and approximately $3.75 billion to balance-sheet growth and mix. The rate assumptions include an increase in December 2026 and additional increases during H1 2027. The other drivers are continued modest consumer deposit growth, wholesale deposit growth below the particularly strong pace experienced this year, and continued card lending growth. This composition is incrementally reassuring because most projected growth is not directly dependent on rate increases. It nevertheless assumes that deposit acquisition, funding mix, and loan demand remain favorable enough to support profitable expansion. Pasted text.txt
The stated asset sensitivity is not a fixed structural constant. Barnum indicated that actual sensitivity may be greater than the earnings-at-risk model suggests because consumer deposit betas have been lower than modeled. That represents a current source of upside, but it is also a behavioral assumption. A higher rate paid on deposits, increased migration into premium accounts and certificates of deposit, or weaker balances could reduce the benefit from asset repricing. Removing the approximately $1.25 billion curve contribution mechanically would produce approximately $105.75 billion of NII ex-Markets, holding everything else unchanged. That is a static sensitivity, not an alternative management forecast: a different rate path could also alter funding costs, deposit flows, lending, and credit quality.
The expense discussion offers less certainty than the NII discussion. Barnum said consensus of approximately $114 billion was not far from management’s preliminary assessment, while emphasizing that the budget remained unfinished and investment decisions were dynamic. Using $114 billion as a modeling placeholder implies approximately 5% expense growth over the updated 2026 adjusted outlook. Against $9.8 billion of projected NII ex-Markets growth, the partial incremental contribution would be approximately $4.4 billion before changes in fee revenue, Markets economics, credit costs, taxes, and other items. On matched exit-rate comparisons, however, NII increases approximately $5 billion while expenses increase approximately $4 billion from the Q4 annualized expense base of $110 billion. That leaves only approximately $1 billion of incremental contribution from those lines. Pasted text.txt
The distinction is important for earnings revisions. A favorable calendar-year NII comparison does not automatically imply substantial incremental margin expansion through 2027. Fee growth, credit performance, expense discipline, and returns on newly deployed capital remain essential. The call supplied an initial NII central case and a preliminary assessment of expense consensus; it did not supply a complete 2027 earnings forecast. It also did not provide a 2027 card-loss forecast or a numerical 2027 capital-markets revenue assumption.
CONSUMER BANKING AND DEPOSIT ECONOMICS
Consumer & Community Banking generated $5.7 billion of net income on $21.2 billion of revenue, with revenue increasing 9%. Debit and credit spending increased 10%, deposits increased 4%, and client investment assets increased 15% to more than $1.4 trillion. Approximately 650,000 net new checking accounts provide direct evidence that the primary banking franchise continues to attract customers. This is more important structurally than a favorable quarter of deposit pricing: recurring customer acquisition can support balances, payments, card usage, investment relationships, and future lending across rate environments.
The deposit result still requires perspective. Consumer deposits were approximately flat sequentially despite the 4% annual increase. The improvement therefore reflects a stronger annual comparison and sustained account acquisition, not an accelerating quarterly surge in balances. Similarly, 10% nominal spending growth does not establish comparable growth in real consumption, particularly when management identified strength in gas and travel spending. The call supports resilient customer activity, but it does not isolate inflation, spending volumes, transaction mix, and market-share effects. Pasted text.txt
Management’s discussion of deposit migration was appropriately more nuanced than a simple assertion that cash sorting has ended. Higher rates can raise the cost of existing high-beta products while encouraging movement from checking and savings into certificates of deposit or premium accounts. Some customers may also move funds outside the bank. The crucial distinction is between product-level pricing and the weighted-average cost of the entire deposit base. JPMorgan could preserve a low rate on basic checking accounts while still experiencing a meaningful increase in aggregate funding costs through changes in customer balances and product selection. Pasted text.txt
Barnum described the deposit franchise as divided between high-beta wholesale and premium products and a substantial low-beta deposit base. Historical modeling is particularly uncertain because the contemplated tightening begins from an unusual interest-rate starting point. The implication is that customer acquisition and deposit growth cannot be analyzed separately from marginal funding costs. The most useful evidence will be whether new relationships bring durable operating balances, whether existing customers retain meaningful balances in low-cost products, and whether the economics of the full product relationship remain attractive after repricing and migration. Pasted text.txt
The wholesale noninterest-bearing deposit discussion contained another important accounting qualification. Earnings-credit-rate arrangements can make deposits appear noninterest-bearing even when customers receive an economic benefit through service-fee offsets. Management emphasized overall relationship margins and product quality rather than treating reported noninterest-bearing balances as costless funding. This limits the usefulness of comparisons based solely on deposit classifications. Growth in a nominally noninterest-bearing category does not necessarily translate directly into an equivalent increase in economic spread income. Pasted text.txt
COMMERCIAL AND INVESTMENT BANK: STRONG ANNUAL RESULTS, SOFTER EXIT MOMENTUM
The Commercial & Investment Bank generated $8.2 billion of net income and $22.7 billion of revenue, with revenue increasing 14%. Equities revenue increased 49%, supported particularly by prime brokerage and derivatives, while fixed-income revenue declined 4%. Investment banking fees increased 14%, with advisory particularly strong. The business therefore remained a major earnings engine, contributing more than half of consolidated net income. However, the divergence between equities and fixed income demonstrates that volatility is not uniformly beneficial across products. Client positioning, financing demand, transaction flows, and the specific character of market moves matter more than volatility in isolation. Pasted text.txt
The sequential comparison reveals the loss of momentum more clearly than the annual growth rates. Total Markets revenue declined approximately 15% from Q2, and investment banking fees declined approximately 8%. Within investment banking, advisory increased approximately 21% sequentially, while equity underwriting declined approximately 32% and debt underwriting declined approximately 15%. This pattern is consistent with financing activity becoming less favorable while advisory completions remained productive. It also argues against describing the entire investment banking franchise as deteriorating uniformly: the weakness was concentrated more heavily in underwriting than in advisory.
The results were also at the lower end of the optimistic tone established before quarter-end. In September, Doug Petno had indicated that investment banking fees and Markets revenue were expected to increase by percentages in the middle to upper teens. Actual increases of 14% and 15%, respectively, were consistent with some moderation after that update rather than a collapse in client activity. The call located the slowdown more specifically in the latter half of September, when the rate sell-off made it harder for buyers and sellers to agree on valuations. Pasted text.txt
Management remained constructive on the pipeline, including European IPO opportunities, but did not equate pipeline strength with near-term revenue certainty. The distinction between delayed and canceled transactions is important economically, yet timing alone can materially affect quarterly results. A transaction pipeline can remain commercially attractive while its expected closing date moves beyond the period embedded in earnings estimates. The relevant Q4 issue is therefore conversion into completed transactions, not merely the continued existence of client interest. Pasted text.txt
The closing exchange on trading seasonality exposed a genuine difference in emphasis. Barnum’s planning assumption was a normal seasonal decline from Q3 to Q4, while Dimon suggested that the decline could be less pronounced because there was “Too much going on in the world.” The latter comment identifies potential upside but does not constitute a revised numerical forecast. A base case that assumes ordinary seasonality, with an upside scenario for sustained client activity, is more faithful to the call than carrying Q3 trading revenue forward without adjustment. Pasted text.txt
Capital efficiency deserves equal attention. The presentation showed CIB return on equity of 18%, unchanged from the prior year despite approximately 20% net income growth. A larger allocated capital base absorbed much of the profit expansion. This is not evidence that the growth was unattractive, but it demonstrates the difference between generating more earnings and improving returns on capital. As repurchases are displaced by organic deployment, incremental profitability should be judged against the additional capital and risk required to produce it.
ASSET MANAGEMENT AND CORPORATE RESULTS
Asset & Wealth Management produced $6.9 billion of revenue, up 14%, and $1.8 billion of net income, with a 36% pretax margin. Assets under management increased 13% to $5.2 trillion, while client assets increased 15% to $7.9 trillion. Long-term net inflows were $51 billion, predominantly reflecting fixed-income strength. These results support the durability of the distribution franchise and the benefits of a larger asset base. However, long-term inflows were below the $72 billion reported in Q3 2025, and the pretax margin was below Q2’s 38%. Revenue growth therefore should not be equated with either accelerating organic flows or expanding margins. Pasted text.txt
The earnings quality of the wealth franchise remains attractive relative to a purely lending-driven business, but its sensitivity to asset prices is material. The call explicitly attributed growth to higher market levels as well as inflows, and higher lending balances also contributed. A market decline could pressure management fees even without substantial redemptions, while loan growth consumes balance-sheet resources. The correct interpretation is a diversified and growing business with meaningful recurring revenues, not an earnings stream independent of the same market conditions supporting trading and investment banking. Pasted text.txt
Corporate reported a $455 million loss, compared with $825 million of income a year earlier. Adding back the disclosed $498 million after-tax securities loss would leave approximately $43 million of income on that narrow adjustment. The securities loss therefore explains much, but not all, of the weakness against the prior-year Corporate contribution. Treating Corporate as a temporary accounting drag that can simply be removed would overstate the comparability of consolidated earnings. Pasted text.txt
CAPITAL ALLOCATION: LESS BUYBACK SUPPORT, MORE DEPLOYMENT RISK
The capital-allocation discussion was arguably the most consequential change in the call. The approximately $1 billion repurchase figure discussed in the Q&A referred to gross activity; reported net repurchases were $664 million. Management did not describe the reduction as a change in the capital hierarchy. Rather, it argued that the opportunity to deploy capital organically had improved enough to make repurchases a less attractive marginal use. Dimon explicitly said that the main reason was not AOCI, a tactical forecast of the environment, or speculation about Basel rules. Pasted text.txt
The economic trade-off is substantial. Repurchases provide relatively immediate support to per-share earnings through a smaller share count. Organic deployment requires time to generate revenues, incurs expenses and credit costs, and can produce a wider range of outcomes. Attractive deployment can create more long-term value than repurchases, especially when the stock is expensive, but the benefit must be demonstrated through realized returns. Management’s reference to an approximately 6% earnings yield was an illustration of relative attractiveness, not a disclosed cost of equity, formal investment hurdle, or independently established valuation target. Pasted text.txt
Capital remained substantial, but the direction of travel was less supportive of indiscriminate distributions. The standardized CET1 ratio declined to 13.9% as earnings were offset by AOCI losses, higher risk-weighted assets, and distributions. The finalized Q2 ratio was 14.2%, consistent with the approximately 30-basis-point sequential decline described on the call. Risk-weighted assets increased approximately $52 billion. At a constant 13.9% ratio, that increase alone would require approximately $7.2 billion of additional CET1 capital. This is an illustrative capital requirement, not a cash investment figure, and part of the RWA increase reflected energy prices and market volatility rather than purely discretionary new lending. Pasted text.txt
Management’s approximately $30 billion estimate of excess capital should therefore not be treated as a committed distribution pool. The estimate depends partly on uncertain regulatory outcomes, and ongoing growth can absorb capital while market moves affect capital ratios independently of operating earnings. Higher rates can support NII and simultaneously reduce securities valuations and AOCI. Dimon’s explanation of why management chose to reduce repurchases can coexist with the objective observation that capital flexibility has become more sensitive to deployment, market volatility, and balance-sheet expansion.
The Security and Resiliency Initiative requires careful interpretation. Its original announcement described $1.5 trillion of financing, facilitation, and investment over 10 years, including approximately $1 trillion already planned and up to $500 billion of additional activity. Direct equity and venture investments were separately described as up to $10 billion. These are not equivalent measures of JPMorgan’s own balance-sheet usage or regulatory capital consumption. The initiative can generate advisory, underwriting, payments, lending, and investment revenues, but headline financing volume cannot be translated directly into retained loans or incremental earnings. The current call conveyed stronger confidence in the opportunity set without providing a quantified bridge from program activity to capital usage and shareholder returns. Pasted text.txt
CREDIT QUALITY AND THE MACROECONOMIC TRANSMISSION
Current credit performance remained supportive. Firmwide net charge-offs were approximately $2.2 billion, and the net reserve build was $539 million. The quarterly card net charge-off rate was 2.91%, compared with 3.34% in Q2 and 3.15% a year earlier. Nevertheless, management retained the approximately 3.2% full-year card outlook. A favorable quarterly reading should not be substituted for the annual forecast or extrapolated into 2027, particularly because the call did not provide a 2027 loss-rate guide. Pasted text.txt
Barnum gave a clear causal explanation for consumer resilience: “the consumer is currently very healthy primarily because of a healthy labor market.” That places employment, rather than interest rates alone, at the center of the credit outlook. Higher rates can initially improve lending yields while leaving credit performance relatively stable. If restrictive policy subsequently weakens employment, the same rate environment can generate larger credit losses and slower growth. The call supports confidence in current consumer performance, not immunity to an extended restrictive cycle. The 6% 10-year Treasury yield discussed in the Q&A was a stress scenario posed to management, not a JPMorgan forecast.
Corporate credit was described as broadly stable, and Barnum attributed the wholesale reserve build to new activity rather than an aggregate deterioration in the outlook. That statement should not be expanded into a claim that no individual exposures weakened. The earnings release separately identified changes in the credit quality of certain CIB exposures among provision drivers. These disclosures can coexist: portfolio growth can drive the overall reserve build while individual borrowers experience credit migration. The relevant conclusion is stability at the aggregate level, with continuing borrower-specific risks. Pasted text.txt
Dimon’s statement that “we’re tightening up a little bit on credit” is an important leading indicator even in the absence of broad deterioration in reported losses. Management identified weak covenants, collateral priming, and aggressive structures as areas where discipline matters. This does not contradict the decision to retain capital for growth. It implies that the objective is selective, adequately compensated deployment rather than indiscriminate loan expansion. The investment risk is that strong market demand for financing encourages lenders to accept weaker protection before realized loss data reveal the cost. Pasted text.txt
The middle-market discussion also qualified the broader capital-demand narrative. Barnum specifically rejected the idea that the seemingly insatiable demand observed elsewhere applied uniformly to core middle-market clients. Higher rates, input costs, inflation, and diesel prices were creating caution despite generally healthy balance sheets. This suggests that strong institutional financing demand should not be treated as evidence of a uniformly accelerating economy. It also limits the usefulness of extrapolating Wall Street activity into broad commercial loan demand. Pasted text.txt
AI PRODUCTIVITY: REAL ACTIVITY, UNPROVEN INCREMENTAL EARNINGS
The AI discussion was unusually explicit about the gap between technological progress and observable financial results. Barnum did not validate the approximately $2 billion annual AI expense figure raised in the question and did not provide a refreshed, clearly defined spending or savings target. He also distinguished previously quantified benefits, including fraud-prevention and machine-learning applications, from the current discussion of generative and agentic productivity. Historical AI benefits therefore should not be relabeled as newly emerging generative-AI savings or added again to future earnings estimates. Pasted text.txt
The strongest disclosure was the acknowledgment that aggregate benefits are not yet visible in quarterly earnings. Management described promising experiments, including accelerated rewrites of legacy tools, but also emphasized incomplete results, implementation time, and token costs. This supports genuine adoption and potential productivity gains without establishing a measurable near-term reduction in the expense base. Conversely, rising expenses do not prove that AI is failing: productivity could increase capacity, improve quality, or avoid spending that would otherwise have occurred. The missing element is a quantified counterfactual and a net financial benefit after implementation and usage costs. Pasted text.txt
The procurement strategy has direct TMT implications. Barnum stated, “our strategy is quite focused on minimizing lock-in and maximizing optionality and the ability to manage costs.” Management described model and harness agnosticism, proprietary and open-model alternatives, and routing workloads to appropriately capable, economical systems. The inference is that enterprise adoption can expand substantially without establishing durable pricing power for any particular model provider. More usage can coexist with aggressive substitution and lower spending per task. The call supports demand for AI-enabled workflows, but it does not establish a specific vendor winner or a straightforward relationship between token growth and supplier margins. Pasted text.txt
AGENTIC AI AND THE DEPOSIT FRANCHISE
Management framed personal financial agents as the intersection of familiar yield-seeking behavior and fintech-driven improvements in customer experience. That framing appropriately rejects the assumption that deposit competition is new. However, a reasonable investment inference is that lower search and execution costs could still change its intensity. A customer can retain JPMorgan as the primary transaction bank while allowing an agent to sweep more idle balances into higher-yielding alternatives. Primary relationship retention and retention of low-cost funding are related, but not identical, competitive outcomes. Pasted text.txt
JPMorgan’s response combines product development, security controls, and reliance on trust and distribution. Smart Cash had recently gone live but remained a targeted pilot, with no disclosed adoption, balance, retention, or profitability metrics. Management also described blocking insecure credential-sharing and screen-scraping access where possible while developing safer approaches. Those controls can protect customers and the bank, but the call did not establish that they create a permanent barrier to competitive cash-routing services. The strategic requirement is to offer secure functionality that customers value rather than rely solely on brand loyalty or restrictions on external access.
The liquidity discussion made the distinction between economic disruption and a bank run clearer. Barnum argued that confidence and deposit-base composition matter more than transaction friction, stating that “you’re probably not supposed to be hoping that your deposits are stable because the money is difficult to move.” Dimon emphasized approximately $1.5 trillion of cash and marketable securities. These comments support confidence in liquidity preparedness, but they do not resolve the separate earnings question of whether customers will leave less idle money in low-cost accounts. A deposit franchise can remain operationally stable while becoming economically more expensive. Pasted text.txt
Dimon’s discussion of subscriptions and bundled checking and investment accounts was strategically significant but should not be treated as an announced pricing change. It acknowledged that banking services must ultimately be paid for, even if idle-deposit NII becomes a less reliable funding mechanism. Replacing implicit payment through foregone deposit interest with explicit fees could preserve some revenue, but customer willingness to pay and competitive pricing would determine the outcome. The call supports adaptability in the business model, not proof that any lost deposit economics could be recovered without friction or margin pressure. Pasted text.txt
AI FINANCING AND PORTFOLIO CONCENTRATION
The most important AI financing disclosure was the rejection of narrow exposure definitions. Barnum emphasized direct and indirect issuer exposure, capital-structure position, collateral quality, and enterprise-wide thematic risk. AI-related financing increasingly spans construction, working-capital facilities, and equity-market activity. Different legal borrowers and financing structures do not necessarily represent independent economic risks when their repayment capacity depends on a common infrastructure investment cycle. The appropriate analytical unit is therefore broader than a list of loans explicitly labeled as data-center or AI financing. Pasted text.txt
Management described current exposure as modest relative to the overall wholesale portfolio but added that this did not imply immunity to a major change in AI sentiment. The limitation is important: neither a comprehensive exposure amount nor quantified stress losses were disclosed. A reversal could affect borrowers, collateral valuations, financing demand, prime brokerage clients, investment banking transactions, and asset-management fees through different channels. Some trading activity could benefit from volatility, but that would not necessarily offset weaker revenues and credit deterioration elsewhere. Pasted text.txt
For a TMT-heavy portfolio, the implication is that JPMorgan should not automatically be treated as an independent hedge against an AI capital-spending reversal. The company offers diversification across businesses and financing channels, but the call itself identified an increasingly pervasive common factor. The bullish interpretation is that JPMorgan can earn across many parts of the investment ecosystem without taking every underlying technology risk. The bearish interpretation is that apparent diversification across loans, securities, clients, and fee businesses may narrow precisely when the common theme weakens. Both interpretations are consistent with management’s emphasis on enterprise-wide stress testing. Pasted text.txt
LIQUIDITY RULES AND REGULATORY OPTIONALITY
Management did not provide a firm forecast for capital or liquidity-rule changes. The discussion covered discount-window readiness, Federal Home Loan Bank access, high-quality liquid asset definitions, liquidity coverage requirements, and inconsistencies across resolution and recovery frameworks. The underlying economic point was that abundant capital does not necessarily translate into unconstrained lending capacity when liquidity requirements remain binding. Barnum argued that a more balanced framework could allow greater participation in lower-risk-density activities, including mortgages and secured commercial lending. That is a potential business-mix opportunity, not a guaranteed earnings catalyst or automatic release of capital for repurchases. Pasted text.txt
INVESTMENT IMPLICATIONS AND EARNINGS SENSITIVITIES
The strongest long-term implication is that JPMorgan continues to demonstrate customer acquisition and a broad capacity to deploy capital across businesses. The strongest caution is that management is increasing the earnings base’s dependence on future execution while current returns benefit from unusually favorable conditions. The call supports continued franchise investment, but it does not establish that the next dollar retained will earn the same return as the existing franchise or that current profitability should be capitalized indefinitely. Less repurchasing also reduces a source of per-share growth that does not require additional operating revenue.
The maintained 17% through-the-cycle ROTCE objective is therefore an important valuation anchor. Management explicitly attributed current strength to favorable volumes, asset prices, and credit performance and warned that simultaneous exceptional performance across the franchise is historically unusual. At an unchanged tangible common equity base, moving from 21% adjusted ROTCE to 17% would imply approximately 19% lower common earnings. That is a normalization sensitivity, not a 2027 forecast. Absolute earnings can still increase as capital grows, but the calculation demonstrates why current returns should not automatically be treated as a permanent baseline for valuation. Pasted text.txt
Illustrative sensitivities show how modest changes in large balance-sheet variables can offset meaningful portions of the NII outlook. Assuming a 24% marginal tax rate and 2.7 billion diluted shares, a $1 billion annual pretax change equates to approximately $0.28 of EPS. An additional 10 basis points of funding cost on $1 trillion of deposits would produce that approximate expense increase. A 50-basis-point increase in annual credit losses on an illustrative $250 billion card portfolio would cost approximately $1.25 billion pretax, or $0.35 per share. That is approximately the same pretax magnitude as the yield-curve contribution identified in the 2027 NII bridge. These are static analytical scenarios, not management forecasts, and exclude changes in balances, pricing, reserves, behavior, and other revenues. Pasted text.txt
The favorable scenario is continued growth in primary customer relationships, manageable deposit migration, disciplined capital deployment, resilient employment, and conversion of the transaction pipeline into completed business. Under those conditions, the larger NII base and expanding client franchise could outweigh reduced buyback support. The less favorable scenario does not require a systemic credit event: weaker capital-markets revenues, faster deposit repricing, and expenses that remain elevated could produce disappointing operating leverage while new investments take longer to generate returns. The call’s own combination of strong current credit, September activity moderation, and unfinished expense planning makes that earnings-normalization scenario relevant.
The most consequential subsequent evidence will be the finalized 2027 expense budget, deposit mix and marginal funding costs, Q4 transaction completion rates, trading performance against normal seasonality, and realized returns on the capital being retained. Credit migration and capital consumption should be assessed alongside loan growth, rather than after it. AI should be evaluated through demonstrated net productivity and customer economics, not gross activity or unrefreshed historical benefit estimates. The quarter leaves the structural franchise thesis intact, but raises the burden of proof for sustained operating leverage, premium returns, and the proposition that reduced buybacks will be compensated by superior long-term capital deployment.
COMPANY EMPLOYEES PARTICIPATING IN THE CALL
• Jamie Dimon — Chairman and Chief Executive Officer. Pasted text.txt • Jeremy Barnum — Chief Financial Officer. Pasted text.txt
RESEARCH ANALYSTS PARTICIPATING IN THE CALL
• Ebrahim Poonawala — Bank of America. Pasted text.txt • John McDonald — Truist Securities. Pasted text.txt • Erika Najarian — UBS. Pasted text.txt • Christopher McGratty — Keefe, Bruyette & Woods. Pasted text.txt • Ken Usdin — Autonomous Research. Pasted text.txt • Mike Mayo — Wells Fargo Securities. Pasted text.txt • Gerard Cassidy — RBC. Pasted text.txt • Glenn Schorr — Evercore ISI. Pasted text.txt • Manan Gosalia — Morgan Stanley. Pasted text.txt • Matt O’Connor — Deutsche Bank. Pasted text.txt • David Chiaverini — Jefferies. Pasted text.txt • Kunpeng Ma — China Securities Co. Pasted text.txt
Key Read-Throughs
KEY READ-THROUGHS FROM JPMORGAN CHASE’S Q3 2026 EARNINGS CALL
JPMorgan’s 10/13/26 call supports a selective rather than uniformly bullish interpretation of the broader market. Consumer spending, equity financing, and AI-related capital demand remain strong, but these conditions coexist with renewed funding-cost pressure, greater scrutiny of credit structures, and slower transaction execution following the September rate sell-off. The most consequential distinction is between activity growth and the profitability of servicing that activity: rising AI usage does not establish durable model pricing power, strong financing demand does not eliminate concentration limits, and resilient consumer spending does not guarantee retailer or airline margin expansion. Management also explicitly separated exceptional institutional capital demand from the more cautious behavior of middle-market businesses. The highest-conviction implications therefore concern specific revenue models, financing structures, and competitive positions rather than a generalized acceleration in corporate earnings. Magnitude assessments below refer to potential business and earnings exposure, not predicted share-price movements.
AI INFRASTRUCTURE: CONTRACTED DEMAND DOES NOT ELIMINATE FINANCING CONCENTRATION (READ-THROUGH 1)
CoreWeave (CRWV: United States) has a negative read-through for the assumption that contracted AI demand can translate into proportionate capacity expansion without increasing financing friction. Potential magnitude is high for marginal project returns and equity funding requirements, but the call does not establish an immediate financing interruption or earnings reduction. This is principally a 6–24-month underwriting and valuation issue rather than a demonstrated Q4 operating shortfall.
The supporting commentary is unusually specific. Barnum emphasized the need to aggregate direct and indirect issuer exposure, evaluate collateral and capital-structure position, and stress the entire AI theme rather than treat individual facilities independently. AI exposure now extends beyond construction lending into working-capital revolvers and equity-market relationships. Dimon separately stated that “we’re tightening up a little bit on credit,” identifying weak covenants and asset priming as concerns. The important inference is that a larger number of project companies, financing vehicles, or instruments does not necessarily create more independent credit capacity when repayment ultimately depends on overlapping customers and the same investment cycle.
CoreWeave’s disclosed financing structure makes this connection concrete. Its March 2026 facility provided up to $8.5 billion of financing secured by computing infrastructure and an associated customer contract. JPMorgan participated as a coordinating lead arranger, alongside other major banks, while Blackstone Credit & Insurance anchored the transaction. The facility also demonstrates that financing remained available on attractive terms; it is evidence against describing the current environment as a credit shutdown. However, its dependence on both infrastructure collateral and contracted customer payments illustrates precisely why lenders must look through the legal borrower to the underlying economic exposure.
The transmission mechanism is higher incremental borrowing spreads, lower advance rates, additional equity requirements, or slower financing completion if lenders approach concentration limits. Each can reduce the equity return on otherwise commercially attractive capacity. Illustratively, an additional 100 basis points on $10 billion of newly priced borrowing represents $100 million of annual pretax interest expense; a 5-percentage-point reduction in debt funding for a $10 billion project portfolio requires $500 million of additional equity. These are sensitivities, not forecasts for CoreWeave.
The relevant trading catalysts are subsequent financing terms, draw conditions, and the relationship between committed capacity and fully funded delivery. The call supports greater differentiation between financing-dependent AI infrastructure companies and internally funded expansion. It does not support extrapolating a current semiconductor or cooling-equipment order cancellation from a lender’s discussion of prospective concentration risk. Pasted text(20261013-154245).txt
ENTERPRISE AI: MODEL ROUTING WEAKENS PREMIUM PRICING POWER WHILE SUPPORTING MULTI-MODEL DISTRIBUTION (READ-THROUGH 2)
Microsoft (MSFT: United States) and Alphabet (GOOGL: United States) face a negative structural read-through for premium inference pricing and model-specific customer lock-in. Amazon.com (AMZN: United States) has a relative positive read-through for AWS’s multi-model distribution proposition. Microsoft and Alphabet also participate in that distribution opportunity, so the implication is not a blanket negative for their cloud businesses. Magnitude is moderate for the competitive economics of AI services over 12–36 months, with limited support for an immediate consolidated earnings revision.
Barnum described JPMorgan’s strategy as “minimizing lock-in and maximizing optionality and the ability to manage costs.” The strategy encompasses model agnosticism, harness agnosticism, proprietary models, and open models. Dimon added that routing should select “the best, quickest, cheapest,” rather than use the most expensive model for every request. This is direct evidence that a sophisticated enterprise buyer intends to make model substitution and cost optimization architectural features, not occasional procurement exercises. Pasted text(20261013-154245).txt
The negative transmission mechanism is competition at the workload level. When an enterprise can route a task to a less expensive model without materially impairing the result, frontier-model capability does not automatically translate into frontier-model pricing across all usage. Greater task volume can therefore coexist with declining revenue per completed task and pressure on the gross profit earned from serving that task. Harness agnosticism broadens the competitive issue: the customer is seeking flexibility in the surrounding execution framework as well as the underlying model.
The relative beneficiaries are platforms capable of retaining the workload even when the selected model changes. AWS offers multiple models through Bedrock, Microsoft offers model routing through Foundry, and Google provides access to proprietary, partner, and open models. Open-model deployment can still generate compute revenue; it does not make infrastructure consumption free. These product capabilities establish the business-model mapping, but the call does not identify a new JPMorgan contract award to any of these vendors.
The actionable distinction is between growth in cloud workloads and persistence of premium model economics. The call is supportive of continued enterprise experimentation and deployment, but adverse to valuation cases that assume rapidly growing usage must carry stable premium pricing. Subsequent cloud results should distinguish consumption growth, realized pricing, and cost-to-serve improvement. Lower inference prices can stimulate demand sufficiently to increase total revenue, but that elasticity was not quantified in this call and should not be presumed. Pasted text(20261013-154245).txt
IT SERVICES: SOFTWARE PRODUCTIVITY CREATES A REVENUE-MODEL PROBLEM BEFORE IT CREATES A DEMAND COLLAPSE (READ-THROUGH 3)
Infosys (INFY: India) and Cognizant Technology Solutions (CTSH: United States) have a negative longer-duration read-through for labor-priced application development and routine maintenance work. Potential magnitude is moderate at the service-line level over 1–3 years, with low immediate earnings visibility. The primary risk is fewer billable hours or lower contract pricing for a given output, not an imminent disappearance of enterprise technology spending.
Barnum described experiments attempting to rewrite minor legacy tools within weeks, while acknowledging that “it didn’t work perfectly.” He nevertheless reported increasingly promising opportunities for acceleration and productivity. Equally important, he stated that “the benefits aren’t observable in our current quarterly earnings.” Together, these observations support a developing change in software-production economics while arguing against an immediate, institution-wide reduction in technology expense. Pasted text(20261013-154245).txt
The exposure follows from the suppliers’ commercial models. Cognizant discloses time-and-materials arrangements in which revenue depends on labor hours, alongside other contract structures. Infosys explicitly provides application development, maintenance, and modernization services. When equivalent work can be completed with fewer hours, time-and-materials revenue is directly exposed unless additional project volume offsets the reduction. On fixed-price work, the initial effect can instead be positive for supplier margins, but competitive rebidding and customer demands to share productivity gains can subsequently reduce revenue per project.
A less obvious competitive threat is the strengthening of the customer’s internal delivery option. JPMorgan’s experiments demonstrate that enterprise technology teams are testing whether work previously considered lengthy or uneconomic can be completed internally. That creates additional negotiating leverage even when the external supplier retains the engagement. The call does not establish that JPMorgan has canceled an Infosys or Cognizant contract, and minor-tool experiments should not be equated with proven automation of complex core-system migrations.
The near-term catalysts are renewal pricing, delivery headcount relative to revenue, and whether AI-related bookings represent incremental integration work or substitution for existing development effort. Longer term, suppliers that monetize domain expertise, implementation accountability, data integration, and measurable outcomes are better positioned than offerings priced predominantly around coding capacity. This is therefore a negative read-through for revenue intensity per project, with important offsets from larger modernization backlogs and potentially better fixed-price execution. Pasted text(20261013-154245).txt
CYBERSECURITY: AGENT ACCESS CONTROLS BECOME A PREREQUISITE FOR DEPLOYMENT (READ-THROUGH 4)
Okta (OKTA: United States) and Palo Alto Networks (PANW: United States) have a positive read-through for identity governance, privileged access, and machine-identity security. Potential magnitude is moderate over 12–24 months; immediate earnings implications are limited because the transcript confirms customer requirements, not specific supplier purchases.
Management stated that JPMorgan would not allow arbitrary external agents into its environment because of customer and institutional risk. Barnum also described blocking credential-sharing and screen-scraping approaches where possible, while developing safer methods of access. These comments make the deployment constraint explicit: a capable agent is not sufficient unless the enterprise can control what it accesses, determine whose authority it exercises, and terminate that authority when necessary.
The positive transmission mechanism is expansion of the identity-security workload beyond human employees. Agents require discoverable identities, appropriately scoped permissions, managed credentials or tokens, accountable owners, and auditable actions. Okta’s agent products directly address these functions. Palo Alto Networks’ completed acquisition of CyberArk gives it exposure to privileged-access and human, machine, and agentic identity security. These capabilities align with the requirements described on the call, although no JPMorgan purchasing relationship is established by the transcript.
The important monetization qualification is that additional protected identities do not automatically create an equivalent number of new paid licenses. Okta includes Agent SSO in core SSO plans at no additional cost, while offering broader agent discovery and governance through a separate subscription. This supports an expansion and retention opportunity rather than a simplistic assumption that every agent immediately generates incremental license revenue. Bundling, customer-developed controls, and competing platform offerings will determine how much of the new workload becomes supplier revenue.
Near-term catalysts are paid governance adoption, expansion of existing identity contracts, and evidence that agent-related functionality improves retention or contract value. The longer-duration positive is more fundamental: as agents gain access to sensitive systems, security becomes part of the minimum viable deployment architecture rather than an optional enhancement. The call supports this category-level demand conclusion more strongly than it supports identifying a particular model provider as the winner.
PRIVATE CAPITAL: AI FINANCING EXPANDS ORIGINATION OPPORTUNITIES BUT REDUCES CROSS-SECTOR DIVERSIFICATION (READ-THROUGH 5)
Apollo Global Management (APO: United States) and Blackstone (BX: United States) have a positive read-through for large-scale credit origination, structuring, and fee-paying assets. Potential magnitude is moderate over 12–36 months. The corresponding negative is that exposure to these firms should not automatically be treated as diversification away from the AI investment cycle.
Barnum described increasing use of different parts of the capital-markets ecosystem to finance AI infrastructure and emphasized that substantial capital remained available outside banks. However, he also warned that the AI theme now extends across construction financing, revolving credit, and equity markets. The opportunity is consequently broader than conventional data-center property lending, but the underlying risks can remain economically correlated even when they are distributed across different asset classes. Pasted text(20261013-154245).txt
Publicly disclosed transactions establish the company mapping. Apollo-managed funds and affiliates led an initial $35 billion capital solution for Broadcom’s AI XPV platform, in partnership with Blackstone and banks. The transaction supports Anthropic’s compute expansion, and JPMorgan was identified as a co-advisor to Broadcom. Separately, Blackstone Credit & Insurance anchored CoreWeave’s $8.5 billion infrastructure financing. These are actual financing relationships, not inferred allocations from JPMorgan’s general comments about AI.
The positive mechanism is the ability to convert demand for complex financing into origination economics and, where assets are held in managed vehicles, recurring management fees. Large platforms can combine underwriting, structuring, distribution, and access to long-duration capital. However, announced financing commitments are not equivalent to immediate fee revenue or fully drawn assets, and the economics depend on the particular vehicle, draw schedule, retained exposure, and fee arrangements.
The competitive interpretation also requires care. JPMorgan is not describing a wholesale withdrawal that leaves private lenders an uncontested market. Dimon said the bank had become more confident in attractive organic deployment and was retaining capital accordingly. The likely outcome is a combination of partnership and competition between banks and alternative managers, with underwriting terms and distribution capabilities determining returns. Pasted text(20261013-154245).txt
The cross-portfolio risk is material. A portfolio containing AI infrastructure equities, AI-related private-credit exposure, and alternative-manager equities may be less diversified than its sector labels imply. A deterioration in the same underlying customers can affect investment marks, realizations, credit performance, and fundraising simultaneously. The bullish thesis is expanding financial intermediation; it is not that financing infrastructure is economically independent of the infrastructure demand cycle. Pasted text(20261013-154245).txt
BANKS AND BROKERS: RETAINING CUSTOMER ASSETS DOES NOT PRESERVE LOW-COST FUNDING (READ-THROUGH 6)
Charles Schwab (SCHW: United States) and Bank of America (BAC: United States) have a negative read-through for assumptions that cash sorting has permanently ended or that additional rate increases translate cleanly into higher net interest income. Potential magnitude is moderate for funding economics through 2027. The implication concerns incremental deposit mix and pricing, not an unconditional forecast that either company’s total net interest income will decline.
Management explicitly rejected the view that all possible cash sorting has already occurred. Higher rates can increase interest paid on premium products and encourage migration from checking and savings into certificates of deposit, raising the weighted-average cost of deposits even when balances remain within the same institution. Barnum emphasized that behavior across products may matter more than the pricing of any individual product.
Schwab is particularly relevant because retaining a customer’s assets on the brokerage platform is not economically equivalent to retaining low-cost bank funding. A shift from bank or sweep cash into a money-market fund can preserve the client relationship and generate management fees while reducing the balances supporting bank spread income. Replacement funding costs or balance-sheet adjustment can then offset part of the benefit from higher asset yields. Schwab’s own reporting separately identifies bank and brokerage cash and proprietary money-market-fund assets, reflecting these distinct revenue channels.
For Bank of America, the relevant mechanism is likewise deposit repricing and mix migration against the benefit from asset repricing. JPMorgan’s favorable experience should not be copied mechanically into another bank’s earnings model. Only approximately 25% of the $5 billion increase in JPMorgan’s 2027 NII ex-Markets central case versus its Q4 annualized run rate was attributed to the yield curve; most reflected balance growth and mix. JPMorgan also reported approximately 650,000 net new checking accounts, an institution-specific source of funding strength rather than proof of identical industry behavior.
Schwab’s 10/15/26 results are the clearest immediate catalyst, particularly its cash-balance composition and funding commentary. Over a longer horizon, agent-assisted cash movement could make yield optimization more persistent. The financial risk is margin erosion even without customer departures, not necessarily a technology-induced bank run. JPMorgan’s discussion of subscriptions and bundled banking products acknowledged that a reduction in idle-cash economics could eventually require a different way of charging for banking services. Pasted text(20261013-154245).txt
SECURITIES FIRMS: PRIME FINANCING IS THE CLEANEST NEAR-TERM POSITIVE READ-THROUGH (READ-THROUGH 7)
Morgan Stanley (MS: United States) and Goldman Sachs Group (GS: United States) have a positive read-through for institutional equities, prime financing, and derivatives. Magnitude is moderate to material at the business-line level in Q3, with Morgan Stanley’s 10/14/26 results providing the most immediate company-specific catalyst. The inference for Q4 is less certain.
JPMorgan reported 49% growth in equities revenue, with prime brokerage and derivatives specifically identified as strong. In the Q&A, Barnum endorsed the characterization of exceptionally strong demand for capital in the markets franchise and reported no meaningful recent change. This combination points to financing and client-balance-sheet usage, not simply a temporary increase in cash-equity commissions.
The transmission mechanism is greater client financing balances, securities-lending activity, and derivatives intermediation. Morgan Stanley’s institutional platform directly participates in these activities. Goldman’s separately reported Q3 results provide useful corroboration: equities revenue increased 72%, with financing and derivatives identified as drivers. That independent observation strengthens the conclusion that the environment was favorable across major franchises rather than solely reflecting JPMorgan market-share gains. However, Goldman’s result was already disclosed on 10/13/26, so JPMorgan’s commentary is corroboration rather than a new Goldman earnings surprise.
For Morgan Stanley, the actionable question is whether its financing activity and derivative revenues show similar strength, and how much survives compensation and capital costs. JPMorgan’s 49% growth rate should not be applied directly to a peer because client mix, comparative periods, balance-sheet allocation, and market share differ. Morgan Stanley’s scheduled release on 10/14/26 makes this a near-term earnings-validation catalyst rather than merely a distant structural theme.
The principal limit is forward extrapolation. Barnum’s planning assumption remained a normal seasonal decline in Q4 markets revenue, while Dimon offered a more optimistic judgment because of continuing global activity. Neither supplied a numerical Q4 trading forecast. The high-conviction conclusion is strong Q3 industry activity; the call does not justify treating peak financing conditions or unusually strong annual growth as a permanent run rate. Pasted text(20261013-154245).txt
ADVISORY FIRMS: THE SEPTEMBER SLOWDOWN THREATENS FEE TIMING BEFORE IT THREATENS THE FRANCHISE (READ-THROUGH 8)
Evercore (EVR: United States) and Lazard (LAZ: United States) have a negative read-through for near-term advisory revenue visibility. Potential quarterly magnitude is greater for Evercore’s advisory-centered earnings profile, while Lazard’s asset-management business provides a partial offset. The relevant horizon spans Q4 2026 into 2027 because transaction delays affect announcements and completions at different points.
The evidence is the gap between strong annual activity and a softer exit rate. JPMorgan’s investment banking fees increased 14%, but Barnum identified a slowdown in the second half of September as the rate sell-off made it harder for buyers and sellers to agree on valuations. Management continued to describe underlying business demand as robust. The implication is therefore delayed monetization of commercial interest, not evidence that advisory demand has disappeared.
For advisory firms, a pipeline is not equivalent to recognized revenue. Delayed agreement on transaction economics can push announcements outward and subsequently move completion-linked fees into later quarters. Conversely, transactions already signed and approaching completion may be less affected than early-stage negotiations. Evercore itself highlights the sensitivity of quarterly advisory results to transaction timing; Lazard’s combination of financial advisory and asset management gives it a different exposure mix.
The precise near-term catalyst is management commentary on completed transactions, expected closing dates, and the maturity of the backlog—not simply whether the pipeline is described as strong. A September slowdown in new negotiations could have a larger effect on 2027 fees than on Q4 2026, depending on the existing book of signed transactions. An immediate across-the-board earnings reduction would therefore be less defensible than a higher discount for timing uncertainty and a more demanding assessment of backlog conversion.
The geographic qualification is important. Dimon described a healthy European pipeline, including stronger-than-expected IPO opportunities. That argues against assuming a synchronized collapse across regions, but it does not establish a specific advisory firm’s mandate share or completion schedule. For private-equity portfolios, the related negative is the potential delay of exits and performance-fee realizations even while recurring management fees remain intact. Pasted text(20261013-154245).txt
EXCHANGES: RATE UNCERTAINTY IS A CLEANER REVENUE OPPORTUNITY THAN DEALER RISK-TAKING (READ-THROUGH 9)
CME Group (CME: United States) has a positive read-through for interest-rate hedging and portfolio-adjustment activity. Magnitude is moderate over the next 1–2 quarters, contingent on continued changes in rate expectations and client positioning. The call adds more to the case for sustained activity than to the already disclosed Q3 earnings picture.
JPMorgan described a consequential rate sell-off, continuing volatility, and substantial uncertainty around the next stage of the rate cycle. Yet its fixed-income revenue declined 4%, including weaker rates revenue. This contrast is central: volatile markets do not guarantee higher dealer profits because inventory positioning, spreads, financing, and client mix affect the result. Exchange revenue has a more direct connection to executed and cleared contract activity.
CME’s Treasury, SOFR, and other rate products provide instruments for repricing policy expectations, hedging duration, and adjusting funding exposures. The economic mechanism is additional trading and clearing revenue as participants reposition—not a requirement that CME correctly anticipate the direction of rates. The relevant variable is uncertainty and adjustment activity, rather than the absolute level of yields alone.
CME’s previously released operating data already support this mapping. September average daily volume increased 22%, and Q3 average daily volume increased 16%, with record interest-rate activity. These figures were public before JPMorgan’s call and should not be presented as a newly discovered Q3 upside surprise. JPMorgan’s incremental contribution is evidence that the issues driving repositioning remained commercially important at quarter-end.
The near-term catalysts are subsequent monthly volumes, product mix, and realized revenue per contract. Higher contract counts do not translate proportionately into earnings if growth shifts toward lower-fee products or if expenses increase. Nevertheless, the call favors exchange-based exposure to risk-transfer activity over the indiscriminate assumption that every bank’s fixed-income trading desk benefits from the same volatility. The decline in JPMorgan’s fixed-income revenue provides the clearest evidence for that distinction. Pasted text(20261013-154245).txt
PAYMENT NETWORKS: NOMINAL SPENDING RESILIENCE IS A CLEANER SIGNAL THAN CONSUMER-COMPANY MARGINS (READ-THROUGH 10)
Visa (V: United States) and Mastercard (MA: United States) have a positive near-term read-through for underlying payment activity. Magnitude is moderate for revenue support over the next 1–2 quarters, but the call does not establish a company-specific earnings beat or equivalent growth in global network volume.
JPMorgan reported 10% growth in combined debit and credit spending, including continued momentum in gas and travel. Management also maintained its approximately 3.2% card net charge-off outlook and attributed current consumer health primarily to a healthy labor market. This is evidence of resilient nominal transaction demand within a large card franchise, rather than a contemporaneous collapse in consumer purchasing capacity.
The supplier/customer relationship is direct: Chase issues cards using both Visa and Mastercard networks. These networks monetize payment activity through transaction and volume-related economics rather than retaining the associated Chase consumer loan principal. Consequently, the call’s spending signal maps more cleanly into network demand than into the profitability of consumer-credit portfolios or the operating margins of merchants receiving the spending.
The distinction is especially valuable for gas and travel. Higher fuel prices can support nominal payment volume while simultaneously pressuring household budgets and transportation-company costs. Strong travel spending similarly does not establish stronger airline unit profitability after fuel, wages, and capacity costs. Visa and Mastercard provide exposure to the transaction economics without requiring a correct forecast of those merchant-level margins. This is the strongest reason to prefer the payment-network read-through over a broad bullish conclusion for discretionary retail or travel equities.
The principal limitations are mix and representativeness. JPMorgan’s 10% spending growth cannot be substituted for Visa or Mastercard revenue guidance; network results also depend on transaction counts, geographic mix, cross-border activity, incentives, and pricing. Domestic travel spending does not prove stronger international cross-border volume, and nominal growth does not establish equivalent real consumption growth. The immediate positive is resilient payment demand. The longer-duration risk remains employment: management explicitly connected a prolonged restrictive cycle and higher unemployment with weaker consumer outcomes, making current resilience supportive rather than permanent.
Report record
- Sector
- Financials
- Industry
- Diversified Banks
- Fiscal period end
- September 30, 2026
- Report date
- October 13, 2026
- Analysis
- 5653 words
- Read-throughs
- 3823 words
- Content fingerprint (PDF)
e42dbbc56bda- Content fingerprint (analysis)
bb8ce2b47711- Content fingerprint (read-throughs)
ff3d50f5ea8e
Prepared from the company's earnings release and earnings call transcript. Figures as reported by the company. For information only. Not investment advice.
More from JPMorgan Chase & Co
No other reports yet.
All JPMorgan Chase & Co reports
More in Financials
Record Asset Gathering, but First-Half Earnings Momentum Cooled

A stronger revenue floor, but reported returns remain cyclically elevated
Follow @AtlasPeakRes on X for new earnings reports as they publish.