Earnings Resilient Near Term; the Financing Model Is Unresolved
Earnings Reports
NextEra Energy, Inc. FQ3 2026 Earnings Report
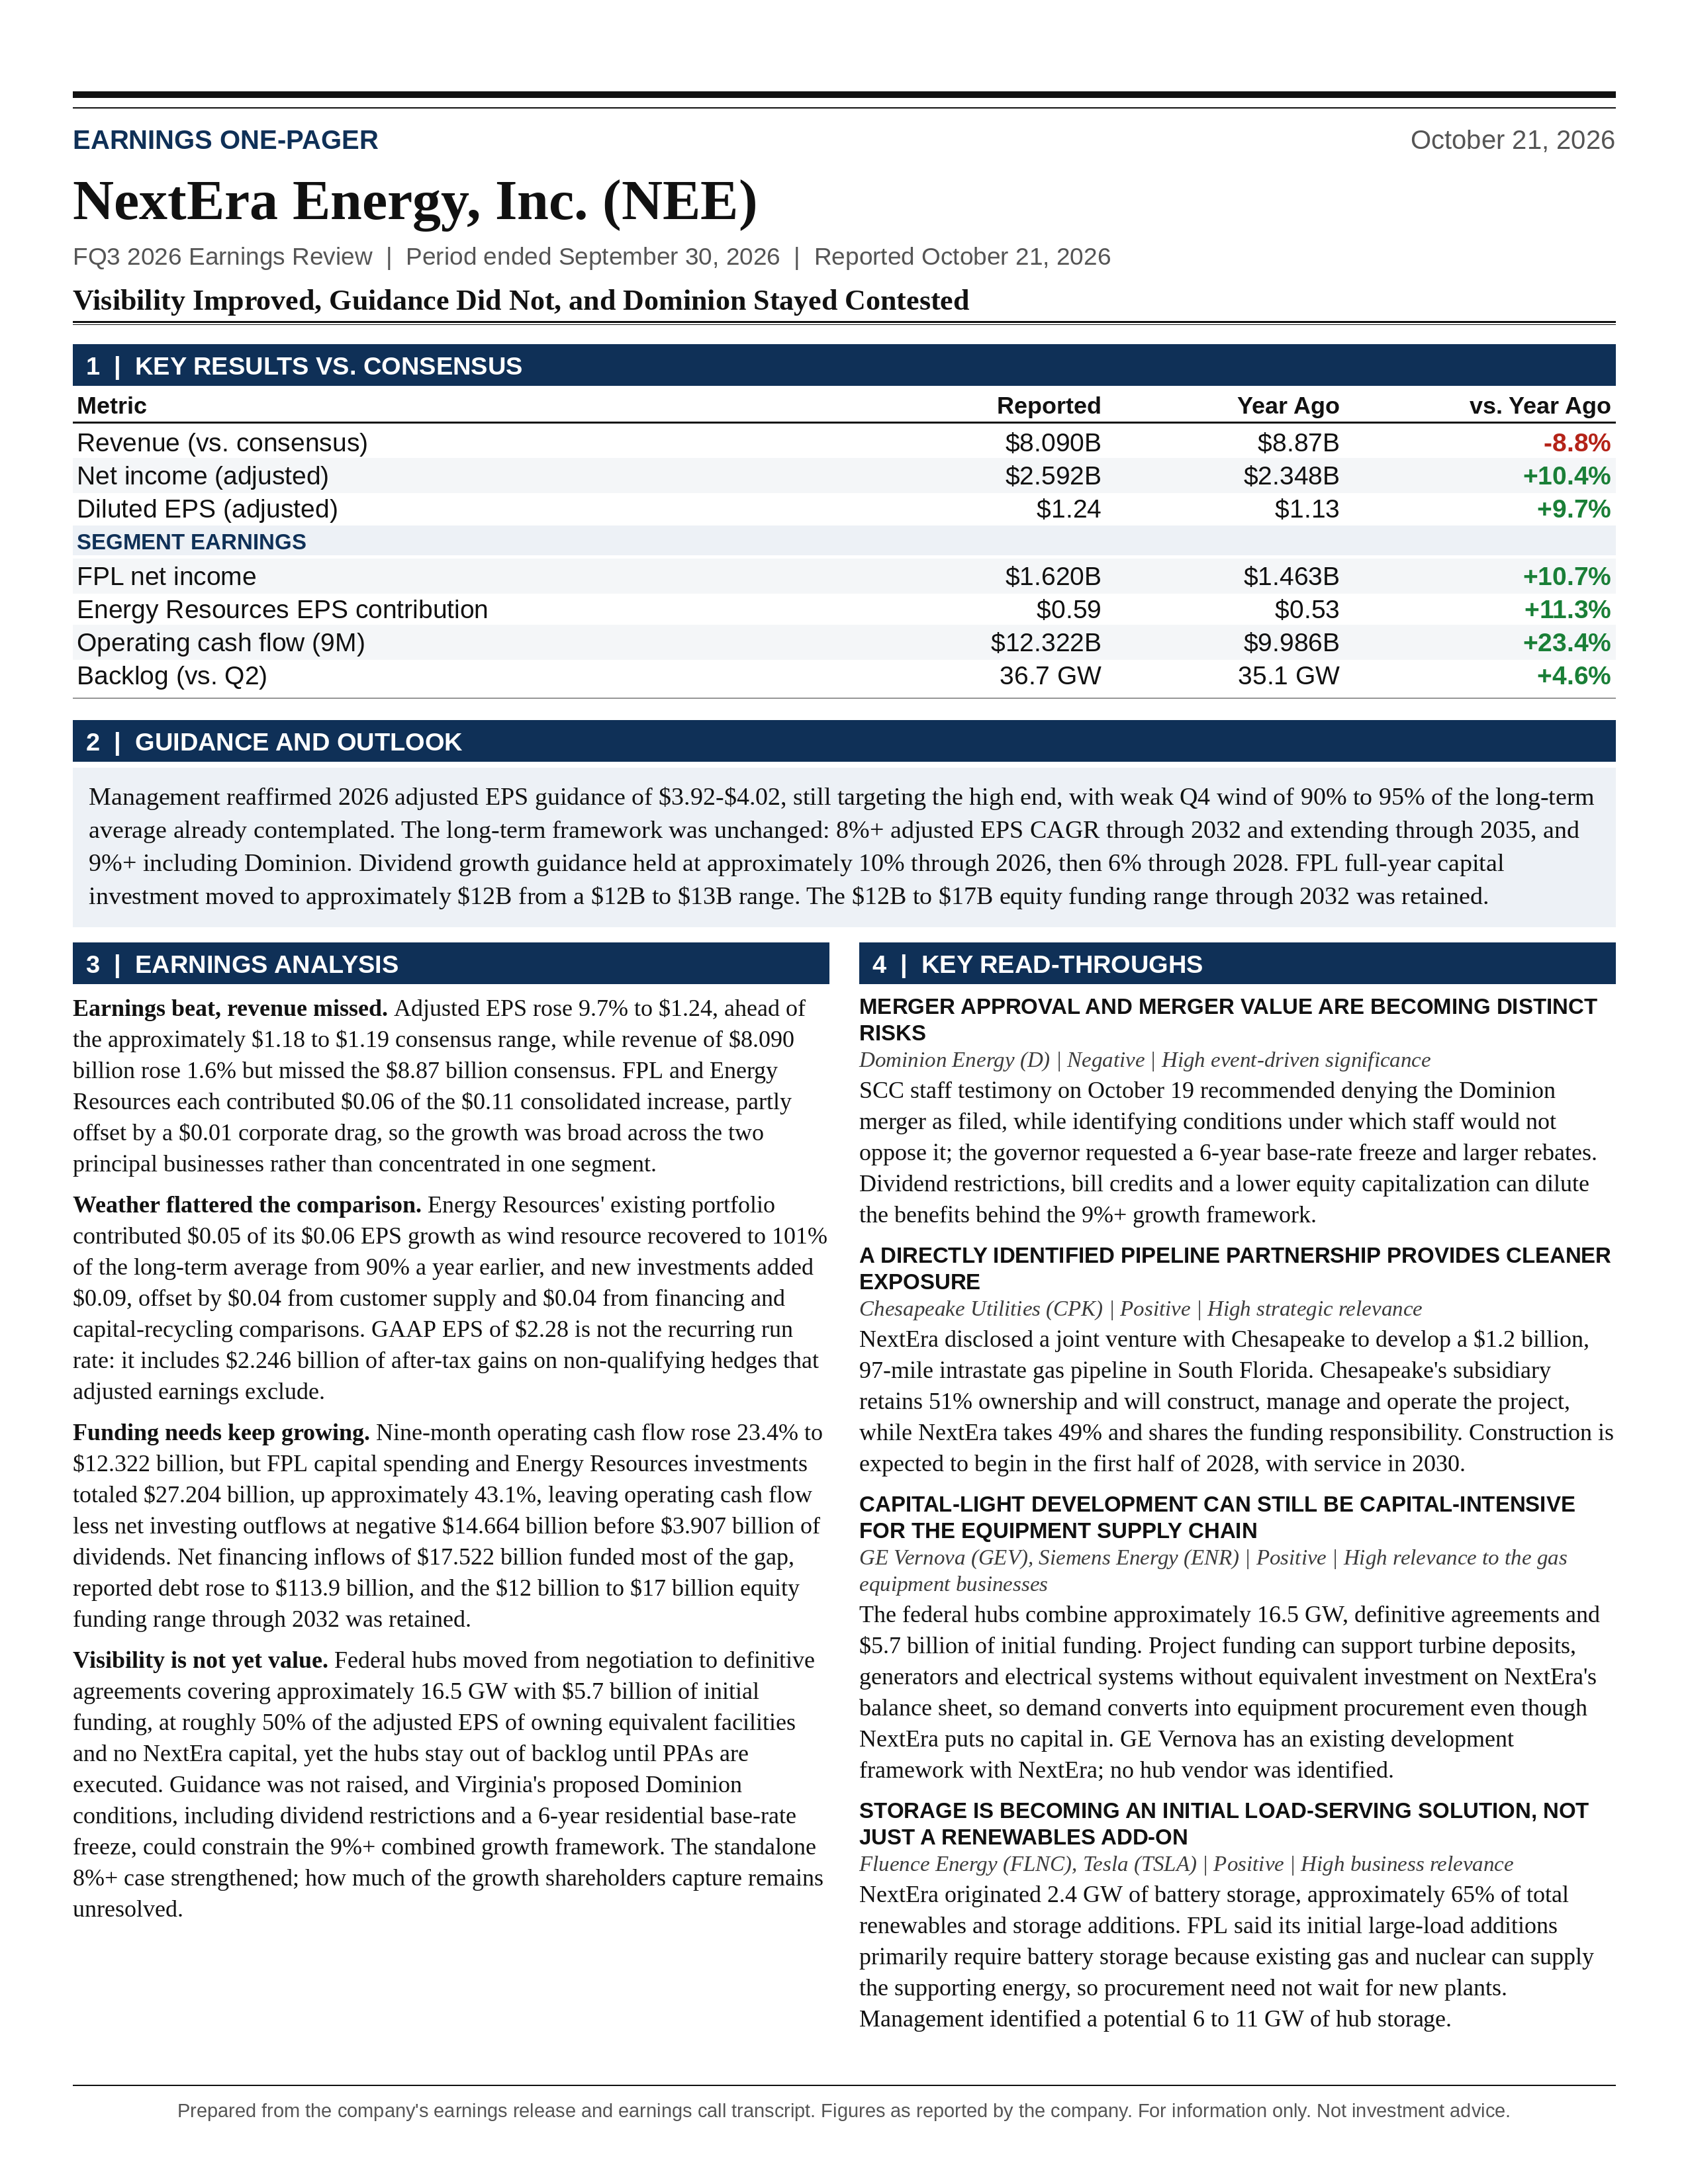
NextEra Energy, Inc. (NEE) FQ3 2026 earnings: Visibility Improved, Guidance Did Not, and Dominion Stayed Contested. Full earnings analysis, key read-throughs, and the one-page exhibit from Atlas Peak Research.
NextEra Energy, Inc. (NEE)
Sector: Utilities · FQ3 2026 · Period end September 30, 2026 · Reported October 21, 2026
NextEra Energy’s Q3 2026 results support a Hold recommendation with a constructive assessment of the underlying business, but not an unconditional upgrade based on the call.
Download the one-page report (PDF)
View one-page exhibit
Download analysis (.md)
Download read-throughs (.md)
Post to X
One-Page Exhibit
Earnings Analysis
EXECUTIVE CALL SUMMARY: NextEra Energy, Inc. (10/21/26)
NextEra Energy’s Q3 2026 results support a Hold recommendation with a constructive assessment of the underlying business, but not an unconditional upgrade based on the call. Adjusted EPS increased 9.7% to $1.24, FPL continued to compound its regulated investment base, and Energy Resources advanced a potentially attractive capital-light natural gas development model. The principal investment distinction is between improving execution visibility and higher earnings guidance. Execution visibility improved materially, particularly for federally sponsored generation hubs. Consolidated earnings guidance did not increase, the targeted high end of the 2026 range was already the stated objective in Q2, and the Dominion combination faces substantive regulatory objections that management’s optimistic commentary did not resolve.
The strongest incremental development was the transition of federal hub opportunities from negotiations into definitive development, construction and operating agreements. The 3 projects encompass approximately 16.5 GW and have secured $5.7 billion of initial funding. Management expects the fee structure to produce approximately 50% of the adjusted EPS associated with owning equivalent facilities during their initial 20 years of operation, without NextEra supplying project investment capital. This could materially improve capital efficiency and reduce reliance on asset monetizations. However, the projects are not equivalent to fully contracted operating assets. Power purchase agreement solicitations, permitting and construction remain in progress, and the company’s development presentation explicitly excludes federal hubs from its backlog until PPAs are executed.
The quarterly earnings result was solid but benefited from a favorable wind comparison. Energy Resources’ wind resource recovered to 101% of its long-term average from 90% in Q3 2025. Its existing energy portfolio contributed $0.05 of incremental EPS, primarily reflecting that recovery, compared with $0.06 of total segment EPS growth. New investments contributed another $0.09, offset by weaker customer supply results and financing and capital-recycling comparisons. The result therefore reflects both genuine asset growth and normalization of a depressed comparison period, rather than an unqualified acceleration in underlying profitability.
The most important offset is the increasingly explicit conflict between the Dominion transaction’s financing rationale and Virginia’s proposed customer protections. The Virginia State Corporation Commission staff’s October 19 testimony recommends denying the transaction as proposed, while identifying conditions under which staff would not oppose approval. Separately, the governor’s office requested a 6-year residential base-rate freeze, larger bill credits and a lower regulated equity capitalization. These are not final commission decisions, but they potentially affect cash upstreaming, allowed earnings, operating flexibility and the financing benefits embedded in the merger thesis.
The investment implication is that NextEra’s standalone growth proposition remains credible, while the incremental value of the Dominion transaction and federal hubs requires differentiated treatment. FPL’s regulated earnings and contracted operating assets warrant substantially greater confidence than unsigned large-load opportunities, uncontracted federal hub capacity or advanced nuclear development options. The call strengthened the case for durable earnings growth, but left important questions about shareholder capture of that growth unresolved.
OBSERVATION: REPORTED PERFORMANCE AND EARNINGS QUALITY
The October 21 financial release reported adjusted earnings of $2.592 billion, compared with $2.348 billion in Q3 2025, an increase of 10.4%. Adjusted EPS increased from $1.13 to $1.24. Against Q3 2024 adjusted EPS of $1.03, the latest result represents cumulative growth of 20.4% and an approximately 9.7% annualized growth rate over 2 years. This is consistent execution rather than a sudden change in the earnings trajectory.
Publicly reported consensus snapshots placed adjusted EPS expectations at approximately $1.18-$1.19, implying a $0.05-$0.06 beat. The variation between providers argues against overemphasizing the exact surprise percentage. Revenue of $8.090 billion increased 1.6% from $7.966 billion but was below the $8.87 billion consensus quoted by Investing.com. Revenue is a less informative standalone performance measure for this business than regulated capital growth, adjusted earnings and cash generation because fuel recovery, commodity exposures and derivative accounting can materially affect reported sales. The revenue shortfall should not be interpreted as evidence of an equivalent deterioration in electricity demand or project economics.
FPL contributed $0.77 of EPS, compared with $0.71, while Energy Resources contributed adjusted EPS of $0.59, compared with $0.53. Corporate and Other reduced adjusted EPS by $0.12, compared with $0.11. The consolidated $0.11 increase therefore comprised equal $0.06 contributions from the 2 principal businesses, partially offset by a $0.01 corporate drag. The breadth of the increase is favorable, although the sources of earnings growth differ materially between regulated investment returns at FPL and asset additions, resource variability and timing effects at Energy Resources.
GAAP EPS increased from $1.18 to $2.28, but that much larger increase is not representative of recurring earnings growth. The financial release identifies $2.246 billion of after-tax gains associated with non-qualifying hedges that were excluded from adjusted earnings. After other adjustments, the difference between GAAP and adjusted net income was $2.183 billion. These gains should not be capitalized as recurring utility or development earnings. Conversely, their exclusion does not make the associated hedging program economically irrelevant, since it protects financing economics and can create cash collateral and settlement effects that differ from accounting recognition.
Through September, adjusted EPS reached $3.47, compared with $3.17, an increase of 9.5%. Adjusted earnings increased from $6.549 billion to $7.274 billion. Diluted weighted-average shares increased from approximately 2.064 billion to 2.094 billion over the same period. Continued capital issuance is therefore already visible in the difference between aggregate earnings growth and per-share growth. Investment returns must continue to exceed the combined burden of financing costs and dilution for the development program to translate into durable shareholder value.
GUIDANCE: REAFFIRMATION RATHER THAN AN UPGRADE
Management reiterated 2026 adjusted EPS guidance of $3.92-$4.02 and continued to target the high end. Mike Dunne stated, “Our 2026 adjusted earnings per share expectations range of $3.92-$4.02 remains unchanged, and we are targeting the high end of that range.” The Q2 prepared remarks used the same range and the same high-end positioning. Consequently, the latest commentary represents confirmation of an existing objective, not a new upward revision.
Relative to the 2025 adjusted EPS base of $3.71, the annual range implies growth of approximately 5.7%-8.4%. With $3.47 already earned through September, the range implies approximately $0.45-$0.55 of Q4 adjusted EPS. The comparable residual for Q4 2025 is approximately $0.54, calculated from annual EPS of $3.71 less 9-month EPS of $3.17. Subject to rounding, reaching the high end requires only approximately 1.9% Q4 growth. The low end would imply a meaningful decline.
This arithmetic explains why the strong year-to-date performance did not automatically produce a guidance increase. Management explicitly expects Q4 wind generation at 90%-95% of the long-term average because of El Niño. Ketchum stated, “So we expect to be at the high end of our range despite those impacts.” The important underwriting point is that weak wind is already contemplated in the high-end objective. A subsequent shortfall attributed to wind within that disclosed range would therefore require additional explanation. Wind materially below the range, project delays or other unanticipated offsets would represent different circumstances.
The standalone long-term framework also remained unchanged: 8%+ adjusted EPS CAGR through 2032, with the same growth target extending through 2035, measured from the 2025 base. The combination with Dominion is expected to support 9%+ growth. Those are distinct frameworks and should not be blended into an unconditional corporate forecast before the transaction closes on acceptable terms.
At exactly 8% growth, the $3.71 base produces approximately $4.67 in 2028, $6.36 in 2032 and $8.01 in 2035. At exactly 9%, the corresponding figures are approximately $4.80, $6.78 and $8.78. These are mechanical illustrations, not company-issued annual EPS targets. They show that the additional 1 percentage point of compounded growth represents approximately $0.42 of annual EPS by 2032 and $0.77 by 2035. That is meaningful, but it must be evaluated against transaction concessions, integration demands and any increase in financial constraints.
Dividend guidance was also unchanged: approximately 10% annual growth through 2026 from a 2024 base, followed by 6% annual growth from year-end 2026 through 2028. Dividend growth below the expected EPS growth rate should gradually improve earnings retention. It does not eliminate the need for external financing, given the scale of investment.
FPL: STRONG REGULATED EXECUTION WITH A MODEST CAPITAL SPENDING RESET
FPL’s net income increased 10.7% to $1.620 billion from $1.463 billion. Regulatory capital employed increased approximately 9.2%, with the presentation showing approximately $81.1 billion versus $74.2 billion. This metric includes more than conventional retail rate base, including specified clause-related investments and construction-related items, and excludes accumulated deferred income taxes. It should not be treated as interchangeable with a single reported rate-base measure.
The EPS bridge is straightforward. New investments contributed $0.05 of growth, while other items, including dilution, contributed $0.01. The presentation identifies the increase in retail ROE from 11.7% to 11.8% as the principal driver of the latter category. The earnings increase is therefore predominantly investment-driven, with a smaller benefit from the earned return. Extrapolating that ROE benefit indefinitely would be inappropriate.
Quarterly capital expenditures were approximately $2.4 billion, compared with approximately $2.8 billion in Q2. More importantly, full-year capital investment expectations moved from $12 billion-$13 billion in the Q2 call to approximately $12 billion in Q3. The latest expectation is at the bottom of the previous range and approximately 4% below its midpoint. Management did not provide a detailed reconciliation between project timing, procurement savings and any change in scope.
The capital spending adjustment is not sufficient evidence of deterioration. Regulatory capital growth remained close to Q2’s 9.3%, and earnings delivery remained strong. Nevertheless, it is a genuine change in guidance and should be distinguished from the broadly positive execution narrative. With $8.160 billion of FPL capital expenditures reported through September, approximately $3.84 billion remains to reach the full-year target, subject to differences in classification and rounding. Q4 spending therefore needs to be materially above Q3.
Retail sales increased 2.8%, consisting of approximately 1.4% from customer growth and mix and 1.4% from weather. Underlying usage and other changes were approximately flat. Weather-normalized growth of 1.4% improved from approximately 0.6% in Q2, although these are separate year-over-year comparisons rather than sequential consumption growth rates. FPL added approximately 86,400 average customer accounts versus the prior-year quarter. The evidence supports sustained demographic growth, but not yet a material realized contribution from the large-load opportunities discussed on the call.
The rate stabilization mechanism requires careful interpretation. Management reported a $172 million reversal and an after-tax balance of approximately $1.5 billion, compared with approximately $1.3 billion at Q2. The reported balance increased rather than declined. The quarter should therefore not be characterized as earnings growth achieved by depleting that balance. At the same time, the mechanism remains a regulatory accounting tool rather than unrestricted cash or an independent source of economic profit. Its significance lies in flexibility within the rate framework and the durability of future earned returns.
FPL’s affordability comparisons support its regulatory positioning but require appropriate normalization. The typical residential bill was described as 37% below the national average, compared with approximately 30% in the Q2 remarks. The presentation notes that comparison utilities’ bills can have different effective dates. The widening relative discount should not be treated as a 7 percentage point reduction in FPL’s own bill. Similarly, the historical claim that bills are approximately 20% lower than 20 years earlier was explicitly expressed in real dollars in the Q2 materials, even though that qualification was omitted in part of the latest Q&A.
Hurricane Isaias is primarily a Q4 event rather than an explanation of Q3 financial performance. The presentation dates landfall to October 9 and identifies approximately 435,000 affected customers. Management’s restoration and hardening statistics are operationally encouraging, including no failures of hardened poles and approximately 140,000 avoided outages. However, no restoration cost estimate, recovery schedule or residual shareholder exposure was quantified. Grid resilience reduces expected disruption and can support future investment authorization, but does not eliminate storm-related cash requirements, regulatory recovery timing or affordability pressures.
FPL LARGE LOAD: HIGH INTEREST, BUT NO CONTRACTED INFLECTION YET
FPL reiterated its expectation for 8 GW of large load by 2032, up from the original 6 GW. That 33% increase was announced in May and was already incorporated into Q2 commentary. It is not a Q3 guidance increase. The company also reiterated its objective of announcing a transaction by year-end.
The Q2 remarks provided approximately 21 GW of interest, including 12 GW in advanced discussions, with a portion potentially served as early as 2028. The latest call cited more than 20 GW of interest but did not provide a new advanced-stage breakdown or disclose a signed customer. The pipeline remains substantial, but the call did not establish that conversion had accelerated.
Scott Bores explained that the initial large-load additions can be served primarily through battery storage supported by FPL’s existing gas and nuclear fleet. This offers an important near-term advantage because the initial development phase is less dependent on obtaining new gas turbines. It does not imply that storage alone creates sufficient energy for continuous data center demand. Charging energy, network capability, reserve margins, outages and the required load shape remain central to the service proposition.
The Q2 remarks indicated that each initial GW of large load could correspond to approximately $2 billion of capital investment earning the same ROE as other FPL investments. Applied mechanically to 8 GW, that suggests approximately $16 billion of associated investment opportunity. This is a scale illustration, not a newly announced capital budget, and the initial economics may not apply uniformly to later projects. It also should not be added wholesale to existing investment forecasts without checking what is already embedded.
The year-end announcement is therefore a meaningful catalyst, but its informational value will depend on more than nameplate demand. The critical terms include committed minimum demand, ramp timing, duration, termination payments, collateral and responsibility for dedicated infrastructure. Management declined to disclose whether the first transaction would involve several hundred MW or approximately 1 GW. Until those details are available, the 8 GW target remains a development expectation rather than an earnings entitlement.
ENERGY RESOURCES: ASSET GROWTH OFFSET BY TIMING AND FINANCING PRESSURES
Energy Resources’ adjusted earnings increased 13.2% to $1.247 billion, while adjusted EPS increased from $0.53 to $0.59. The approximately 13% earnings growth rate was below Q2’s approximately 18%, but the quarterly comparisons differ materially and do not establish a deterioration in project returns.
The $0.09 contribution from new investments matched the Q2 contribution, now including initial federal hub fees. Existing energy assets contributed $0.05, primarily reflecting the recovery in wind resource. Customer supply reduced EPS by $0.04, while other items reduced EPS by $0.04, principally because of interest expense and the timing of prior-year capital recycling. The existing portfolio improvement equaled approximately 83% of the segment’s net EPS increase, illustrating how strongly the final result depended on offsets. It would be equally misleading to characterize all growth as weather-driven or to ignore the wind recovery entirely.
Wind resource at 101% of its long-term average was not exceptionally strong in absolute terms. The favorable comparison came principally from the weak 90% prior-year level. That distinction matters for forecasting: the quarter does not require an assumption of persistently above-normal wind to be sustainable, but the year-over-year recovery benefit should not recur automatically.
The reporting changes also affect comparability. Gas and peaking generation move into existing energy assets, regulated electric and gas transmission receive a separate category, and federal hub fees move from new investments to existing assets after 12 months of fee recognition. Consequently, growth in the existing asset category can eventually include development-related fees from projects that have not yet entered full operation. This is not inherently problematic accounting, but it reduces the usefulness of category labels as proxies for operating maturity.
BACKLOG: STRONG TOTAL GROWTH, WITH MORE ADDITIONS WEIGHTED TOWARD LATER YEARS
Energy Resources added approximately 3.7 GW to backlog, consisting of 2.4 GW of storage, 0.7 GW of wind and 0.6 GW of solar. This compares with Q2 additions of 3.6 GW, comprising 2.0 GW of storage, 0.7 GW of wind and 0.9 GW of solar. Storage represented approximately 65% of Q3 additions, versus approximately 56% in Q2. Total origination remained strong, but the incremental growth was concentrated in storage rather than evenly distributed across technologies.
The presentation provides an important reconciliation absent from the spoken remarks: approximately 0.3 GW was removed from backlog. The bridge is approximately 35.1 GW at Q2, plus 3.7 GW of additions, less 1.8 GW entering service and less 0.3 GW removed, producing 36.7 GW. Removals were below Q2’s approximately 0.4 GW. This is not evidence of a cancellation surge, but it demonstrates why gross additions and backlog growth are different metrics.
The backlog definition also deserves attention. It includes signed long-term PPAs and build-own-transfer projects, but also assets with expected long-term agreements, including power hedges or environmental attribute sales. It should not be described indiscriminately as fully executed PPA capacity. Project-level contracting status, financing and construction readiness remain relevant within the aggregate.
The 2026-2029 development range remains 44.6-61.6 GW, with a midpoint of 53.1 GW. Approximately 35.5 GW is represented by projects already in commercial operation or in backlog for those years, leaving 17.6 GW to reach the midpoint. This equates to approximately 66.9% coverage, consistent with management’s description of more than 2/3. The remaining requirement declined from 18.6 GW in Q2, an improvement of only 1.0 GW despite 3.7 GW of gross additions.
The explanation is timing. The 2026-2027 commercial operation and backlog total increased from 21.4 GW to 21.6 GW, while the 2028-2029 backlog increased from 13.1 GW to 13.9 GW. The 2030-2032 backlog increased much more sharply, from 2.1 GW to 4.5 GW. The quarter therefore strengthened longer-duration visibility more than near-term coverage. It would be incorrect to apply the entire 3.7 GW addition against the remaining 2026-2029 requirement.
The solar mix makes this distinction particularly important. Solar backlog for 2028-2029 declined from 5.3 GW to 4.8 GW, while 2030-2032 solar backlog increased from 1.0 GW to 2.0 GW. The disclosed figures do not establish exactly how much reflects rescheduling versus new origination and removals, but they confirm that the intermediate-period solar backlog weakened. Against the 2028-2029 solar development midpoint of 13 GW, approximately 8.2 GW still needs to be secured. Comparable midpoint gaps are approximately 6.4 GW for storage and 1.1 GW for wind.
Brian Bolster’s comment that customer focus should shift back toward energy products in coming quarters is therefore an important forecast rather than a demonstrated outcome. Solar origination and the 2028-2029 solar backlog are useful tests of that assertion. Continued strength in storage cannot indefinitely substitute for every missing solar project because capital intensity, energy production, tax attributes and earnings profiles differ.
FEDERAL HUBS: SUBSTANTIAL CAPITAL-EFFICIENCY POTENTIAL, WITH CONTRACTING STILL INCOMPLETE
The federal hubs are the clearest strategic advance relative to Q2. At that time, management was advancing up to 9.5 GW of Texas and Pennsylvania gas projects while definitive agreements with the U.S. and Japanese governments remained incomplete. The August announcement finalized agreements for up to 10 GW and released $3.3 billion of initial funding. The September Project Star announcement added approximately 6.47 GW in Texas under a U.S.-Korean structure. The Q3 call consolidated these into approximately 16.5 GW and $5.7 billion of initial funding.
Ketchum stated, “While we do not put any capital into the projects,” before describing the approximately 50% earnings equivalence. This is the essential economic attraction. NextEra can monetize development expertise, procurement, construction management and operating capabilities without bearing the same project investment requirement as an owner. If contractual protections are robust, a lower absolute earnings stream can produce superior capital efficiency and preserve financing capacity for other opportunities.
However, 50% of ownership EPS is not the same as 50% of asset value. The fee stream’s present value depends on timing, duration, margins, escalation and performance conditions. Ownership may provide residual value beyond the initial 20-year operating period, while development and construction fees can begin earlier. The comparison is useful as an earnings shorthand, not as a substitute for valuing the actual contracts.
The presentation translates federal hubs into approximately 8 GW of ownership-equivalent adjusted EPS, near the top of the existing 4-8 GW gas development range through 2032. Adding the potential 2 GW of owned gas generation at Paducah produces approximately 10 GW on that earnings-equivalent framework. This is stronger evidence of opportunity coverage, but neither the federal hubs nor Paducah should be treated as fully de-risked operating capacity.
The decisive qualification is in the backlog footnote: federal hub projects enter backlog only upon execution of PPAs and are then counted at 50% of nameplate capacity. The current development table still shows no gas backlog. Definitive government-related development agreements and initial funding therefore do not establish that end-customer power contracts are complete. Management is advancing construction and PPA solicitation in parallel, accelerating potential delivery while retaining exposure to commercial alignment.
The $5.7 billion is initial project funding, not NextEra revenue, earnings or unrestricted corporate liquidity. The September announcement described Project Star alone as a $22.3 billion energy infrastructure campus. The scale of that project reinforces that initial funding is a development milestone rather than confirmation that the entire multi-project financing requirement has been irrevocably satisfied.
The earnings ramp is also more gradual than the headline capacity might suggest. Management described 2026 and 2027 payments as “relatively modest,” with contributions increasing as development progresses and operating fees becoming more important toward 2032. Initial load service is expected in 2028-2029, with full campus requirements ramping through 2030-2032. The call therefore does not support an immediate, large rebasing of near-term EPS.
Capital-light does not mean risk-free. Relevant exposures include performance guarantees, delay penalties, fee cancellation, unreimbursed costs, liability caps, turbine delivery, gas transportation, environmental permitting and counterparties’ willingness to complete the campuses. The call did not quantify these terms. Moreover, the federal sponsorship and trade-agreement structures create policy and execution dependencies even though NextEra’s overall portfolio is diversified.
STORAGE AND SOLAR: ATTRACTIVE DEMAND, DIFFERENT ECONOMIC FUNCTIONS
Storage continues to be the strongest origination product. Existing sites, interconnection positions and customer relationships can reduce development friction for co-located projects. Extending storage duration can also increase the value of an existing site without replicating every element of greenfield development.
The potential 6-11 GW of storage associated with federal hubs represents approximately 15%-30% upside to the existing 32-43 GW development expectation through 2032. The presentation expresses the opportunity on a 4-hour-equivalent basis. That distinction matters because moving from 4-hour to 8-hour duration can increase energy capacity without a proportionate increase in power capacity. GW comparisons alone are insufficient for evaluating capital requirements or contracted value.
This storage opportunity also changes the financing picture. Federal gas projects may require no NextEra investment capital, but batteries that NextEra builds and owns do require funding. The gas fee model creates financial capacity; exercising adjacent ownership opportunities consumes some of it. The potential storage upside cannot be treated as costless incremental EPS.
On solar, management emphasized competitiveness and supply-chain scale but did not quantify current PPA prices, project returns or the proportion of equipment and tariff inflation contractually recoverable. The Q2 materials disclosed solar panels and competitively priced domestic battery supply secured through 2029, providing a more concrete basis for confidence than the latest qualitative comments alone.
The interest-rate discussion supports an ability to reprice new contracts, not a universal right to reopen existing fixed-price PPAs. Dunne stated that rates are locked when PPAs are signed. Bolster added, “We were never the low-cost bidder in the market,” arguing that financing pressure could eliminate thinner-margin competitors. These statements are compatible if customers pay a premium for execution certainty and lower risk-adjusted delivered cost. They do not establish that nominal bids are always cheapest or that higher required returns automatically translate into realized margin expansion.
TRANSMISSION: A LARGE GROWTH RUNWAY THAT STILL REQUIRES EXECUTION
Regulatory and invested capital plus secured capital expenditures across electric and gas transmission increased approximately 25% from roughly $10 billion in December 2025 to $12.7 billion. This is an encouraging expansion of the opportunity set, but the measure combines operating investments and secured future spending. It is not equivalent to a 25% increase in current earning rate base.
Management reiterated approximately 20%-25% rate-base growth expectations through 2032 and identified gas transmission as the most promising source of additional upside. Dedicated gas generation for large loads creates demand for transportation, compression, supply reliability and associated infrastructure. The opportunity follows directly from the generation strategy, but project economics still depend on binding transportation commitments, cost allocation and permitting.
The $1.2 billion South Florida pipeline joint venture with Chesapeake Utilities is tangible evidence of this expansion. The call did not provide enough information to assign the entire project cost to NextEra’s investment requirement or infer its eventual earnings contribution. Similarly, the Q2 materials specified a 43% ownership interest in the approximately $1.6 billion Illinois transmission projects. Gross project values should not be treated as attributable capital.
Bolster’s reference to a potential “$50 billion type utility” within Energy Resources was a valuation-scale analogy based on the eventual business, not a statement that the company already has $50 billion of transmission rate base. The relevant investment question is how much capital reaches service, at what allowed return and with what financing burden.
NUCLEAR AND RECONTRACTING: HIGHER VISIBILITY, WITH LONG-DATED CASH BENEFITS
Duane Arnold remains targeted to restart no later than Q1 2029. Closing the Department of Energy loan for up to $1.9 billion is a meaningful financing milestone, following the prior quarter’s generating certificate and acquisition of the remaining minority ownership. The loan is not a grant and does not demonstrate that total restart costs are capped at $1.9 billion. Licensing, equipment restoration, staffing, commissioning and budget adherence remain important execution variables.
The Point Beach agreement improves long-term revenue visibility but is not a plant expansion. Bolster explicitly corrected the analyst’s terminology: “This is not an upgrade.” Existing contracts expire in 2031-2033, after which the new 20-year agreement takes effect, subject to Wisconsin regulatory approval. There should be no material near-term earnings acceleration attributed solely to signing this contract.
Ketchum described Point Beach’s expected contribution under the new contract as approximately $0.21 of EPS on average. That is an overall contribution, not a disclosed $0.21 increase over the existing earnings base. Adding the entire amount to a model that already includes Point Beach would overstate the benefit. The incremental value depends on the current contribution, contract transition schedule, operating costs and future capital requirements.
Renewables recontracting is more immediately useful as evidence of pricing power. Nearly 1.4 GW has been recontracted year to date at an average premium of approximately $20/MWh over recent realized pricing. At illustrative capacity factors of 30%-40%, that premium corresponds to approximately $74 million-$98 million of annual gross revenue once fully effective. This is not an earnings estimate. Ownership interests, contract start dates, operating costs, reinvestment and taxes determine the shareholder contribution.
The approximately 6 GW of SMR co-location opportunities remains option value rather than contracted backlog. Management’s requirement for risk-sharing is appropriate. Bolster emphasized the need to know “where we are going to be able to draw the line from a capital perspective.” The willingness to consider larger reactors if customer needs and protections justify them demonstrates flexibility, but no disclosed commercial structure supports assigning material near-term EPS to new nuclear construction.
CASH FLOW AND FUNDING: IMPROVEMENT IN OPERATING CASH, BUT INVESTMENT IS GROWING FASTER
The financial release provides an important counterweight to the capital-light narrative. Nine-month operating cash flow increased 23.4% to $12.322 billion from $9.986 billion. This exceeds adjusted EPS growth and is consistent with management’s objective for operating cash flow growth to match or exceed earnings growth over the longer term.
The cash improvement is not purely a reflection of recurring operating expansion. Deferred taxes, working-capital movements, cost-recovery activity and lower storm-related cash outflows affect the comparison. For example, the deferred tax reconciliation was a $1.699 billion source in 2026 versus a $460 million use in 2025, while changes in current liabilities contributed $1.665 billion versus $806 million. These figures should not be treated as isolated explanations of total cash growth, but they demonstrate that timing matters.
Investment requirements increased more rapidly. FPL capital expenditures and Energy Resources’ independent power and other investments totaled $27.204 billion through September, compared with $19.012 billion, an increase of approximately 43.1%. Operating cash flow less those 2 investment categories was approximately negative $14.9 billion, before nuclear fuel purchases, other capital expenditures and dividends. Energy Resources’ investment line is broader than pure maintenance or growth capital expenditure, but the financing implication is clear.
Using the complete cash flow statement, operating cash flow less net investing cash outflows was negative $14.664 billion. After $3.907 billion of common dividends, the deficit was approximately $18.6 billion before financing. Net financing inflows of $17.522 billion funded most of that requirement. This is consistent with a capital-intensive growth phase, but it means capital-market access remains central to execution.
Reported debt, calculated as commercial paper, other short-term debt, current long-term debt and noncurrent long-term debt, increased from approximately $95.6 billion at year-end to $113.9 billion at September 30. After reported cash, the corresponding simple net-debt measure increased from approximately $92.8 billion to $108.4 billion. These are not rating-agency-adjusted leverage measures and do not by themselves demonstrate credit deterioration. They nevertheless show that capital-light federal opportunities have not yet changed the broader company’s substantial funding intensity.
Management retained the $12 billion-$17 billion equity funding range through 2032. That unchanged guidance is important: the federal hub structure did not produce an announced reduction in aggregate equity needs. Geographic diversification of debt issuance, tax equity relationships and potential partnerships with large asset managers increase available funding channels, but do not eliminate their economic cost. Minority investments and structured financing can preserve common equity issuance capacity while transferring future cash flows or imposing preferred claims.
Capital recycling may provide incremental flexibility. Dunne stated that the business does “not rely on capital recycling to meet equity needs” and indicated a preference to retain more assets unless outside buyers offer superior value. The relevant management figure was $7 billion-$12 billion of capital recycling, not the GW figure used in the analyst’s question. Retaining assets can increase future earnings, but also retains their funding burden and eliminates associated sale proceeds. The call did not quantify a revised sale schedule or incremental retained earnings, so the change remains optionality rather than an explicit guidance increase.
INTEREST RATES: PROTECTED EARNINGS DO NOT ELIMINATE VALUATION SENSITIVITY
The forward-starting interest-rate hedge program increased to more than $48 billion from more than $46 billion discussed in Q2. Management cited an average rate of approximately 4%, an average tenor of approximately 9 years and an overall debt maturity of approximately 15 years. These characteristics reduce the risk that financing markets move adversely between PPA execution and project funding.
The disclosed 2028 EPS sensitivity of $0.01-$0.03 to a 50-basis-point rate move is modest. However, the approximately 4% hedge rate is not necessarily the all-in borrowing cost. Credit spreads, issuance expenses, currency arrangements and other financing terms remain relevant. Hedges also do not remove counterparty, collateral or refinancing-access risks.
Most importantly, low near-term accounting EPS sensitivity is not the same as low equity-duration sensitivity. Higher discount rates can reduce the present value of long-dated hub fees, nuclear recontracting benefits and regulated investment growth even when projected EPS is largely protected. Higher financing costs can also affect customer affordability, project competitiveness and the proceeds obtainable from asset recycling.
DOMINION: REGULATORY CONDITIONS NOW MATTER MORE THAN STRATEGIC RHETORIC
The transaction progressed procedurally. Both shareholder groups approved it on September 3. Virginia and South Carolina hearings are scheduled for November and December, with management expecting orders in January 2027. North Carolina expert hearings begin in February 2027. Closing remains expected in the second half of 2027, unchanged from Q2.
The September Virginia package expanded customer and community commitments, including extending residential bill credits from 2 years to 4 years, adding $100 million to customer assistance, providing $100 million for workforce development and establishing up to $5 billion of supplier spending commitments over 5 years. These items should not be aggregated indiscriminately as incremental shareholder expense. Supplier spending includes procurement that could otherwise occur, while bill credits and explicitly shareholder-funded programs have different economic consequences.
The primary regulatory documents reveal a more demanding situation than a routine negotiation over incremental benefits. In its October 19 testimony in case PUR-2026-00112, SCC staff concluded that the applicants had not demonstrated that adequate service at just and reasonable rates would not be impaired or jeopardized. Staff focused on exposure to NextEra’s competitive businesses and whether Dominion Energy Virginia would retain sufficient resources and independence.
Staff’s proposed safeguards include an independent utility board, a bankruptcy-remote parent entity and restrictions on utility dividends. Staff also proposed 10-year workforce and operating-location protections, exceeding the 5-year headcount commitment highlighted by management. These conditions could constrain cash upstreaming and operating flexibility, potentially reducing the financing and efficiency benefits used to justify the transaction. Importantly, staff also stated that it would not oppose approval if the additional requirements were implemented. The filing therefore describes a conditional path to approval, not an irrevocable rejection.
The governor’s office proposed a different and potentially more direct earnings constraint. Its October 19 release requested a 6-year freeze in residential base rates, a $29 monthly rebate for 4 years and an increase in the debt share of Dominion’s regulated capital structure from 48% to 60%. The base-rate distinction matters: this is not necessarily a freeze in every component of the customer bill.
At unchanged rate base and ROE, reducing the equity component from 52% to 40% would mechanically reduce the equity capital earning the allowed return by approximately 23%. That is not a forecast of a 23% reduction in Dominion or combined-company EPS, because debt costs, financing needs, rate design and implementation would also change. It illustrates, however, that the proposal affects fundamental earnings economics rather than merely administrative conditions.
Ketchum acknowledged that approval is for the SCC to decide and stated that there are “always opportunities for compromise on certain specific issues.” Management nevertheless did not quantify acceptable concessions, identify a minimum economic threshold for proceeding or reconcile the latest proposals with the 9%+ combined-company growth expectation. Repetition of affordability, jobs and clean-energy benefits did not answer the central financial question.
The proper analytical framework separates the probability of approval from the value of approval. A transaction can receive authorization but deliver less shareholder value than originally projected. Conversely, rejection would remove merger-related upside but would not automatically invalidate NextEra’s standalone 8%+ growth framework. Regulatory concessions should therefore be assessed for their effect on cash flows and capital requirements, not merely as progress toward closing.
IMPLICATION: WHAT THE CALL CHANGES IN THE INVESTMENT THESIS
The quarter improves confidence in execution across several distinct channels. FPL is delivering approximately 9% regulatory capital growth with strong customer additions. Energy Resources continues to originate more than 3.5 GW per quarter and move projects into service. Federal agreements provide a potentially scalable way to earn fees without matching ownership-level capital requirements. Recontracting is monetizing the value of existing sites and operating assets.
The call does not demonstrate that every opportunity is incremental to current expectations. FPL’s 8 GW target was raised previously. The 8%+ standalone and 9%+ combined EPS frameworks were already disclosed. The 30-hub pipeline and objective of reaching 40 by year-end were also present in Q2. Point Beach’s approximately $0.21 contribution had been discussed previously. Repetition of these figures should not be mistaken for a fresh upward revision.
The most defensible favorable valuation argument is that capital-light earnings can improve returns on invested capital and reduce dilution relative to an ownership-heavy development model. The most defensible unfavorable argument is that the market could capitalize the same projects multiple times through ownership-equivalent GW, large-load pipeline values, storage upside and a higher corporate growth multiple. A consistent model must distinguish fees from ownership earnings and exclude opportunities already embedded in the stated growth framework.
Technology diversification does not eliminate common risk factors. Renewables, storage, gas, nuclear and transmission all depend to varying degrees on customer credit, equipment availability, permitting, labor, capital markets and policy. The statement that the growth plan does not depend on any single technology is credible. It is not evidence that the plan is insensitive to a broad tightening in financing conditions or a slowdown in large-load demand.
The claim during the permitting discussion that power demand is expected to increase approximately 6-fold was not accompanied by a defined baseline, geography-adjusted metric or time horizon. It should not be incorporated literally into demand forecasts. Signed load commitments, actual consumption, deliverable capacity requirements and binding infrastructure contracts provide stronger evidence.
SCENARIOS AND VALUATION DISCIPLINE
A base case with a 50% probability assumes continued FPL execution, conversion of the existing development program, a gradual federal hub fee ramp and no material contribution from uncontracted SMRs. It also assumes that any Dominion approval is economically acceptable, while underwriting the business primarily to the standalone growth framework. An 8% CAGR from the 2025 EPS base produces approximately $6.36 in 2032. This case requires sustained funding access and project delivery but does not require every large-load opportunity to convert.
A bull case with a 25% probability assumes favorable Dominion approval, stronger customer contracting, timely federal hub commissioning and meaningful storage additions alongside the gas campuses. Illustrative EPS growth of 10% from the 2025 base produces approximately $7.23 in 2032. That exceeds the stated minimum growth framework and therefore requires actual incremental earnings capture, not simply continued announcements. The strongest confirming evidence would be executed PPAs, disclosed fee economics and rising earnings expectations without a disproportionate increase in equity funding.
A bear case with a 25% probability assumes a combination of project delays, weaker solar conversion, more expensive financing and either adverse merger conditions or failure to realize expected transaction benefits. Illustrative 5% EPS growth produces approximately $5.22 in 2032. Merger failure alone is insufficient to justify this outcome because the standalone plan remains intact; the bearish scenario requires additional pressure on execution or returns. These probabilities are judgmental analytical assumptions, not company guidance or statistically estimated outcomes.
The probability-weighted 2032 EPS under these assumptions is approximately $6.29. This is not a price target and does not incorporate dividends, discount rates or scenario-specific valuation multiples. Its purpose is to demonstrate that substantial upside opportunities coexist with an economically meaningful downside distribution.
Valuation sensitivity also argues against treating the incremental merger growth rate as sufficient justification for a large rerating. At exactly 8% growth, illustrative 2028 EPS is approximately $4.67. At exactly 9%, it is approximately $4.80. At the same illustrative 20x multiple, that difference is worth approximately $2.62 per share. A change of only 1x in the multiple applied to the standalone earnings figure is worth approximately $4.67 per share. These are valuation sensitivities rather than market price targets, but they show why regulatory quality and financing confidence can matter more than a modest change in the projected growth rate.
CATALYSTS AND THESIS INVALIDATION
The nearest operating catalyst is the promised FPL large-load announcement by year-end 2026. The strongest outcome would include a creditworthy counterparty, a material committed load, clear ramp dates and enforceable customer funding protections. An announcement with limited committed demand or predominantly optional future phases would provide less support for the 8 GW expectation.
The principal transaction catalysts are rebuttal testimony, the November Virginia hearing, the December South Carolina hearing and expected January 2027 state orders, followed by the North Carolina process. The key issue is not merely whether the transaction advances, but whether final conditions preserve the economics underlying the 9%+ growth framework.
Q4 results will test the credibility of the high-end 2026 EPS objective under the disclosed 90%-95% wind assumption. They will also clarify FPL’s capital spending, storm costs and reserve accounting. Subsequent quarters should establish whether solar origination recovers and whether the 2028-2029 backlog closes its remaining gap without excessive reliance on later-period additions.
Federal hub PPA execution is the most important milestone for converting strategic potential into underwritable earnings. Additional funding, permits, turbine commitments, construction progress and disclosure of contractual liability limits should follow. Duane Arnold’s restart milestones and Wisconsin approval of the Point Beach agreement are separate catalysts with different earnings timelines.
The favorable standalone thesis would weaken materially if 2026 EPS missed the targeted high end without circumstances beyond the disclosed assumptions, if project removals accelerated, if intermediate-period solar coverage failed to improve, or if equity requirements increased without a corresponding improvement in per-share earnings. The capital-light thesis would weaken if hub contracts required material NextEra guarantees or unreimbursed investment. The merger thesis would weaken if required conditions materially constrained utility cash flows or erased the incremental growth advantage.
RECOMMENDATION
Hold is the appropriate call-driven recommendation. Q3 confirmed strong operating execution and improved the credibility of several long-term development opportunities. It did not raise consolidated guidance, eliminate the need for substantial external capital or resolve the Dominion transaction’s emerging regulatory constraints.
The strongest basis for a more favorable recommendation would be demonstrated conversion of capital-light opportunities into contracted, collectible fee streams, combined with economically acceptable merger conditions and continued delivery of standalone earnings growth. Until those conditions are established, valuation should be anchored in FPL, operating assets and sufficiently contracted development, with explicit discounts for permitting, commercial and financing uncertainty. The investment case is increasingly about the quality and capital efficiency of growth, not the volume of announced GW.
COMPANY EMPLOYEES ON THE CALL
• Michael Dowling, Director of Investor Relations, NextEra Energy. • John Ketchum, Chairman, President and Chief Executive Officer, NextEra Energy. • Mike Dunne, Executive Vice President and Chief Financial Officer, NextEra Energy. • Armando Pimentel, Vice Chairman, NextEra Energy. • Scott Bores, President and Chief Executive Officer, Florida Power & Light Company. • Brian Bolster, President and Chief Executive Officer, NextEra Energy Resources. • Mark Hickson, Executive Vice President, NextEra Energy.
RESEARCH ANALYSTS ON THE CALL
• Steve Fleishman, Wolfe Research. • Paul Zimbardo, Jefferies. • Constantine Lednev, Wells Fargo. • Nick Campanella, Barclays. • Carly Davenport, Goldman Sachs. • Nick Amicucci, Evercore ISI. • Jeremy Tonet, JPMorgan. • David Arcaro, Morgan Stanley.
Key Read-Throughs
KEY READ-THROUGHS FROM NEXTERA ENERGY’S Q3 2026 EARNINGS CALL
NextEra’s October 21 call strengthens the investment case for power equipment, grid infrastructure, battery storage and selected natural gas assets, but provides a more qualified signal for utility shareholders and merchant generators. The central development is the conversion of electricity demand into funded infrastructure: approximately 16.5 GW of federal hub generation has definitive development agreements and $5.7 billion of initial funding, while quarterly storage origination reached 2.4 GW. The less obvious implication is that electricity demand growth does not translate uniformly into higher power prices or shareholder returns. Dedicated generation can limit merchant scarcity upside, customer protections can restrict utility economics, and storage procurement can temporarily displace solar procurement. The strongest company-specific implications concern Dominion’s regulatory process and Chesapeake Utilities’ directly identified pipeline partnership. Equipment and storage implications are broader demand signals, not confirmation of supplier awards. Most developments improve visibility into 2028-2032 activity rather than establish immediate earnings revisions.
UTILITY M&A AND REGULATION
MERGER APPROVAL AND MERGER VALUE ARE BECOMING DISTINCT RISKS (READ-THROUGH 1)
Affected company: Dominion Energy (D: United States). Directional impact: Negative for transaction certainty and potentially negative for the economics of an approved transaction. Magnitude: High event-driven significance; potentially material longer-term financial significance.
The call’s most actionable negative read-through was management’s inability to resolve the financial implications of Virginia’s proposed merger conditions. Steve Fleishman specifically challenged the governor’s “pretty onerous conditions” and staff proposals concerning ring-fencing. Ketchum emphasized affordability, employment and clean energy, but did not quantify acceptable concessions or identify conditions that would make the transaction uneconomic. His acknowledgment that there are “always opportunities for compromise on certain specific issues” preserves a negotiating path without demonstrating that the original economics survive.
The transmission mechanism extends beyond closing probability. Restrictions on dividends from Dominion Energy Virginia could constrain cash available to the parent. Additional bill credits would transfer value to customers. Longer employment protections could limit operating efficiencies. A lower regulated equity capitalization could reduce the equity investment earning an allowed return. These measures can weaken the financing and efficiency benefits underpinning the combined company’s 9%+ EPS growth framework even if regulators ultimately approve the transaction.
The October 19 SCC staff testimony makes the distinction particularly important: staff recommended denying the proposal as filed but identified conditions under which it would not oppose approval. Separately, the governor requested a 6-year residential base-rate freeze and larger customer rebates. These are proposals, not final rulings. The high-conviction conclusion is increased uncertainty around shareholder value capture, not certainty that the merger will fail.
Near-term trading catalysts are rebuttal testimony, the November Virginia hearing and the expected January 2027 order. Dominion’s fixed exchange-ratio consideration also links its transaction value to NextEra’s share price. The longer-duration issue is whether final conditions preserve incremental earnings and cash-flow benefits. The cross-sector signal is negative for assuming that utility consolidation automatically unlocks unrestricted financing synergies, although Virginia’s conditions should not be extrapolated mechanically to other jurisdictions.
NATURAL GAS INFRASTRUCTURE AND PRODUCTION
A DIRECTLY IDENTIFIED PIPELINE PARTNERSHIP PROVIDES CLEANER EXPOSURE THAN GENERAL DATA CENTER THEMES (READ-THROUGH 2)
Affected company: Chesapeake Utilities (CPK: United States). Directional impact: Positive. Magnitude: High strategic relevance to Chesapeake’s investment runway, but limited immediate operating earnings contribution.
NextEra disclosed a joint venture with Chesapeake Utilities to develop a $1.2 billion, 97-mile intrastate natural gas pipeline in South Florida. This is a direct counterparty relationship rather than an inferred beneficiary. Chesapeake’s September transaction announcement establishes that its subsidiary retains 51% ownership, NextEra acquires 49%, and Chesapeake’s Peninsula Pipeline subsidiary will construct, manage and operate the project.
The mechanism is a combination of retained infrastructure growth and shared funding responsibility. Chesapeake keeps control and the operating role while bringing in a partner with substantial development and financing capabilities. Its 51% interest corresponds to approximately $612 million of the announced gross project cost. That figure is not an equity funding requirement or an EPS estimate, since project financing and other terms determine the eventual shareholder investment.
The geographic signal is specific: South Florida’s gas delivery constraints create an infrastructure opportunity independent of whether every proposed data center is built. NextEra’s broader statement that gas transmission could expand beyond its existing expectations reinforces the relevance of transport capacity as generation development accelerates.
The partnership was announced before the earnings call, so this is confirmation rather than a new contract surprise. Chesapeake expects construction to begin in the first half of 2028 and service in 2030. Near-term catalysts are permitting, financing and project-budget updates. The fundamental benefit is longer-duration investment visibility, subject to construction costs and commercial terms. No immediate 2026 earnings uplift should be inferred.
NEW GAS GENERATION SUPPORTS APPALACHIAN DEMAND MORE DIRECTLY THAN A GENERIC NATIONAL GAS PRICE THESIS (READ-THROUGH 3)
Affected company: EQT Corporation (EQT: United States). Directional impact: Positive for longer-term regional demand and potential contracting opportunities. Magnitude: Moderate strategic relevance; no established near-term EPS impact.
NextEra has advanced more than 18 GW of gas-fired generation opportunities, including approximately 16.5 GW across federal hubs in Texas and Pennsylvania. Its previously announced Pennsylvania South Mon project represents approximately 4.3 GW. The relevant transmission mechanism for EQT is new demand near Appalachian production, potentially improving local gas market depth, supporting long-term sales arrangements and reducing reliance on distant demand centers.
The physical scale is meaningful. At an illustrative 75% utilization rate and a 7 MMBtu/MWh heat rate, 16.5 GW would consume approximately 2.0 Bcf/d. The 4.3 GW Pennsylvania project would consume approximately 0.53 Bcf/d under the same assumptions. These are operating sensitivities, not contracted demand forecasts. Utilization, efficiency, commissioning schedules and whether the load is genuinely incremental determine realized consumption.
The strongest inference is regional rather than an immediate increase in Henry Hub prices. Generation located near production can improve Appalachian demand without requiring every incremental molecule to travel to the Gulf Coast. Benefits to producer realizations nevertheless depend on gathering, transportation, basis and contract structure. NextEra did not identify EQT as a gas supplier, and no project-specific revenue should be assigned to it.
The near-term catalysts are binding power contracts, fuel supply agreements and pipeline arrangements. Physical demand is predominantly a 2028-2032 development. This is a positive fundamental read-through for Appalachian gas commercialization, not a catalyst for near-term production guidance or a quantified commodity price target.
POWER EQUIPMENT AND GRID CONSTRUCTION
CAPITAL-LIGHT GENERATION DEVELOPMENT CAN STILL BE CAPITAL-INTENSIVE FOR THE EQUIPMENT SUPPLY CHAIN (READ-THROUGH 4)
Affected companies: GE Vernova (GEV: United States); Siemens Energy (ENR: Germany). Directional impact: Positive for gas generation equipment and associated services. Magnitude: High relevance to the gas equipment businesses; company-specific order allocation remains unconfirmed.
NextEra’s federal hubs combine approximately 16.5 GW of generation, definitive development agreements and $5.7 billion of initial funding. Management expects initial service in 2028-2029 and a broader ramp through 2030-2032. Ketchum’s statement, “While we do not put any capital into the projects,” describes NextEra’s ownership economics, not an absence of equipment expenditure.
This distinction is important for equipment suppliers. Government-related project funding can support turbine deposits, generators, electrical systems and construction commitments without requiring equivalent investment on NextEra’s balance sheet. The financing structure may therefore improve the conversion of power demand into equipment procurement even when the developer is preserving its own capital.
GE Vernova has a previously announced gas generation development framework with NextEra, providing a verified commercial connection. The call did not identify turbine vendors for the federal hubs or establish that the earlier framework governs these projects. Siemens Energy benefits through the broader competitive market for large gas turbines, not through a disclosed award. Assigning all 16.5 GW to either supplier would be unsupported.
The near-term catalysts are reservation agreements, firm equipment orders, deposits and manufacturing-slot disclosures. Revenue and operating earnings would follow delivery and project milestones, while installed-base services extend the benefit beyond commissioning. The offset is that some equipment may already be reserved or included in supplier expectations. This is a strong demand-validation signal, not proof of an entirely incremental order cycle.
TRANSMISSION AND HARDENING HAVE MORE DURABLE DEMAND THAN ANY SINGLE GENERATION TECHNOLOGY (READ-THROUGH 5)
Affected companies: Quanta Services (PWR: United States); Hubbell (HUBB: United States). Directional impact: Positive. Magnitude: Moderate-to-high relevance to addressable demand; no specific contract or earnings increment established.
NextEra reported approximately 25% growth in regulated and invested transmission capital plus secured capital expenditures to $12.7 billion since December 2025. The call identified 2 large 765 kV transmission projects in Illinois and additional Texas transmission approvals. Separately, FPL reported that underground neighborhood lines performed approximately 14 times better than overhead lines during the hurricane, while smart-grid systems avoided approximately 140,000 outages.
These observations support 2 distinct demand streams. Regional transmission expansion requires engineering, construction, substations and high-voltage infrastructure, aligning with Quanta’s capabilities. Distribution hardening and undergrounding require connectors, protection products and other utility components, supporting Hubbell’s addressable market. No award to either company was disclosed.
The non-consensus implication is that grid investment is less dependent on which generation technology wins. Gas plants, nuclear restarts, renewables and storage all require electrical infrastructure, although their interconnection and network requirements differ. The storm-performance evidence also provides utilities with a tangible reliability argument for continued hardening expenditure, rather than relying solely on projected data center demand.
The $12.7 billion measure includes secured future spending and should not be treated as current construction revenue. Near-term catalysts are procurement decisions, notices to proceed and contractor backlog conversion. The fundamental demand extends through the end of the decade. Higher volumes do not guarantee higher margins: labor availability, fixed-price exposure and procurement execution remain important. For this reason, authorized projects are more valuable than unapproved investment plans.
BATTERY STORAGE AND SOLAR EQUIPMENT
STORAGE IS BECOMING AN INITIAL LOAD-SERVING SOLUTION, NOT JUST A RENEWABLES ADD-ON (READ-THROUGH 6)
Affected companies: Fluence Energy (FLNC: United States); Tesla (TSLA: United States). Directional impact: Positive for utility-scale storage demand. Magnitude: High business relevance for Fluence; meaningful to Tesla Energy but lower significance at the consolidated Tesla level.
NextEra originated 2.4 GW of battery storage during the quarter, approximately 65% of total renewables and storage additions. More importantly, FPL stated that serving its initial large-load additions primarily requires battery storage because existing gas and nuclear generation can provide the supporting energy. Management also identified a potential 6-11 GW of storage associated with federal hubs.
The transmission mechanism is broader than increasing renewable penetration. Batteries can address capacity, load shape and peak delivery constraints while existing generation supplies charging energy. This creates a procurement channel that need not wait for new solar or gas plants to reach service. Expanding existing projects from 4-hour to 8-hour duration creates another market for cells, integration and lifecycle services, although it increases energy capacity rather than necessarily increasing power capacity.
The federal hub opportunity is expressed on a 4-hour-equivalent basis, implying approximately 24-44 GWh of potential storage. That is meaningful addressable demand, but remains an opportunity rather than contracted supplier backlog. The call did not name Fluence or Tesla as vendors, and supplier selection, domestic-content requirements and pricing will determine who captures the economics.
Near-term catalysts are equipment awards and confirmation that storage origination converts into delivery schedules. The larger federal hub opportunity is predominantly a 2028-2032 development. The high-conviction positive is volume potential, not assured margin expansion. Competitive tenders, cell costs, warranties and performance guarantees can prevent supplier profits from growing proportionately with installed capacity.
STRONG AGGREGATE BACKLOG OBSCURES A WEAKER INTERMEDIATE-PERIOD SOLAR SIGNAL (READ-THROUGH 7)
Affected companies: Nextpower, formerly Nextracker (NXT: United States); Array Technologies (ARRY: United States). Directional impact: Modestly negative for expectations of synchronized near-term solar order acceleration. Magnitude: Low-to-moderate timing risk, not evidence of structural demand destruction.
Solar origination was approximately 0.6 GW in Q3, compared with approximately 0.9 GW in Q2, while storage origination increased. The accompanying development schedules show 2028-2029 solar backlog declining from 5.3 GW to 4.8 GW, approximately 9.4%, even as 2030-2032 solar backlog increased. Bolster explained that customers had been focused on capacity and that a shift back toward energy products was expected in coming quarters.
For tracker and utility-scale solar hardware suppliers, the relevant mechanism is procurement timing. Standalone batteries can address some immediate capacity requirements without creating a corresponding tracker order. Longer-dated solar additions also have a different revenue profile from near-term projects. Total renewable and storage GW therefore overstates the strength of the immediate solar-specific signal.
This is a sector read-through rather than evidence that NextEra canceled orders with either named supplier. The disclosed data do not identify the allocation between new projects, rescheduling and removals by supplier. They also do not establish near-term shipment reductions, since already contracted hardware can have different delivery schedules from newly originated power projects.
The near-term trading implication is caution toward extrapolating the 3.7 GW aggregate backlog addition into uniformly stronger solar equipment bookings. The fundamental effect depends on whether solar origination rebounds over subsequent quarters and intermediate-period projects convert. Management’s expectation of renewed energy procurement is a potential positive catalyst, but was not yet demonstrated in the quarter.
MERCHANT GENERATION AND NUCLEAR POWER
DEDICATED GENERATION LIMITS THE UPSIDE FROM DATA CENTER LOAD WITHOUT NECESSARILY LOWERING CURRENT POWER PRICES (READ-THROUGH 8)
Affected companies: Vistra (VST: United States); NRG Energy (NRG: United States). Directional impact: Negative for long-duration merchant scarcity upside, rather than an established reduction in near-term earnings. Magnitude: Moderate valuation sensitivity; limited immediate operating impact.
NextEra described federal hubs as “matching new electric load with new power generation.” It also expects substantial behind-the-meter generation and additional batteries, with initial service in 2028-2029 and full campus ramps through 2030-2032. These projects are not simply adding electricity demand to an unchanged generation fleet.
The transmission mechanism is the difference between gross load growth and net pressure on the existing system. Dedicated generation reduces the additional energy and capacity that new campuses must purchase from incumbent merchant generators. Batteries can further reduce exposure to high-price hours. In Texas, these effects can limit the scarcity rents available to uncontracted generation, particularly relative to forecasts that include new data center demand without the associated supply response.
This does not establish that the projects are net bearish for spot prices. New supply is largely paired with new load, grid exchanges may vary, and projects can suffer delays. Existing generators may also benefit from temporary supply arrangements, retail sales or their own dedicated-generation developments. NRG and Vistra should therefore be evaluated on their contracted development and retail capabilities as well as merchant exposure.
The near-term catalyst is disclosure of signed PPAs and credible commissioning schedules that change forward supply expectations. The principal fundamental effect is later in the decade. The actionable conclusion is to discount load-only scarcity models, not to assume an immediate reversal in current power-market tightness.
EXISTING NUCLEAR ASSETS HAVE A CLEARER COMMERCIAL PATH THAN NEW-BUILD NUCLEAR OPTIONS (READ-THROUGH 9)
Affected company: Constellation Energy (CEG: United States). Directional impact: Positive for the contractability and strategic value of existing nuclear generation. Magnitude: Moderate fundamental validation, without a disclosed basis for an immediate earnings revision.
NextEra executed a 20-year PPA for approximately 1 GW at Point Beach, extending contracted output into the 2050s. Bolster emphasized, “This is not an upgrade.” The transaction monetizes an existing facility’s output without requiring a new reactor to be constructed. That is the relevant positive precedent for Constellation’s operating nuclear portfolio.
The economic mechanism is reduced commercialization risk. Existing nuclear plants offer firm, carbon-free output with established sites, equipment and operating organizations. Long-duration PPAs can support reinvestment and reduce exposure to future merchant prices, while giving customers greater visibility over energy supply. The value is particularly relevant where customers need dependable energy rather than additional nameplate renewable capacity.
The conclusion should not be overstated. Point Beach’s PPA price was not disclosed, and management’s approximately $0.21 average EPS contribution is a total contribution under the new contract, not a disclosed incremental increase. The call does not establish that Constellation can obtain the same economics, or that all existing nuclear output remains available for repricing.
The contrast with new nuclear is nevertheless significant. Management requires structures that define the limit of shareholder capital exposure before pursuing new reactors. Existing nuclear contracting therefore has a clearer path to underwritable cash flows than uncontracted SMR opportunities. Near-term catalysts for Constellation are its own PPAs, customer commitments and licensing developments. The fundamental benefit extends into the 2030s and beyond.
CLOUD AND AI INFRASTRUCTURE
A SPECIFIC POWER SUPPLY MILESTONE IMPROVES ALPHABET’S IOWA EXECUTION VISIBILITY (READ-THROUGH 10)
Affected company: Alphabet (GOOGL: United States). Directional impact: Positive for regional infrastructure execution. Magnitude: Moderate significance to the relevant Iowa development program, but low near-term consolidated earnings significance.
NextEra confirmed that Duane Arnold remains on track to restart no later than Q1 2029 and that a Department of Energy loan of up to $1.9 billion closed during the quarter. The customer connection is independently established: the October 2025 NextEra-Google announcement included a 25-year agreement for power from the 615 MW facility to support Google’s Iowa cloud and AI infrastructure.
The transmission mechanism is reduced financing uncertainty around a specific contracted energy source. Access to additional firm, carbon-free electricity can improve the feasibility and sequencing of regional compute investment. The federal loan supports the generating project; it is not a grant to Alphabet, does not eliminate the PPA cost and does not prove that grid delivery or every data center development milestone is complete.
At an illustrative 90% capacity factor, the entire plant would generate approximately 4.85 TWh annually. Google is not entitled to all of that output: the original announcement also identified Central Iowa Power Cooperative as an offtaker. The positive implication is therefore improved visibility for an identified supply arrangement, not unrestricted access to the full plant or an immediate increase in cloud revenue.
The financing milestone predates the earnings call, making this a reaffirmation of progress rather than a new contract catalyst. The next relevant events are nuclear regulatory approvals, refurbishment progress and commissioning readiness. The longer-duration cross-portfolio implication is that contracted power arrangements can become a competitive advantage for compute developers in constrained locations. That advantage is specific to timing, geography and enforceable supply commitments, rather than a general benefit accruing equally to every hyperscaler.
Report record
- Sector
- Utilities
- Fiscal period end
- September 30, 2026
- Report date
- October 21, 2026
- Analysis
- 7003 words
- Read-throughs
- 3011 words
- Content fingerprint (PDF)
fb28b7c59e05- Content fingerprint (analysis)
63e747a19af9- Content fingerprint (read-throughs)
a98caed0c009
Prepared from the company's earnings release and earnings call transcript. Figures as reported by the company. For information only. Not investment advice.
More from NextEra Energy, Inc.
No other reports yet.
All NextEra Energy, Inc. reports
More in Utilities
Follow @AtlasPeakRes on X for new earnings reports as they publish.