Volume-led beat as data center surges; peak margins and cash conversion are now the tests
Earnings Reports
Samsung Electronics FQ3 2026 Earnings Report
Samsung Electronics (005930) FQ3 2026 earnings: HBM4 delivered and 2027 HBM supply sold out, but net income missed consensus and the device businesses stayed in loss. Full earnings analysis, key read-throughs, and the one-page exhibit from Atlas Peak Research.
Samsung Electronics (005930)
Sector: Information Technology · FQ3 2026 · Period end September 30, 2026 · Reported October 28, 2026
Samsung’s Q3 2026 call supports a constructive fundamental assessment but not an indiscriminate increase in exposure based on record earnings.
Download the one-page report (PDF)
View one-page exhibit
Download analysis (.md)
Download read-throughs (.md)
Post to X
One-Page Exhibit
Earnings Analysis
EXECUTIVE CALL SUMMARY: Samsung Electronics Co., Ltd. (10/29/26)
Samsung’s Q3 2026 call supports a constructive fundamental assessment but not an indiscriminate increase in exposure based on record earnings. The most important developments were the delivery of the promised HBM4 ramp, management’s statement that planned 2027 HBM supply is sold out at agreed target prices, expansion of signed multiyear memory agreements to 10 major customers, and increasing visibility into advanced-node foundry demand. These developments strengthen the durability and technological breadth of Samsung’s semiconductor earnings. However, the headline operating result was effectively unchanged from the October 8 preliminary announcement, attributable net income missed Bloomberg consensus by 15.6%, consolidated gross margin declined sequentially, and consumer-device profitability remained impaired. The investment debate has shifted from whether Samsung can participate effectively in AI infrastructure spending to how much of its exceptional semiconductor profitability can persist after pricing, currency, capital intensity, and customer economics normalize.
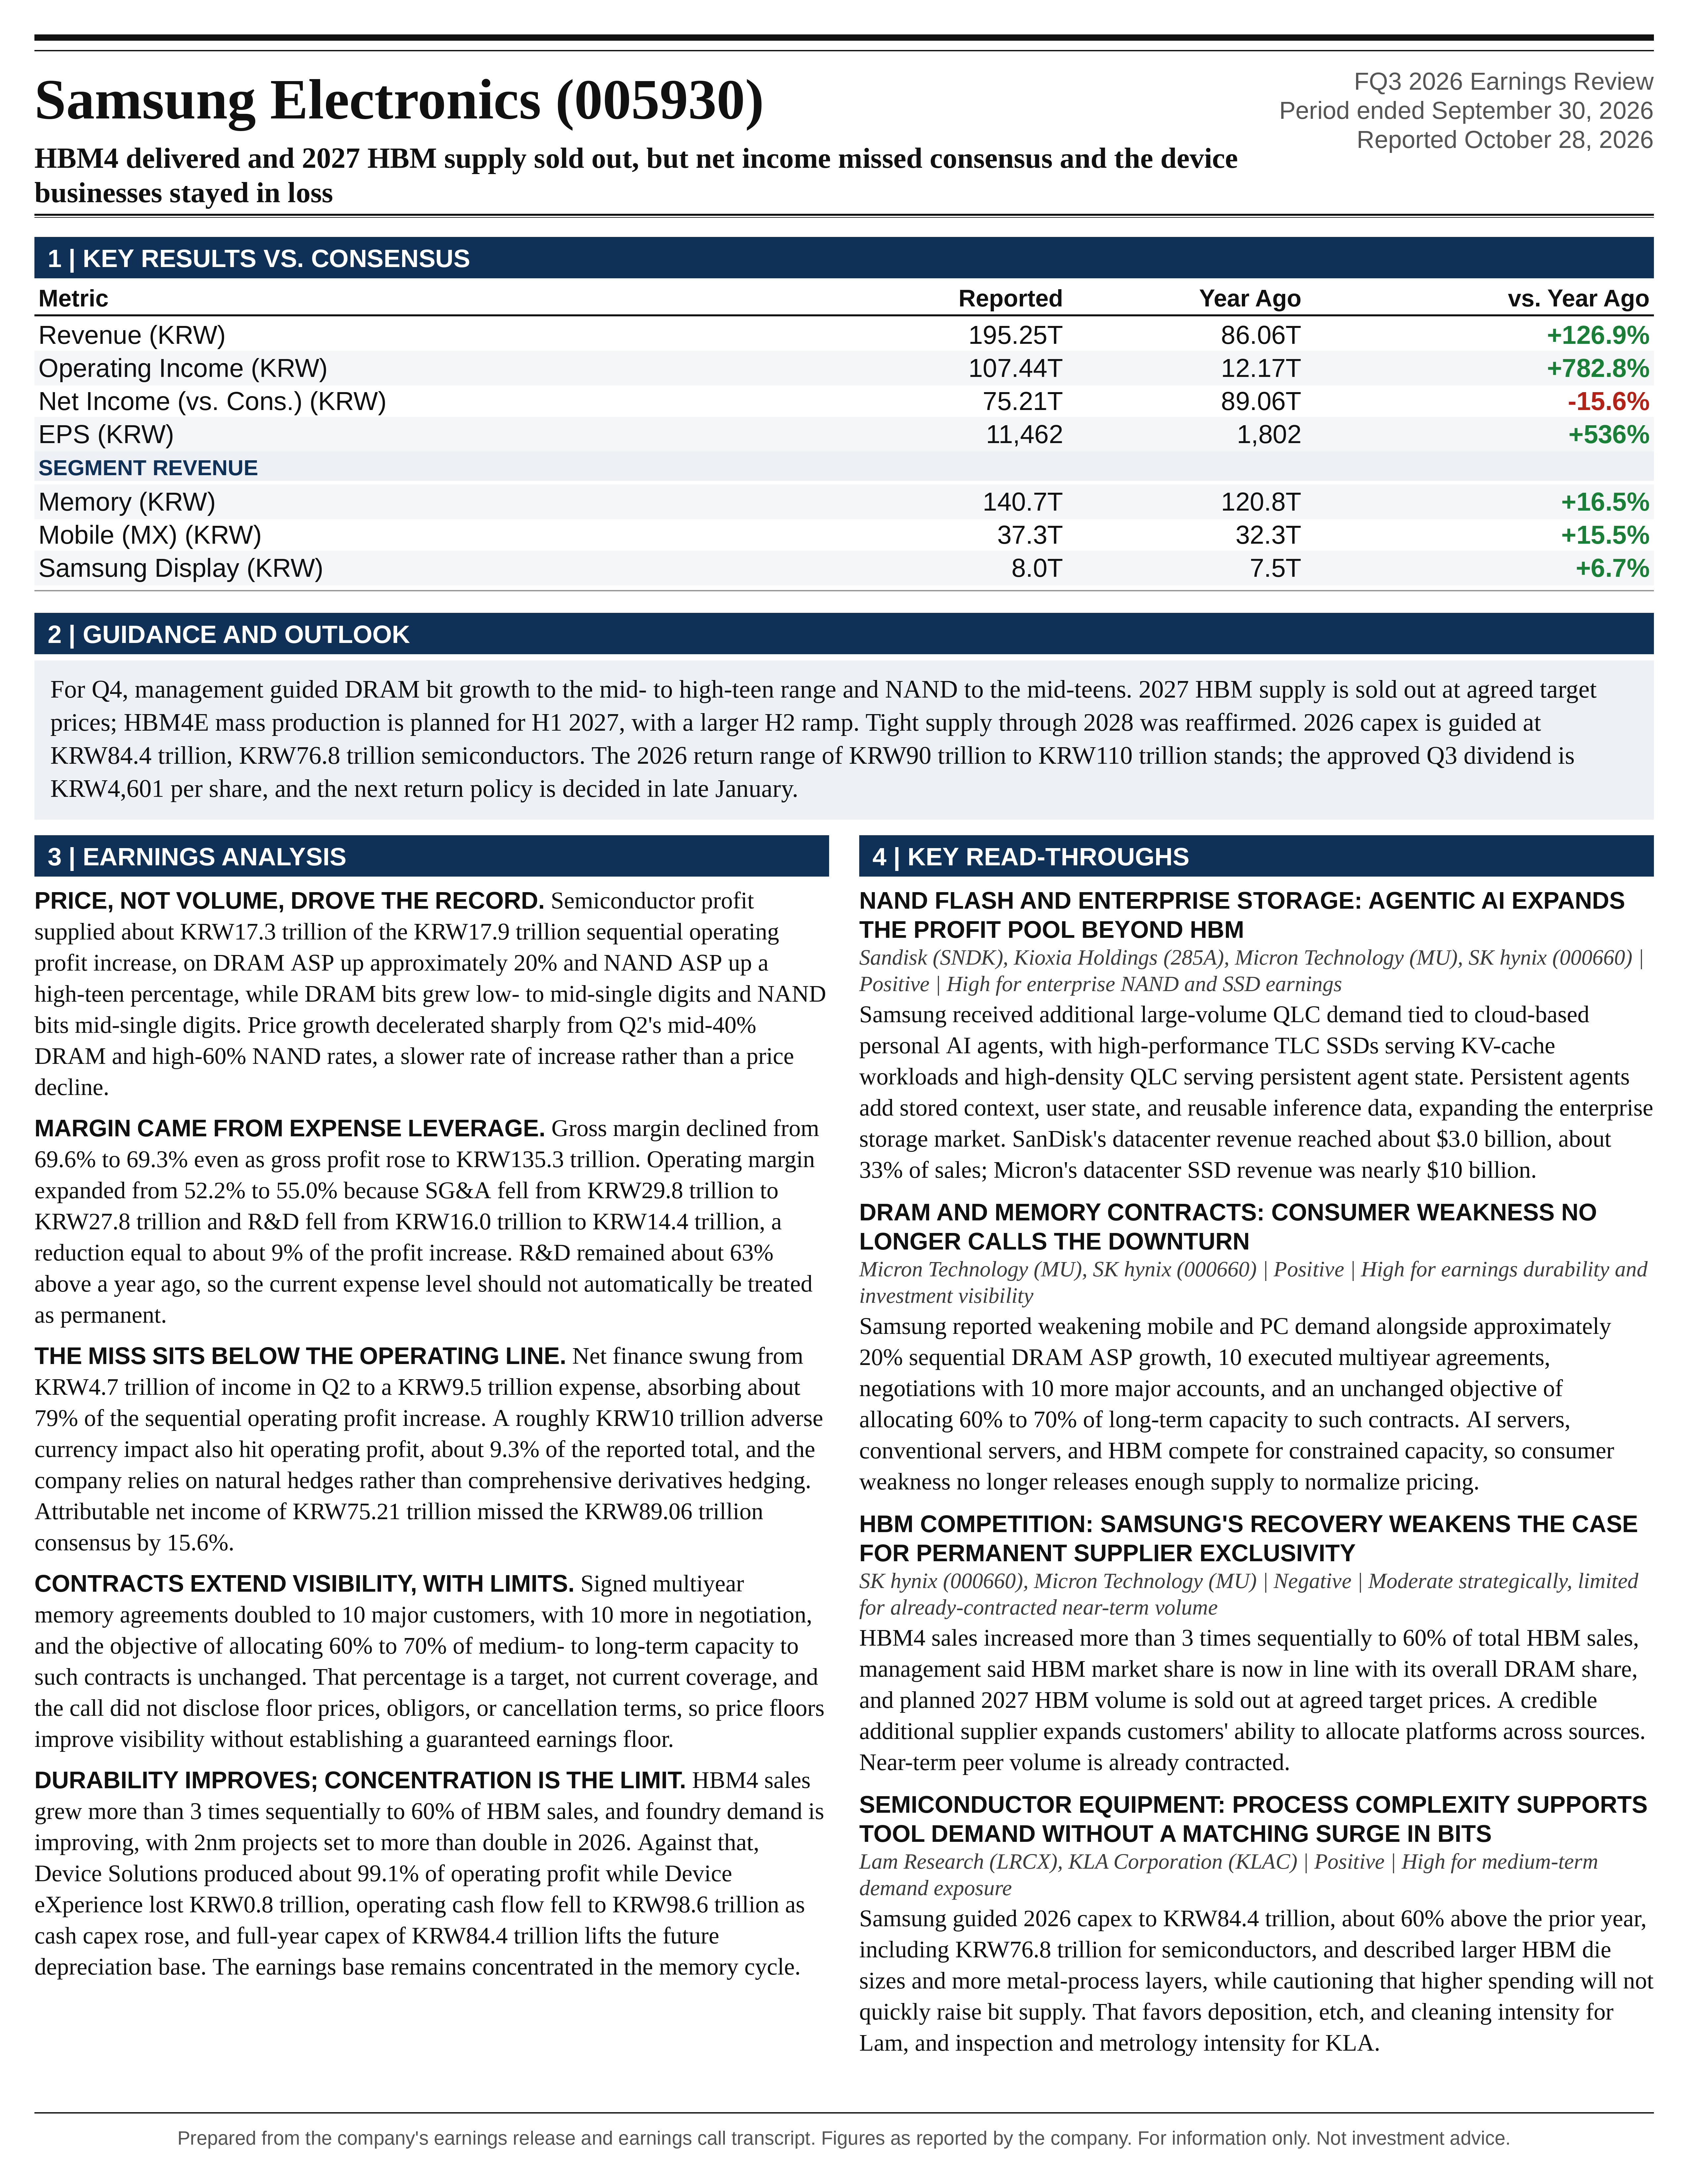
Revenue of KRW195.25 trillion increased 13.8% sequentially and 126.9% year over year. Operating profit of KRW107.44 trillion increased 20.1% sequentially and 782.8% year over year, producing a 55.0% operating margin. These results reflect an extraordinary earnings transformation, but the contribution is exceptionally concentrated. The Device Solutions division generated KRW106.5 trillion of operating profit, approximately 99.1% of consolidated operating profit, while Device eXperience recorded a KRW0.8 trillion operating loss. Samsung’s operational diversification therefore does not translate into diversified earnings exposure at present. Its equity is overwhelmingly exposed to AI infrastructure investment, memory pricing, semiconductor supply constraints, and the Korean won.
The strongest incremental commercial statement was Jaejune Kim’s assertion that “our 2027 HBM supply volume is already sold out at an agreed target price that reflect our product competitiveness.” This is more informative than a generic forecast of strong AI demand because it addresses both planned volume allocation and pricing negotiations. Nevertheless, it does not disclose contract enforceability, customer-specific qualification conditions, cancellation remedies, or the margin embedded in those prices. Similarly, the expanded multiyear contract base improves demand visibility but does not establish that 60% to 70% of capacity is already covered by executed agreements. That percentage remains a medium- to long-term allocation objective.
Several apparently bullish statements were confirmations rather than new upgrades. Supply tightness extending through 2028 had already been discussed on the Q2 call. HBM4 sales growth exceeding 3 times sequentially had already been forecast for Q3. The KRW90 trillion to KRW110 trillion shareholder-return range and approximately KRW30 trillion Q3 dividend had already been announced on August 21. The October call added execution evidence, contractual progress, an approved per-share dividend, and greater emphasis on repurchases and cancellation, including potential adjustment of the preferred-share allocation. It did not introduce a higher aggregate shareholder-return range.
The appropriate earnings-event stance is to maintain fundamentally justified exposure while requiring valuation discipline before adding. Confidence is high in the reported semiconductor earnings concentration and strong current cash generation, moderate in the visibility provided by customer commitments, and materially lower in the persistence of current margins through 2028. The key question is not whether AI memory demand is strong. It is whether contracted demand, technology leadership, and supply constraints can preserve attractive returns on an expanding capital base without permanently damaging the economics of downstream customers.
FINANCIAL PERFORMANCE AND THE ACTUAL EARNINGS SURPRISE
The October 8 preliminary announcement guided to approximately KRW195 trillion of revenue and KRW107.40 trillion of operating profit. Final revenue exceeded those figures by only KRW0.25 trillion, or 0.13%, and operating profit exceeded the preliminary figure by KRW0.04 trillion, or 0.04%. Consequently, the record operating result was largely known before the call. The event’s incremental information resides in the detailed financial statements, forward commentary, product execution, contracts, and capital allocation rather than in an unexpected operating-profit beat.
The Bloomberg earnings notice reported net income of KRW75.21 trillion against consensus of KRW89.06 trillion, a shortfall of KRW13.85 trillion, or 15.6%. The notice did not provide matching revenue or operating-profit consensus figures, so an operating consensus beat cannot be established from that source. Being effectively in line with preliminary company guidance is not equivalent to beating analyst expectations. The same notice showed 44 buy recommendations and no hold or sell recommendations. This demonstrates unusually uniform published sell-side optimism, although it does not establish institutional ownership, positioning, or the amount of positive news embedded in the share price.
The apparent difference between the call’s approximately KRW75.1 trillion net profit and the notice’s KRW75.21 trillion is principally a reporting-scope issue rather than evidence of a conflicting earnings result. Samsung’s presentation distinguishes consolidated net profit of KRW75.1 trillion from profit attributable to owners of the parent of approximately KRW75.2 trillion. The latter is consistent with the notice’s more precise figure. These measures should not be interchanged when comparing consensus, calculating shareholder earnings, or deriving EPS.
The historical comparison illustrates the magnitude of the semiconductor cycle. Revenue increased from KRW86.06 trillion in Q3 2025 to KRW195.25 trillion, while operating profit increased from KRW12.17 trillion to KRW107.44 trillion. Operating margin rose from approximately 14.1% to 55.0%. Common-share EPS increased from KRW1,802 to KRW11,462, approximately 536%, while preferred-share EPS reached KRW11,492. Against Q2 2026, common EPS increased approximately 5.7%, substantially less than the 20.1% increase in operating profit.
The sequential operating-profit improvement also requires more qualification than the headline margin expansion suggests. Gross profit increased from KRW119.3 trillion to KRW135.3 trillion, but gross margin declined from 69.6% to 69.3%. Selling, general, and administrative expenses declined from KRW29.8 trillion to KRW27.8 trillion. R&D, included within that expense presentation, declined from KRW16.0 trillion to KRW14.4 trillion. Thus, the increase in operating margin from 52.2% to 55.0% reflected expense leverage and lower absolute operating expenses, not an expansion in consolidated gross margin.
Approximately KRW2.0 trillion of the KRW17.9 trillion sequential operating-profit increase was associated with lower SG&A. The KRW1.6 trillion reduction in R&D alone represented approximately 9% of the operating-profit increase, although it must not be added again to the SG&A contribution. This does not imply insufficient investment: R&D remained approximately 63% above Q3 2025. It does mean that the current quarterly expense level should not automatically be treated as a permanent structural efficiency gain. The Q2 release also identified incentive-related provisions affecting foundry earnings, but the available disclosures do not provide a complete quantified bridge between those provisions and the current expense reduction.
The approximately 75.6% incremental operating margin on sequential revenue growth demonstrates substantial earnings sensitivity. It should not be extrapolated indefinitely. The combination of exceptionally high semiconductor profitability and restrained quarterly expenses can produce unusually strong incremental margins during a favorable cycle, while subsequent price normalization, depreciation, compensation accruals, or startup costs can reverse that relationship.
NET INCOME, FINANCIAL LOSSES, AND CURRENCY EXPOSURE
The official presentation explains much of the divergence between operating profit and net income. Net finance income of KRW4.7 trillion in Q2 became a net finance expense of KRW9.5 trillion in Q3, an adverse swing of KRW14.2 trillion. That swing absorbed approximately 79% of the sequential operating-profit increase. Other non-operating income and equity-method contributions provided modest offsets, leaving pretax profit at KRW98.5 trillion versus KRW94.4 trillion in Q2. Tax expense increased from KRW22.8 trillion to KRW23.4 trillion, and consolidated net profit increased from KRW71.6 trillion to KRW75.1 trillion.
The effective tax rate calculated from the rounded presentation was approximately 23.8%, slightly below Q2’s approximately 24.2%. Higher taxation therefore was not the principal explanation for the weak conversion of operating growth into net-income growth. The finance result was the dominant disclosed sequential factor. However, the precise attribution of the consensus miss remains unresolved because the consensus assumptions for operating profit, finance income, and tax were not provided. The historical finance bridge explains the sequential earnings pattern; it does not, by itself, explain every component of the consensus shortfall.
Management separately disclosed an approximately KRW10 trillion adverse sequential currency impact on operating profit, principally in component businesses. This is economically significant, equivalent to approximately 9.3% of reported operating profit. It indicates that the underlying operating expansion was stronger than the reported won-denominated increase, but adding KRW10 trillion back to reported earnings produces only a management-impact sensitivity, not a fully reconciled constant-currency income statement.
The operating currency effect and the below-the-line finance expense must remain separate. The available materials do not establish that the entire KRW9.5 trillion finance expense was foreign-exchange related, nor do they disclose enough detail to build a complete currency-neutral EPS measure. Combining the operating headwind with the finance expense without reconciling transaction exposure, balance-sheet remeasurement, hedging, and comparison periods would risk overstating the adjustment.
The CFO stated that Samsung emphasizes “natural hedges across our global value chain” rather than comprehensive derivatives hedging. Matching currency inflows and outflows, aligning assets and liabilities, and reducing the duration of residual dollar exposure can mitigate risk. These practices do not eliminate the earnings sensitivity of a business with substantial foreign-currency revenue and a large domestic manufacturing and cost base. The size of the disclosed operating impact demonstrates that residual exposure remains material despite the policy.
For valuation, the relevant distinction is between temporary financial volatility and a recurring reduction in won-denominated earning power. A transient balance-sheet remeasurement loss should not necessarily receive the same earnings multiple as a permanent reduction in operating margins. Conversely, a sustained appreciation of the won can affect future revenue conversion and competitiveness. The call did not provide the currency assumptions or sensitivities necessary to quantify that distinction precisely.
MEMORY PERFORMANCE, PRICE MOMENTUM, AND SHIPMENT GUIDANCE
Memory revenue reached KRW140.7 trillion, compared with KRW120.8 trillion in Q2 and KRW26.7 trillion in Q3 2025. Memory represented approximately 95.6% of DS revenue. DS operating margin reached approximately 72.4%, up from approximately 70.0% in Q2 and approximately 21.1% a year earlier. The DS profit increase of approximately KRW17.3 trillion accounted for approximately 96% of the consolidated sequential operating-profit increase.
These are combined DS margins, not disclosed standalone memory margins. Foundry and System LSI earnings are not separately quantified in the presentation. The strength of memory could therefore coexist with continuing losses elsewhere in semiconductors. Similarly, subtracting memory revenue from DS revenue produces a residual of approximately KRW6.4 trillion, versus KRW6.7 trillion in Q2, but that residual should not be presented as a standalone foundry revenue figure. Internal transactions and business-perimeter definitions require a proper reconciliation.
The Q3 shipment result was less strong than the headline earnings expansion. DRAM bit shipments increased by a low- to mid-single-digit percentage, versus Q2 guidance for mid-single-digit growth. NAND bit shipments increased by a mid-single-digit percentage, versus prior guidance for high-single-digit growth. DRAM therefore appears to have landed around the lower portion of the prior directional outlook, while NAND came in below it. Since the guidance used qualitative ranges rather than exact percentages, the magnitude of any shortfall cannot be specified precisely.
Pricing remained exceptionally favorable, with DRAM ASP increasing approximately 20% sequentially and NAND ASP increasing by a high-teen percentage. Nevertheless, the pace decelerated materially from Q2, when management reported DRAM ASP growth in the mid-40% range and NAND ASP growth in the high-60% range. This is deceleration in price inflation, not price deflation. It is still important because the equity market typically discounts changes in the rate of improvement before reported earnings peak.
The combination of positive bit growth and rising ASPs supports strong underlying demand, but those indicators should not be mechanically multiplied into reported won-denominated memory revenue without a reconciliation. Their straightforward product would suggest a larger increase than the approximately 16.5% growth in reported memory revenue. Currency, product definitions, application mix, and revenue measurement require alignment. The call’s substantial FX headwind makes that distinction particularly relevant.
For Q4, management indicated DRAM bit growth in the mid- to high-teen range and NAND growth in the mid-teens. This represents a meaningful acceleration from Q3 shipment growth. The transcript’s reference to “peak growth” is interpreted as bit growth based on the surrounding shipment discussion; the exact quantitative outlook is not reproduced in the presentation. No corresponding numerical Q4 ASP forecast was provided.
The volume outlook creates substantial upside if pricing remains firm, but the revenue outcome remains sensitive to price and currency. Illustratively, 17% bit growth with unchanged ASP produces 17% revenue growth before mix and FX. The same volume increase with a 10% ASP increase produces approximately 28.7% growth, while a 10% ASP decline reduces growth to approximately 5.3%. These are analytical sensitivities, not company guidance.
Management’s Q4 and 2027 statements therefore support continued earnings growth directionally, not a specific consolidated revenue or profit forecast. The CFO expects company-wide earnings growth in Q4 and another year of record results in 2027. Those expectations remain dependent on memory economics outweighing continued weakness in devices, foundry startup costs, currency movements, and the financial result.
HBM4 EXECUTION AND THE HBM4E TRANSITION
HBM4 sales increased by more than 3 times sequentially and reached 60% of total HBM sales. This is important evidence that Samsung’s product development and customer engagement are converting into commercial shipments. However, the result largely validates prior guidance rather than exceeding a previously modest expectation. On the Q2 call, management had already projected HBM4 sales growth exceeding 3 times in Q3 and an H2 revenue mix well above 60%.
The Q3 mix of 60% does not, by itself, establish that the H2 objective of well above 60% has been met. That outcome depends on Q4 and the revenue weighting of the quarters. Similarly, growth exceeding 3 times in HBM4 does not imply equivalent growth in total HBM revenue, because earlier-generation products are being replaced within the portfolio.
Management stated that Samsung had achieved the objective of “bringing HBM market share in line with our overall DRAM market share” during Q3. This is commercially significant if measured consistently, because it suggests that Samsung’s HBM underrepresentation has narrowed substantially. However, the call did not disclose the exact share, whether the comparison is based on revenue or bits, or the independent market dataset. The statement therefore supports an improved competitive position but not a precise numerical market-share conclusion.
The timing claim also requires discipline. Management characterized the achievement as ahead of the original H2 target. Q3 is within H2, so the result was achieved early in the stated window rather than before that window began. This is favorable execution, but not evidence of an acceleration exceeding the original timetable by an entire reporting period.
The 2027 sold-out statement is the stronger forward signal. At Q2, Samsung discussed signed 2027 HBM agreements and confidence in commercialization. At Q3, it described the entire planned 2027 HBM supply volume as allocated at agreed target prices, with additional customer requests continuing. This reduces uncertainty around planned sales volumes and negotiating outcomes. It does not eliminate manufacturing yield risk, customer concentration, product-specific qualification requirements, or the risk that contracted prices prove less attractive relative to future costs or competing products.
HBM4E mass production is planned for H1 2027, followed by a larger volume ramp in H2. Samples were shipped in May, which was already disclosed previously. The new investment checkpoint is therefore not sample availability but successful transition into qualified, economically attractive mass production. The most relevant evidence will be sustained yields, customer acceptance, shipment mix, packaging throughput, and realized profitability.
The call does not establish that HBM necessarily offers the highest marginal return on every unit of constrained capacity. Samsung previously emphasized maintaining a balanced allocation between HBM and conventional DRAM. That remains economically rational when server DDR5 pricing is also strong. Product leadership should be assessed against profit per constrained manufacturing resource and capital employed, not simply the percentage of sales labeled HBM.
MULTIYEAR CONTRACTS AND THE LIMITS OF THE DE-RISKING ARGUMENT
Samsung has executed multiyear memory agreements with 10 major customers and is negotiating with another 10, with several negotiations approaching completion. On the Q2 call, management disclosed finalized agreements with 5 major data-center customers and advanced negotiations with another 5. The signed customer count has therefore doubled, while the negotiation pipeline has also expanded. This is substantive commercial progress.
The scope is broadening beyond hyperscalers, server OEMs, and semiconductor customers into mobile, automotive, and networking. That broadening suggests that the desire to secure supply extends beyond direct AI infrastructure buyers. It also reflects the secondary effects of capacity allocation: customers outside the highest-growth applications increasingly need contractual protection against being displaced by server demand.
The target remains to allocate 60% to 70% of medium- to long-term capacity to multiyear contracts. Management said that target is “gaining greater visibility.” This is not a disclosure that current executed contracts already cover that proportion of capacity. The denominator also matters: capacity coverage is not equivalent to revenue coverage, profit coverage, or a fixed percentage of annual output across all product generations.
The Q2 call provided important contractual context that should not be lost merely because it was not repeated in full. Management described 5-year agreements with annual negotiations allowing an additional year to be added, substantial advance-payment requirements, and minimum price floors for mainstream products designed to mitigate investment risk. The Q3 call updated customer counts, extension demand, and requests for additional supply within already contracted periods. It did not disclose the actual floor prices or demonstrate that every newer agreement carries identical protections.
Price floors are economically meaningful but do not establish a guaranteed earnings floor. Their value depends on the covered products, cost inflation, generation transitions, volume obligations, and remedies. A price that protects an initial investment assumption may still deliver a lower return if equipment costs rise, yields disappoint, or customer-specific development becomes more expensive. Likewise, advance payments are not automatically equivalent to nonrefundable take-or-pay obligations.
Credit exposure also remains relevant. A contract with a server manufacturer or cloud intermediary is not necessarily guaranteed by the ultimate hyperscaler or AI service provider. The call does not identify legal obligors, parent guarantees, security interests, refundability, or cancellation terms. Greater contractual duration improves visibility, but the quality of that visibility depends on both enforceability and counterparty funding.
Customer diversification should also be assessed economically rather than by account count. A larger number of customers may still be exposed to the same underlying AI monetization cycle, financing environment, or hyperscaler procurement plans. Multiyear agreements can reduce individual customer volatility without eliminating correlated industry risk.
The positive interpretation is that Samsung is moving toward a more contract-supported investment model with better visibility into capacity utilization. The limiting interpretation is that the business remains exposed to price resets, technology transitions, customer renegotiations, and correlated demand. A reduced cyclicality discount is plausible; a software-like valuation based on contract duration alone is not established.
SUPPLY TIGHTNESS THROUGH 2028 AND CAPITAL EXPENDITURE
Management’s statement that “we expect tight supply conditions to continue in 2028” was a reaffirmation of the Q2 view, not a newly extended forecast horizon. The current call’s contribution was a more detailed explanation of why sharply higher investment might fail to translate quickly into greater bit supply.
The argument distinguishes nominal spending from productive capacity. Higher construction costs increase reported capex without proportionately increasing fab space. More spending on cleanrooms establishes future manufacturing options but does not immediately produce wafers. Equipment inflation and advance payments can increase cash commitments before tools are installed. Longer delivery times can delay ramps even when funding is available. Larger HBM die sizes and more metal-process layers can reduce effective output per unit of manufacturing capacity.
This framework is credible as a description of supply-side friction, but it remains a forecast rather than an industry guarantee. Demand could weaken faster than capacity expands. Yield improvements, process migrations, die-size optimization, equipment productivity, or a change in the HBM and conventional DRAM mix could also improve effective supply without a proportionate increase in nominal wafer starts.
Samsung’s investment approach remains to secure cleanroom capacity in advance and retain flexibility over equipment installation. This creates useful operating optionality: infrastructure can be prepared before demand is fully realized, while the more demand-sensitive equipment commitment can be staged. The option is not costless. Construction commitments, equipment deposits, personnel, and eventual depreciation still create obligations, and flexibility diminishes as projects advance.
Q3 capex was KRW29.0 trillion, compared with KRW16.8 trillion in Q2 and KRW9.2 trillion in Q3 2025. The year-over-year increase was approximately 215%. Nine-month capex reached KRW56.9 trillion. Full-year guidance of KRW84.4 trillion implies approximately KRW27.5 trillion in Q4 and approximately KRW56.5 trillion in H2, representing about 67% of annual investment.
The full-year plan is approximately 60.2% above the implied 2025 level of KRW52.7 trillion. DS accounts for KRW76.8 trillion, approximately 91% of the annual total, while display accounts for KRW3.9 trillion. The transcript repeatedly mislabels semiconductor spending as DX; the official release and presentation establish that DS is the intended division.
The annual capex figure should not be described as a quantified upward revision from Q2 because a comparable numerical full-year target was not established in the reviewed Q2 disclosures. It is a substantial increase over the prior year and a major late-year spending commitment. No numerical Samsung 2027 capex budget was provided.
The principal investment tension is that capacity scarcity supports current margins while large investment commitments eventually increase depreciation and the capital base against which returns must be earned. Cash spending can precede depreciation during construction and installation. Consequently, current earnings can look particularly strong before the full cost of new capacity enters the income statement. The long-term thesis requires not only sustained demand but also adequate returns on the incremental fabs, tools, packaging capacity, and technology investment.
AGENTIC AI, NAND, AND THE STORAGE OPPORTUNITY
The NAND discussion was among the call’s most strategically important sections because it broadened the AI demand argument beyond HBM. Management identified additional demand for high-performance TLC SSDs associated with KV-cache handling and for high-density QLC SSDs associated with cloud-based personal AI agents.
The distinction between these workloads matters. Longer contexts, more concurrent sessions, and more persistent agent activity can increase the storage and movement of inference-related state. High-performance SSDs can support cache offload, persistence, reuse, and data staging. They do not eliminate the requirement for HBM and DRAM on latency-sensitive execution paths. NAND should therefore be viewed as a complementary tier rather than a direct substitute for accelerator memory.
Management’s language about exponentially growing KV-cache requirements describes its observed demand thesis, not a universal technical law. Cache requirements depend on architecture, precision, context length, concurrency, caching policy, and reuse. Compression, quantization, more efficient attention mechanisms, and scheduling can reduce storage per unit of useful work. The investment opportunity depends on aggregate workload growth exceeding these efficiency gains.
The TLC and QLC opportunity should also be separated. TLC generally supports more demanding performance and endurance requirements, while QLC is attractive for high-capacity workloads where cost per bit and read-oriented access patterns are more important. Management’s claim that QLC can reduce latency and improve throughput requires a specified comparison architecture; it should not be interpreted as QLC being inherently faster than TLC.
For personal agents, management described a trend toward dedicated virtual-machine allocations for individual users and anticipated proportional QLC demand growth as adoption expands. That proportionality depends on storage allocation per user, retention policies, utilization, deduplication, and shared infrastructure. A dedicated virtual machine is not equivalent to a dedicated physical server or an immutable amount of physical storage per account. The commercial direction is positive, but the call does not provide enough data to calculate NAND demand per user.
Samsung’s portfolio includes PCIe Gen 6 server SSDs, high-density QLC products, and new bonded V-NAND. Management said V10 TLC was production-ready in Q3. On the Q2 call, it had targeted V10 mass production in August. The current statement is consistent with progress during the quarter but is less informative than a disclosure of qualified shipment volumes, yields, and revenue contribution.
The 256TB product is targeted for commercial launch early in 2027. Its detailed description in the transcript contains ambiguous references to TLC and stacking technology. Those specifications should not be treated as verified process architecture. The earlier call had discussed V9 2Tb QLC and a 256TB product lineup, so development, product announcement, qualification, and commercial launch must be distinguished before concluding that the timetable either accelerated or slipped.
The strategic benefit is a broader AI-linked earnings base spanning accelerator memory, server DRAM, and storage. The corresponding risk is concentration within a common investment cycle. Diversification across memory products does not necessarily diversify exposure to hyperscaler capex or the economics of AI services.
FOUNDRY: IMPROVING COMMERCIAL POSITION, UNPROVEN STANDALONE RETURNS
Foundry commentary was substantially stronger than a simple recovery narrative. Q3 revenue and earnings improved through 4nm HBM base-die demand and advanced-node sales. Samsung continued securing 2nm projects from hyperscalers and AI/HPC customers. For Q4, management expects double-digit revenue growth both sequentially and year over year, supported by 2nd-generation 2nm mobile products, 4nm NPU production, and memory-related demand. The official presentation identifies NPUs, resolving the transcript’s inconsistent MPU wording.
Management expects the number of 2nm projects to more than double in 2026. This is a design-win count, not a disclosure that revenue, wafers, backlog value, or profit will double. Project economics vary materially by customer, die size, production volume, duration, and development requirements. A growing project portfolio improves the probability of future utilization but does not establish the dollar value of that utilization.
The expected shift toward more than 50% HPC revenue is strategically important. On the Q2 call, management discussed AI/HPC exceeding 30% of the 2026 mix, compared with a high-teen percentage in 2025. The current statement points toward a more infrastructure-oriented business. However, its timing is not explicitly aligned with the earlier 2026 target, so it should not be presented as an unambiguous increase in the same-year forecast from 30% to 50%.
The utilization outlook is strong but requires a defined denominator. Management expects advanced-node demand to exceed capacity and referred to utilization above 100%. Such a figure can reflect output above a nominal planning baseline, mix changes, productivity improvement, or scheduling conventions. It is not evidence that physical production can exceed the true capacity of every constrained process step.
The technology claims also require separation. Strong 4nm HBM base-die yields do not establish equally strong 2nm logic yields. A regular, relatively specialized base-die design and a large HPC chip impose different manufacturing, design, and economic requirements. The call did not disclose numerical yields, defect densities, customer-specific economics, or standalone foundry margins.
Samsung’s integrated memory, logic, and packaging model can provide real advantages through co-design, faster iteration, reduced coordination complexity, and supply-chain control. However, internal base-die sales must not be double-counted as incremental consolidated revenue alongside the HBM product that incorporates them. The value is created through external sales, avoided external costs, product performance, and execution efficiency, not through adding internal revenue streams together.
Taylor Fab 1 has begun cleanroom operations, equipment installation, and wafer input for line setup. These are meaningful commissioning milestones, not equivalent to a fully qualified commercial production ramp. The Q2 call targeted commencement of operations in 2026; the Q3 call emphasizes the commercial contribution and ramp during 2027. The language can be consistent if commissioning occurs in 2026 and meaningful production follows in 2027. A delay cannot be concluded solely from these differently defined milestones.
The Q2 call also discussed Taylor Fab 2 construction beginning by the end of 2026 and mass production targeted for 2030. The current call discusses evaluating further capacity, including additional fabs, without reiterating that specific schedule. The omission does not establish cancellation, but it leaves the earlier milestone unconfirmed. Similarly, discussions and test-chip planning for 1.4nm are development milestones, not a disclosed commercial revenue timetable.
The central valuation limitation is that earnings improvement is not synonymous with achieved profitability. No standalone foundry operating-profit figure or explicit break-even confirmation was provided. Foundry should therefore be valued as an improving execution-dependent business rather than as a fully proven additional profit engine. Capital intensity, U.S. operating costs, startup inefficiencies, customer qualification, and advanced-node yields remain critical to the return on invested capital.
MOBILE, DISPLAY, SYSTEM LSI, AND CONSUMER DEMAND DESTRUCTION
The consumer businesses demonstrate the other side of the memory windfall. MX revenue was KRW37.3 trillion, compared with KRW32.3 trillion in Q2 and KRW33.5 trillion in Q3 2025. Combined MX and Networks revenue was KRW37.7 trillion, but the combined operating result was a KRW0.6 trillion loss. That compares with a KRW0.7 trillion loss in Q2 and a KRW3.6 trillion profit a year earlier.
The combined margin improved sequentially from approximately negative 2.1% to negative 1.6%, but deteriorated from approximately positive 10.6% a year earlier. The year-over-year decline of approximately 12.1 percentage points is material evidence that higher selling prices and premium mix have not fully offset component inflation and other pressures. Revenue growth is not translating into attractive device-level economics.
The entire DX division remained at an approximately KRW0.8 trillion operating loss despite an 8% sequential revenue increase. Improved mobile profitability was offset elsewhere, including appliances and television-related weakness. The official release also disclosed lower Networks earnings because of reduced North American and high-margin software sales. The combined mobile-and-network loss should therefore not be attributed exclusively to handset memory costs.
For Q4, MX expects revenue to decline sequentially even as the overall smartphone market benefits from seasonality. That contrast does not automatically imply market-share loss because Samsung’s flagship launch cadence differs from the industry’s seasonal pattern. However, it limits the argument that year-end demand will generate a broad recovery in device profitability. Management also expects profit to decline and emphasized efforts to “minimize profit declines” in 2027 rather than presenting a clear return-to-profitability target.
The smartphone outlook is a price-volume divergence: unit shipments decline while market revenue increases because of higher ASPs and a greater premium mix. This can improve industry revenue without improving consumer affordability or supplier volumes. Market-share gains in a shrinking market can also coexist with declining absolute shipments. Samsung’s shift toward premium products is commercially rational but does not remove the contraction in lower-price segments.
Higher-capacity models offer potential revenue and profit-per-device benefits, but they also increase memory content precisely when memory costs are rising. Financing programs can reduce the customer’s immediate purchase burden, although discounts, subsidies, financing costs, and partner economics must be considered when evaluating incremental profitability. Agentic AI features, Intelligent Eyewear, and other form factors expand product options, but no associated recurring-revenue model or financial contribution was quantified.
Samsung’s vertical integration provides supply assurance and captures profits across different stages of the value chain. It does not make internal memory consumption economically free. Higher transfer prices can redistribute profit among segments, but consolidated value depends on external customer revenue and the opportunity cost of allocating scarce memory internally rather than selling it externally. The current results show that the semiconductor benefit greatly exceeds the device loss, not that downstream demand destruction is irrelevant.
Samsung Display generated KRW8.0 trillion of revenue and KRW1.1 trillion of operating profit, versus KRW7.5 trillion and KRW0.7 trillion in Q2. Margin improved to approximately 13.8% from approximately 9.3%. However, revenue and profit remained below Q3 2025 levels of KRW8.1 trillion and KRW1.2 trillion. The sequential recovery should therefore not be characterized as broad year-over-year earnings acceleration.
The 2027 display strategy emphasizes foldables, the Gen 8.6 IT OLED ramp, gaming monitors, automotive displays, and other premium applications. These markets can improve product mix, but new-line depreciation, utilization, and yield development remain important. A larger foldable market may benefit Samsung Display even if greater competition makes Samsung’s own handset business less profitable. Component and device exposures can therefore diverge within the same product category.
System LSI’s strategy is appropriately directed toward flagship SoCs, 200MP sensors, custom silicon, and non-mobile applications. Nevertheless, no customer identities, project values, revenue schedules, or profitability targets were disclosed for the new custom-SoC wins. Exynos 2700 progress supports the product roadmap, but potential benefits to MX costs and internal foundry utilization should not be counted as separate external revenue opportunities without eliminating internal transactions.
Visual Display and Digital Appliances generated KRW13.9 trillion of combined revenue and a KRW0.2 trillion operating loss. The TV outlook remains flat to slightly declining in units, with premium and larger-screen products expected to outperform. Services, advertising, and platforms could improve the earnings mix, but the call did not quantify their revenue, margins, or contribution. A services valuation premium is premature without evidence of scale and monetization.
Harman generated approximately KRW4.3 trillion of revenue and KRW0.6 trillion of operating profit. Reported revenue increased 9% year over year but declined 5% sequentially, while operating profit improved from approximately KRW0.4 trillion in both comparison periods. The call emphasized telematics, automotive displays, centralized controllers, Volkswagen-related supply growth, portable audio, and premium brands.
The official release and presentation add an important qualification absent from the verbal explanation: nonrecurring U.S. tariff refunds supported Harman’s earnings improvement. The refund amount was not disclosed. Consequently, neither the full profit increase nor the approximately 14% operating margin should be assumed recurring. The underlying automotive and audio opportunity remains constructive, but the reported quarterly margin is not a clean measure of sustainable profitability.
CASH GENERATION, BALANCE SHEET, AND SHAREHOLDER RETURNS
Operating cash flow was KRW98.6 trillion, a strong absolute result but below KRW105.1 trillion in Q2. Cash purchases of property, plant, and equipment increased from KRW14.1 trillion to KRW26.9 trillion. Operating cash flow less cash PP&E purchases therefore declined from KRW91.0 trillion to KRW71.7 trillion, approximately 21.2%, despite higher net income.
This calculation is an analytical cash-generation measure, not a reproduction of Samsung’s shareholder-return policy definition of free cash flow. The KRW26.9 trillion cash PP&E figure also differs from reported quarterly capex of KRW29.0 trillion. Timing and measurement differences must be respected rather than using the figures interchangeably.
Operating cash flow was approximately 131% of consolidated net income, compared with approximately 147% in Q2. Receivables increased approximately 10.0% sequentially to KRW106.1 trillion, slower than revenue growth, while inventory increased only approximately 0.8% to KRW72.0 trillion. Those balance movements are directionally consistent with strong sales and limited inventory accumulation. They do not constitute a complete working-capital reconciliation because currency, payables, accrued compensation, taxes, and other balance-sheet changes also matter.
The Q2 call disclosed substantial customer advance-payment requirements under memory agreements and stated that such payments could affect policy free cash flow. The current materials do not separately quantify Q3 LTA receipts. Cash generation therefore cannot be assumed to consist entirely of recurring earnings conversion. Customer funding can support expansion and reduce financing risk, but it also creates future delivery obligations and may reduce later cash receipts relative to recognized revenue.
Samsung ended September with KRW214.8 trillion of broadly defined cash and short-term financial assets, KRW17.2 trillion of debt, and approximately KRW197.6 trillion of net cash. The balance sheet provides substantial capacity to fund investment and shareholder distributions. However, the cash definition is broader than cash and cash equivalents alone and should be preserved when comparing liquidity across companies.
The condensed cash-flow categories sum to approximately KRW39.4 trillion of net inflow, while the disclosed increase in the broad cash balance was KRW24.8 trillion. The approximately KRW14.6 trillion residual is not reconciled in the summary. Currency translation and financial-asset classification may be relevant, but the entire difference should not be assigned to a specific cause without the detailed cash-flow statement.
The board approved a Q3 dividend of KRW4,601 per common and preferred share, including the regular KRW376 dividend. The incremental component is therefore KRW4,225 per share, approximately 91.8% of the total per-share distribution. The aggregate KRW30 trillion payment is scheduled for November. It is a substantial distribution, equivalent to approximately 40% of Q3 attributable net income, but it should not be interpreted as a recurring quarterly payout rate.
The total 2026 shareholder-return estimate remains KRW90 trillion to KRW110 trillion. With KRW35 trillion already completed or planned, including the approved Q3 dividend, KRW55 trillion to KRW75 trillion remains to be allocated. Management committed to cash dividends and a “substantial share repurchase and cancellation program.” The final amount, execution details, and the next policy beginning in 2027 are scheduled for a late-January board decision.
This timing was already contemplated in the August announcement. The October call therefore confirms implementation rather than announcing an unexpected postponement or an enlarged return envelope. The remaining allocation represents approximately 61% to 68% of the total estimated 2026 return pool, making January a major catalyst for both the magnitude and composition of capital returns.
Employee-compensation buybacks must be distinguished from buybacks for cancellation. The August board announcement separately authorized approximately KRW15 trillion of share purchases for employee compensation. The Q3 cash-flow summary shows KRW12.5 trillion of treasury-share acquisition, but the available summary does not allocate every purchase by purpose. Shares acquired for subsequent employee delivery do not produce the same permanent share-count reduction as cancellation.
The preferred-share statement creates a potential relative-value catalyst. Samsung indicated that the common/preferred price gap could influence the allocation of repurchases and cancellations. Equal cash dividends per share can make the preferred shares more attractive on yield when they trade at a discount, but the opportunity depends on the actual discount, liquidity, voting characteristics, taxation, and eventual repurchase allocation. No guaranteed spread-convergence mechanism was announced.
Distribution capacity is not the same as investment attractiveness. Cash returned to shareholders is valuable when capital would otherwise earn inadequate returns, but a dividend is not free incremental value independent of the corresponding reduction in corporate assets. Buyback accretion likewise depends on the purchase price and permanent cancellation. The next policy will matter most if it converts exceptional current earnings into a credible, repeatable framework without encouraging overinvestment at peak cycle economics.
INVESTMENT IMPLICATIONS, SCENARIOS, AND RISK PARAMETERS
The strongest investment implication is a reduced risk of Samsung remaining structurally underrepresented in high-value AI memory. HBM4 shipment execution, 2027 commercial allocation, and multiyear contract expansion provide evidence beyond product-roadmap claims. The more difficult proposition is that current margins represent a durable new equilibrium. A 72.4% DS operating margin embeds an unusually favorable combination of pricing, product mix, capacity scarcity, and cost absorption.
A simple sensitivity illustrates the exposure. At Q3 memory revenue of KRW140.7 trillion, a 10% revenue reduction caused solely by lower prices would remove approximately KRW14.1 trillion of quarterly revenue. Before cost offsets, internal-sales eliminations, and behavioral changes, that amount is approximately 13% of consolidated operating profit. At unchanged DS revenue, a margin decline from 72.4% to 60% would reduce DS operating profit by approximately KRW18.2 trillion; a decline to 50% would reduce it by approximately KRW33.0 trillion. These are static stress tests, not forecasts.
Illustrative 2027 scenarios can be anchored to Q3’s annualized DS revenue of KRW588.4 trillion and consolidated operating-profit run rate of approximately KRW429.8 trillion. These annualized values are reference points, not reported 2026 annual results or management guidance. The following probabilities are judgmental, with low-to-moderate confidence, and describe operating outcomes rather than stock-return forecasts.
The base case, assigned 50% probability, assumes DS revenue 15% above the Q3 annualized reference, a 68% DS operating margin, and KRW4 trillion of aggregate operating profit from the remaining businesses and reconciliation items. This produces approximately KRW464 trillion of consolidated operating profit. The assumptions are continued AI demand, successful planned HBM shipments, some margin normalization, and no substantial consumer recovery. The case would weaken if shipment growth repeatedly missed guidance or if contractual pricing failed to protect economics as new capacity entered production.
The bull case, assigned 25% probability, assumes DS revenue 30% above the reference, a 74% DS operating margin, and KRW8 trillion of operating profit elsewhere, producing approximately KRW574 trillion of consolidated operating profit. This requires sustained scarcity pricing, successful HBM4E execution, strong server-DRAM and SSD demand, improving foundry economics, and limited incremental damage to downstream customers. It would be contradicted by material price concessions, qualification delays, or capital spending that rises faster than productive output and cash generation.
The bear case, assigned 25% probability, assumes DS revenue 15% below the reference, a 50% DS operating margin, and KRW4 trillion of aggregate losses elsewhere, producing approximately KRW246 trillion of consolidated operating profit. This could result from weaker AI investment, customer inventory adjustment, contract renegotiation, currency pressure, or faster effective supply growth. Even this case retains substantial semiconductor profitability, but it demonstrates how large the earnings decline can be from an exceptional starting point.
The probability-weighted outcome is approximately KRW437 trillion, only modestly above the Q3 annualized operating-profit reference. This is not a calibrated earnings forecast. It illustrates that a favorable industry outlook can coexist with substantial downside asymmetry when starting margins are already extraordinary. It also explains why record earnings alone are insufficient grounds for a higher valuation multiple.
The cross-company implications are similarly differentiated. For SK hynix and Micron, the call supports strong industry demand and pricing but raises competitive questions about Samsung’s HBM share recovery. Stronger industry growth can offset share pressure, so Samsung’s gains should not be translated mechanically into declining peer revenue. For NAND suppliers, the server-SSD commentary is favorable, but company-specific enterprise exposure, qualification, and product economics remain decisive.
Semiconductor equipment suppliers potentially benefit from higher spending, more complex processes, and advanced packaging investment. However, Samsung explicitly cautioned that construction inflation, equipment pricing, deposits, and lead times inflate capex without matching near-term capacity additions. Announced investment is therefore not equivalent to immediately recognizable equipment revenue. For cloud and accelerator customers, improved supply visibility supports deployment plans, while sustained memory inflation increases system costs and raises the return hurdle for AI services.
The principal catalysts are Q4 shipment delivery and pricing, the late-January 2027 shareholder-return decision, HBM4E mass production in H1 2027, its larger H2 volume ramp, Taylor’s commercial qualification and output, and the H2 2027 production of major 2nm customer products. Additional signed memory agreements and clearer disclosure of capacity coverage, price floors, and advance-payment economics would improve confidence in earnings durability.
The fundamental invalidation triggers are repeated shipment underdelivery, a material delay in HBM4E qualification or ramp, contract cancellations or economically adverse renegotiations, evidence that nominal capex is not generating acceptable productive returns, sustained deterioration in cash conversion after investment, and semiconductor margin compression materially exceeding the base-case assumptions. A return-policy outcome below the previously announced range would also require explicit reconciliation with the existing framework.
The earnings-event recommendation is to hold fundamentally justified exposure rather than add solely on the record headline. An unconditional new-money buy, absolute entry price, or price target is not established because a verified current valuation and portfolio exposure were not included in the evidence set. Samsung should be treated as concentrated AI-memory exposure, not as a low-correlation diversified electronics holding.
For an illustrative diversified TMT portfolio, a 1% NAV position exposed to a 30% downside stress contributes approximately 30 basis points of portfolio loss before hedges and correlated positions. That is a risk-budget illustration, not a conclusion about an existing portfolio. A 10% adverse move from entry can serve as a mandatory review threshold, with thesis-breaking operating evidence requiring reduction regardless of price. Neither a stop order nor a review threshold guarantees a maximum loss during gaps or liquidity events. Aggregate exposure to memory producers, accelerator suppliers, cloud capex, Korea, and the won should determine the final allocation.
The decisive conclusion is that Samsung has materially strengthened the evidence for its AI semiconductor competitiveness and forward commercial visibility. The remaining investment burden is to distinguish durable technological and contractual advantages from exceptional scarcity rents, and to ensure that the price paid does not require today’s margins to persist indefinitely.
SOURCE BASIS AND INTERPRETIVE LIMITATIONS
The principal sources are the October 29, 2026 earnings-call transcript and accompanying Bloomberg notice; Samsung’s Q3 2026 earnings release and 16-page financial presentation; the October 8, 2026 preliminary earnings announcement; the July 30, 2026 Q2 release and contemporaneous call transcript; the August 21, 2026 shareholder-return announcement; and the October 30, 2025 Q3 results release. The current presentation states that its financial information precedes completion of external review.
Official written disclosures were used to resolve the transcript’s DS/DX labeling errors, financial-statement definitions, and selected product terminology. Detailed contractual remedies, finance-expense composition, tariff-refund amounts, and certain technical specifications remain undisclosed or unresolved. Participant names and titles below follow the supplied call transcript, which differs from the presentation roster in several places.
COMPANY EMPLOYEES ON THE CALL
• Charles Hur, Executive Vice President, Samsung Display. • Daniel Araujo, Executive Vice President, MX. • Daniel Oh, Executive Vice President and Head of Investor Relations. • Hun Lee, Executive Vice President and Head of Sales Strategy Group, Visual Display. • Jaejune Kim, Executive Vice President, Memory Global Sales & Marketing. • Jason Shin, Executive Vice President, System LSI Business. • Soon Cheol Park, Executive Vice President and Chief Financial Officer. • Sukchae Kang, Executive Vice President, Foundry Business.
RESEARCH ANALYSTS ON THE CALL
• Dong-Hee Han, SK Securities Co., Limited. • Dong-Je Simon Woo, Bank of America Securities. • Jay Kwon, J.P. Morgan Securities. • JuHeon Lee, Goldman Securities. • Kim Dong-Won, KB Securities Co. Limited. • Kim Sun-woo, Meritz Securities Co. Limited. • Lee Su-rim, DS Investment & Securities. • Seicheol Lee, Citi. • Sung-Kyu Kim, Daiwa Capital Markets.
Key Read-Throughs
KEY READ-THROUGHS FROM SAMSUNG ELECTRONICS’ Q3 2026 EARNINGS CALL
Samsung’s call reinforces a redistribution of technology-sector profitability toward memory manufacturers and the equipment required to expand increasingly complex semiconductor production. The strongest incremental signals are the expansion of agentic-AI storage demand beyond HBM, the widening use of multiyear memory contracts, and Samsung’s demonstrated HBM4 commercialization. The negative consequences are equally important: component inflation is destroying lower-priced device demand, raising infrastructure investment costs, and weakening the relationship between hardware revenue growth and physical shipment growth. The most actionable near-term read-through is to NAND suppliers reporting immediately after Samsung. For companies that have already reported, Samsung primarily corroborates or challenges forward assumptions rather than predicts completed-quarter results. Impact assessments below describe business and earnings exposure, not expected share-price moves; strong fundamentals do not establish that a security is attractively valued.
NAND FLASH AND ENTERPRISE STORAGE: AGENTIC AI EXPANDS THE PROFIT POOL BEYOND HBM (READ-THROUGH 1)
Affected companies: Sandisk Corporation (SNDK: United States), Kioxia Holdings Corporation (285A: Japan), Micron Technology (MU: United States), and SK hynix (000660: South Korea). Direction: positive. Magnitude: high for enterprise NAND and SSD earnings; potentially high at group level for Sandisk and Kioxia, but more diluted within the DRAM-heavy businesses of Micron and SK hynix.
Samsung reported NAND ASP growth in the high-teens sequentially despite only mid-single-digit shipment growth. More importantly, management said it had received “additional QLC demand in a large volume” associated with cloud-based personal AI agents. It identified distinct demand channels for high-performance TLC SSDs supporting KV-cache workloads and high-density QLC SSDs supporting persistent personal-agent services. The company expects approximately mid-teen NAND bit growth in Q4 while continuing to prioritize AI applications.
The transmission mechanism is broader than higher storage content in conventional servers. Persistent agents create additional requirements for stored context, user state, application data, and reusable inference information. Performance-sensitive storage workloads support TLC demand, while capacity-intensive, read-oriented workloads support QLC. This expands the addressable enterprise-storage market and enables suppliers to redirect constrained NAND capacity toward more valuable applications. Pricing, product mix, and fixed-cost absorption can therefore improve simultaneously.
Sandisk offers particularly direct exposure. Its most recently reported quarter already showed approximately $3.0 billion of datacenter revenue, about 33% of total sales, versus approximately $1.5 billion in the preceding quarter. Samsung’s disclosure provides an independent demand signal ahead of Sandisk’s next report rather than merely repeating Sandisk’s own growth narrative. For Kioxia, the company’s October announcement of its QLC-based LD4 hyperscale SSD confirms relevant product exposure. However, that product was sampling, so Samsung’s demand commentary supports its addressable opportunity, not immediate revenue from every announced capacity configuration.
Micron’s September results already established substantial enterprise exposure: datacenter SSD revenue was nearly $10 billion and represented more than two-thirds of NAND revenue. Samsung consequently corroborates Micron’s existing storage thesis rather than creating a new explanation for its completed quarter. SK hynix participates through its own NAND operations and Solidigm; Solidigm should not be treated as a separately listed investment.
The immediate catalysts are Sandisk’s October 29 earnings call after the US market close and Kioxia’s scheduled October 30 results. The critical variables are enterprise SSD shipments, realized NAND pricing, customer qualification progress, and the mix of capacity assigned to datacenter products. The longer-duration implication extends through 2027 and 2028 if agent adoption creates persistent storage demand rather than temporary capacity reservation.
This is not a blanket argument for replacing HDD exposure with NAND exposure. Samsung identified specific performance and latency requirements, not wholesale displacement of economical bulk storage. Nor does rising NAND demand imply proportional SSD-unit growth: drive capacity, utilization, storage architecture, and customer share determine the conversion.
DRAM AND MEMORY CONTRACTS: CONSUMER WEAKNESS IS NO LONGER SUFFICIENT TO CALL THE MEMORY DOWNTURN (READ-THROUGH 2)
Affected companies: Micron Technology (MU: United States) and SK hynix (000660: South Korea). Direction: positive. Magnitude: high for earnings durability and investment visibility; moderate incremental information relative to the peers’ already bullish disclosures.
Samsung simultaneously reported weakening mobile and PC demand, approximately 20% sequential DRAM ASP growth, and expectations that memory demand will materially exceed supply in 2027. It also disclosed 10 executed multiyear agreements, negotiations with another 10 major accounts, and an unchanged objective of allocating 60% to 70% of medium- to long-term capacity to such contracts. Management expects tight supply through 2028.
The important mechanism is capacity allocation. Consumer demand destruction does not necessarily release enough supply to normalize pricing when AI servers, conventional servers, and HBM compete for constrained manufacturing resources. HBM’s larger die requirements and increased process complexity can reduce the amount of conventional DRAM output available from a given manufacturing footprint. Memory producers can therefore maintain strong pricing even while important historical end markets contract.
The contract transition adds a separate benefit. Longer commitments improve the visibility of utilization against planned investment, while advance payments and pricing frameworks can reduce the financing burden and downside associated with expansion. The investment implication is a potentially less volatile return on incremental capital, not simply another quarter of unusually high spot or contract prices.
Peer disclosures support this mechanism independently. SK hynix reported on October 28 that executed agreements covered more than 50% of production capacity for 2027 and 2028. Micron disclosed 26 strategic customer agreements representing an estimated more than 35% of revenue through 2030, with customer financial commitments of $32 billion, mostly in the form of cash deposits. Those figures have different denominators and should not be ranked directly against Samsung’s capacity-allocation target. Financial commitments also must not be treated as equivalent to cash already collected.
The near-term catalyst is evidence that contracted volume and pricing translate into realized shipments and cash generation over the next reporting cycles. The longer-duration implication is reduced exposure to purely transactional procurement and greater customer participation in funding the industry’s capital requirements.
The limitation is contractual quality. Samsung’s 60% to 70% figure remains a target, while its commentary does not establish uniform take-or-pay protection across all agreements. SK hynix’s pricing mechanism retains market sensitivity, and Micron’s agreements have differing pricing frameworks. Longer contracts reduce some uncertainty but do not eliminate renegotiation, credit exposure, technology-transition risk, or correlated customer demand. The high-conviction conclusion is improved visibility, not a guaranteed earnings floor.
HBM COMPETITION: SAMSUNG’S RECOVERY WEAKENS THE CASE FOR PERMANENT SUPPLIER EXCLUSIVITY (READ-THROUGH 3)
Affected companies: SK hynix (000660: South Korea) and Micron Technology (MU: United States). Direction: negative for relative competitive scarcity and assumptions of indefinitely rising HBM share; not an immediate negative call on total earnings. Magnitude: moderate strategically, limited for already-contracted near-term volume, and potentially material for later pricing and allocation decisions.
Samsung reported that HBM4 sales increased by more than 3 times sequentially and reached 60% of total HBM sales. Management said it had achieved the objective of “bringing HBM market share in line with our overall DRAM market share.” It further stated that planned 2027 HBM volume was sold out at agreed target prices and targeted HBM4E mass production in H1 2027, followed by a larger H2 ramp.
The transmission mechanism is a stronger competitive alternative for accelerator customers. Successful high-volume commercialization expands customers’ ability to allocate future platforms across suppliers, negotiate specifications, and reduce dependency on a single source. Even without immediate price cuts, a credible additional supplier reduces the value of assuming that a historical technology or qualification advantage will translate into permanent market-share gains.
The evidence is materially stronger than a sample shipment or an announced roadmap because Samsung is reporting substantial realized HBM4 sales. However, its market-share claim lacks an exact percentage and a clear revenue-versus-bit denominator. It therefore does not establish a quantified share loss for either competitor.
Near-term counterevidence is important. Micron already disclosed agreements covering the vast majority of its 2027 HBM bit supply with significant year-over-year price increases. SK hynix reported strong HBM4 commercialization and expected HBM4 to become its mainstream HBM product in Q4. Samsung’s recovery is consequently more likely to affect future allocation and bargaining dynamics than to cancel already-secured peer shipments.
The immediate trading implication is to distinguish an industry-demand thesis from a supplier-dominance thesis. Samsung strengthens the former while challenging the latter. The relevant longer-duration catalysts are HBM4E qualification, production yields, platform allocations, and contract renewals during 2027 and beyond. A direct cut to near-term Micron or SK hynix earnings is not supported by this call alone.
SEMICONDUCTOR EQUIPMENT: PROCESS COMPLEXITY CAN SUPPORT TOOL DEMAND WITHOUT A MATCHING SURGE IN MEMORY BITS (READ-THROUGH 4)
Affected companies: Lam Research (LRCX: United States) and KLA Corporation (KLAC: United States). Direction: positive. Magnitude: high for medium-term demand exposure, but less immediate than the headline capex increase might imply.
Samsung guided to KRW84.4 trillion of 2026 capex, approximately 60% above the implied prior-year level, including KRW76.8 trillion for semiconductors. It also described larger HBM die sizes, a significant increase in metal-process layers, equipment supply constraints, and longer procurement lead times. Management explicitly cautioned that higher spending would not necessarily produce a meaningful near-term increase in bit supply.
This combination is particularly favorable for suppliers monetizing manufacturing complexity rather than simply wafer-start growth. Lam’s deposition, etch, and cleaning systems participate in the additional processing required by advanced DRAM, NAND, and packaging. KLA benefits from the inspection and metrology needed to control defects and protect yields as device value, process complexity, and packaging requirements increase. Equipment demand can therefore rise even when useful semiconductor output expands relatively slowly.
The distinction matters for cross-portfolio positioning. The same technical constraints can support both memory pricing and equipment spending for an extended period. Higher tool spending does not automatically imply imminent memory oversupply when more capital and processing steps are required per unit of saleable output.
Samsung also identified investments across Korea and the US, including Taylor and advanced packaging. This supports geographically diversified production investment, but it does not allocate specific orders to either vendor. Lam’s latest release showed Korea accounting for 20% of revenue, confirming meaningful regional exposure without establishing Samsung’s share of that revenue.
Both companies have already reported their September quarters: Lam on October 21 and KLA on October 28. Samsung’s call therefore corroborates their forward demand environment rather than predicts those results. The next catalysts are equipment shipment conversion, customer installation readiness, and updated 2027 spending plans.
The principal timing risk is that construction, deposits, equipment delivery, installation, and revenue recognition occur at different stages. Taylor equipment installation may reflect orders already placed rather than incremental orders generated by this call. Samsung’s annual capex also includes infrastructure and inflation, not exclusively new tools. The high-conviction positive is greater and more durable equipment intensity; a proportional revenue increase tied to Samsung’s 60% capex growth is not justified.
ADVANCED FOUNDRY: SAMSUNG’S ORDER WINS ARE NOT AUTOMATICALLY A NEAR-TERM NEGATIVE FOR TSMC (READ-THROUGH 5)
Affected company: Taiwan Semiconductor Manufacturing Company (2330: Taiwan). Direction: positive for near-term leading-edge demand and utilization, with a longer-duration competitive qualification. Magnitude: moderate fundamental confirmation; limited incremental trading information because TSMC has already reported.
Samsung expects double-digit foundry revenue growth in Q4 both sequentially and year over year. It expects its number of 2nm projects to more than double in 2026 and described demand exceeding capacity across advanced nodes. Management also anticipates HPC becoming more than 50% of foundry sales, although the timing of that mix objective was not specified precisely.
The high-conviction industry signal is that leading-edge demand is broad enough to support growth at more than a single foundry. Samsung’s wins need not represent production being removed from TSMC when customers are seeking additional capacity in an undersupplied market. The immediate economic channel for TSMC is continued utilization and revenue growth across its established leading-edge manufacturing base.
TSMC’s own October 15 release supports that interpretation. Advanced technologies represented 79% of wafer revenue, including an 8% contribution from 2nm, and management expected continued strong leading-edge demand and a steep 2nm ramp in Q4. Samsung’s commentary independently supports the breadth of that demand.
The competitive qualification belongs primarily to the longer duration. Samsung plans production for major 2nm customers in H2 2027 and is advancing Taylor’s commissioning. Successful yields and qualification could provide customers with greater sourcing flexibility and influence later allocation or pricing discussions. However, project counts are not wafer volumes, and commissioning is not equivalent to qualified commercial output.
Near-term catalysts are TSMC’s monthly revenue progression and delivery against its Q4 outlook. The later catalysts are Samsung’s 2027 commercial ramps and evidence of actual customer production transfers. The call does not support identifying unnamed hyperscalers, assuming specific TSMC programs have been lost, or assigning an immediate foundry price war.
SERVER MEMORY INTERFACES: HIGHER DDR5 PERFORMANCE CREATES A MORE PRECISE SECONDARY BENEFICIARY THAN GENERIC AI EXPOSURE (READ-THROUGH 6)
Affected company: Rambus (RMBS: United States). Direction: positive. Magnitude: moderate at group level and meaningful for the memory-interface product business.
Samsung identified strong RDIMM demand and plans to expand high-performance server DDR5 supply, including products operating at approximately 8,000 megabits per second. Its Q4 outlook also emphasizes new CPU and GPU platforms, while its 2027 strategy continues to prioritize server memory over weaker consumer applications.
Rambus has verified product exposure to this transition through its DDR5 RDIMM 8000 chipset, including a registering clock driver and companion power-management and monitoring devices. As server platforms adopt faster memory modules, the relevant opportunity is an increase in demand for qualified interface products and a shift toward newer generations, not simply higher DRAM prices.
This distinction prevents a common modeling error. Rambus revenue depends on module shipments, populated channels, attached chips, product generation, pricing, and supplier share. A 20% increase in DRAM ASP does not generate a corresponding increase in Rambus chip revenue or licensing income. Higher memory capacity achieved through denser DRAM also does not necessarily require more modules or interface chips.
Rambus reported on October 26 that product revenue reached $114.3 million, approximately 52% of total revenue, and guided Q4 product revenue to $127 million to $133 million. Samsung’s commentary therefore corroborates an already-disclosed product ramp rather than constitutes a new Rambus design win.
The near-term catalyst is Q4 product shipment execution. The longer-duration opportunity is sustained migration to faster DDR5 and more demanding server-memory architectures during 2027. Customer qualification and actual module adoption remain the decisive variables; Samsung did not identify Rambus as the supplier on any specific module.
SMARTPHONES: PERSISTENT MEMORY INFLATION CHALLENGES THE SPEED OF XIAOMI’S MARGIN RECOVERY (READ-THROUGH 7)
Affected company: Xiaomi Corporation (1810.HK: China). Direction: negative for smartphone volumes and the pace of margin recovery. Magnitude: high for the handset business, but moderate and less certain for the diversified group.
Samsung said memory shortages had affected mobile devices since Q4 2025 and that heightened material costs were expected to persist into 2027. It expects smartphone unit declines to remain concentrated in the mid-to-entry segments, even as premium mix and higher selling prices increase market value. Its own MX and Networks businesses remained loss-making despite substantial revenue growth and successful flagship launches.
The transmission mechanism is consumer affordability. A fixed increase in memory cost represents a larger percentage of the selling price of a lower-priced phone. An OEM can absorb the cost and sacrifice margin, raise retail prices and lose volume, reduce specifications, or withdraw lower-return models. These responses can all weaken the economics of an entry- and midrange-heavy portfolio.
Xiaomi’s own recent performance confirms that exposure. Its Q2 smartphone gross margin was 8.5%, compared with 11.5% a year earlier, while handset revenue declined. Contemporaneous reporting identified a particularly large share of Xiaomi shipments below $200. Samsung’s extension of cost pressure into 2027 is therefore relevant to an existing margin-recovery debate rather than an abstract sector risk.
The non-consensus distinction is between slower inflation and actual cost relief. Xiaomi had indicated that the pace of memory-price increases was slowing and that the most difficult period had passed. Samsung’s Q3 ASP increases were indeed slower than its Q2 increases, so the disclosures do not directly contradict that statement. They do challenge any assumption that slowing inflation quickly restores earlier component-cost levels or handset margins.
The near-term catalysts are Xiaomi’s next results, channel sell-through, product pricing, and procurement costs flowing through inventory. The longer-duration risk is a smaller affordable-smartphone market and a more difficult path to replacing lost unit volume with premium products.
The whole-company conclusion must remain narrower than the handset conclusion. EVs, AIoT, and other businesses can offset smartphone pressure, and Samsung’s call does not establish their performance. It supports caution on the speed of phone-margin normalization, not an automatic proportional reduction in Xiaomi’s consolidated earnings.
PERSONAL COMPUTERS: REVENUE GROWTH CAN MASK A DEEP UNIT AND PROFITABILITY PROBLEM (READ-THROUGH 8)
Affected company: HP Inc. (HPQ: United States). Direction: negative for Personal Systems unit demand and margin recovery. Magnitude: high for the PC segment and moderate for consolidated earnings, given the separate contribution from Printing.
Samsung expects further demand adjustment in PC applications during 2027 while maintaining an AI-focused memory supply allocation. It also reported broad memory-price increases and warned that component costs would continue pressuring device profitability. This combination reduces confidence that weaker PC demand alone will rapidly restore favorable component economics.
HP’s latest reported quarter provides a clear illustration of the transmission mechanism. Personal Systems revenue increased 18%, but unit shipments declined 16%, and the segment operating margin was only 4.6%. The divergence demonstrates that nominal revenue strength can reflect higher prices and mix rather than healthy physical demand. It also leaves limited room to absorb further unrecovered cost increases.
An illustrative 100-basis-point increase in costs relative to segment revenue, without offsetting pricing or expense reductions, would consume approximately 22% of operating profit at a 4.6% starting margin. This is a sensitivity, not a forecast. It shows why relatively modest pass-through failures can create material earnings volatility in a low-margin hardware business.
The cash mechanism is also relevant. More expensive components increase the funding required for a given quantity of inventory, while weaker unit demand can complicate sell-through. Suppliers can capture higher prices even when assemblers experience weaker demand and greater working-capital requirements.
Counterevidence prevents an overly broad conclusion. HP reported improved memory supply and fulfillment, positive free cash flow, and raised annual guidance in its latest quarter. Samsung’s call does not invalidate those completed results or establish an immediate earnings miss. It weakens the case for a rapid, uncomplicated normalization in PC economics.
The near-term catalyst is the next results update and the conversion of higher-cost inventory into reported cost of goods sold. The longer-duration issue is whether premium mix, AI PCs, and procurement execution can compensate for sustained affordability pressure through 2027. The most relevant indicators are units, segment margin, and cash conversion, not revenue growth in isolation.
CLOUD INFRASTRUCTURE: MEMORY SCARCITY RAISES THE CASH COST OF AI GROWTH BEFORE IT APPEARS FULLY IN EARNINGS (READ-THROUGH 9)
Affected companies: Amazon.com (AMZN: United States) and Microsoft (MSFT: United States). Direction: negative for capital efficiency and free-cash-flow conversion, all else equal; simultaneously positive confirmation of infrastructure demand. Magnitude: high for incremental infrastructure funding requirements, moderate and uncertain for consolidated earnings.
Samsung expects AI-related memory demand to exceed supply materially in 2027, has allocated its planned 2027 HBM volume at agreed target prices, and continues receiving requests for additional supply. Its storage discussion also indicates that agentic workloads require more infrastructure beyond GPUs, including server DRAM and SSDs.
The transmission mechanism begins with the cost of a deployable system. More expensive memory and storage raise cash investment per server or accelerator configuration. If procurement budgets remain fixed, fewer systems can be purchased; if deployment targets remain fixed, capital spending rises. The expense then enters reported earnings through depreciation over time, meaning free cash flow can weaken before the full effect appears in operating margins.
The important implication is that a larger capex budget does not necessarily represent proportionately more computing capacity. Part of the increase may pay for higher component prices, additional memory content, or infrastructure needed to support persistent agent workloads. Assessing AI productivity from nominal capital expenditure alone therefore risks overstating physical capacity growth.
Amazon’s last reported quarter demonstrated this funding tension. AWS revenue increased 37%, while trailing-12-month group operating cash flow rose to $161.4 billion, yet trailing free cash flow was negative $7.6 billion as property and equipment investment increased. Samsung’s disclosure reinforces scrutiny of the funding and return requirements behind AWS expansion. Amazon’s October 29 earnings call, scheduled after the US market close, is the immediate catalyst for updated spending, capacity, and cash-flow expectations.
Microsoft’s October 28 release provides an important counterweight to a broad cloud-short thesis: Azure revenue increased 48%. Samsung’s commentary supports the existence of strong infrastructure demand rather than undermines that demand. The negative read-through is the cost of serving additional workloads and the return required on incremental infrastructure, not a conclusion that cloud revenue growth must disappoint.
Multiyear supply agreements can improve deployment certainty but may introduce additional funding or pricing commitments. Samsung did not identify Amazon or Microsoft as parties to its agreements, so specific prepayments or contractual liabilities cannot be assigned to either company. Likewise, a memory supplier’s sold-out status does not prove that a cloud operator has all the power, networking, accelerators, and other components required to bring capacity online.
The longer-duration catalyst is whether monetization, utilization, and efficiency improvements outpace the rising cost of infrastructure during 2027 and 2028. Higher supplier profits and higher customer revenue can coexist, but durable shareholder value requires the customer’s incremental cash returns to justify the expanded asset base.
CROSS-PORTFOLIO IMPLICATION
The strongest relative fundamental signal favors scarce memory and the technologies required to manufacture it over price-sensitive device assembly. However, positions in memory producers, equipment suppliers, memory-interface vendors, and cloud infrastructure are not independent diversification: they remain linked to the same AI investment cycle. Their exposures differ primarily in who captures pricing, who funds capacity, and when cash spending becomes revenue or expense. The most useful risk distinction is therefore not simply “AI beneficiary” versus “AI loser,” but pricing power versus component-cost absorption, contracted demand versus speculative capacity, and cash returns versus nominal revenue growth.
SOURCE SCOPE
The analysis uses the supplied Samsung call and accompanying financial material, supplemented by contemporaneous company disclosures and selected reporting to verify peer exposure and reporting status. Archived-memory search was unavailable because of an embedding-provider error; recovery requires checking that provider’s configuration. No archived-memory evidence was used.
Report record
- Sector
- Information Technology
- Industry
- Semiconductors
- Fiscal period end
- September 30, 2026
- Report date
- October 28, 2026
- Analysis
- 7457 words
- Read-throughs
- 3704 words
- Content fingerprint (PDF)
3e034815042b- Content fingerprint (analysis)
9ff30e9aae23- Content fingerprint (read-throughs)
06c0c9068218
Prepared from the company's earnings release and earnings call transcript. Figures as reported by the company. For information only. Not investment advice.
More from Samsung Electronics
No other reports yet.
All Samsung Electronics reports
More in Information Technology
Higher normalized earnings power, with the headline margin and EPS flattered by nonrecurring benefits
Strong operationally, but less convincing on the durability and composition of future growth
All Information Technology reports
Follow @AtlasPeakRes on X for new earnings reports as they publish.