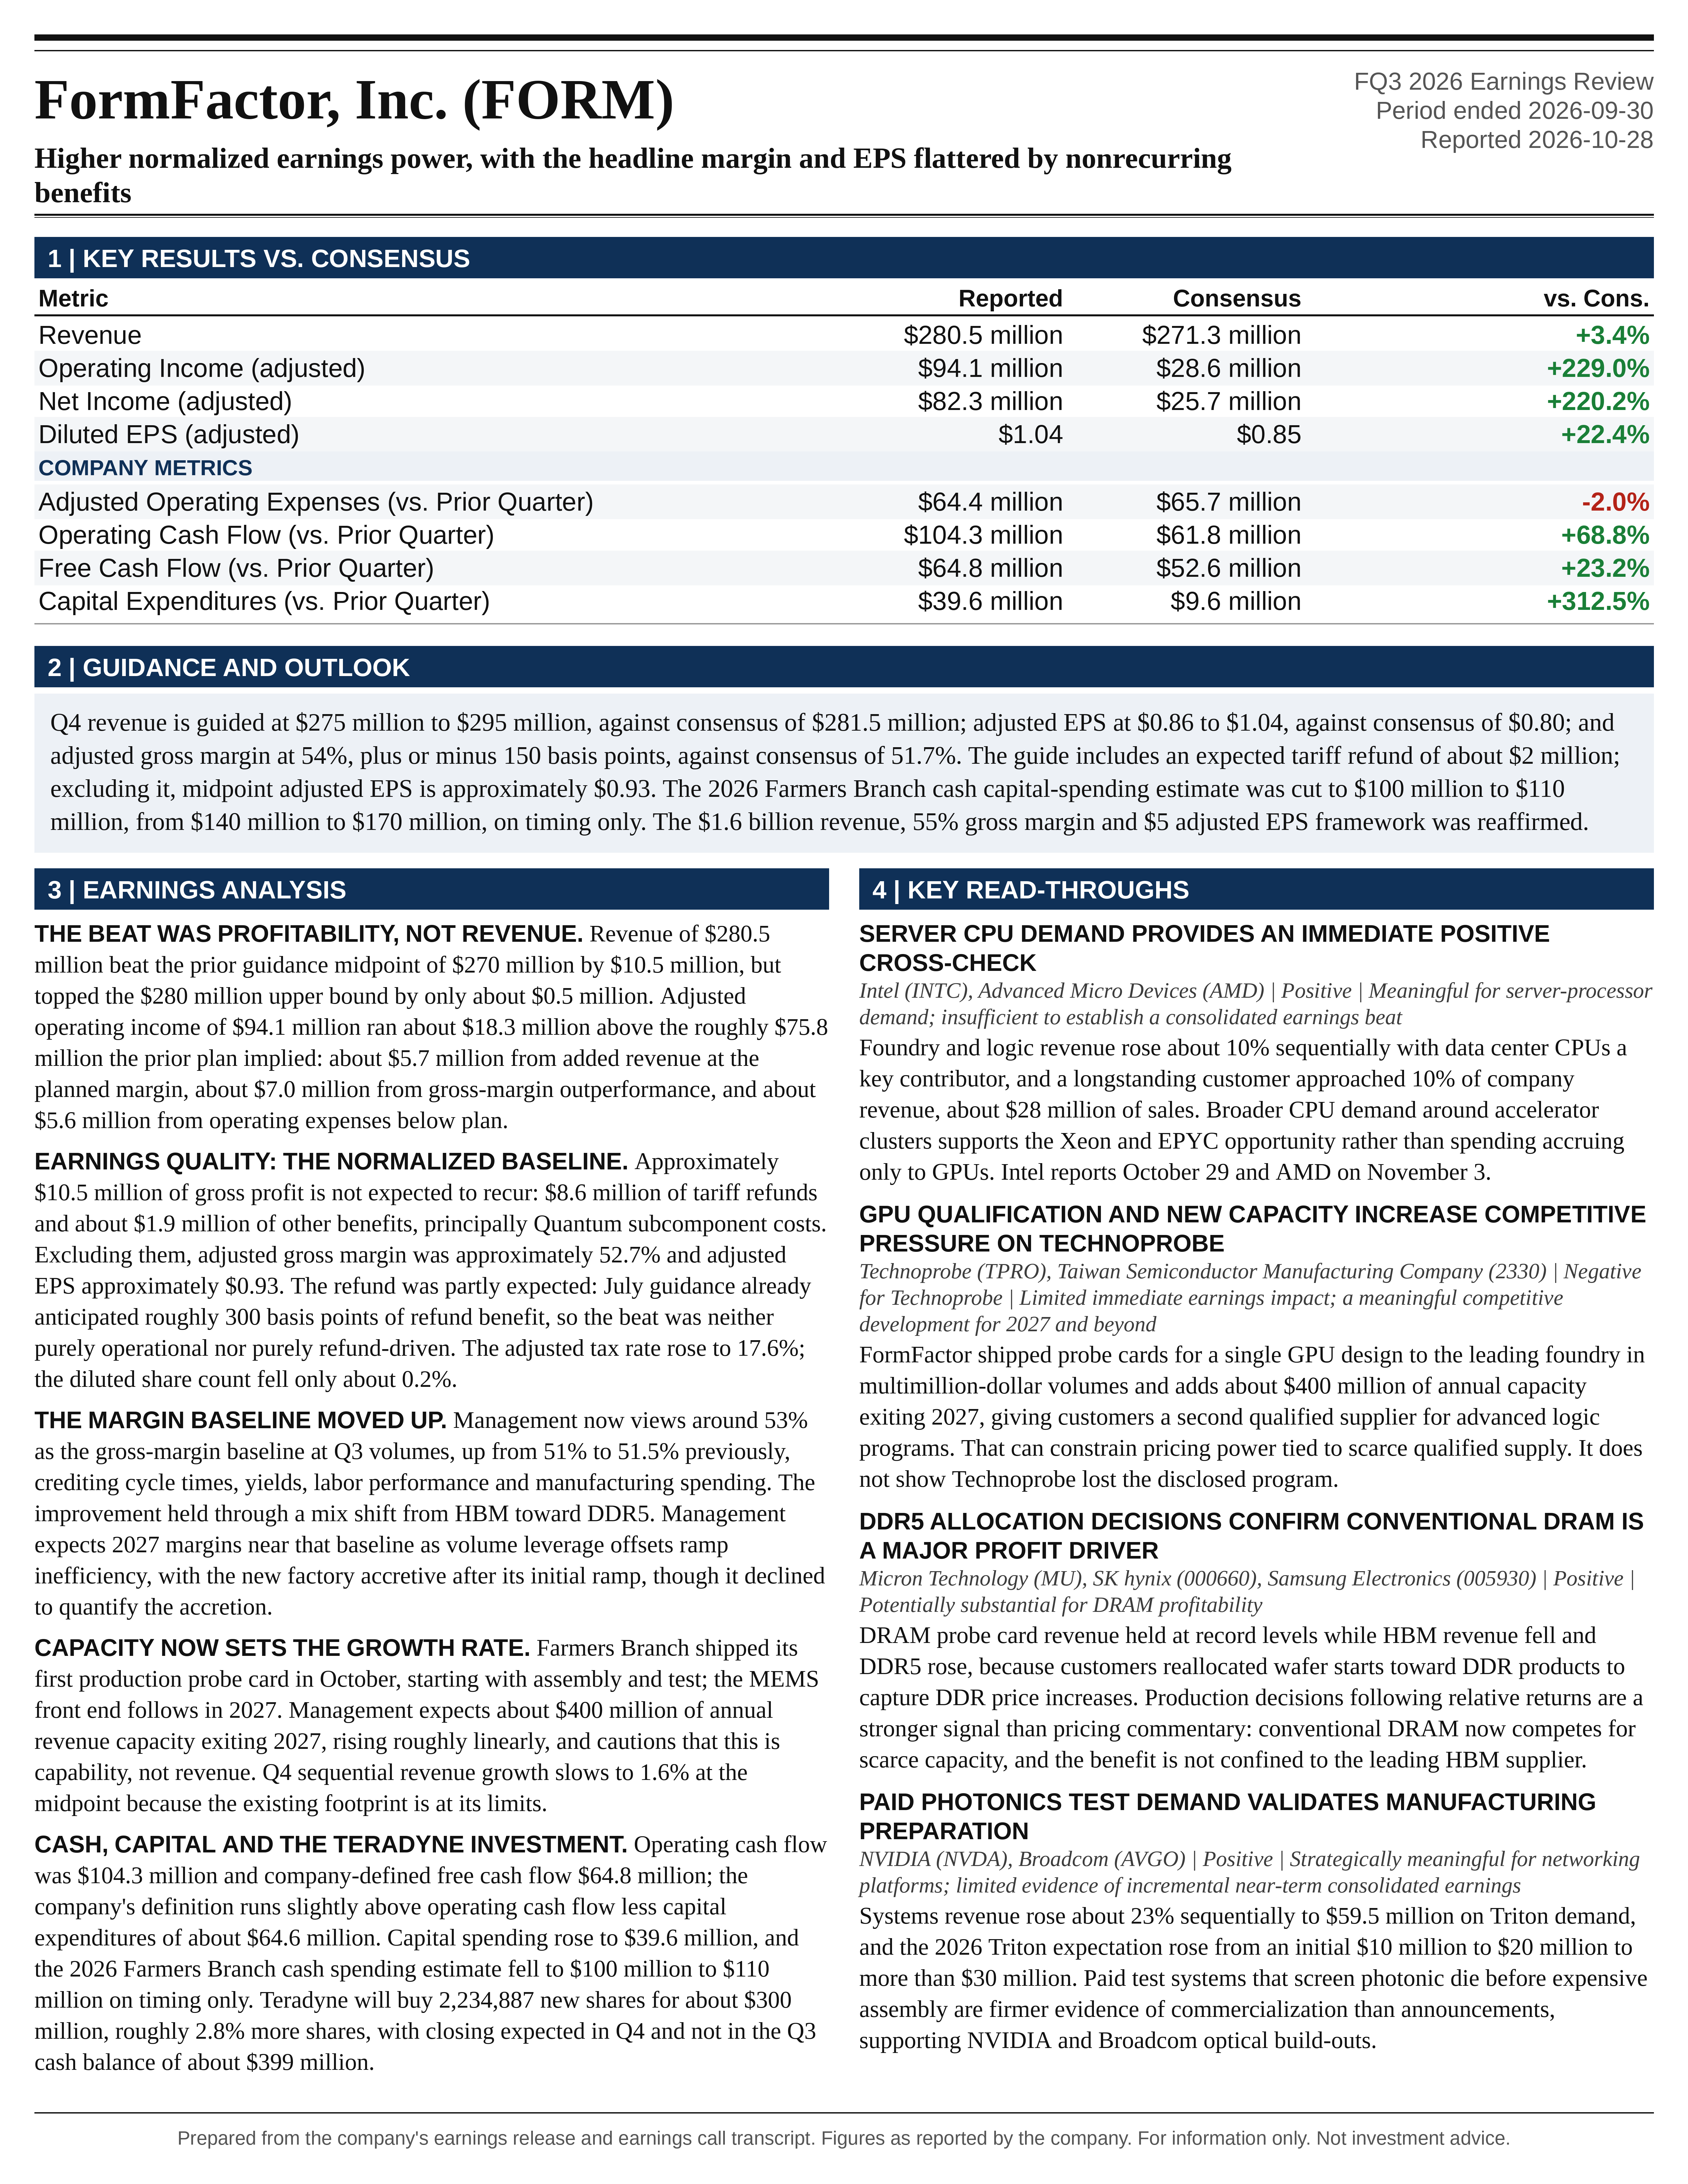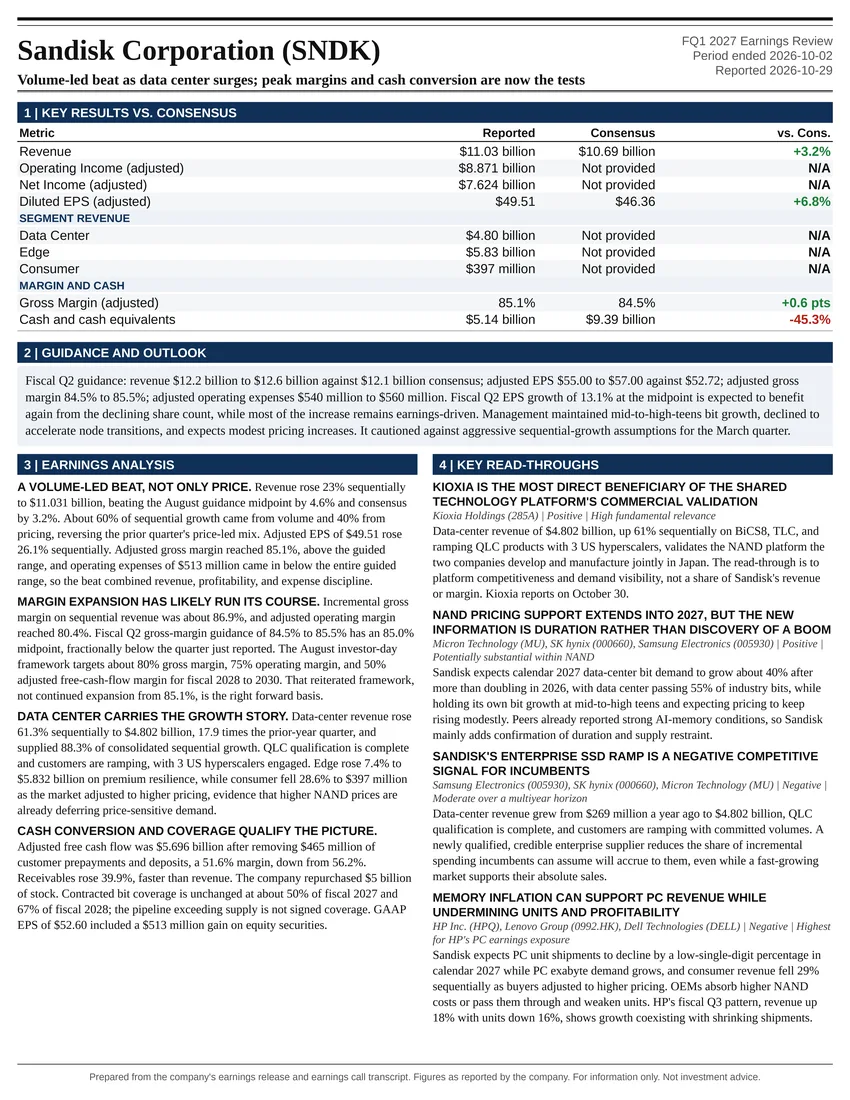
Volume-led beat as data center surges; peak margins and cash conversion are now the tests
Earnings Reports
FormFactor, Inc. FQ3 2026 Earnings Report
FormFactor, Inc. (FORM) FQ3 2026 earnings: Higher normalized earnings power, with the headline margin and EPS flattered by nonrecurring benefits. Full earnings analysis, key read-throughs, and the one-page exhibit from Atlas Peak Research.
FormFactor, Inc. (FORM)
Sector: Information Technology · FQ3 2026 · Period end September 30, 2026 · Reported October 28, 2026
FormFactor’s Q3 2026 results support higher normalized earnings expectations and a constructive fundamental assessment, but not extrapolation of the reported 56.5% gross margin or $1.04 adjusted EPS.
Download the one-page report (PDF)
View one-page exhibit
Download analysis (.md)
Download read-throughs (.md)
Post to X
One-Page Exhibit
Earnings Analysis
EXECUTIVE CALL SUMMARY: FormFactor, Inc. (10/28/26)
FormFactor’s Q3 2026 results support higher normalized earnings expectations and a constructive fundamental assessment, but not extrapolation of the reported 56.5% gross margin or $1.04 adjusted EPS. The central investment development was an improvement in underlying manufacturing economics, accompanied by initial commercial penetration of important GPU designs and the first production shipment from Farmers Branch. Approximately $10.5 million of nonrecurring gross-profit benefits materially enhanced reported profitability. Excluding those benefits, adjusted gross margin was approximately 52.7% and adjusted EPS approximately $0.93. Those normalized results remain strong, but they establish a materially different earnings baseline from the headline figures.
Revenue of $280.5 million increased 8.6% sequentially and 38.4% year over year. Adjusted EPS exceeded the supplied Bloomberg consensus by 22.4%, while revenue exceeded consensus by 3.4%. The disproportionate earnings outperformance reflected better manufacturing efficiency, favorable discrete items and operating expenses below the prior plan. Importantly, substantial tariff refunds were already anticipated in management’s Q3 guidance. The quarter therefore cannot be characterized either as an entirely operational earnings beat or as an entirely refund-driven beat. Both the expected benefit embedded in guidance and the incremental operational improvement must be recognized.
The forward outlook is stronger than consensus but restrained by capacity. Q4 revenue guidance of $275 million to $295 million has a midpoint only 1.6% above Q3, despite management’s description of broad demand strength. Adjusted EPS guidance of $0.86 to $1.04 compares favorably with Bloomberg consensus of $0.80. After removing the expected Q4 tariff refund, midpoint EPS is approximately $0.93, essentially unchanged from normalized Q3 earnings. The near-term financial trajectory is therefore better described as strong recurring profitability approaching a production ceiling than as continued sequential earnings acceleration.
Farmers Branch is now the principal determinant of incremental earnings revisions. Management expects approximately $400 million of annual probe-card revenue capacity at the end of 2027, with capacity increasing approximately linearly during the year. That is neither $400 million of recognized 2027 revenue nor a guaranteed revenue commitment. The first production shipment reduces initial commissioning risk, but manufacturing transfer, MEMS front-end qualification, customer acceptance, yield development and utilization remain material execution variables.
The appropriate investment stance is constructive on the operating franchise and disciplined on valuation. The call strengthens confidence that FormFactor can sustain substantially better profitability than its historical model, while broadening its participation across CPUs, GPUs, custom ASICs, memory and photonics. It does not eliminate semiconductor cyclicality, establish that every qualified design will reach meaningful production, or justify valuing temporary refunds as recurring earnings. The most consequential upcoming evidence will be incremental saleable output from Farmers Branch, approximately 53% underlying gross margins during the ramp, and conversion of GPU and ASIC qualifications into diversified production revenue.
QUARTERLY PERFORMANCE AND THE SOURCES OF OUTPERFORMANCE
Q3 revenue increased from $258.2 million in Q2 and $202.7 million in Q3 2025 to $280.5 million, producing the company’s 4th consecutive quarterly revenue record. Against the prior revenue guidance midpoint of $270 million, the beat was $10.5 million, or 3.9%. Against the $280 million upper bound, however, the beat was only approximately $0.5 million. This distinction matters: the reported results were exceptional primarily because of profitability and earnings conversion, rather than a dramatic overshoot of the anticipated revenue range.
The supplied Bloomberg notice shows revenue consensus of $271.3 million, adjusted EPS consensus of $0.85 and adjusted gross-margin consensus of 53.8%. Actual revenue exceeded consensus by approximately $9.2 million, adjusted EPS exceeded consensus by $0.19, and adjusted gross margin exceeded consensus by 270 basis points. Against management’s previous adjusted EPS guidance of $0.86, plus or minus $0.09, actual EPS exceeded the midpoint by $0.18 and the upper bound by $0.09. The prior adjusted gross-margin midpoint was 54%, with an upper bound of 55.5%.
Historical earnings growth was substantial. Adjusted EPS increased from $0.33 in Q3 2025 to $1.04, while GAAP EPS increased from $0.20 to $0.93. Adjusted net income increased from $25.7 million to $82.3 million. Adjusted operating income increased from $28.6 million to $94.1 million, with operating margin expanding from approximately 14.1% to 33.5%. These comparisons demonstrate a genuine change in earnings capacity, although the current-quarter discrete benefits inflate the apparent magnitude.
Sequentially, adjusted operating income increased approximately 30.7% on 8.6% revenue growth. Adjusted operating expenses declined from $65.7 million to $64.4 million, despite higher factory preproduction spending. Operating expenses fell from approximately 25.4% of revenue to 23.0%. That combination produced unusually high incremental operating profit, but the resulting incremental margin should not be extrapolated because it includes discrete gross-profit benefits and a sequential decline in operating expenses.
The release also indicates that taxes were not responsible for the sequential EPS acceleration. The adjusted effective tax rate increased to 17.6% from approximately 16.2% in Q2, calculated from the release’s reconciliation. Diluted shares declined only approximately 0.2% sequentially. Earnings growth was therefore predominantly attributable to operating improvement and discrete gross-profit benefits, rather than a lower tax rate or material share-count reduction.
EARNINGS QUALITY AND THE NEW GROSS-MARGIN BASELINE
The most important financial distinction is between the reported 56.5% adjusted gross margin and the approximately 53% operating baseline. Management identified approximately $10.5 million of benefits that were not expected to recur, including $8.6 million of tariff refunds and approximately $1.9 million of other benefits, principally associated with favorable Quantum-business subcomponent costs. These items were retained in company-reported non-GAAP earnings. Non-GAAP classification therefore did not make the reported quarter fully representative of recurring profitability.
Subtracting $10.5 million from reported adjusted gross profit of approximately $158.5 million produces normalized gross profit of approximately $148.0 million and a gross margin of approximately 52.7%. Applying the reported 17.6% adjusted tax rate to the excluded benefits produces approximately $8.7 million of after-tax benefit, or approximately $0.11 per diluted share. Normalized adjusted EPS was consequently approximately $0.93. This is an analytical normalization, not a separately reported company metric, and assumes the quarter’s adjusted tax rate is appropriate for the excluded items.
Management explicitly quantified the tariff contribution at approximately $0.09 per share. The remaining discrete benefits account for approximately $0.02 per share under the same tax assumption. Annualizing reported Q3 EPS would therefore imply approximately $4.16, whereas annualizing the normalized result produces approximately $3.71. Neither is a full-year forecast, but the difference illustrates the valuation error that would result from treating the headline quarter as a clean earnings base.
The underlying improvement remains significant. McKinnis stated, “We now view around 53% as the gross margin baseline at Q3 volumes.” In Q&A, that baseline was compared with 51% to 51.5% discussed previously. The improvement is approximately 150 to 200 basis points, despite a DRAM mix shift away from HBM toward DDR5. Management attributed the change to better cycle times, yields, labor performance, manufacturing spending and other production costs. The evidence supports a stronger operating model, although the baseline remains explicitly conditional on Q3-level production volumes.
The distinction between normalization and surprise attribution is particularly important. The July earnings call already anticipated approximately 300 basis points of Q3 tariff-refund benefit. Consequently, removing the entire $8.6 million refund from the earnings surprise would overstate the extent to which unexpected items drove outperformance. Management’s prior plan already included a substantial refund. The relevant comparison is the change from the refund benefit assumed in that plan, plus the additional Quantum-related benefits and the operational variance. The precise refund assumptions embedded in Bloomberg consensus were not provided, preventing an exact recurring-versus-discrete decomposition of the consensus beat.
The prior management plan provides a useful operating bridge. Revenue of $270 million, gross margin of 54% and operating expenses of $70 million implied adjusted operating income of approximately $75.8 million. Actual adjusted operating income was $94.1 million, approximately $18.3 million higher. Mechanically, approximately $5.7 million came from additional revenue valued at the planned margin, approximately $7.0 million from gross-margin outperformance on actual revenue, and approximately $5.6 million from lower operating expenses. This bridge confirms that expense discipline and production economics were important contributors independently of the anticipated refunds.
The supplied transcript contains an inconsistent passage describing gross margin excluding discrete benefits as between 52.5% and 58%. That range is not supported by the disclosed arithmetic or the subsequent explicit 53% baseline. The approximately 52.7% calculation and management’s repeated 53% characterization provide the internally consistent basis for analysis.
Q4 GUIDANCE AND FULL-YEAR IMPLICATIONS
Q4 revenue guidance is $285 million, plus or minus $10 million. The midpoint exceeds Bloomberg consensus of $281.5 million by approximately $3.5 million, or 1.2%. Adjusted EPS guidance is $0.95, plus or minus $0.09, with the midpoint 18.8% above consensus of $0.80. Even the EPS lower bound exceeds consensus. Adjusted gross-margin guidance of 54%, plus or minus 150 basis points, also exceeds the 51.7% consensus estimate across the entire guided range.
The revenue outlook is less emphatic than the earnings outlook. Sequential revenue growth at the midpoint slows to 1.6%, compared with 8.6% in Q3 and 14.2% in Q2. Management directly connected that moderation to manufacturing limitations. McKinnis stated, “We’re operating kind of at the limits of what our current footprint can do.” This explanation is consistent with the company’s strong demand commentary and extensive discussion of capacity, but it remains management’s assessment rather than independently quantified demand visibility. No backlog, book-to-bill ratio or committed utilization schedule was provided.
The expected approximately $2 million Q4 tariff refund contributes approximately 70 basis points to midpoint gross margin. Removing it reduces the 54% margin outlook to approximately 53.3%. Depending on the eventual diluted share count and tax rate, the refund contributes approximately $0.02 to EPS, leaving normalized midpoint EPS near $0.93. The apparent decline from reported Q3 EPS of $1.04 to Q4 guidance of $0.95 is therefore substantially explained by the reduction in discrete benefits, rather than a comparable deterioration in underlying earnings.
The operating-income bridge is consistent with that interpretation. Q4 midpoint revenue, gross margin and operating expenses imply approximately $84.9 million of adjusted operating income. Excluding the refund produces approximately $82.9 million, compared with approximately $83.6 million in normalized Q3 operating income. Recurring operating profit is effectively flat, while recurring operating margin declines modestly because operating expenses rise faster than revenue.
Q4 adjusted operating expenses are expected to increase to approximately $69 million, plus or minus $2 million, from $64.4 million in Q3. Importantly, this occurs despite some factory costs moving out of operating expenses. Excluding the approximately $5 million of Farmers Branch costs expected to remain in operating expenses, the Q4 midpoint implies approximately $64 million of other operating expenses, compared with approximately $58 million in Q3 after excluding its $6.4 million of factory preproduction costs. The unusually low Q3 expense base should therefore not be treated as permanently fixed.
The published 9-month revenue total of $764.9 million, combined with Q4 guidance, implies full-year revenue of approximately $1.040 billion to $1.060 billion, with a midpoint near $1.050 billion. The $1 billion milestone is therefore supported even at the low end of the revenue range. Adding the reported 9-month adjusted EPS of $2.42 to Q4 midpoint guidance produces approximately $3.37, although actual full-year EPS will depend on annual weighted-average shares, including the timing of the Teradyne issuance.
The Q4 outlook is new guidance for a new period, not a revision to an earlier Q4 range presented in the supplied materials. The explicit comparable-period changes elsewhere in the call are the higher 2026 Triton expectation and lower 2026 cash capital-spending estimate. The long-term $1.6 billion revenue, 55% gross-margin and $5 adjusted EPS framework was reiterated, not formally increased or accelerated.
FARMERS BRANCH: CAPACITY, TIMING AND EXECUTION RISK
Farmers Branch crossed an important operational milestone with qualification of its assembly and test operations and shipment of its first production probe card. Management had previously expected initial revenue near the end of 2026 or beginning of 2027. The October shipment represents a modest acceleration of first revenue, not evidence that the entire factory buildout or all customer qualifications have been pulled forward by a similar interval.
The initial production scope is narrower than a fully integrated factory. Slessor explained that the facility is initially ramping assembly and test for foundry and logic products, with the MEMS front end to be added during 2027. The distinction is material because assembly and test qualification does not prove readiness across the complete manufacturing process. The remaining front-end ramp introduces additional equipment, process-transfer, yield and customer-qualification dependencies.
Management expects approximately $400 million of annual probe-card revenue capability exiting 2027. McKinnis explicitly cautioned, “That’s a capability exit, not necessarily the revenue.” This statement should govern financial modeling. An annualized exit capability measures potential production at the end of the ramp. It does not establish sales recognized during the ramp, utilization, customer acceptance, shipment timing or incremental consolidated revenue.
A perfectly linear increase from approximately $0 to $400 million of annual capacity over 2027 would provide approximately $200 million of production opportunity during the year. Under a continuous linear approximation, the quarterly capacity-equivalent amounts would be approximately $12.5 million, $37.5 million, $62.5 million and $87.5 million. These are illustrative mathematical implications, not management revenue forecasts. They demonstrate why the expansion provides considerably more relief in the 2nd half than in Q1.
Even that approximately $200 million opportunity should not automatically be added to the existing business. Some production will be transferred from existing locations, qualification can lag installed capacity, and capacity utilization depends on the timing of customer demand. Foundry and logic transfers are expected to free DRAM capacity at Livermore, creating a broader network benefit. However, transferred production, newly available DRAM capacity and Texas capacity cannot all be counted as independent incremental revenue without a consolidated manufacturing bridge.
The customer-selection strategy is pragmatic. Management intends to prioritize customers with practical, aggressive qualification schedules rather than leave capacity idle during prolonged acceptance processes. This should improve early utilization, but it also makes the ramp sensitive to individual customer readiness. Maintaining product quality while accelerating qualifications is essential because probe reliability, contact performance and test repeatability affect customer yield interpretation and production economics.
The investment implication is that the main constraint has shifted. The company has demonstrated an ability to extract more output from its existing footprint, but management now describes those gains as increasingly difficult to repeat. Future growth depends more heavily on delivering new manufacturing capacity than on continued optimization of the old footprint. The risk profile consequently shifts from demand conversion within proven facilities toward commissioning, qualification and utilization of a new manufacturing platform.
GROSS-MARGIN EXPECTATIONS DURING THE FACTORY RAMP
Management expects 2027 gross margins to remain near the current approximately 53% baseline as higher volumes and operational efficiency offset temporary ramp inefficiencies. This is a constructive commitment because new factories typically generate underabsorption, training costs, duplicate processes and immature yields. It is not a commitment to sustain the reported 56.5% Q3 margin, nor is it guidance for immediate achievement of the long-term 55% target.
The 53% expectation also contains an important economic tradeoff. Growth-related operating leverage is expected to be consumed partly by ramp costs rather than flow entirely into higher gross margins. Revenue growth can therefore remain attractive while gross margins appear flat. Conversely, a slower ramp can affect both the numerator and denominator: fewer shipments reduce absorption while staffing and other fixed costs continue.
Accounting classification will complicate sequential comparisons. Q3 included approximately $6.4 million of preproduction costs in operating expenses. In Q4, management expects approximately $5 million of startup costs in cost of revenues and approximately $5 million remaining in operating expenses. At $285 million of revenue, $5 million is equivalent to approximately 175 basis points of gross margin. Moving an expense between these categories changes gross margin and operating-expense ratios but does not, by itself, change operating profit or cash generation.
The combined Q4 factory-cost expectation is approximately $10 million across the income statement, above Q3’s approximately $6.4 million. It would therefore be incorrect to interpret the transition as a simple disappearance of startup expense or to add back the operating-expense reduction while ignoring the corresponding cost-of-revenue burden. The economically relevant measures are total factory spending, incremental gross profit from saleable output and consolidated operating income.
Management expects the factory to be gross-margin accretive after the initial ramp is complete. However, it declined repeated requests to quantify the eventual accretion or provide a detailed bridge of 2027 headwinds and offsets. That limits precision. The call supports a stable underlying 2027 margin framework and eventual accretion, but not a specific standalone factory margin, quantified project return or predetermined post-ramp margin step-up.
FOUNDRY AND LOGIC: BROADER DEMAND AND EARLY SHARE-GAIN EVIDENCE
Foundry and logic revenue increased approximately 10% sequentially, and management expects further growth in Q4. The demand base includes PCs, mobile, data-center CPUs and networking, with incremental opportunities in GPUs and hyperscaler custom ASICs. The call therefore describes a broader driver set than a narrow GPU-only recovery.
Data-center CPU demand was identified as a particularly important contributor. Management described a longstanding customer approaching 10% of company revenue in Q3 and potentially exceeding that threshold in Q4, alongside exposure to fabless x86 and ARM-based processors. The customer was not explicitly identified in that discussion. At current company scale, a 10% customer represents approximately $28 million of quarterly revenue, making renewed CPU strength financially meaningful.
The GPU disclosure was commercially significant: FormFactor shipped probe cards for a single GPU design to the leading foundry in multimillion-dollar volumes. This demonstrates progression beyond an exclusively developmental relationship into an initial production program. Nevertheless, the disclosure establishes neither broad penetration across GPU architectures nor a quantified share position. Management expects meaningful gains in 2027, but those gains remain dependent on capacity and subsequent customer production ramps.
Custom ASIC progress is similarly encouraging but not fully quantified. Slessor stated that the company had qualified and shipped multiple units, while remaining constrained by “our ability to produce in volume.” The response did not provide customer-specific production revenue, a design count, contracted capacity or a confirmed qualification timetable for the Google TPU opportunity referenced by the analyst. Initial shipments and qualification progress should therefore be separated from large-volume commercial adoption.
The technical argument for stronger probe-card content is credible. Higher interface speeds, power density and advanced chiplet packaging increase demands on electrical performance, contact density, current delivery and test integrity. Early identification of defective die becomes more valuable as downstream assembly combines expensive components. However, the claim that advanced MEMS technology is a requirement for cost-effective testing is management’s competitive positioning, not proof that FormFactor uniquely captures the entire opportunity.
TSMC-related business diversification is favorable but incomplete as a risk mitigant. Management described a progression from mobile application processors toward a broader mix of high-performance-compute projects and Triton systems. That reduces dependence on an individual program within the customer relationship. It does not remove concentration in the foundry ecosystem, common process-node transitions, geopolitical exposure or the ultimate capital-spending budgets funding those designs.
DRAM, HBM AND THE IMPORTANCE OF MIX RESILIENCE
DRAM revenue was essentially unchanged from Q2’s record level, but the composition shifted materially from HBM toward DDR5. Management attributed the change to customers reallocating wafer starts toward DDR products to capture attractive pricing and profitability. Because probe cards are specific to customer chip designs, the company’s product mix changes with those production decisions.
The main positive signal is that strong profitability was maintained during a less favorable DRAM mix. Historically, the company’s gross margin was more dependent on the proportion of higher-margin products. Management now argues that manufacturing cost reductions have improved DRAM economics sufficiently to reduce company-level mix sensitivity. Slessor stated that there was “very little contribution for price increases” in the DRAM margin improvement.
That characterization matters because manufacturing-cost improvement is generally more defensible than a temporary scarcity-driven price increase. Better yields, shorter cycle times and more efficient resource use can persist beyond the current DRAM pricing environment. However, the company did not quantify standalone DDR5 margins, HBM margins or the remaining gap between DRAM and foundry and logic. Record consolidated margins, particularly when enhanced by refunds, do not establish the exact magnitude of DRAM-specific improvement.
The HBM decline should not automatically be interpreted as evidence of weakening structural HBM demand. Management described a product-allocation decision within a constrained DRAM market and pointed to HBM4E and HBM5 design activity. Conversely, design-funnel commentary is not equivalent to committed production revenue. The appropriate conclusion is that the quarter’s HBM mix decline appears consistent with customer production optimization, while the longer-term demand claim still requires confirmation through future shipments.
Management’s response to HBM destacking was also more nuanced than a simple content-loss narrative. FormFactor has differentiation in final stack testing. Holding the total number of memory die constant, moving from 12-high stacks to 8-high stacks would increase completed stack count by 50%. That can increase final-stack test opportunities even though each stack contains fewer die. This is a conditional physical relationship, not a forecast for probe-card revenue: total die demand, installed capacity, parallelism, test time and card reuse can all change.
The question about lower per-pin speed requirements did not produce evidence of an imminent adverse specification change. Management instead emphasized increasing performance requirements across the HBM4E and HBM5 roadmap. Higher speed can support differentiation, but test intensity cannot be inferred from pin speed alone. Interface width, parallel test architecture, contact count, signal integrity and qualification requirements also influence probe-card value and productivity.
PHOTONICS AND SYSTEMS: A GROWING CONTRIBUTOR, NOT YET THE DOMINANT BUSINESS
Systems revenue reached $59.5 million, increasing $11 million, or approximately 22.7%, sequentially. This represented approximately 21.2% of consolidated revenue and almost 49% of the company’s sequential revenue increase. Systems was therefore a major contributor to quarterly growth despite remaining smaller than Probe Cards. Probe Cards revenue, calculated as consolidated revenue less Systems, was approximately $221.0 million, increasing approximately 5.4% sequentially.
Systems gross margin increased to 61%, with management attributing approximately half of the sequential improvement to volume leverage and the remainder to benefits not expected to recur. The company did not disclose a sufficiently detailed segment allocation of the discrete items to establish a precise recurring Systems margin. The appropriate conclusion is that Systems profitability improved materially, but 61% should not be treated as a durable segment baseline.
Triton expectations have increased substantially during 2026. Management began the year expecting $10 million to $20 million and now expects more than $30 million. Relative to the original $15 million midpoint, the current expectation is more than 100% higher; relative to the original upper bound, it is more than 50% higher. However, the July call had already raised expectations above $20 million and anticipated reaching approximately $20 million by the end of Q3. The current update is an additional increase, not the entirety of the improvement from the original annual plan.
The CEO explicitly corrected the premise that Triton had generated a meaningful prior-year revenue base. Triton revenue was $0 in 2025. Growth into 2026 should therefore be described as initial commercialization to more than $30 million, not approximately 4x growth from a prior-year sales base. At a $30 million reference level, Triton represents approximately 2.9% of implied 2026 company revenue. It is strategically important and potentially fast-growing, but it is not yet the dominant consolidated earnings driver.
The company’s positioning in test insertion 1 is strategically attractive. Testing photonic integrated circuits before combining them with electronic integrated circuits helps establish known-good die and avoid integrating defective components into more expensive assemblies. This creates a common economic rationale across CPO and NPO architectures. Exposure to pluggables further broadens the application set, although management clarified that some pluggable opportunities use derivative technology rather than the Triton system itself.
The architecture breadth reduces dependence on a single packaging outcome, but not all concentration has been removed. Management acknowledged that current CPO demand is dominated by a single ecosystem. Its assertion that photonics adoption is “a question of when and not if” expresses confidence in the technology’s long-term role, not certainty regarding deployment schedules. Customer rollout timing, test duration, optical coupling efficiency, yields and system productivity can all produce uneven equipment orders.
Triton’s manufacturing model is less vertically integrated than the probe-card business. Management described integration and assembly of externally sourced subcomponents and stated, “We do not expect capacity to be a constraint on the growth of that business.” This creates a potential growth outlet while probe-card capacity remains constrained. It does not eliminate supplier availability, qualification, integration or customer-acceptance risk.
The approximately $400 million served-market opportunity referenced for 2030 is a market estimate, not company revenue guidance. The call did not specify future market share, installed-base monetization, recurring revenue content or the economics of replacement demand. Tighter integration of Keystone Photonics may improve control of differentiated optical coupling technology and system performance, but its incremental financial contribution was not quantified.
TERADYNE: STRATEGIC VALIDATION, FUNDING AND DILUTION
The expanded Teradyne collaboration strengthens FormFactor’s position within the semiconductor-test ecosystem. Together with the existing Advantest partnership, it supports interoperability with both leading ATE suppliers. The strategic benefit is broader access to customer qualification workflows and coordinated development across high-performance compute, advanced packaging, HBM and silicon photonics.
The open-ecosystem emphasis is commercially important. Customers retain the ability to choose probe cards and testers suited to their architectures rather than being compelled into a single integrated combination. This can support FormFactor’s independent role and reduce integration friction. However, the collaboration does not disclose purchase commitments, guaranteed attach rates or minimum revenue. Strategic endorsement should not be treated as contracted demand.
The October 13 Form 8-K provides financing detail absent from the call. Teradyne agreed to purchase 2,234,887 newly issued common shares for approximately $300 million, implying approximately $134.24 per share. Relative to Q3 diluted weighted-average shares, the issuance represents approximately 2.8% additional shares before subsequent equity-compensation effects. The financing strengthens liquidity but must be reflected in per-share earnings estimates.
The announcement and filing described the investment as subject to closing conditions, with closing expected in Q4. The Q3 cash balance therefore does not include the $300 million. Adding the proceeds to September cash produces a conditional pro forma liquidity illustration, not a reported quarter-end balance or independent confirmation of closing.
The investment’s greatest immediate value is financial flexibility rather than removal of a funding emergency. FormFactor already had a substantial net-cash position and strong cash generation. The proceeds can support manufacturing investment and targeted acquisitions, but cannot independently accelerate equipment qualification, workforce learning or customer acceptance. Management’s unchanged capital-allocation priorities also leave open the possibility that some capital will fund acquisitions rather than the existing factory program.
CASH FLOW, CAPITAL SPENDING AND BALANCE-SHEET QUALITY
Q3 operating cash flow was $104.3 million, increasing from $61.8 million in Q2 and $27.0 million a year earlier. Company-defined free cash flow was $64.8 million, compared with $52.6 million sequentially and $19.7 million a year earlier. Free cash flow represented approximately 23.1% of revenue and 78.7% of adjusted net income, despite a significant increase in capital spending.
The company’s free-cash-flow definition is slightly broader than operating cash flow less capital expenditures. Q3 operating cash flow of $104.270 million, less $39.648 million of capital expenditures, plus $0.075 million of acquisition-related working-capital payments and $0.081 million of cash interest, reconciles to reported free cash flow of $64.778 million. Conventional operating cash flow less capital expenditures was approximately $64.6 million. The difference is small, but the distinction matters for precise comparisons.
Capital expenditures increased from approximately $9.6 million in Q2 to $39.6 million in Q3. Consequently, approximately $30.0 million of the $42.5 million sequential operating-cash-flow increase was absorbed by additional capital spending. The remaining increase supported higher free cash flow. This is consistent with a company generating cash while entering a more capital-intensive expansion phase.
Working-capital indicators were generally constructive but not sufficient to establish a complete recurring cash-conversion bridge. Accounts receivable declined approximately $3.1 million despite higher revenue, while inventory increased approximately $8.2 million. Deferred revenue increased approximately $12.6 million. The latter can support cash flow but is not equivalent to an independently disclosed order backlog. The release does not establish a precise cash normalization for the tariff refunds or isolate every working-capital timing effect.
The reduction in 2026 Farmers Branch cash capital-expenditure guidance is primarily a timing change. The new range is $100 million to $110 million, compared with $140 million to $170 million previously. The midpoint declines by $50 million, or approximately 32%. Management explicitly stated that project scope, total commitments and ramp velocity were unchanged, with associated cash spending shifting into 2027.
The lower 2026 cash outlay therefore improves near-term free cash flow without proving better lifetime project economics. It would be incorrect to capitalize the change as a permanent reduction in required investment. Management indicated that factory capital investment would remain at similar levels next year but did not provide an unambiguous, fully reconciled 2027 cash budget. The deferred amount should not automatically be added to another assumed 2027 budget without confirming what that budget includes.
The approximately $399 million cash-and-investments figure includes approximately $3.6 million of restricted cash. Unrestricted cash and marketable securities were approximately $395.4 million. Reported debt was approximately $11.4 million, implying approximately $384.1 million of net cash before lease liabilities. Liquidity therefore appears adequate for the planned ramp even before the strategic investment, although project-level returns remain unquantified.
Equity compensation deserves separate consideration. No shares were repurchased during Q3, and the release shows no repurchases during the first 9 months of 2026. Approximately $70.9 million remained under the authorization. Separately, financing cash flows included $35.6 million of year-to-date withholding payments associated with equity awards. Subtracting those payments from company-defined year-to-date free cash flow of $148.1 million leaves approximately $112.4 million before employee share-issuance proceeds and other financing considerations. This is an analytical cash-after-withholding measure, not company-reported free cash flow, and the withholding payments should not also be deducted as an additional current-period compensation expense.
THE LONG-TERM MODEL AND ILLUSTRATIVE 2027 OUTCOMES
The reiterated target model is $1.6 billion of revenue, 55% adjusted gross margin and $5 adjusted EPS. The prior Q2 discussion identified this as the 2030 framework. Relative to the approximately $1.050 billion revenue implied for 2026, reaching $1.6 billion would require approximately 52% cumulative growth, or approximately 11% annually over 4 years. That hurdle is less demanding than current growth, but cannot be evaluated independently of capacity additions and semiconductor cyclicality.
The gross-margin target is now only approximately 200 basis points above management’s underlying baseline. At $1.6 billion of revenue, 200 basis points represent $32 million of annual pretax profit, equivalent to approximately $0.32 per share using a 17% tax rate and 82 million diluted shares. Much of the remaining EPS opportunity therefore depends on revenue expansion and operating leverage, rather than another comparably large step-change in gross margin.
Illustrative 2027 scenarios clarify the sensitivity, but are not company guidance or consensus estimates. A common modeling framework assumes 82 million diluted shares, a 17% effective tax rate and $20 million of annual pretax-equivalent net nonoperating income. The share assumption approximately accommodates the Teradyne issuance, while actual equity-compensation dilution, investment income and acquisition activity could change the outcome. The probabilities are subjective analytical weights, with moderate-to-low confidence because demand commitments and detailed factory economics were not disclosed.
A base case with a 50% probability assumes $1.33 billion of revenue, 53% gross margin and $295 million of adjusted operating expenses, producing approximately $4.35 of adjusted EPS. The revenue framework can be interpreted as the approximately $1.14 billion Q4 midpoint annualized base, plus approximately $150 million of net incremental capacity-related revenue and approximately $40 million of additional growth elsewhere. This assumes meaningful but incomplete conversion of the linear factory opportunity, with transfers and qualification friction preventing full incremental realization.
A bull case with a 25% probability assumes $1.43 billion of revenue, 54.5% gross margin and $300 million of operating expenses, producing approximately $5.05 of adjusted EPS. This requires strong utilization, successful conversion of multiple GPU and ASIC programs, additional photonics growth and better absorption than the current approximately 53% margin framework. It demonstrates that the $5 target could be approached earlier under favorable conditions, but the call does not establish those conditions as the expected outcome.
A bear case with a 25% probability assumes $1.10 billion of revenue, 49% gross margin and $295 million of operating expenses, producing approximately $2.67 of adjusted EPS. This reflects weaker demand or qualification conversion, insufficient utilization and costs that remain relatively inflexible during the ramp. The downside mechanism is not necessarily technological displacement. A delay between installed capacity and revenue realization can produce substantial earnings compression even if long-term demand remains attractive.
The probability-weighted EPS across these scenarios is approximately $4.11. That is not a price target or expected stock return. At the approximately $134.24 strategic transaction price, the illustrative base-case EPS implies approximately 30.8x earnings, while the $5 long-term target implies approximately 26.8x. The transaction price is neither a current market quote nor a valuation floor, and a strategic investor can have economic objectives beyond those of a portfolio investor. Nevertheless, it illustrates why strong operating progress does not automatically establish inexpensive equity valuation.
INVESTMENT IMPLICATIONS, CATALYSTS AND DISCONFIRMING EVIDENCE
The quarter strengthens the case that FormFactor is becoming a more profitable supplier of increasingly complex semiconductor-test interfaces rather than merely participating in a favorable product-mix cycle. Underlying margin improvement during a DDR5-heavy quarter, initial GPU production shipments, broader CPU exposure and rapid photonics commercialization all support that interpretation. The evidence is strongest for the improvement already achieved in manufacturing economics. Confidence is lower regarding the magnitude and timing of prospective share gains.
The near-term catalyst is Q4 execution against guidance, especially normalized profitability after the remaining tariff refunds and the transition of factory costs into cost of revenues. The next major operating catalyst is progressive customer-qualified output from Farmers Branch during the first half of 2027. The larger financial catalyst should occur later in 2027 as the linear ramp produces more meaningful capacity. Successful completion also creates potential 2028 growth through annualization of capacity that was available for only part of 2027.
The most informative indicators are saleable output rather than installed equipment, qualified production designs rather than development engagements, and normalized operating profit rather than gross-margin presentation alone. Additional disclosure on GPU and ASIC production breadth, customer acceptance schedules, factory utilization and the cost burden associated with each released phase would materially improve confidence in the earnings trajectory.
The principal disconfirming evidence would be shipment delays despite strong stated demand, recurring gross margins materially below approximately 53%, production-quality issues, weak utilization after customer qualifications, or a factory ramp that requires materially more spending without corresponding output. A return of substantial DRAM mix sensitivity would also challenge the claim that cost reductions have structurally improved the business. Photonics orders that become concentrated in a narrow deployment cycle would reduce the value of the diversification argument.
Portfolio diversification should not be overstated. Exposure across CPUs, GPUs, custom ASICs, HBM and photonics reduces dependence on individual architectures, but these businesses remain linked to common AI infrastructure budgets, leading-edge foundry capacity and semiconductor investment cycles. A position added alongside substantial AI hardware, memory and test-equipment exposure can increase portfolio correlation despite the diversity of FormFactor’s product categories.
The earnings-based recommendation is to raise the recurring profitability baseline, retain a constructive long bias and avoid increasing exposure solely on the reported margin record. Any new position should be conditional on an acceptable valuation against approximately $0.93 of current normalized quarterly earnings and realistic factory-conversion assumptions. A portfolio-specific position size, absolute entry price and price stop cannot be established from these earnings materials alone. The relevant fundamental exit conditions are failed ramp conversion, sustained underlying margin deterioration, or evidence that anticipated share gains are not translating into commercial revenue.
The decisive distinction is between a stronger business and an automatically attractive stock. Q3 provides substantial evidence for the former. The latter depends on the price paid for factory execution, sustainable profitability and the future revenue contribution of newly qualified programs.
SOURCE BASIS AND INTERPRETIVE LIMITATIONS
The analysis uses the October 28, 2026 earnings-call transcript and supplied Bloomberg notice, FormFactor’s October 28 and July 29 earnings releases, relevant July earnings-call disclosures, the October 12 Teradyne collaboration announcement, the October 13 transaction filing and the October 22 factory-opening announcement. Consensus comparisons use the supplied Bloomberg figures consistently. Normalized earnings, capacity-ramp calculations and 2027 scenarios are analytical estimates, not management guidance. Detailed supplementary PDF tables were not independently readable, so unsupported customer percentages and precise end-market revenue splits have not been reconstructed.
COMPANY EMPLOYEES ON THE CALL
• Mike Slessor, Chief Executive Officer. • Aric McKinnis, Chief Financial Officer. • Stan Finkelstein, Vice President of Investor Relations.
RESEARCH ANALYSTS ON THE CALL
• Krish Sankar, identified in the transcript as Sreekrishnan Sankarnarayanan, TD Cowen. • Craig Ellis, B. Riley Securities. • George Brown, Deutsche Bank. • Matthew Prisco, Cantor Fitzgerald. • Elizabeth Sun, identified in the transcript as Yiling Sun, Citi. • Charles Shi, identified in the transcript as Yu Shi, Needham. • Brian Chin, Stifel.
Key Read-Throughs
KEY READ-THROUGHS FROM FORMFACTOR’S Q3 2026 EARNINGS CALL
FormFactor’s October 28 call reinforces a broadening AI infrastructure cycle, with increasingly important demand contributions from server CPUs, conventional DDR5 memory and optical interconnects alongside GPUs and HBM. The strongest incremental signals are the economic incentive to redirect DRAM production toward DDR5, production-level qualification of an additional GPU probe-card supplier, and accelerating spending on photonics manufacturing readiness. These developments favor selected semiconductor manufacturers and test-equipment suppliers while increasing competitive pressure on incumbent probe-card providers and input-cost pressure on system manufacturers. Capacity and qualification schedules, rather than demand alone, increasingly determine revenue timing. The implications below distinguish high-confidence operating effects from stock-price forecasts; strong demand confirmation does not necessarily constitute an unpriced earnings surprise.
SERVER PROCESSORS
SERVER CPU DEMAND PROVIDES AN IMMEDIATE POSITIVE CROSS-CHECK AHEAD OF INTEL AND AMD EARNINGS (READ-THROUGH 1)
Affected companies: Intel (INTC: United States) and Advanced Micro Devices (AMD: United States). Direction: positive. Magnitude: meaningful for server-processor demand and potentially material for the relevant business segments, but insufficient to establish a consolidated earnings beat.
Call evidence: Foundry and logic revenue increased approximately 10% sequentially, with further growth expected in Q4. Management identified data-center CPUs as a key contributor, described a longstanding customer approaching 10% of company revenue in Q3 and potentially exceeding that threshold in Q4, and highlighted additional exposure to fabless x86 and ARM-based processors. At FormFactor’s current revenue level, a 10% customer represents approximately $28 million of quarterly sales.
The transmission mechanism is broader CPU demand associated with AI infrastructure, including inference orchestration, data preparation, application execution and workloads surrounding accelerator clusters. Stronger CPU production programs generate demand for design-specific probe cards, providing a manufacturing-chain cross-check on processor activity. This supports Intel’s Xeon and AMD’s EPYC demand opportunity rather than a thesis that incremental data-center spending accrues exclusively to GPUs.
The important qualification is that probe-card revenue is influenced by design changes, test complexity and supplier share as well as semiconductor production volumes. The call therefore supports stronger server-CPU activity, not a precise CPU shipment-growth estimate. The longstanding customer was not named, so its revenue threshold should not be presented as a confirmed Intel disclosure. Similarly, broad fabless x86 exposure does not establish the magnitude of AMD’s share gains.
Near-term trading catalysts are unusually clear: Intel reports on October 29, 2026, and AMD reports on November 3, 2026, according to their issuer announcements. The most relevant confirmation would be stronger server demand, supply allocation toward server products and improved forward visibility. Intel’s client and foundry economics, and AMD’s accelerator performance, remain separate determinants of consolidated results.
The longer-duration implication is positive for the breadth of the server-compute market. However, it does not establish a winner between x86 and ARM or between Intel and AMD. Multiple CPU vendors can benefit from a larger demand pool while competing aggressively for share.
SEMICONDUCTOR TEST AND PROBE CARDS
GPU QUALIFICATION AND NEW CAPACITY INCREASE COMPETITIVE PRESSURE ON TECHNOPROBE (READ-THROUGH 2)
Affected companies: Technoprobe (TPRO: Italy), with a negative competitive implication; Taiwan Semiconductor Manufacturing Company (2330: Taiwan), with a modest positive implication for supplier choice and production resilience. Magnitude: limited immediate earnings impact, but a meaningful competitive development for 2027 and beyond.
Call evidence: FormFactor shipped probe cards to the leading foundry for a single GPU design in “multimillion dollar volumes.” Management expects to “meaningfully grow share” in 2027 and said that custom-ASIC qualifications had also progressed, with volume production constrained by manufacturing capacity. Farmers Branch is expected to provide approximately $400 million of annual probe-card revenue capability exiting 2027.
The negative transmission mechanism for Technoprobe is the emergence of another qualified supplier capable of pursuing larger production allocations in advanced logic. Initial production shipments are more consequential than laboratory demonstrations because they indicate that technical and commercial qualification hurdles have been crossed for a specific design. As FormFactor adds capacity, customers gain greater ability to diversify procurement and allocate incremental programs between suppliers.
That increases competition for future design wins and can constrain the pricing power associated with scarce qualified supply. It does not prove that Technoprobe lost the disclosed GPU program, that existing orders were canceled, or that its absolute revenue must decline. An expanding market can support growth at both companies while changing their shares of incremental demand.
The Teradyne relationship deserves careful interpretation. Teradyne previously established a strategic partnership with Technoprobe that included an announced 10% equity investment and explicitly preserved an open ecosystem. Its new $300 million FormFactor investment should therefore not be described as an abandonment of Technoprobe. Nevertheless, it weakens any investment argument that the earlier relationship creates a preferential barrier against competing probe-card suppliers.
Timing substantially limits the immediate downside. FormFactor remains capacity-constrained, and management expects Farmers Branch capacity to increase approximately linearly during 2027. A move from approximately $0 to $400 million of annual capacity implies roughly $200 million of theoretical production opportunity during that year, before utilization, qualification delays and transfers from existing factories. The $400 million figure is neither 2027 recognized revenue nor a GPU-only opportunity that can be deducted from Technoprobe’s forecasts.
Technoprobe is also responding to demand: its October 23 announcement described a new Chinese probe-card R&D and manufacturing base. The relevant competitive question is therefore the speed of qualified output and customer allocation, not whether only FormFactor is expanding. For TSMC, additional qualified supply is operationally favorable, but the call does not establish a material incremental earnings contribution or imply that Taiwanese wafer production is migrating to Texas.
OPEN INTEROPERABILITY AND RISING TEST COMPLEXITY SUPPORT BOTH LEADING ATE SUPPLIERS (READ-THROUGH 3)
Affected companies: Advantest (6857: Japan) and Teradyne (TER: United States). Direction: positive. Magnitude: meaningful for semiconductor-test demand and product-development opportunities, although no incremental order value or vendor-specific market-share change can be derived.
Call evidence: FormFactor described formal collaborations with both companies to accelerate development, validation and high-volume production of HBM, advanced-compute and photonics applications. Management emphasized “full probe card ATE interoperability.” It also identified higher-speed interfaces, greater power density and increasingly complex chiplet architectures as drivers of more demanding production testing.
The transmission mechanism is increasing test work per semiconductor program. More complex interfaces and packaging raise the value of verifying die before expensive downstream assembly, while higher performance requirements increase demands on test accuracy, power delivery and signal integrity. These requirements support investment in capable ATE platforms, associated instrumentation and production-test capacity.
The less obvious implication is that the Teradyne investment is not inherently negative for Advantest. FormFactor explicitly intends to support both platforms rather than bind its customers to a single tester supplier. Teradyne gains a development and qualification partner, while Advantest retains access to FormFactor’s probe technology. The benefit is faster ecosystem development and fewer interface constraints, not guaranteed displacement of an incumbent tester.
The HBM destacking discussion also argues against a simplistic bearish test-content interpretation. Management emphasized its position in final-stack testing. At unchanged total memory bits and capacity per die, moving from 12-high to 8-high stacks would increase completed-stack count by 50%, potentially increasing final-stack test events. That is a conditional physical relationship, not a forecast of 50% higher tester revenue: die density, test time, parallelism and equipment utilization can offset or amplify the effect.
FormFactor’s call corroborates rather than anticipates Advantest’s October 28 results. Advantest’s contemporaneous presentation independently described rising test content, capacity above 5,000 SoC systems annually and acceleration toward a 10,000-system target. FormFactor adds evidence from a complementary production interface, strengthening confidence in demand breadth without creating a second independent pool of end-customer demand.
The near-term catalyst is conversion of demand into equipment shipments and qualified production capacity. The longer-duration benefit is higher test intensity across multiple architectures. FormFactor’s factory ramp can relieve an interface constraint, but it does not prove that ATE shipments are currently delayed or that every additional probe card requires a new tester. Its reported 56.5% gross margin also should not be transferred to peers: approximately 380 basis points reflected benefits management did not expect to recur.
MEMORY AND SERVER HARDWARE
DDR5 ALLOCATION DECISIONS CONFIRM THAT CONVENTIONAL DRAM IS A MAJOR PROFIT DRIVER, NOT MERELY AN HBM RESIDUAL (READ-THROUGH 4)
Affected companies: Micron Technology (MU: United States), SK hynix (000660: South Korea) and Samsung Electronics (005930: South Korea). Direction: positive. Magnitude: potentially substantial for DRAM profitability; more direct at memory-focused Micron and SK hynix than at diversified Samsung Electronics.
Call evidence: FormFactor’s DRAM probe-card revenue remained approximately unchanged at record levels, while HBM revenue declined and DDR5 revenue increased. Management attributed this shift to customers reallocating wafer starts to capture the profit opportunity from “significant DDR market price increases.” It expects quarter-to-quarter shifts between DDR and HBM to continue while “bit constrained DRAM market conditions persist.”
The most important implication is the revealed economic preference of memory manufacturers. Reallocating production toward DDR indicates that conventional DRAM has become sufficiently attractive to compete for scarce manufacturing resources. The signal is stronger than a general statement that memory prices are rising: customer production decisions are responding to the relative returns available across products.
For memory suppliers, the mechanism is improved revenue and profit realization from constrained capacity. Higher conventional-DRAM pricing can support earnings independently of HBM share gains, while flexible allocation allows manufacturers to optimize returns across product categories, subject to contracts and technical constraints. The benefit is therefore not confined to the leading HBM supplier.
Micron’s September 30 prepared remarks provide an important independent cross-check: management said significant 2027 HBM price increases would narrow the gross-margin gap with conventional DRAM. FormFactor’s subsequent wafer-allocation commentary is consistent with that relative-profitability signal. It is corroboration of an already-disclosed pricing environment, not evidence that the entire development is newly discovered by the market.
The call also argues against interpreting FormFactor’s lower HBM revenue as an industry HBM-demand warning. Its probe-card mix reflects customer design and production decisions, while total DRAM revenue remained at record levels. That combination is consistent with allocation optimization rather than a generalized memory downturn. It does not establish the HBM shipment trajectory of any individual producer.
Near-term catalysts are contract-pricing resets, DDR-versus-HBM mix disclosures and evidence that higher realized prices exceed cost growth. The longer-duration issue is whether capacity additions eventually close the supply-demand gap. Confidence is high in the current favorable pricing and allocation signal, but lower in any precise duration or company-specific margin forecast. The call does not identify which manufacturer reallocated how much capacity.
DDR5 SCARCITY IS A NEGATIVE COST READ-THROUGH FOR SERVER MANUFACTURERS, BUT NOT AN AUTOMATIC MARGIN SHORT (READ-THROUGH 5)
Affected company: Dell Technologies (DELL: United States). Direction: negative for component costs and procurement flexibility, with an important offset from pricing power. Magnitude: potentially meaningful for individual server configurations and order cohorts; no high-confidence consolidated EPS reduction is established.
Call evidence: Management described significant DDR price increases and a bit-constrained DRAM market, while customers shifted production toward DDR5 to exploit the resulting profit opportunity. The same economics that improve memory-manufacturer returns increase the acquisition cost of memory used in server systems.
The transmission mechanism runs through the timing of quotations, component purchases and customer delivery. If a server is priced before a subsequent increase in memory acquisition costs, gross profit can be compressed unless the order can be repriced or inventory was secured earlier. If the cost is passed through, reported system revenue can increase without a proportionate increase in units or system functionality. Higher nominal sales therefore become a less reliable indicator of underlying deployment growth.
This is a high-confidence input-cost read-through, not a high-confidence Dell earnings short. Dell’s latest reported results provide material counterevidence to automatic margin compression: its September commentary emphasized pricing discipline in an inflationary component environment, alongside improved profitability. FormFactor’s call reinforces the persistence of the cost challenge; it does not demonstrate that Dell has lost its ability to offset it.
The actionable near-term issue is the spread between component-cost changes and realized system pricing. Upcoming results should be assessed for unit growth versus configuration inflation, profitability on newly delivered orders and changes in procurement requirements. A slowdown in revenue growth caused by lower component inflation would likewise not necessarily indicate weaker system demand.
The longer-duration cross-portfolio implication is that memory suppliers and server manufacturers occupy different positions in the same AI spending chain. Strong infrastructure demand can benefit both, but a larger share of incremental economics can accrue to scarce components. Treating a memory long and a server-OEM long as interchangeable expressions of the same demand thesis obscures that distribution of returns.
PHOTONICS AND NETWORKING
PAID PHOTONICS TEST DEMAND VALIDATES MANUFACTURING PREPARATION, WHILE ARCHITECTURE BREADTH REDUCES A SINGLE-ROADMAP DEPENDENCY (READ-THROUGH 6)
Affected companies: NVIDIA (NVDA: United States) and Broadcom (AVGO: United States). Direction: positive for optical-networking commercialization and the supporting manufacturing ecosystem. Magnitude: strategically meaningful for networking platforms, but limited evidence of incremental near-term consolidated earnings.
Call evidence: Systems revenue increased approximately 23% sequentially to $59.5 million, driven by Triton demand. Management increased its 2026 Triton expectation from an initial $10 million to $20 million to more than $30 million. It also identified opportunities in NPO and pluggables, emphasizing that both CPO and NPO require known-good photonic integrated circuits before combination with electronic ICs.
The positive transmission mechanism is investment in the infrastructure needed to manufacture and qualify optical products. Paid test-system demand is firmer evidence of customer commitment than product announcements alone. It supports the proposition that optical-networking programs are progressing through practical commercialization requirements, including screening, yield learning and production readiness.
That is relevant to NVIDIA’s photonics networking platforms and Broadcom’s CPO-enabled switching portfolio. Reliable identification of defective photonic die before expensive assembly can reduce downstream waste and improve the feasibility of scaling optical modules. The call does not quantify the resulting yield improvement or customer cost saving, so those benefits should remain directional.
The architecture breadth is particularly important. FormFactor’s opportunity is not dependent solely on a specific CPO deployment schedule because related optical-testing requirements also exist in NPO and pluggables. This supports a broader optical-interconnect investment cycle rather than a single-product adoption thesis. It does not mean every component supplier or networking vendor benefits equally: architecture changes alter content, sourcing and the division of value across the optical supply chain.
NVIDIA’s October 21 announcement provides contemporaneous context rather than a new conclusion derived from FormFactor. NVIDIA had already disclosed plans with SPIL to expand optical-engine capacity for CPO. FormFactor’s subsequent Triton commentary corroborates investment elsewhere in that manufacturing chain. It does not identify NVIDIA as the customer behind every Triton order, allocate those orders to Broadcom, or establish incremental revenue beyond either company’s disclosed plans.
Near-term catalysts are additional paid test-system shipments, customer qualification progress and movement from manufacturing preparation into optical-system deployment. The longer-duration benefit is a more capable production ecosystem supporting higher-bandwidth, lower-power networking architectures. Management’s statement that Triton capacity is not expected to constrain growth is favorable, but test equipment availability alone does not guarantee deployment timing. Customer acceptance, optical yields, packaging capacity and system-level reliability remain separate gates.
The investment distinction is between growing optical-test demand and immediate revenue realization across all optical suppliers. The former is directly supported by the call. The latter requires company-specific evidence on production adoption, content and customer allocation.
Report record
- Sector
- Information Technology
- Industry
- Semiconductors & Semiconductor Equipment
- Fiscal period end
- September 30, 2026
- Report date
- October 28, 2026
- Analysis
- 6132 words
- Read-throughs
- 2518 words
- Content fingerprint (PDF)
38fd36e4e999- Content fingerprint (analysis)
28f5594d1cea- Content fingerprint (read-throughs)
6c7ab118b872
Prepared from the company's earnings release and earnings call transcript. Figures as reported by the company. For information only. Not investment advice.
More from FormFactor, Inc.
No other reports yet.
More in Information Technology
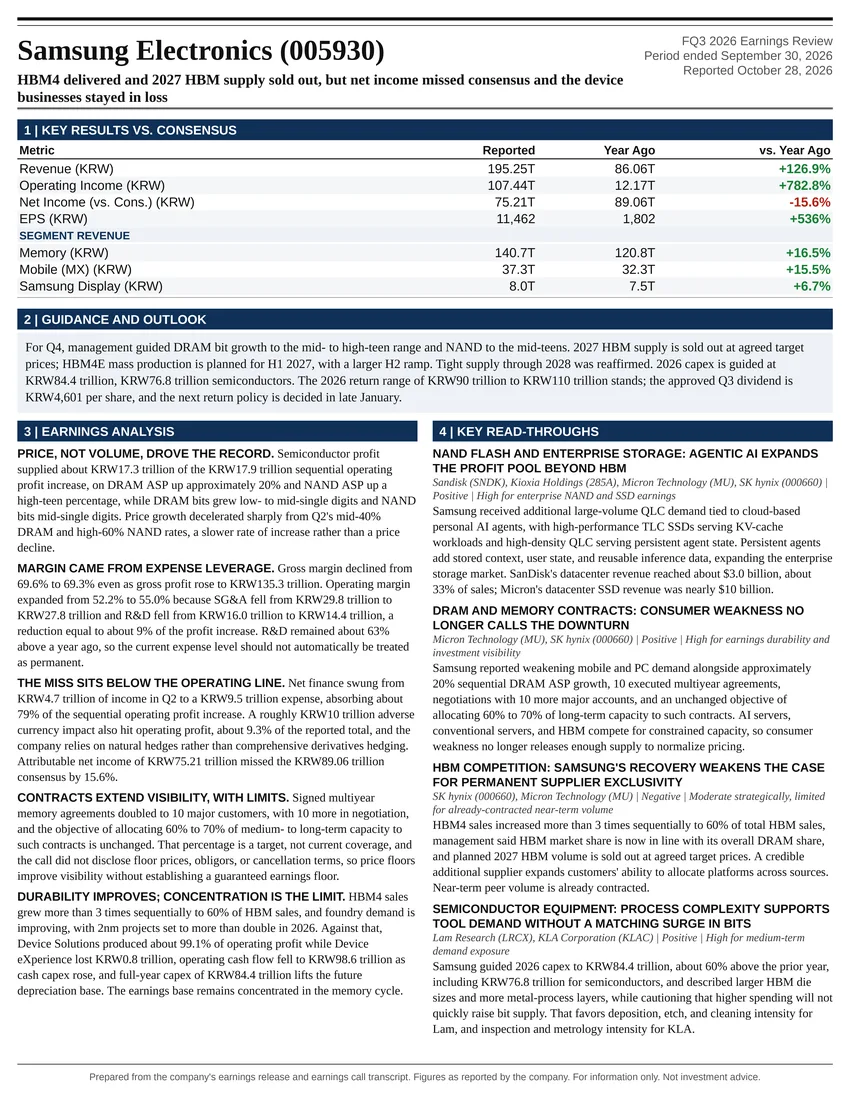
HBM4 delivered and 2027 HBM supply sold out, but net income missed consensus and the device businesses stayed in loss
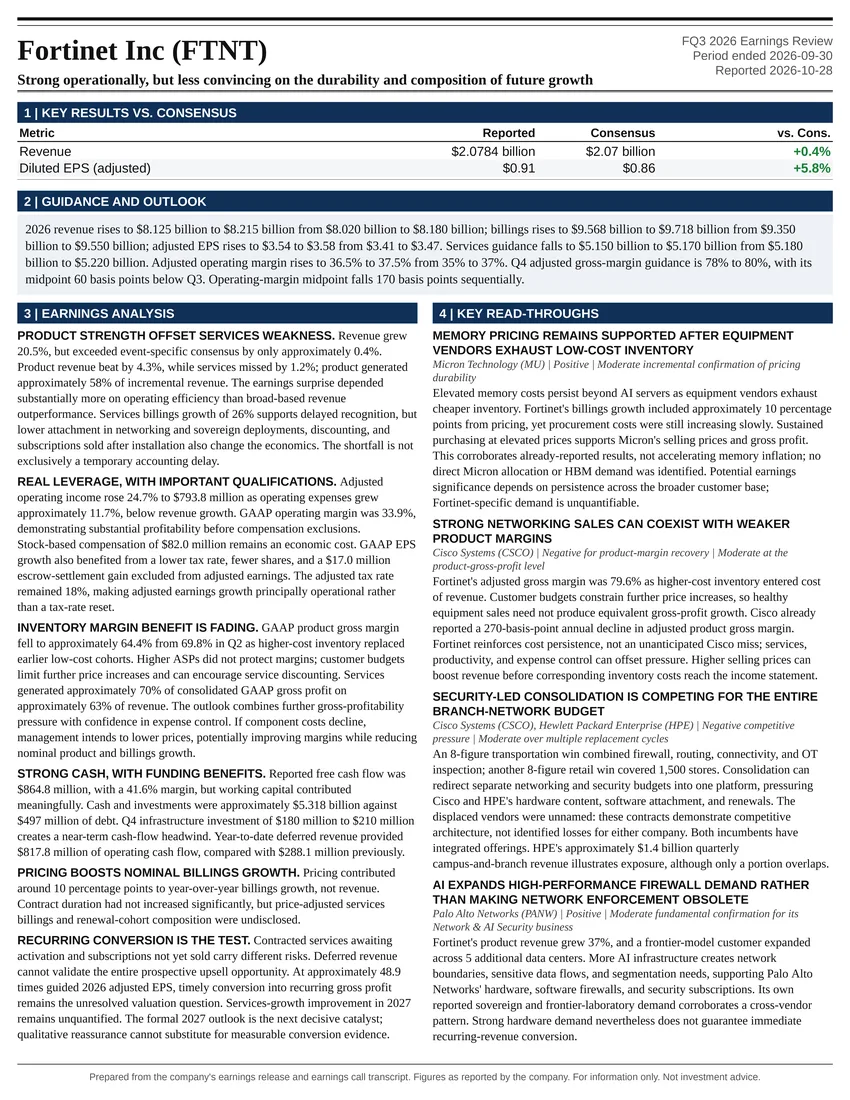
Strong operationally, but less convincing on the durability and composition of future growth
All Information Technology reports
FormFactor, Inc. on the Atlas Peak ticker page
Follow @AtlasPeakRes on X for new earnings reports as they publish.