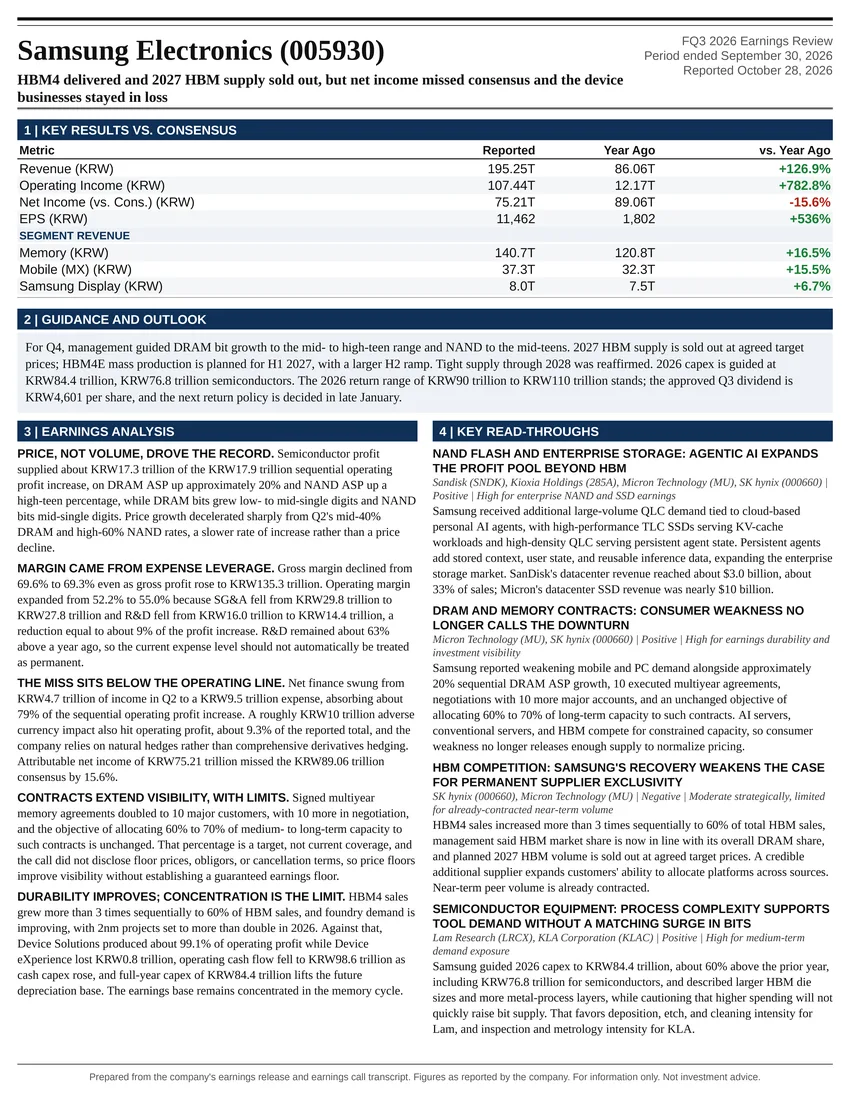
HBM4 delivered and 2027 HBM supply sold out, but net income missed consensus and the device businesses stayed in loss
Earnings Reports
Sandisk Corporation FQ1 2027 Earnings Report
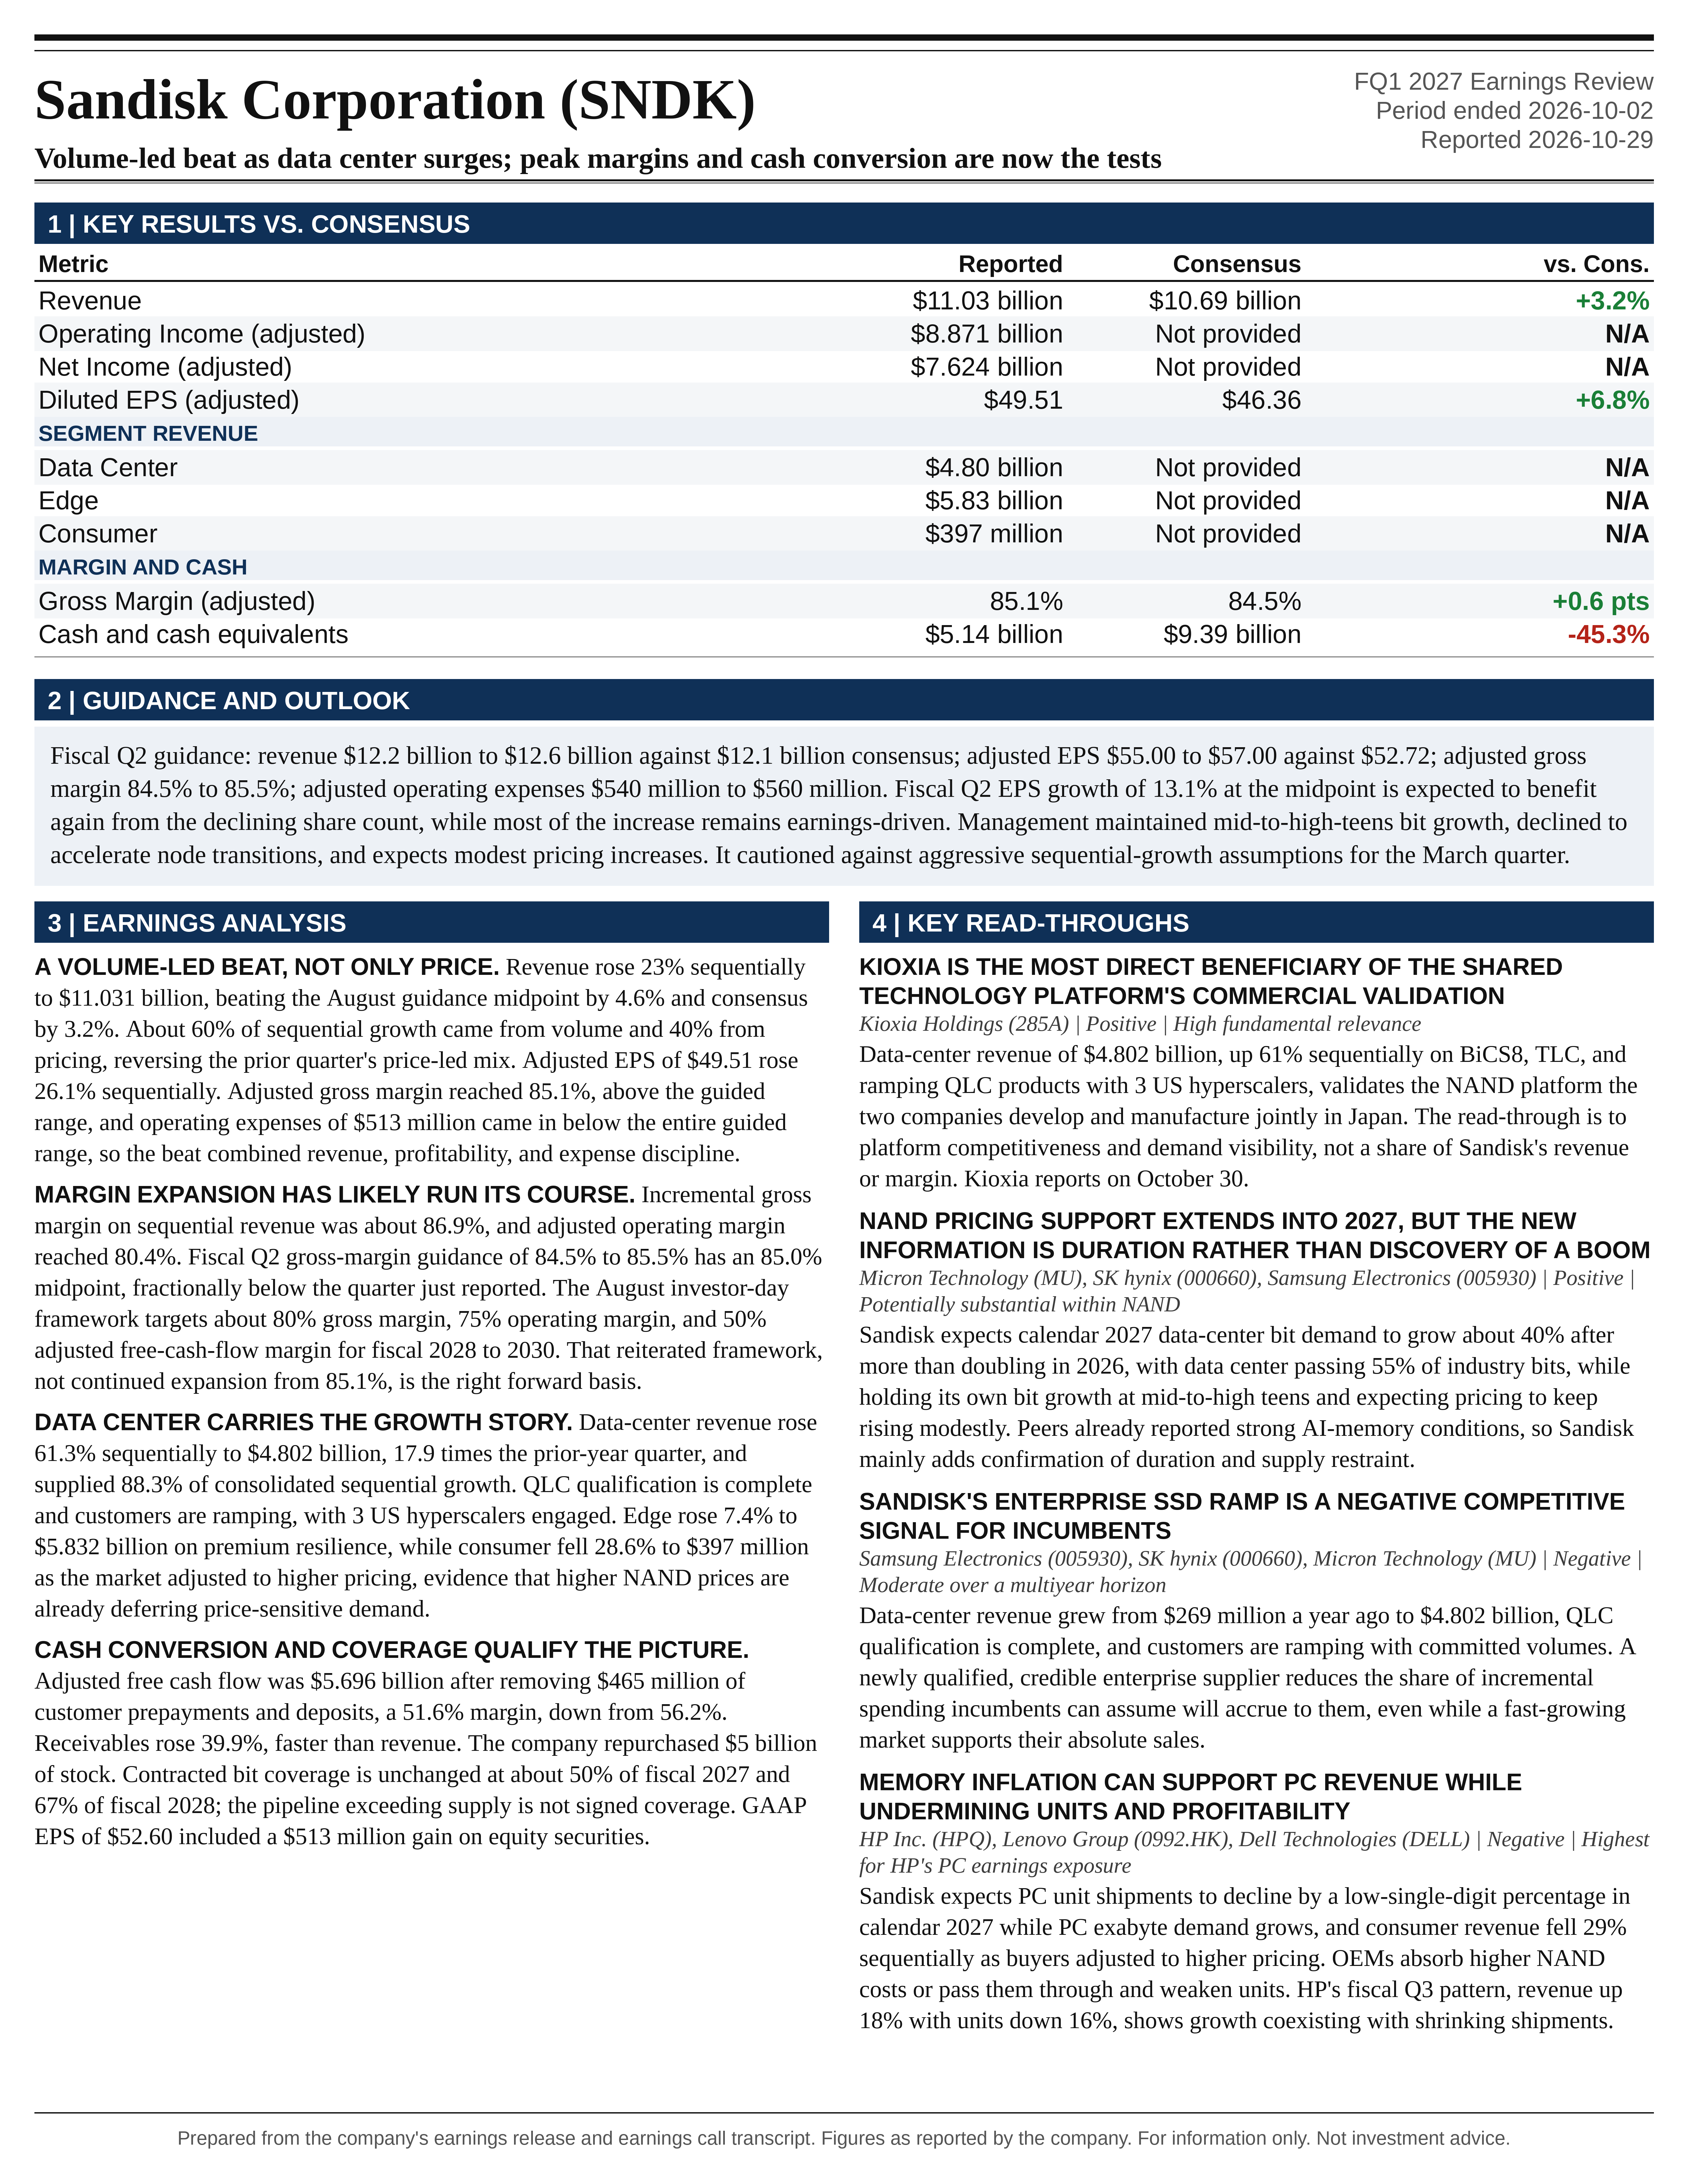
Sandisk Corporation (SNDK) FQ1 2027 earnings: Volume-led beat as data center surges; peak margins and cash conversion are now the tests. Full earnings analysis, key read-throughs, and the one-page exhibit from Atlas Peak Research.
Sandisk Corporation (SNDK)
Sector: Information Technology · FQ1 2027 · Period end October 2, 2026 · Reported October 29, 2026
Sandisk’s fiscal Q1 2027 results support a constructive investment stance, with a measured long position justified by accelerating data-center penetration, substantial contracted demand, unusually strong cash generation, and a valuation that discounts significant deterioration from current profitability.
Download the one-page report (PDF)
View one-page exhibit
Download analysis (.md)
Download read-throughs (.md)
Post to X
One-Page Exhibit
Earnings Analysis
EXECUTIVE CALL SUMMARY: Sandisk Corporation (10/29/26)
Sandisk’s fiscal Q1 2027 results support a constructive investment stance, with a measured long position justified by accelerating data-center penetration, substantial contracted demand, unusually strong cash generation, and a valuation that discounts significant deterioration from current profitability. The central investment question is no longer whether AI can materially expand NAND demand. It is whether Sandisk’s contractual protections, manufacturing discipline, and technology differentiation can preserve attractive economics after the present supply imbalance moderates. This quarter strengthened that proposition, but did not establish that NAND cyclicality has been eliminated.
Revenue of $11.031 billion exceeded Bloomberg consensus by 3.2%, while adjusted EPS of $49.51 exceeded consensus by 6.8%. Fiscal Q2 revenue guidance of $12.2 billion to $12.6 billion exceeded consensus at every point in the range, and adjusted EPS guidance of $55 to $57 exceeded the $52.72 consensus estimate by 4.3% to 8.1%. Data-center revenue increased 61.3% sequentially to $4.802 billion and accounted for 88.3% of consolidated sequential revenue growth. Adjusted gross margin reached 85.1%, adjusted operating margin reached 80.4%, and adjusted free cash flow was $5.696 billion.
The most consequential operational development was the transition toward volume-led growth. Approximately 60% of sequential revenue growth came from volume and 40% from pricing, compared with approximately 33% from volume and 67% from pricing in fiscal Q4. This strengthens the argument that Sandisk is capturing expanding workloads and improving its market position rather than merely benefiting from escalating NAND prices. Nevertheless, quarterly revenue growth slowed from approximately 51% to 23%, and the fiscal Q2 midpoint implies another moderation to 12.4%. The business remains exceptionally profitable, but the rate of earnings acceleration is normalizing.
Several qualifications are material. Contracted bit coverage remains approximately 50% for fiscal 2027 and approximately 67% for fiscal 2028, broadly unchanged from the August disclosures. The 2 agreements closed during fiscal Q1 had already been announced on the preceding earnings call. The pipeline exceeding supply through the end of the decade is not equivalent to signed coverage through that period. Consumer revenue fell 28.6% sequentially, receivables increased faster than sales, adjusted free-cash-flow margin declined from 56.2% to 51.6%, and management explicitly warned against aggressive assumptions for the March quarter.
At the $1,302 after-hours reference price in the Bloomberg notice, the shares trade at approximately 5.8 times annualized fiscal Q2 midpoint EPS. That is an attractive valuation if the August investor-day framework is substantially achieved, even allowing for margins below current levels. It is not independently sufficient evidence of undervaluation because annualized peak earnings can substantially overstate sustainable profitability. An illustrative probability-weighted framework produces approximately 27% upside over 12 to 18 months, but includes approximately 50% downside in a meaningful normalization scenario. Position sizing should reflect that asymmetry rather than the apparent cheapness of the headline earnings multiple.
QUARTERLY PERFORMANCE AND QUALITY OF THE BEAT
Fiscal Q1 revenue increased from $8.965 billion in fiscal Q4 to $11.031 billion, a $2.066 billion sequential increase. Revenue was approximately 378% above the $2.308 billion reported in the corresponding prior-year quarter. The scale of the transformation is substantial: fiscal Q1 revenue alone represented approximately 54.5% of total fiscal 2026 revenue of $20.248 billion.
The revenue result exceeded the August 5 guidance midpoint of $10.550 billion by $481 million, or 4.6%, and exceeded the $10.800 billion upper bound by $231 million, or 2.1%. Adjusted gross margin of 85.1% exceeded the prior 83% to 85% range, although the exceedance above the upper bound was only 10 basis points. Adjusted operating expenses of $513 million were below the entire prior $520 million to $540 million range. The earnings beat therefore reflected revenue outperformance, stronger profitability, and expense discipline rather than a single favorable variable.
Adjusted EPS increased 26.1% sequentially, from $39.25 to $49.51, and exceeded the prior guidance midpoint of $45 by 10.0%. Adjusted net income increased 23.7%, from $6.162 billion to $7.624 billion. The difference between EPS growth and net-income growth reflects the reduction in diluted weighted-average shares from approximately 157 million to 154 million. Repurchases contributed to per-share growth, but operating earnings remained the primary driver.
The tax rate also contributed modestly to the beat against prior expectations. The August guidance assumed a 15.0% adjusted tax rate, whereas actual adjusted tax expense of $1.276 billion on approximately $8.900 billion of adjusted pretax income implies a 14.3% rate. Actual diluted shares were also below the prior 155 million assumption. These factors improved EPS, but do not explain the magnitude of the operating outperformance.
The composition of revenue growth is particularly important. Applying management’s approximate attribution to the $2.066 billion sequential increase suggests approximately $1.240 billion associated with volume and $826 million associated with pricing. Those figures describe contributions to the revenue bridge. They are not independently disclosed bit-shipment growth rates or like-for-like price changes, because product mix and the interaction between price and volume are not separately quantified.
The shift toward volume-led growth is favorable for earnings durability. Repeated price increases eventually encounter customer budget constraints, substitution, and demand destruction. Volume expansion supported by qualified enterprise products and customer infrastructure deployment has a stronger claim to persistence. However, the contribution remains concentrated in data center, and the distinction between incremental production, inventory deployment, and reallocation of existing supply is not fully disclosed.
PROFITABILITY: EXCEPTIONAL ECONOMICS, BUT LIMITED ROOM FOR FURTHER EXPANSION
Adjusted gross profit increased from $7.588 billion to $9.384 billion, while adjusted operating income increased from $7.104 billion to $8.871 billion. The implied sequential incremental gross margin was approximately 86.9%, and the incremental operating margin was approximately 85.5%. These are exceptionally strong conversion rates, demonstrating that most incremental revenue is reaching operating profit.
Adjusted operating expenses increased only 6.0% sequentially, versus revenue growth of 23.0%. Their share of revenue declined to approximately 4.7%, supporting the 120-basis-point increase in adjusted operating margin. The business now has a relatively small operating-expense burden compared with gross profit, which creates substantial earnings leverage when revenue grows without a comparable increase in engineering and commercial spending.
The prior-year comparison is even more striking. Adjusted gross margin increased from 29.9% to 85.1%, and adjusted operating margin increased from 10.6% to 80.4%. Adjusted cost of revenue increased only approximately 1.9%, from $1.617 billion to $1.647 billion, while revenue increased almost 4.8 times. This demonstrates how dramatically realized revenue relative to manufacturing cost has changed. It does not, by itself, separate price, product mix, manufacturing cost reductions, or shipment composition.
The correct forward framework is sustained profitability rather than continuing margin expansion. Fiscal Q2 gross-margin guidance of 84.5% to 85.5% has an 85.0% midpoint, slightly below the 85.1% just reported. Management expects modest additional pricing, but has not guided another significant gross-margin increase. At this level, the remaining upside increasingly depends on shipment growth, mix, and share reduction rather than expanding gross margin toward an unrealistic ceiling.
The August 13 investor-day framework is more conservative than the current quarterly run rate. For fiscal 2028 through fiscal 2030, management outlined approximately 80% adjusted gross margin, approximately 75% adjusted operating margin, operating expenses around 5% of revenue, and approximately 50% adjusted free-cash-flow margin. Revenue growth was expected to be in the mid-to-high teens, consistent with bit growth. This quarter reiterated confidence in that framework rather than raising its numerical targets.
The distinction matters for valuation. The investment case does not require 85% gross margin indefinitely if the approximately 80% long-term framework proves credible. Conversely, current results should not be treated as evidence that the long-term framework has already been superseded. A normalization of several percentage points in gross margin is compatible with management’s existing plan.
DATA CENTER: PRODUCT EXECUTION AND SUPPLY ALLOCATION ARE BOTH CONTRIBUTING
Data-center revenue increased to $4.802 billion from $2.977 billion in fiscal Q4 and $269 million in the prior-year quarter. Revenue was approximately 17.9 times the prior-year level. The business generated almost as much revenue in this quarter as the $5.153 billion generated during all of fiscal 2026.
Data center represented 43.5% of consolidated revenue, compared with 33.2% in fiscal Q4 and 11.7% in the prior-year quarter. Its $1.825 billion sequential revenue increase accounted for 88.3% of consolidated growth. Edge contributed another $400 million, while consumer subtracted $159 million. This establishes data center as the dominant source of incremental earnings momentum, even though edge remains the largest revenue category.
Management attributed the improvement to the combination of BiCS8 technology, established TLC products, the commercial ramp of QLC, deeper customer engagements, and greater supply allocation to data center. Goeckeler summarized the product positioning as “the right product at the right time.” The statement is supported by the disclosed completion of QLC qualification work and subsequent customer ramps, although the relative contribution of market-share gains versus rising market prices remains unquantified.
The QLC product referred to internally as Stargate appears to have crossed an important commercial milestone. Management stated that qualification activity was “all 100% behind us” and that customers were ramping. Qualification completion reduces a specific execution risk and improves the credibility of continued shipment growth. It does not eliminate customer concentration, deployment timing, controller and firmware execution, or competitive qualification risk.
The presence of 3 US hyperscalers provides evidence of meaningful enterprise-market acceptance. However, neither customer-specific revenue nor concentration was disclosed. The account count should not be interpreted as proof of balanced exposure across those customers, nor should unnamed customers be inferred from the broader AI narrative.
Management estimates that data center now represents roughly 50% of industry NAND bits, compared with approximately 20% early in the decade. This cannot be directly compared with Sandisk’s 43.5% data-center revenue share. Revenue share and bit share have different denominators and are affected by product-level pricing. The direction of Sandisk’s mix shift is clear, but an exact gap to industry bit mix cannot be calculated from the disclosed revenue categories.
The refusal to provide a specific enterprise SSD market-share target is economically sensible. Goeckeler said such targets can lead to “perverse choices in the portfolio.” Maximizing enterprise SSD share without regard to price, product requirements, contractual obligations, or opportunity cost could destroy value. The relevant indicators are profitable qualified shipments, cash generation, and customer retention, not market share in isolation.
EDGE AND CONSUMER: MIX RESILIENCE SHOULD NOT BE CONFUSED WITH BROAD DEMAND STRENGTH
Edge revenue increased 7.4% sequentially to $5.832 billion and approximately 320% year over year. The sequential increase was materially slower than the approximately 48% increase in fiscal Q4. Premium and mainstream demand remained resilient, while the lower end contracted. Automotive and IoT were identified as stronger areas, but no revenue amounts or growth rates were provided for those categories.
Management’s 2027 PC and smartphone outlook depends on content growth offsetting unit pressure. PC units are expected to decline by a low-single-digit percentage, while smartphone units are also expected to decline modestly. Nevertheless, management expects exabyte demand to increase in both markets. This is plausible if average capacity rises sufficiently, but part of the improvement can result from lower-capacity devices disappearing from the shipment mix rather than uniform capacity upgrades across surviving product tiers.
That distinction affects the quality of growth. A higher average NAND content figure caused by premiumization does not necessarily imply improved affordability or stronger end-user demand. It can coexist with declining units, weaker entry-level demand, and increased concentration in premium device manufacturers.
Automotive provides a potentially attractive diversification vector because qualification requirements and product lifecycles can support durable customer relationships. However, the suggestion that automotive could become among the largest edge markets remains a long-term strategic statement, not a quantified near-term earnings catalyst. No timing, market-share target, design-win revenue schedule, or profitability contribution was disclosed.
Consumer revenue declined to $397 million from $556 million in fiscal Q4 and $652 million in the prior-year quarter. Revenue was down 28.6% sequentially, 39.1% year over year, and 51.6% from fiscal Q3’s $820 million. Management explicitly attributed the latest decline to the market adjusting to higher pricing.
Consumer now represents only 3.6% of consolidated revenue, limiting its direct earnings significance. Its informational significance is larger. The decline demonstrates that higher NAND prices are already destroying or deferring demand in price-sensitive applications. It also qualifies management’s description of consumer as a durable foundation: the brand, distribution, and customer relationships may be strategically durable, but quarterly revenue is not presently stable.
The combination of strong data-center growth and weaker consumer demand is consistent with supply migrating toward customers with higher willingness to pay. That can optimize near-term returns while increasing exposure to a narrower set of AI infrastructure spending decisions. Diversification should therefore be assessed through revenue concentration and correlated demand drivers, not merely the continued presence of 3 end-market categories.
NBMS: SUBSTANTIAL PROTECTION, BUT NO NEW STEP-CHANGE IN SIGNED COVERAGE
The new business model agreements are the most important element of the attempt to transform Sandisk’s earnings quality. They provide contractual volume commitments, structured pricing, and financial protections that can improve production planning and reduce exposure to traditional spot-market volatility.
However, the quarter did not disclose a material increase in signed bit coverage relative to the August investor-day baseline. Approximately 50% of fiscal 2027 bits and approximately 67% of fiscal 2028 bits remain committed. The 2 agreements closed during fiscal Q1 were signed before the August 5 fiscal Q4 call and were already included in that earlier discussion. The reported 8 NBM customers should therefore not be interpreted as a newly expanded customer count.
The incremental positive is the strength and breadth of follow-on discussions. Goeckeler stated that customers “have underestimated the amount of NAND they need to run their infrastructure.” Existing customers are seeking additional commitments while prospective customers are also entering the pipeline. This suggests that initial infrastructure plans may have understated storage requirements and that supplier selection is becoming more closely integrated with system architecture.
The distinction between conversations and executed commitments remains critical. Management’s statement that “Our NBM pipeline exceeds our supply throughout the end of the decade” describes prospective demand relative to planned supply. It does not establish binding purchase obligations for all production through 2030. Management explicitly acknowledged that negotiations, financial commitments, and capacity alignment remain unfinished.
The prior fiscal Q4 call provides important contract detail. Pricing includes fixed and variable components, with the variable portion subject to floors and ceilings. This reduces downside exposure but can also limit participation in extreme upside pricing. A larger NBM mix is therefore a trade-off between earnings protection and spot-market optionality, not an unconditionally positive development for every market environment.
The earlier disclosure of $93.9 billion of minimum expected NBM revenue at floor pricing also requires careful interpretation. That figure represented total expected contract revenue, including amounts already recognized. It is not current remaining backlog, cash on hand, or guaranteed net income.
The Bloomberg notice reports fiscal Q1 remaining performance obligations of $88.9 billion. The fiscal 2026 Form 10-K reported $59.8 billion at July 3, while the August call disclosed $91.1 billion pro forma for the 2 agreements signed after that quarter closed. The current $88.9 billion therefore represents a 48.7% increase over the reported fiscal Q4 balance, but a 2.4% decline from the already-disclosed pro forma balance.
This reconciliation prevents a misleading interpretation of backlog growth. Most of the reported sequential increase reflects incorporating previously announced agreements into the quarter-end balance. Conversely, the $2.2 billion decline from the pro forma baseline is not evidence of cancellations. Revenue recognition reduces RPO, and a complete roll-forward of recognized revenue, contract additions, amendments, and other changes was not provided in the supplied current-quarter materials.
The recognition schedule also matters. The fiscal 2026 filing indicated that approximately 19% of the July 3 RPO was expected to be recognized over the following 12 months. That percentage should not be mechanically applied to the larger current balance, which includes agreements with different timing. The $88.9 billion figure supports visibility, but does not establish a specific annual revenue floor without the updated recognition profile.
COUNTERPARTY CREDIT AND THE LIMITS OF FINANCIAL GUARANTEES
Management stated that 95% of NBMs are with investment-grade companies and referenced approximately $130 billion of operating cash flow generated by those counterparties. This is reassuring evidence of customer financial strength, although the weighting basis for the 95% figure and the measurement period for operating cash flow were not specified in the transcript.
The August call disclosed $16.5 billion of financial guarantees associated with the signed agreement portfolio. Relative to the $91.1 billion pro forma RPO then disclosed, that represented approximately 18.1% coverage. The guarantees are meaningful, but they do not represent full cash collateralization of every dollar of contracted revenue. The fiscal 2026 Form 10-K explicitly states that the guarantees may offset only part of the revenue lost following customer nonperformance.
Management previously explained that guarantees are released toward the end of agreements, which can improve the ratio of remaining protection to remaining obligations as contracts mature. That is economically favorable, but protection depends on the actual default provisions, enforceability, timing, and financial instruments involved.
The current call clarified that most guarantees are held by third-party financial institutions rather than on Sandisk’s balance sheet. They are not unrestricted liquidity available for repurchases. The Form 10-K further states that Sandisk does not control this collateral or have an unconditional right to access it before specified default or breach events occur.
Customer prepayments are different. Management said there is no legal restriction preventing their use for repurchases, but legal availability should not be confused with economic surplus. Prepayments create future delivery obligations, while refundable deposits can create future cash outflows. The appropriate test for sustainable capital returns is cash generation after operating requirements and investment, not the gross amount of customer funding received.
No current credit deterioration was reported. Nevertheless, investment-grade counterparties can still defer infrastructure deployment, renegotiate commercial arrangements, or reduce purchases outside contracted minimums. Credit quality protects payment probability more directly than it protects future growth. Strong contractual protection also does not eliminate Sandisk’s obligation to deliver qualified products on schedule.
AI INFERENCE: A CREDIBLE EXPANSION OF NAND’S ROLE, WITH IMPORTANT ARCHITECTURAL LIMITS
The call’s most important technology argument concerns the growing role of persistent storage in inference architectures. Longer contexts, higher concurrency, agentic workflows, multimodal inputs, and reused prefixes can increase the amount of state that must be stored, transferred, or recomputed. NAND can become more valuable when retaining that state is cheaper than rebuilding it.
For conventional transformer architectures, KV-cache capacity is broadly related to context length, concurrent sequences, layer count, KV-head count, head dimension, and precision. These relationships support management’s directional argument, but they are not immutable. Grouped-query attention, latent-attention approaches, quantization, sliding windows, cache eviction, and prefix sharing can reduce bytes required per useful workload.
The investment opportunity therefore depends on the interaction between more AI usage and better memory efficiency. Lower inference costs can stimulate consumption, but increased usage does not automatically translate into proportional NAND growth. The key variable is retained and economically useful state per deployed system after architectural optimization.
NAND’s role is not equivalent to replacing the highest-performance volatile-memory tier. Latency-sensitive active state can remain in HBM or DRAM, while less active context, reusable prefixes, staged data, and checkpoint material are retained in flash. The architecture must manage prefetching, locality, transfer bandwidth, and cache misses to avoid turning lower-cost capacity into a bottleneck.
Management cited an internal AI-lab comparison showing approximately 3 times token throughput and approximately 75% lower energy usage for SSD-enabled systems relative to systems relying on volatile memory alone. This is directionally encouraging, but does not establish a universal performance advantage. Avoided recomputation or reduced capacity constraints can explain large system-level gains without implying that flash is intrinsically faster than DRAM.
The call did not provide sufficient benchmark detail to generalize the result across model sizes, context lengths, concurrency, cache-hit rates, hardware configurations, or service-level requirements. It also did not establish whether the energy comparison was normalized to equal work, equal duration, or another basis. The finding should be treated as evidence of a potentially valuable architecture, not a general-purpose multiplier for industry demand.
The projection that KV cache could represent approximately 33% of AI data-center flash demand by the end of the decade is strategically significant. It implies that NAND demand increasingly depends on inference-state management rather than only conventional storage growth. It remains a management forecast. It should not be added to another AI storage forecast without checking whether the same workloads are already included.
The reference to 60 to 90 gigabytes per CPU is insufficiently scoped to support a reliable enterprise SSD content model. The transcript does not establish whether that figure refers to a specific workload allocation, caching tier, or broader server configuration. It should not be multiplied by total server CPU shipments to construct an addressable market.
TLC, QLC, AND SLC: PRODUCT MIX CAN CHANGE BOTH DEMAND AND EFFECTIVE SUPPLY
Management described the prevailing TLC/QLC mix as approximately 70%/30% and expects it to remain broadly similar through the remainder of fiscal 2027. TLC continues to support applications requiring stronger write performance and endurance, while QLC expands the capacity-oriented portion of the portfolio.
The emerging development is greater differentiation within inference architectures. Management described QLC entering selected KV-cache use cases where workload characteristics permit, while SLC is being evaluated for more endurance-intensive applications. These are not contradictory directions. Different layers of the same system can optimize for different combinations of capacity, latency, write intensity, and cost.
SLC is particularly important because it can expand NAND’s addressable workloads while reducing effective bit output from existing manufacturing resources. Operating a comparable cell in SLC mode stores 1 bit rather than 3 in TLC mode or 4 in QLC mode. All else equal, converting a portion of production to SLC therefore sacrifices capacity relative to those higher-density modes.
For illustration, allocating 5% of otherwise comparable TLC cell resources to SLC would reduce total bit output by approximately 3.3%; against an all-QLC baseline, the reduction would be approximately 3.8%. These are simplified capacity sensitivities, not forecasts, and actual outcomes depend on die design, allocation, yields, and product configuration.
The commercial implication is that relatively modest SLC demand could tighten available capacity without requiring a large number of delivered SLC bits. Higher revenue per delivered bit would not necessarily represent better wafer economics, however, because the customer must compensate for the sacrificed density and any additional qualification or system costs.
Goeckeler stated, “I don’t think it’s a cannibalization of other NAND products,” framing SLC as an expansion into workloads potentially served by DRAM. That remains a hypothesis under customer evaluation. Management repeatedly emphasized that these were architectural conversations, not an established revenue ramp.
The cited 20 to 40 times NAND-versus-DRAM cost differential should not be treated as the realized savings from an SLC solution. Reduced density, controllers, packaging, endurance management, software integration, and performance requirements all affect total cost. The relevant question is whether the system-level economics remain attractive after those adjustments.
Manufacturing flexibility is nevertheless valuable. Management explained that existing cells can operate in different modes, so serving SLC demand does not necessarily require a separate dedicated fab. The constraint is the allocation of existing wafer resources and the associated opportunity cost, not simply whether nominal SLC capacity exists.
TECHNOLOGY ROADMAP AND HBF COMMERCIALIZATION
BiCS8 remains the current production foundation. CMOS directly bonded to array allows logic and memory-array development to proceed with greater independence, supporting different combinations of interface capability and memory-cell architecture.
BiCS9 exemplifies that approach by combining the established BiCS8 array with next-generation CMOS. This can improve interface performance while retaining a mature memory architecture, potentially reducing development and manufacturing risk relative to a simultaneous redesign of every major component.
BiCS10 represents a broader node transition. Sandisk’s July 2 announcement identified a 1Tb TLC device with 332 layers, approximately 59% higher bit density than BiCS8, and up to 4.8Gb/s interface speed. The August investor-day release described approximately 60% higher bit density for BiCS10 QLC. The transcript’s references to terabyte-sized individual dies should not be used literally; the official TLC disclosure specifies terabits.
Density improvements are economically important, but they are not equivalent to an immediate increase in company shipments. Product qualification, tooling, wafer-cycle times, yields, and the timing of production conversion determine when nominal technology improvements become available supply. Management explicitly said BiCS10 remains further out while BiCS8 is still ramping.
HBF achieved a meaningful development milestone with the tape-out of its first memory die. That advances the program beyond architectural simulation, but does not establish a finished commercial product. The controller or base die still requires completion, the components must be integrated, and customers must validate the resulting product in actual systems.
Management maintained the expectation of initial HBF-based product samples during calendar 2027. No meaningful revenue-ramp date, customer adoption commitment, market size, or production margin was provided. The most important statement was that HBF “is not included in the long-term financial model.”
This makes HBF an option on additional value rather than a prerequisite for the base investment case. Assigning a large near-term revenue contribution would be premature. Conversely, a delay in sampling would reduce technology optionality but would not automatically invalidate the existing NAND cash-flow thesis.
The technical objective is ambitious: HBM-class read bandwidth with much greater capacity. Comparable aggregate read bandwidth does not establish comparable random-access latency, write capability, endurance, or software compatibility. Commercial success will depend on whether a useful class of inference workloads can exploit the capacity advantage without unacceptable penalties elsewhere.
The next meaningful milestones are working memory silicon, controller completion, integrated samples, measured customer-system performance, packaging and manufacturing readiness, and a disclosed path to commercial deployment. Tape-out is progress toward those milestones, not a substitute for them.
SUPPLY DISCIPLINE AND CAPITAL INTENSITY
Management maintained its mid-to-high-teens bit-growth plan and explicitly rejected accelerating node transitions simply to satisfy stronger demand. Goeckeler stated that there were “no plans to change that at this point.” This is a favorable signal for pricing discipline and near-term returns, while also placing a limit on how much incremental demand Sandisk can physically capture.
The roughly 120-day wafer-production cycle constrains short-term flexibility. Available TLC, QLC, die configurations, and finished-product qualifications further limit the ability to redirect output. Strong demand for a particular enterprise product cannot always be met by reallocating any available NAND wafer.
Management expects calendar 2027 data-center bit demand to increase approximately 40%, following more than a doubling in 2026, and expects data center to exceed 55% of industry bits. The 40% figure applies to data center, not the entire NAND market.
As an illustrative sensitivity, if data center began a period at 50% of industry bits, grew 40%, and all other demand were flat, total industry demand would grow 20%. Positive growth elsewhere would increase that figure. This supports the possibility of continued tightness relative to Sandisk’s own supply plan, but it is not a formal industry forecast because management’s current mix estimate is not necessarily the calendar-year starting average.
Gross capital expenditures were $378 million, or 3.4% of quarterly revenue. Management expects spending to increase over the balance of fiscal 2027 and reach a mid-single-digit percentage of annual revenue. The low current ratio should not be annualized.
The capex ratio also benefits from elevated revenue per bit. A low percentage of revenue does not necessarily imply proportionately low physical investment. Absolute spending, wafer capability, technology-transition costs, and joint-venture financing are more informative than the revenue ratio alone.
The joint-venture structure is another essential qualification. Sandisk’s direct purchases of property and equipment were only $54 million in the cash-flow statement, but this is not the same measure as the $378 million gross-capex figure discussed on the call. Flash Ventures funding, lease structures, and manufacturing payments affect the economic investment requirement.
The fiscal 2026 filing disclosed $923 million of Flash Ventures lease guarantees at July 3 and contractual payments to Kioxia totaling $1.2 billion over 2026 through 2029 for manufacturing services and continued supply availability. These historical commitments are not new expenses to subtract again from current reported cash flow. They demonstrate why “debt-free” should not be interpreted as free of contractual or contingent financial obligations.
CASH FLOW: THE RECONCILIATION IS MORE IMPORTANT THAN THE HEADLINE
The apparent difference between the Bloomberg notice’s $6.309 billion free-cash-flow figure and management’s $5.696 billion adjusted free cash flow is fully reconcilable.
Operating cash flow was $6.363 billion. Deducting $54 million of property and equipment purchases produces $6.309 billion of free cash flow. Deducting $148 million of net Flash Ventures activity and $465 million of NBM prepayments and deposits produces $5.696 billion of adjusted free cash flow. The company-defined adjusted measure is therefore more conservative than the conventional free-cash-flow figure and removes customer-funding effects.
The sequential comparison reinforces the importance of that adjustment. Operating cash flow declined 10.7% from $7.126 billion, and conventional free cash flow declined 10.9% from $7.083 billion. Adjusted free cash flow nevertheless increased 13.1% from $5.035 billion because the preceding quarter contained a much larger $1.938 billion adjustment for NBM prepayments and deposits.
The correct conclusion is that underlying adjusted cash generation increased while headline operating cash flow declined. It would be misleading either to describe cash flow as uniformly accelerating or to interpret the operating-cash-flow decline as evidence that core cash generation deteriorated.
Cash conversion did weaken relative to revenue and earnings. Adjusted free-cash-flow margin declined from 56.2% to 51.6%, and adjusted free cash flow represented approximately 74.7% of adjusted net income. Rapid growth can absorb working capital, but sustained divergence between earnings and cash would reduce the value of the apparent earnings multiple.
Receivables are the principal near-term item to monitor. Accounts receivable increased $1.877 billion, or 39.9%, to $6.585 billion, versus revenue growth of 23.0%. Management attributed the change primarily to customer mix, with some effect from shipment timing.
Using closing receivables divided by quarterly revenue and a 91-day quarter produces an approximate collection-days proxy of 54.3 days, versus 47.8 days in fiscal Q4. This is not a formally reported average-balance DSO measure, but the approximately 6.5-day increase is economically meaningful. It does not prove credit deterioration or revenue-quality problems, particularly during a rapid customer-mix shift. It does justify monitoring receivable aging, contractual payment terms, shipment linearity, and subsequent collections.
Inventory increased $318 million to $3.016 billion. Contract liabilities increased $287 million to $1.529 billion, while refund liabilities increased $97 million to $1.597 billion. Tax-payable movements also supported operating cash flow. These items show that cash conversion reflects growth-related working capital, customer funding, and payment timing rather than simply the operating margin.
An additional cash requirement sits outside the company’s adjusted free-cash-flow measure: $755 million of taxes paid on vested employee stock awards, classified as financing cash flow. Subtracting that payment from adjusted free cash flow leaves $4.941 billion before the $5 billion repurchase program.
That calculation is an analytical cash-after-awards measure, not Sandisk’s reported free cash flow. It indicates that repurchases approximately consumed the quarter’s adjusted cash generation after employee-equity cash settlements. The $755 million payment is distinct from the $91 million stock-compensation expense and should not be assumed to recur at the same level.
GAAP EARNINGS, EQUITY INVESTMENTS, AND CAPITAL RETURNS
GAAP EPS of $52.60 exceeded adjusted EPS of $49.51 because GAAP earnings included a $513 million gain on equity securities, primarily related to the Nanya investment. This is not operating NAND profitability and should not be capitalized at the same multiple as recurring product earnings.
The company held $2.289 billion of marketable equity securities at quarter-end, separately from $5.136 billion of cash and cash equivalents. Those securities provide potential asset value, but are not cash equivalents and can introduce correlated semiconductor-market exposure. Their mark-to-market gains should not be treated as recurring operating cash generation.
Stock-based compensation of $91 million was only approximately 0.8% of revenue, but the fiscal Q2 release anticipates $146 million to $197 million of excluded stock-compensation expense. The adjustment burden is therefore expected to rise, even though it remains small relative to the current revenue base. That expense guidance does not predict the amount of future award-related cash withholding.
Sandisk repurchased approximately 3.2 million shares for $5 billion during fiscal Q1, implying an approximate average purchase price of $1,563. The $1,302 after-hours reference price was approximately 16.7% below that average. This does not determine whether the repurchases create long-term value, but it illustrates the importance of valuation discipline when returning large amounts of capital during an extraordinary earnings environment.
Repurchases represented approximately 87.8% of reported adjusted free cash flow. The commitment to return 100% of excess cash is not a commitment to repurchase $5 billion every quarter. Investment requirements, working capital, customer-funding obligations, and liquidity needs determine the excess.
The closing cash balance was $374 million above the prior quarter despite the $5 billion repurchase. The $5.136 billion balance was approximately 45% below the Bloomberg consensus figure of $9.39 billion, but this should not be characterized as an operating cash-flow miss. Capital returns and other financing and investing activity materially affect closing cash, and the consensus assumptions for those items were not provided.
Management rejected the suggestion that increased predictability should justify debt-funded repurchases. The stated policy remains a debt-free balance sheet, investment in the business, and return of excess cash. Given the continuing manufacturing, customer, and technology risks, that restraint supports the quality of the investment case.
FISCAL Q2 GUIDANCE AND THE MARCH-QUARTER WARNING
Fiscal Q2 revenue guidance of $12.2 billion to $12.6 billion implies sequential growth of 10.6% to 14.2%. The $12.4 billion midpoint is 2.5% above Bloomberg consensus of $12.1 billion. Adjusted EPS guidance of $55 to $57 has a midpoint 6.2% above the $52.72 consensus estimate.
Adjusted gross margin is expected to remain between 84.5% and 85.5%, compared with consensus of 84.8%. Adjusted operating expenses are expected to increase to $540 million to $560 million, with a midpoint 7.2% above the reported quarter. At the revenue, margin, and expense midpoints, implied operating income is approximately $9.990 billion, with an operating margin of approximately 80.6%.
The EPS midpoint implies approximately $8.456 billion of adjusted net income using 151 million diluted shares, or approximately 10.9% sequential growth. EPS growth of 13.1% is therefore expected to benefit again from the declining share count, while most of the increase remains earnings-driven.
The separately disclosed midpoint assumptions do not reproduce the EPS midpoint exactly. Applying the 14.3% tax rate to the midpoint operating calculation, before other income or expense, produces approximately $56.70 per share. Rounded ranges and undisclosed scenario relationships limit exact reconstruction. This is not sufficient evidence of an accounting inconsistency or a quantified hidden earnings cushion.
Management expects modest like-for-like pricing increases in fiscal Q2 and modest pricing increases through the year. This is supportive, but materially different from assuming another period of explosive repricing. Volume availability and product allocation increasingly determine the growth rate.
The new fiscal Q2 outlook is an initial quantified forecast for that quarter, not a revision to a previously disclosed fiscal Q2 range. It is appropriately described as above consensus. The August fiscal Q1 guidance and the current fiscal Q1 actuals provide the valid same-period beat comparison.
Reported fiscal Q1 revenue plus the fiscal Q2 midpoint totals $23.431 billion, already 15.7% above the entirety of fiscal 2026 revenue. This illustrates the scale of the earnings reset, but is not full-year guidance.
The most important caution concerns fiscal Q3, corresponding broadly to the March period. Visoso stated, “I would be conservative in your sequential growth from Q2 to Q3.” Management cited a historical 19% sequential decline in bits while discussing seasonality. That was not fiscal Q3 guidance, and a bit decline is not equivalent to the same revenue decline.
The warning should prevent automatic annualization of sequential growth or the assumption that data-center exposure has eliminated seasonality. The next earnings call will be important not only for fiscal Q2 execution, but also for whether the March outlook demonstrates that contractual coverage and enterprise mix have moderated the usual seasonal downturn.
VALUATION, SCENARIOS, AND RISK-ADJUSTED POSITIONING
The $1,302 after-hours price in the Bloomberg notice is a point-in-time reference, not a verified subsequent trading price. At that reference, annualizing the fiscal Q2 EPS midpoint produces $224 of EPS and a 5.8 times earnings multiple. The annualization is a valuation sensitivity, not a fiscal-year forecast.
Using approximately 144 million actual shares outstanding at quarter-end produces an equity value of approximately $187.5 billion. Annualizing fiscal Q1 adjusted free cash flow produces approximately $22.8 billion, implying a 12.2% cash-flow yield on that basic-share equity value. Dilution lowers the effective per-share yield, and the annualization does not incorporate seasonality, higher future capex, or changes in working capital.
The 154 million share figure discussed on the call is the diluted weighted-average earnings denominator, not the actual closing common-share count. Using it interchangeably with actual shares outstanding would distort market capitalization and repurchase analysis.
A useful normalization test applies the investor-day operating-margin framework to the fiscal Q2 revenue run rate. Annual revenue of $49.6 billion, a 75% adjusted operating margin, a 14.3% tax rate, and 151 million diluted shares produce approximately $211 of annual EPS before meaningful other income or expense. At $1,302, the resulting multiple is approximately 6.2 times. This suggests that moderate margin normalization alone does not eliminate the valuation opportunity if the revenue base proves durable.
The following 12-to-18-month scenarios are illustrative underwriting assumptions rather than management guidance or statistically calibrated probabilities.
The base case, assigned a 50% probability, assumes annual revenue of $48 billion, 80% adjusted gross margin, $2.4 billion of operating expenses, a 14.3% tax rate, and 148 million diluted shares. These assumptions produce approximately $208 of EPS. An 8 times multiple implies approximately $1,670 per share, or 28% upside. This case allows revenue below the fiscal Q2 annualized pace and margins consistent with the long-term framework.
The bull case, assigned a 25% probability, assumes revenue of $55 billion, 85% adjusted gross margin, $2.5 billion of operating expenses, the same tax rate, and 145 million diluted shares. EPS would be approximately $262. A 10 times multiple implies approximately $2,620 per share, or 101% upside. This requires continued supply tightness, successful enterprise ramps, strong cash conversion, and greater confidence in contractual durability. It does not require a material HBF revenue contribution.
The bear case, assigned a 25% probability, assumes revenue of $36 billion, 60% adjusted gross margin, $2.3 billion of operating expenses, the same tax rate, and 151 million diluted shares. EPS would be approximately $110. A 6 times multiple implies approximately $660 per share, or 49% to 50% downside. This reflects weaker uncommitted pricing, reduced growth, lower margins, and diminished buyback capacity despite continued profitability.
The probability-weighted value is approximately $1,650 per share, implying approximately 27% upside. The substantial bear-case loss argues against treating the stock as a low-risk cash-yield investment. The earnings multiple is attractive because the market assigns a material probability to deteriorating economics, not because the risk has disappeared.
A conditional initial position of approximately 1% of NAV is appropriate near or below the reference price, with expansion toward 2% dependent on evidence of contract conversion, receivable collection, and sustained cash generation. An initial 15% price-risk threshold would correspond to approximately $1,107 on the pre-split basis. At a 1% position, that implies approximately 15 basis points of portfolio loss before gap risk; a 50% fundamental downside scenario implies approximately 50 basis points.
The price threshold is a risk-budget rule, not an identified technical support level. Earnings gaps, liquidity changes, and rapid repricing can produce larger losses. Positions should be reduced or exited earlier if the fundamental thesis breaks, including unexpected reductions in contracted coverage, customer nonperformance, material loss of qualified enterprise business, sustained erosion below the long-term margin framework, or persistent cash conversion materially weaker than earnings.
Exposure should be assessed alongside other AI infrastructure and memory positions. Sandisk can diversify the product mix of an AI portfolio without diversifying the underlying hyperscaler-capex factor. Correlation with accelerator suppliers, memory manufacturers, semiconductor equipment companies, and data-center infrastructure exposures could increase during a spending reassessment. Exact portfolio concentration and marginal risk contribution cannot be quantified without holdings and exposure data.
CATALYSTS, READ-THROUGHS, AND THE EVIDENCE REQUIRED NEXT
The immediate operating catalyst is fiscal Q2 delivery against the $12.2 billion to $12.6 billion revenue range and the 84.5% to 85.5% gross-margin range. The next major expectation-setting event is the March-quarter outlook. Evidence that enterprise demand and contracts meaningfully moderate seasonality would support the durability argument; a pronounced decline would require more conservative annual earnings assumptions even if long-term demand remains strong.
Additional NBM signings over the next several months and quarters are potentially important, particularly if they increase fiscal 2028 coverage above the current approximately 67% level. The most useful disclosures would include incremental committed volume, pricing floors and ceilings, recognition timing, counterparty quality, and financial protection. A larger unsigned pipeline alone would provide less incremental valuation support.
Cash conversion is another catalyst. Receivable growth moderating below revenue growth, stronger collections, and adjusted free-cash-flow margins near the approximately 50% long-term framework would support the credibility of earnings and capital returns. Continued cash accumulation driven primarily by advances or tax-payment timing would be less persuasive.
HBF samples during calendar 2027 could increase the value assigned to technology optionality, but working customer-system results matter more than an additional architectural announcement. The existing earnings thesis should remain separable from that development program.
The read-through to Kioxia is directionally favorable because shared manufacturing technology and strong NAND demand support the joint production platform. Sandisk’s margins, contract economics, and capital-return capacity should not be directly transferred to Kioxia without accounting for ownership, financing, customer mix, and commercial arrangements.
The broader read-through to Samsung, SK hynix, and Micron is positive for NAND demand and potentially for supply discipline. It is not evidence that every supplier can replicate Sandisk’s enterprise qualifications or NBM pricing. SLC evaluation also does not establish an imminent displacement of HBM; the call primarily supports selective expansion of NAND into lower-cost memory and storage tiers.
For semiconductor equipment suppliers, the demand signal is more restrained than the revenue growth might suggest. Sandisk explicitly maintained its supply plan rather than announcing accelerated capacity expansion. Strong NAND profitability improves future investment capacity, but an immediate equipment-order surge is not supported by this call.
For accelerator and server platforms, more efficient memory hierarchies can improve utilization and inference economics. Better efficiency can stimulate demand, but it can also reduce hardware requirements per unit of work. The net effect depends on usage elasticity and deployment economics. Similarly, QLC growth in faster data lakes does not automatically establish displacement of lower-cost hard-disk storage in colder tiers.
The announced 8-for-1 stock split is effective November 19, with split-adjusted trading expected November 20. It changes neither enterprise value nor ownership economics. Fiscal Q2 EPS guidance becomes approximately $6.88 to $7.13, and the $1,302 reference price becomes $162.75. The split is a trading and presentation event, not an operating catalyst.
The overall conclusion is favorable but conditional. The quarter provides strong evidence of enterprise product execution, customer willingness to make long-term commitments, and a much larger cash-generating revenue base. It provides less evidence that current margins are permanent, that pipeline demand is fully contracted, or that cash conversion will remain uniformly strong. The shares merit a controlled long exposure because the valuation remains attractive under moderate normalization, while the unresolved durability questions require explicit limits on position size and loss tolerance.
SOURCE AND MEASUREMENT NOTES
Financial comparisons reflect Sandisk’s October 29 earnings release, August 5 earnings release and call, August 13 investor-day release, fiscal 2026 Form 10-K, the supplied current-quarter transcript, and the accompanying Bloomberg notice. Current-quarter RPO is taken from the Bloomberg summary of the earnings slides; the complete current-quarter presentation was not independently readable. All valuation scenarios and prices are on the pre-split basis unless specifically identified otherwise. Direct management quotations are from the supplied current-quarter call. Data center, edge, and consumer are end-market revenue categories, not separately disclosed profit segments.
COMPANY EMPLOYEES ON THE CALL
• David Goeckeler, Chairman and Chief Executive Officer. • Luis Visoso, Executive Vice President and Chief Financial Officer. • Ivan Donaldson, Vice President of Investor Relations.
RESEARCH ANALYSTS ON THE CALL
• Ben Reitzes, Melius Research. • Joe Moore, Morgan Stanley. • Mark Newman, Bernstein. • David Gibson, MST Financial. • C.J. Muse, Cantor Fitzgerald. • Karl Ackerman, BNP Paribas. • Vijay Rakesh, Mizuho. • Jim Schneider, Goldman Sachs. • Steven, surname not identified in the supplied transcript, TD Cowen, speaking on behalf of Krish Sankar. • Wamsi Mohan, Bank of America. • Amit Daryanani, Evercore ISI. • Mehdi Hosseini, Susquehanna International Group.
Key Read-Throughs
KEY READ-THROUGHS FROM SANDISK’S FISCAL Q1 2027 EARNINGS CALL
Sandisk’s results reinforce a redistribution of semiconductor economics toward scarce memory capacity and away from price-sensitive device manufacturers. The strongest positive read-through is to Kioxia, given the shared NAND technology and manufacturing platform. The clearest negative read-through is to PC and handset businesses that depend on unit growth or must absorb higher memory costs. The important distinction is that NAND demand can expand through greater capacity per device, enterprise mix, and new inference applications even while device shipments decline. For semiconductor equipment, the call supports continued technology-conversion spending but explicitly does not establish accelerated capacity expansion. Much of the broad AI-memory strength was already visible in peers’ results; the incremental information concerns demand extending into 2027, customer requests exceeding existing commitments, Sandisk’s increasingly credible enterprise SSD position, and continued supply discipline.
MEMORY MANUFACTURING AND ENTERPRISE STORAGE
KIOXIA IS THE MOST DIRECT BENEFICIARY OF THE SHARED TECHNOLOGY PLATFORM’S COMMERCIAL VALIDATION (READ-THROUGH 1)
Affected company: Kioxia Holdings (285A: Japan). Direction: positive. Magnitude: high fundamental relevance, with a potentially meaningful near-term expectations catalyst.
Sandisk reported data-center revenue of $4.802 billion, up 61% sequentially, supported by BiCS8, established TLC products, newly ramping QLC products, and relationships with 3 US hyperscalers. Management also stated that customers “have underestimated the amount of NAND they need to run their infrastructure.” These disclosures provide unusually direct evidence that the shared underlying NAND platform is commercially competitive in demanding enterprise applications.
The transmission mechanism is stronger than a generic industry-demand correlation. Kioxia and Sandisk jointly develop NAND technology and operate through their Japanese manufacturing partnership. Commercial acceptance of BiCS8-based products validates the underlying memory architecture and supports the economic rationale for subsequent technology investments. Sustained demand for Sandisk’s output also supports predictable production planning and utilization across the shared manufacturing platform.
The benefit should not be mischaracterized as Kioxia receiving a proportional share of Sandisk’s enterprise SSD revenue or its 85.1% gross margin. The companies have different downstream products, controllers, firmware, customer qualifications, pricing arrangements, and financial structures. Sandisk’s NBM contracts do not automatically become Kioxia contracts. The defensible read-through is to the competitiveness and demand visibility of the manufacturing platform, with Kioxia’s realized earnings determined by its own commercial execution.
The relationship also has a direct financial component. The January joint-venture extension included $1.165 billion of payments from Sandisk to Kioxia over 2026 through 2029 for manufacturing services and continued supply availability. Those payments were previously announced and are not incremental consideration created by this quarter. They nevertheless reinforce that Kioxia participates through manufacturing economics as well as its own NAND sales.
The immediate catalyst is Kioxia’s scheduled October 30 fiscal Q2 results, following Sandisk’s October 29 call. The most relevant confirmation points are Kioxia’s own pricing, enterprise mix, technology-transition costs, and supply outlook. Sandisk’s performance raises the evidentiary standard for a weak demand explanation, but does not establish a specific Kioxia earnings beat.
Over 12 to 36 months, the opportunity is stronger utilization visibility and monetization of successive BiCS generations. The geographic concentration is equally important: holding Kioxia and Sandisk together does not diversify exposure to disruptions at the shared Japanese manufacturing base.
NAND PRICING SUPPORT EXTENDS INTO 2027, BUT THE NEW INFORMATION IS DURATION RATHER THAN DISCOVERY OF A BOOM (READ-THROUGH 2)
Affected companies: Micron Technology (MU: United States), SK hynix (000660: South Korea), and Samsung Electronics (005930: South Korea). Direction: positive for NAND economics. Magnitude: potentially substantial within NAND, but more moderate at the consolidated-company level because of differing DRAM, HBM, and other business exposures.
Sandisk expects calendar 2027 data-center bit demand to grow approximately 40%, following more than a doubling in 2026, and expects data center to represent more than 55% of industry bits. Management maintained its own mid-to-high-teens bit-growth plan and expects pricing to continue increasing modestly through the fiscal year. The combination supports a longer period of favorable NAND supply-demand conditions.
The transmission mechanism is higher realized revenue per bit relative to manufacturing cost, supported by demand migrating toward enterprise applications and constrained availability of qualified supply. For competitors with suitable enterprise SSD products, the opportunity is not simply higher spot prices. It includes richer product mix, improved production planning, and stronger negotiating positions when customers secure future supply.
The 40% demand figure must not be compared mechanically with Sandisk’s supply growth to calculate an industry shortage. The former concerns the global data-center segment; the latter concerns a single producer’s total bit output. Nevertheless, a fast-growing segment already representing roughly 50% of industry bits can materially influence clearing prices across the broader market. Consumer weakness does not necessarily create abundant supply for enterprise applications because product configurations and qualification requirements differ.
SLC introduces an additional potential constraint on effective bit supply. Management stated that shifting comparable cells into SLC creates a “clear trade ratio of 3 to 1, 4 to 1,” relative to TLC and QLC. The physical implication is high conviction: greater SLC allocation sacrifices delivered capacity from existing wafer resources. The commercial adoption rate is not established. SLC should therefore be treated as upside risk to tightness, not as a quantified 2027 shipment forecast.
The near-term trading novelty is limited by reporting chronology. Micron reported on September 30, SK hynix on October 28, and Samsung on October 29, before Sandisk’s call. Their disclosures already described strong AI-memory conditions. Samsung specifically discussed increasing QLC SSD supply and pursuing multiyear contracts. Sandisk primarily adds independent confirmation of demand duration, additional customer requests, and continued restraint in its own production plan.
The longer-duration implication is favorable for earnings visibility, particularly where competitors secure their own enforceable volume and pricing protections. Sandisk’s contracts cannot justify applying its margin framework or reduced-cyclicality valuation to every memory supplier. Contract structure, customer quality, and capacity additions remain company-specific.
The portfolio consequence is that exposure through US, Korean, and Japanese memory stocks can be more correlated than the geographic diversification suggests. The shared driver is AI infrastructure spending and the persistence of favorable memory pricing.
SANDISK’S ENTERPRISE SSD RAMP IS A NEGATIVE COMPETITIVE SIGNAL FOR INCUMBENTS, EVEN WHILE THEIR ABSOLUTE SALES GROW (READ-THROUGH 3)
Affected companies: Samsung Electronics (005930: South Korea), SK hynix (000660: South Korea), through Solidigm, and Micron Technology (MU: United States). Direction: negative for enterprise SSD share durability and the capture of incremental customer spending. Magnitude: moderate over a multiyear horizon; limited evidence of immediate consolidated earnings damage.
Sandisk’s data-center revenue increased from $269 million in the prior-year quarter to $4.802 billion. Management identified 3 US hyperscaler relationships and said the qualification phase for its QLC product was “100% behind us.” Customers are now ramping that product. This is evidence of an increasingly credible enterprise competitor, not merely an aspirational product announcement.
The transmission mechanism is customer allocation. Once a supplier has qualified products, demonstrated operational execution, and committed future volumes, it becomes a more credible recipient of incremental enterprise SSD spending. That reduces the proportion of future demand that established suppliers can assume will accrue to them. Over time, broader qualified supply can also improve customers’ negotiating leverage.
The distinction between share and absolute revenue is essential. A rapidly expanding market can support strong revenue growth at Samsung, Solidigm, and Micron while Sandisk gains a larger share of incremental business. Sandisk’s revenue growth also includes pricing and mix, so its approximately 17.9-fold year-over-year increase cannot be translated into an equivalent market-share gain.
The pressure is most relevant to assumptions that incumbent enterprise SSD positions will remain structurally protected after the present shortage eases. In a supply-constrained market, qualified suppliers may all sell their available output. Competitive consequences become more visible when new capacity arrives, customers revise allocation plans, or contracts are renewed.
NBMs can make the competitive change more persistent. Sandisk is not relying exclusively on discretionary quarterly orders; a meaningful portion of future production is already committed. That improves the likelihood that newly established customer relationships survive beyond the initial qualification cycle. The counterpart is that contractual pricing ceilings may limit Sandisk’s participation in extreme pricing upside, rather than guaranteeing unlimited pricing power.
Near-term catalysts are additional Sandisk qualifications, customer ramps, and signed contract expansions. Over 12 to 36 months, the relevant tests are peer enterprise SSD growth relative to the market, customer allocation commentary, and contract-renewal economics. No specific customer loss or supplier replacement was identified on this call. The read-through is a competitive headwind within an otherwise favorable market, not sufficient evidence for an outright bearish consolidated earnings view.
PCS AND CLIENT HARDWARE
MEMORY INFLATION CAN SUPPORT PC REVENUE WHILE UNDERMINING UNITS AND PROFITABILITY (READ-THROUGH 4)
Affected companies: HP Inc. (HPQ: United States), Lenovo Group (0992.HK: China), and Dell Technologies (DELL: United States). Direction: negative for client-device affordability and margin resilience. Magnitude: highest for HP’s PC earnings exposure; more moderate for Lenovo and smaller at Dell’s consolidated level because of infrastructure offsets.
Sandisk expects PC unit shipments to decline by a low-single-digit percentage in calendar 2027 while PC exabyte demand grows. It also reported a 29% sequential decline in consumer revenue as the market adjusted to higher pricing and described pressure at the lower end of edge markets. These disclosures directly challenge the assumption that strong memory revenue signals a broad-based PC replacement recovery.
The transmission mechanism has 2 channels. If OEMs absorb higher NAND costs, gross profit per system declines. If they pass costs through, affordability deteriorates and unit demand can weaken. Larger-capacity configurations and premium mix can raise revenue per PC without improving total shipments. Procurement arrangements and inventories can delay the effect, but do not eliminate the economic trade-off.
HP provides a particularly useful cross-check. Its already-reported fiscal Q3 Personal Systems revenue increased 18%, while units declined 16%, and the business generated a 4.6% operating margin. This is direct evidence that reported PC revenue growth can coexist with a significant contraction in shipments.
The margin sensitivity is material. An illustrative 100-basis-point unrecovered cost increase, expressed as a share of revenue, would reduce operating profit by approximately 22% in a business starting at a 4.6% operating margin, assuming unchanged revenue and other expenses. This is not a forecast of HP’s actual memory-cost impact. It demonstrates why relatively modest component-cost leakage can matter disproportionately to PC earnings.
Lenovo’s previously reported 7.1% Intelligent Devices operating margin provides a larger buffer. Its scale, procurement capabilities, premium products, and infrastructure business also complicate a simple negative company-wide inference. Dell is an even less direct expression of the PC headwind: its latest reported Infrastructure Solutions revenue was $31.8 billion, compared with $15.0 billion for Client Solutions, and infrastructure profitability was growing strongly.
Accordingly, the high-conviction conclusion is not that every PC OEM must miss earnings. It is that stronger memory spending does not validate stronger PC unit demand, and that hardware revenue growth increasingly requires scrutiny of units, average selling prices, and retained gross profit.
Near-term catalysts are the next OEM results and forward commentary on component-cost pass-through, inventories, channel promotions, and client operating margins. Over the next 2 to 4 quarters, the fundamental issue is whether higher device prices prolong replacement cycles.
Management also said the current calendar quarters represent the most difficult year-over-year unit comparisons and that conditions should improve thereafter. The call therefore supports continued pressure and a weak volume-recovery thesis, not a forecast that PC declines accelerate indefinitely.
SMARTPHONE SEMICONDUCTORS
RISING NAND CONTENT DOES NOT RESCUE HANDSET CHIP VOLUMES (READ-THROUGH 5)
Affected companies: MediaTek (2454: Taiwan) and Qualcomm (QCOM: United States). Direction: negative for broad handset-volume recovery assumptions. Magnitude: moderate at the handset-business level, with potentially important earnings sensitivity but meaningful company-specific offsets.
Sandisk expects smartphone exabyte demand to increase in 2027 despite slightly declining units. Management attributed part of the content increase to premium mix and acknowledged continuing pressure at the low end. This creates a critical divergence: a smaller number of higher-capacity smartphones can support NAND growth without creating more application-processor or modem shipments.
The transmission mechanism is primarily through customer device economics, not an assumption that higher NAND prices flow directly into every chip supplier’s cost of goods sold. Higher smartphone memory costs can raise retail prices, compress OEM margins, delay launches, or force reductions elsewhere in the bill of materials. Each outcome can weaken demand for handset chipsets or intensify commercial negotiations.
MediaTek’s latest reported results already support this channel. Its Q2 mobile-phone revenue declined 14% sequentially and 20% year over year, explicitly because higher smartphone bill-of-materials costs weakened demand. Mobile phones represented 41% of revenue. Qualcomm’s latest reported handset revenue also declined 20% year over year to $5.086 billion. Sandisk therefore corroborates an existing problem rather than revealing previously undisclosed weakness.
The incremental implication concerns the recovery path. Sandisk’s expectation of positive smartphone NAND growth should not be used as evidence that chipset unit demand is recovering. The appropriate bridge requires handset shipments, platform share, chipset selling prices, and product-tier mix.
Premiumization can partly offset the headwind. MediaTek’s flagship products and Qualcomm’s premium positioning may support revenue per device even if overall smartphone units remain weak. Qualcomm’s licensing economics also differ from chipset shipment economics. Automotive, IoT, and other growth businesses can further reduce the consolidated impact. These offsets prevent a high-conviction forecast of company-wide revenue contraction from the Sandisk call alone.
The immediate catalysts are unusually close: MediaTek’s Q3 investor conference is scheduled for October 30, and Qualcomm’s fiscal Q4 results for November 4. The most actionable questions within those releases are whether handset shipment assumptions require a recovery inconsistent with Sandisk’s outlook, and whether flagship launches genuinely offset weakness elsewhere rather than merely raising average selling prices.
The longer-duration risk is that AI features and higher memory configurations increase device prices faster than mass-market willingness to pay. However, Sandisk’s expectation of only modest unit declines in 2027 is less severe than the substantial 2026 contraction previously described by handset suppliers. The negative read-through is to an aggressive rebound thesis, not to the proposition that conditions must worsen from the current trough.
SEMICONDUCTOR EQUIPMENT
TECHNOLOGY CONVERSIONS REMAIN SUPPORTED, BUT SANDISK DOES NOT VALIDATE AN IMMEDIATE CAPACITY-SPENDING SURGE (READ-THROUGH 6)
Affected companies: Lam Research (LRCX: United States) and Tokyo Electron (8035: Japan). Direction: positive for advanced NAND conversion and process-intensity demand; negative for expectations of immediate incremental spending driven by accelerated Sandisk capacity expansion. Magnitude: moderate fundamental support, but limited incremental near-term earnings upside from this call.
Sandisk reported $378 million of quarterly gross capex and expects spending to increase over the fiscal year to a mid-single-digit percentage of revenue. At the same time, management maintained its existing mid-to-high-teens bit-growth plan and explicitly rejected accelerating node transitions, stating that there were “no plans to change that at this point.”
The transmission mechanism favors conversion equipment rather than an indiscriminate increase in wafer starts. Moving production toward more advanced 3D NAND requires process upgrades, deeper and more complex structures, and changes in etch and deposition requirements. Equipment suppliers can benefit even if the customer does not materially accelerate total wafer capacity.
Lam has direct exposure through its NAND installed base and deposition and etch portfolio. Its October 21 earnings call already reported that NAND represented 26% of systems revenue and that NAND systems revenue increased approximately 40% sequentially, supported by conversions to 256-layer-and-above devices. Sandisk corroborates the customer demand supporting this activity, but should not be counted as another independent order announcement.
Tokyo Electron’s August earnings materials described opportunities in cryogenic etch for 400-layer NAND entering mass production in 2027. That supports its exposure to increasing process complexity, but does not establish a specific Tokyo Electron award at Sandisk or Kioxia. Technology transitions can create a larger equipment opportunity while competitive allocation between suppliers remains unresolved.
SLC creates an important distinction between long-term opportunity and near-term spending. Lam had already argued that shifting delivered bits toward SLC could require additional wafer capacity. Sandisk agreed with the density trade-off but repeatedly emphasized that customer discussions remain early. The physical capacity penalty is real; the timing and scale of manufacturing investment are not yet established.
This is the principal non-consensus caution for equipment extrapolation: extremely high NAND producer margins and strong demand do not automatically convert into immediate equipment-order acceleration. Sandisk is prioritizing its existing roadmap and financial returns rather than responding to every demand indication with additional capacity.
The geographic spending pipeline is nevertheless substantial. Kioxia and Sandisk previously announced anticipated investment exceeding $31 billion in Japan through 2032, contingent on government support. That is an existing multiyear framework, not new spending announced on this call. The combination of that framework and unchanged near-term supply plans supports sustained investment rather than a sudden new expansion cycle.
Near-term trading catalysts are equipment bookings, shipment schedules, customer acceptance, and revisions to actual capital budgets. Over 12 to 36 months, the stronger fundamental driver is higher process complexity and sustained node conversion. The portfolio implication is a distinction between benefiting from continued technology investment and assuming that NAND scarcity must immediately produce a broad wafer-capacity boom.
Report record
- Sector
- Information Technology
- Industry
- Technology Hardware, Storage & Peripherals
- Fiscal period end
- October 2, 2026
- Report date
- October 29, 2026
- Analysis
- 7388 words
- Read-throughs
- 2815 words
- Content fingerprint (PDF)
82acab3ab172- Content fingerprint (analysis)
d7b0a7889884- Content fingerprint (read-throughs)
e43f0b166598
Prepared from the company's earnings release and earnings call transcript. Figures as reported by the company. For information only. Not investment advice.
More from Sandisk Corporation
No other reports yet.
All Sandisk Corporation reports
More in Information Technology
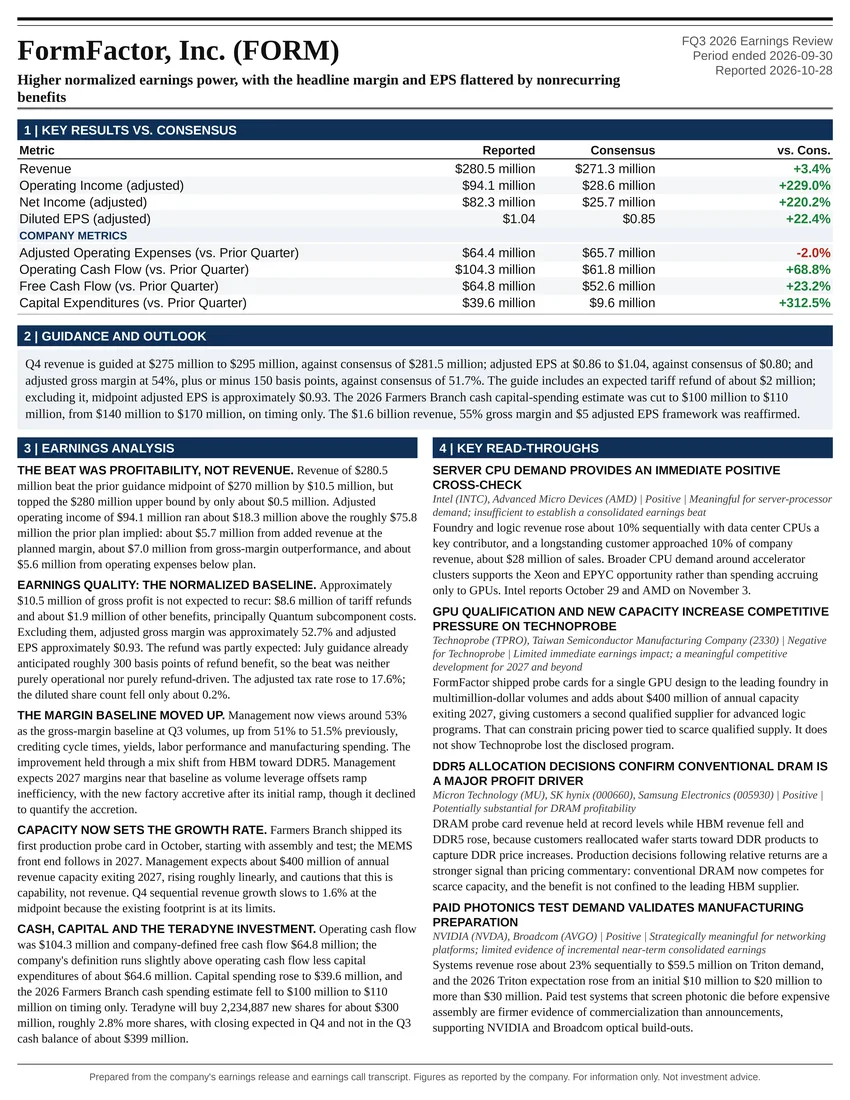
Higher normalized earnings power, with the headline margin and EPS flattered by nonrecurring benefits
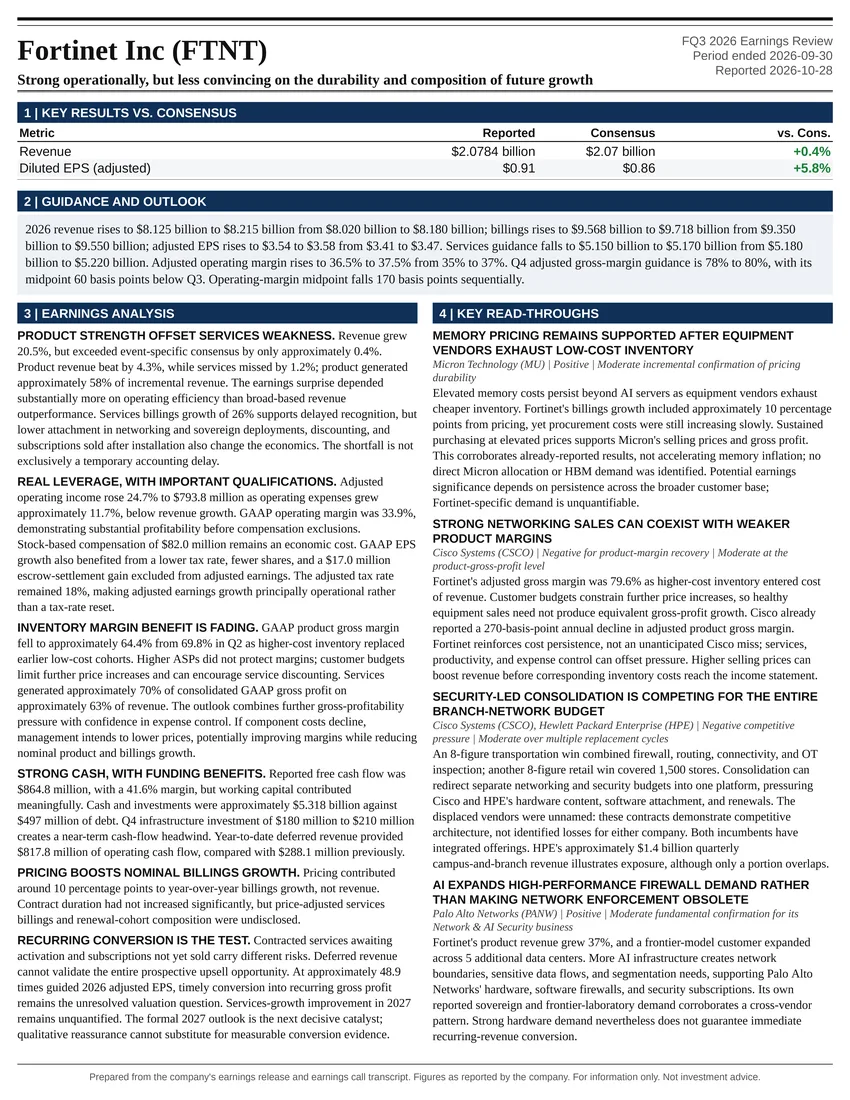
Strong operationally, but less convincing on the durability and composition of future growth
All Information Technology reports
Sandisk Corporation on the Atlas Peak ticker page
Follow @AtlasPeakRes on X for new earnings reports as they publish.