Earnings Resilient Near Term; the Financing Model Is Unresolved
Earnings Reports
CenterPoint Energy, Inc. FQ3 2026 Earnings Report
CenterPoint Energy, Inc. (CNP) FQ3 2026 earnings: Improved growth durability, limited immediate consensus upside. Full earnings analysis, key read-throughs, and the one-page exhibit from Atlas Peak Research.
CenterPoint Energy, Inc. (CNP)
Sector: Utilities · FQ3 2026 · Period end September 30, 2026 · Reported October 27, 2026
CenterPoint Energy’s Q3 2026 earnings call strengthened the medium-term investment case primarily through greater visibility into regulated capital deployment, rather than a material improvement in near-term earnings expectations.
Download the one-page report (PDF)
View one-page exhibit
Download analysis (.md)
Download read-throughs (.md)
Post to X
One-Page Exhibit
Earnings Analysis
EXECUTIVE CALL SUMMARY: CenterPoint Energy (10/27/26)
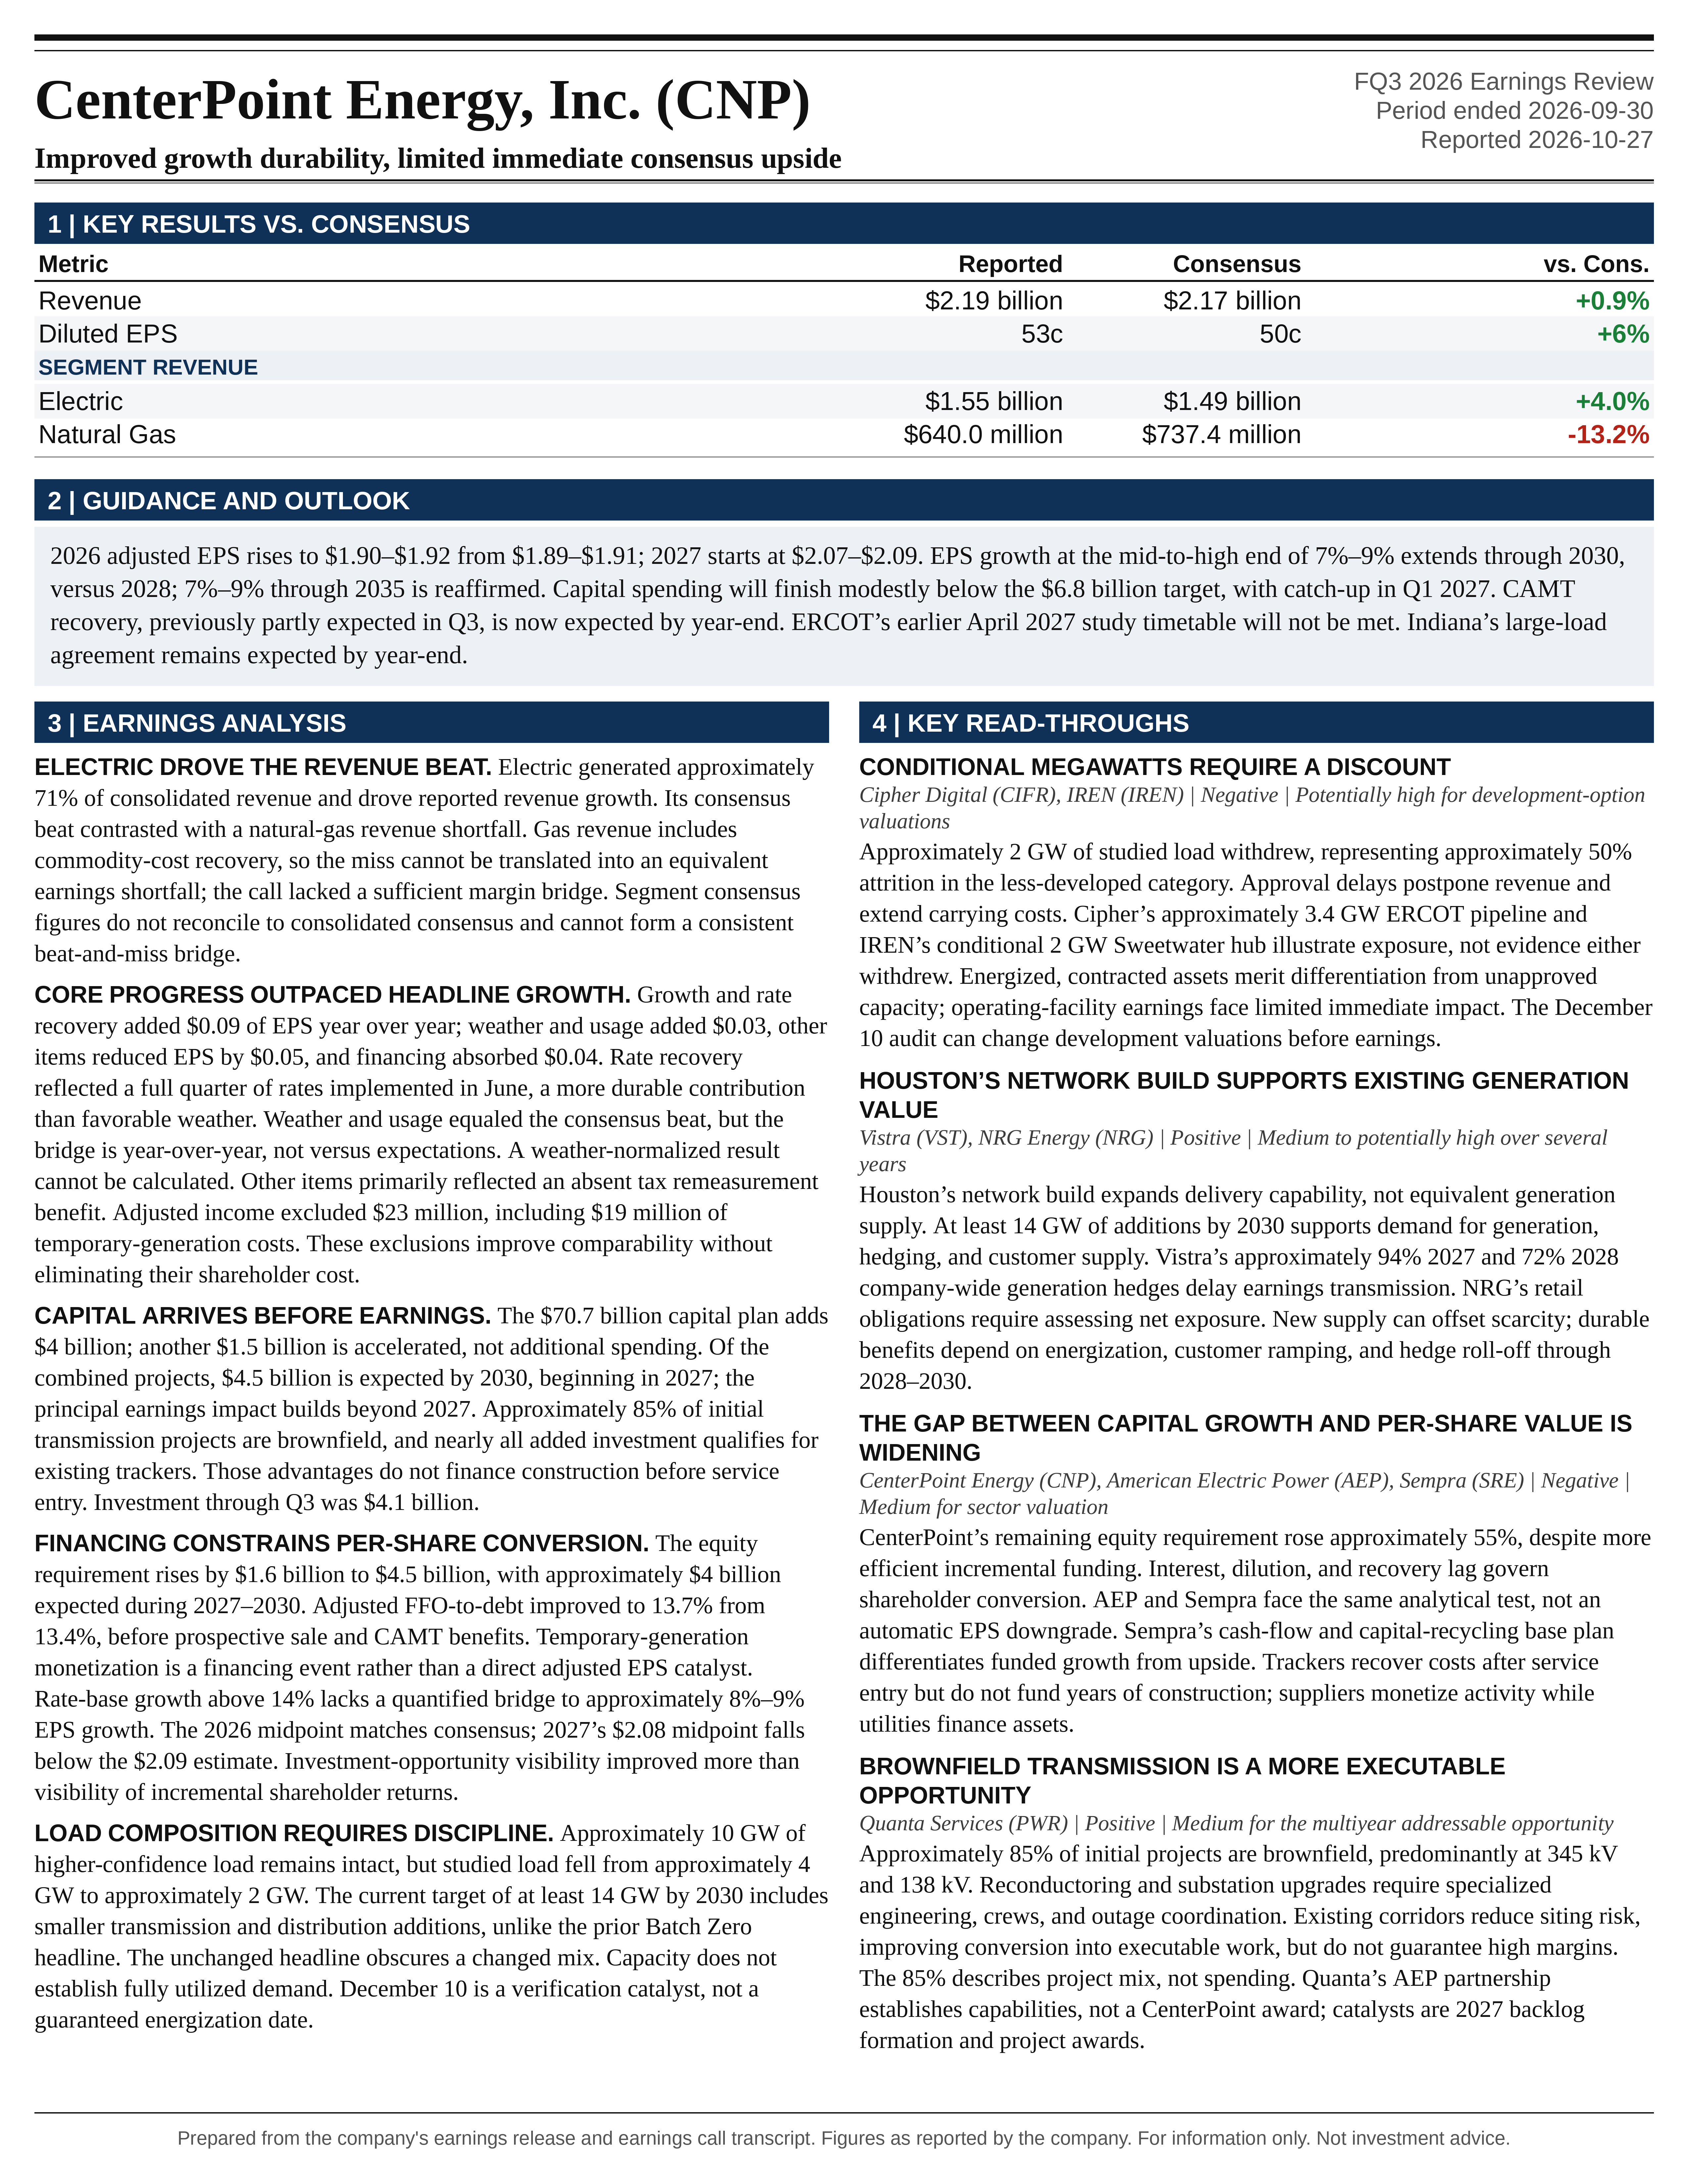
CenterPoint Energy’s Q3 2026 earnings call strengthened the medium-term investment case primarily through greater visibility into regulated capital deployment, rather than a material improvement in near-term earnings expectations. The company raised its 2026 adjusted EPS midpoint by $0.01 to $1.91, initiated 2027 guidance at $2.07 to $2.09, increased its 2026–2035 capital plan by $4 billion to $70.7 billion, and accelerated $1.5 billion of previously planned investment into 2026–2030. The most consequential change was the extension of expected EPS growth at the mid-to-high end of the 7% to 9% annual range from 2028 through 2030, supported by enterprise rate-base growth exceeding 14%.
The appropriate investment stance is HOLD with a constructive fundamental outlook. The call improved the durability of the earnings trajectory but did not establish a significant near-term consensus upgrade. Q3 adjusted EPS of $0.53 exceeded Bloomberg consensus by $0.03, or 6%, while the revised 2026 guidance midpoint merely matched consensus at $1.91. The 2027 midpoint of $2.08 was $0.01 below consensus. Consequently, the principal potential source of incremental equity value is stronger confidence in the duration and financing of growth, rather than an immediately higher 2027 earnings estimate.
The strongest positive evidence was the conversion of previously identified Houston transmission opportunities into a defined capital program, with approximately 85% of the initial projects classified as brownfield and nearly all of the added investment eligible for existing capital-recovery mechanisms. The principal reservations are the widening external financing requirement, incomplete reconciliation between rate-base growth and EPS growth, attrition within the large-load pipeline, and uncertainty around the timing of regulatory approval and customer energization.
The demand narrative requires particular discipline. The approximately 10 GW of higher-confidence Batch Zero base load remains intact, but studied load has declined from approximately 4 GW at the Q2 call to approximately 2 GW. Management now expects at least 14 GW of total additions by the end of 2030, including smaller transmission and distribution customers. That is not directly comparable with the prior 14 GW Batch Zero expectation, which excluded an additional approximately 2 GW of distribution growth. The current outlook may remain achievable, but the unchanged headline obscures a change in composition.
A material disclosure inconsistency also requires resolution. The Q3 transcript describes prospective demand charges of approximately $6 million per GW per year, whereas the Q2 transcript repeatedly described $6 million per GW per month. The difference is 12-fold. It should not be interpreted as an economic downgrade without confirmation, but the financing benefit cannot be confidently quantified until the applicable units, tariffs, and cash-flow treatment are reconciled.
OBSERVATION: QUARTERLY PERFORMANCE AND EARNINGS QUALITY
Q3 adjusted EPS increased 6% to $0.53 from $0.50, while GAAP EPS increased 11.1% to $0.50 from $0.45. The earnings release reported adjusted income of $354 million, compared with $328 million, representing 7.9% growth. GAAP net income increased approximately 13% to $331 million from $293 million. The slower growth in per-share earnings than in aggregate income is consistent with the dilution identified by management.
The adjusted EPS bridge reconciles cleanly. Growth and rate recovery contributed $0.09, weather and usage contributed $0.03, O&M was unchanged, other items reduced EPS by $0.05, and financing costs reduced EPS by $0.04. These movements produce the $0.03 net increase from $0.50 to $0.53. Growth and rate recovery therefore generated a contribution equivalent to 18% of prior-year quarterly EPS, but financing costs absorbed approximately 44% of that contribution.
The $0.09 growth and recovery contribution is the most important evidence of the core operating model working. It reflected a full quarter of rates implemented in June through interim filings. This is a more durable source of earnings than favorable weather because it monetizes capital already deployed and incorporated into customer rates. However, the call did not separate the $0.09 between customer growth, billing demand, and rate changes. It therefore cannot be treated as a direct measure of underlying load growth.
The $0.03 favorable weather-and-usage contribution was equal in magnitude to both the year-over-year EPS increase and the consensus beat. That equivalence does not establish that weather caused the beat. Management’s bridge compares results with the prior year, not with analyst expectations, and combines weather with usage. Mechanically removing the entire bucket would reduce EPS to $0.50, but that would also remove any structural usage growth embedded in the amount. A properly weather-normalized result cannot be calculated from the disclosed bridge.
The $0.05 unfavorable other-items variance was primarily attributable to the absence of a deferred tax remeasurement benefit recorded in Q3 2025. This comparison depresses reported growth without implying deterioration in regulated operations. Conversely, the description “primarily” prevents treating the entire $0.05 as a precisely identified tax adjustment. The defensible conclusion is that core operating progress was stronger than the 6% headline EPS growth suggests, while favorable weather and usage also contributed.
Financing costs became a more visible constraint. Approximately $3 billion of net new debt issuance produced a $0.03 EPS headwind, and equity financing produced another $0.01. This is an important counterweight to the capital-growth narrative: investment expands future earnings capacity, but the financing burden can arrive before the associated assets produce a full period of regulated earnings and cash recovery.
The Q2 comparison reinforces that distinction. Adjusted EPS increased approximately 38% in Q2 2026 to $0.40 from $0.29, supported by $0.10 of growth and recovery, $0.02 of favorable O&M, a $0.01 weather-and-usage headwind, and a $0.01 interest-expense headwind. In Q3, the growth-and-recovery contribution remained substantial at $0.09, but the O&M benefit disappeared and the financing drag increased. The slowdown in headline EPS growth therefore does not indicate a comparable slowdown in the underlying capital-recovery engine.
The GAAP reconciliation also warrants attention. Q3 adjusted income exceeded GAAP net income by $23 million. Of that difference, $19 million related to temporary emergency generation units removed from rate base, $2 million represented net ZENS-related adjustments, and $2 million related to mergers and divestitures. For the first 9 months, adjusted income of $990 million exceeded GAAP income of $891 million by $99 million, including $57 million associated with temporary generation and $38 million associated with mergers and divestitures.
These adjustments are identifiable, but they are economically meaningful. The temporary-generation expense represents a continuing burden outside the regulated earnings presentation until the assets are monetized or their obligations otherwise resolved. Excluding these costs improves comparability of the regulated business, but it does not eliminate their effect on shareholder economics. Management’s commitment to exclude any eventual associated gain is appropriately symmetrical.
REVENUE PERFORMANCE AND SEGMENT INTERPRETATION
Revenue of $2.19 billion increased approximately 10% and exceeded Bloomberg consensus of $2.17 billion by approximately 0.9%. Electric revenue increased approximately 13% to $1.55 billion and exceeded its $1.49 billion consensus estimate by approximately 4%. Natural gas revenue increased 2.9% to $640 million but fell approximately 13.2% below the $737.4 million estimate.
Electric operations generated approximately 71% of consolidated revenue for the quarter and were the principal source of reported revenue growth. This is consistent with the strategic shift toward Houston electric infrastructure, although revenue composition should not be confused with earnings or rate-base composition.
The gas revenue shortfall should not automatically be interpreted as an equivalent earnings shortfall. Gas utility revenue includes commodity-cost recovery, while weather, throughput, and tariff design can change revenue without proportionately changing margin. The call did not provide a sufficient gas-margin bridge to identify the cause. The Ohio divestiture also closed on October 1, after the quarter ended, so its closing date alone does not explain Q3 gas revenue.
The Bloomberg segment consensus figures do not reconcile to consolidated consensus. Electric and gas estimates sum to approximately $2.227 billion, versus the consolidated estimate of $2.17 billion. Different analyst contributor sets or aggregation conventions may explain the discrepancy. The segment comparisons remain informative individually, but they cannot be combined into a consistent consolidated beat-and-miss bridge.
GUIDANCE: WHAT CHANGED AND WHAT DID NOT
The 2026 adjusted EPS range increased from $1.89–$1.91 to $1.90–$1.92. The midpoint increase is approximately 0.5%, and the new midpoint implies 8.5% growth over 2025 adjusted EPS of $1.76. That compares with approximately 8% growth under the previous midpoint. The increase is positive but small relative to the magnitude of the capital-plan announcement.
The prior-quarter guidance had already emphasized delivery at least at the midpoint of the previous range. Relative to that qualitative commitment, the new range represents an incremental improvement rather than a major change in earnings expectations. Its midpoint equals the Bloomberg consensus estimate supplied with the call.
Reported adjusted EPS for the first 9 months was $1.49, approximately 78.4% of the original $1.90 full-year midpoint. Simple subtraction implies approximately $0.41–$0.43 of Q4 adjusted EPS to reach the revised annual range. That compares with $0.45 in Q4 2025, implying an approximately 4%–9% decline. Weighted-average share counts and rounding can affect this subtraction, but not the broader conclusion that the revised annual guidance does not require an unusually strong final quarter.
This implied Q4 profile supports management’s confidence while tempering claims of immediate earnings acceleration. It could reflect normal-weather assumptions, financing costs, portfolio changes, conservatism, or other quarterly timing effects. The call did not provide a detailed Q4 bridge. The full-year increase therefore should not be extrapolated into an unqualified acceleration in near-term quarterly growth.
The 2027 range of $2.07–$2.09 implies 8.9% growth at the midpoint over the new 2026 midpoint. This is strong absolute growth for a regulated utility, but the $2.08 midpoint is approximately 0.5% below the $2.09 Bloomberg consensus estimate, with consensus at the top of the range. The initial outlook validates an approximately 9% growth trajectory without exceeding existing market expectations.
The long-term extension is more important. At the July 28 Q2 call, management expected growth at the mid-to-high end of the 7%–9% range through 2028, followed by 7%–9% annually through 2035. The current call extends the higher-confidence, upper-half positioning through 2030. The outer range through 2035 is unchanged. This is an extension of duration, not an increase in the numerical growth ceiling.
Applying 8%–9% annual growth to the new 2026 midpoint produces approximately $2.60–$2.70 of 2030 EPS. These are mathematical illustrations, not separately issued management targets. They show why the extension matters: the company is supporting several additional years of relatively high regulated growth, rather than only raising the current-year base.
Management’s rebasing policy adds incremental value if outperformance persists. Wells stated that the company compounds future growth from higher delivered earnings rather than reverting to an older guidance base. However, a $0.01 increase compounded for 4 years at 8%–9% adds only approximately $0.014 to 2030 EPS. The larger valuation implication lies in increased confidence in sustained growth, not the isolated arithmetic of the current-year increase.
CAPITAL PLAN: LARGER, EARLIER, AND MORE ELECTRIC-FOCUSED
The $4 billion increase lifts the 10-year capital plan from $66.7 billion to $70.7 billion, an increase of approximately 6%. Relative to the $65 billion plan at the 2025 Investor Day, the cumulative increase is $5.7 billion, or approximately 8.8%. The progression includes an earlier $500 million addition and the $1.2 billion increase announced with Q2 results.
The additional $1.5 billion acceleration is not new spending over the full 10-year period. It moves previously planned projects from after 2030 into the first 5 years. Consequently, the $5.5 billion of newly identified and accelerated projects should not be described as a $5.5 billion increase in the total capital plan.
Management expects $4.5 billion of the combined new and accelerated investment to be deployed by the end of 2030, beginning in 2027. On a consistent-period basis, that implies approximately $3 billion of the newly added $4 billion is deployed by 2030, alongside the $1.5 billion acceleration, with approximately $1 billion of new spending after 2030. The arithmetic also implies that net spending in the back half of the plan falls by approximately $500 million relative to the previous schedule, before future revisions.
The principal earnings impact should therefore build beyond 2027. Capital deployment begins next year and scales subsequently, while earnings recognition depends on construction completion and regulatory recovery. A meaningful 2028–2030 effect is more plausible than an immediate full contribution to 2027 earnings.
The projects address import capacity, system stability, and intra-regional transmission capacity. This is a broader program than customer-specific interconnections. Wells summarized the underlying economics directly: “Serving this growth absorbs the capacity that helped attract it.” Existing network headroom enabled relatively inexpensive initial connections, but sustaining the growth advantage requires reinvestment in the network.
That distinction changes the interpretation of capital efficiency. At the Q2 call, approximately $800 million of targeted upgrades was expected to support 14 GW of Batch Zero projects, or less than $60 million per GW, because substantial hosting capacity already existed. That figure was not a sustainable all-in cost of accommodating successive waves of demand. The current announcement represents the next stage, replenishing capacity after the initial headroom is consumed.
The 2026 execution update introduces a modest but relevant timing concern. Investment through Q3 was $4.1 billion, approximately 60% of the original $6.8 billion annual target. Management now expects spending to finish modestly below that target, with the difference recovered in Q1 2027. Q2 commentary had still affirmed the full $6.8 billion.
This is not evidence of a reduction in project economics or demand. Nevertheless, timely recovery of the delayed spending should be monitored because the broader thesis requires an expanding construction program to become productive rate base on schedule. A limited timing shift is manageable; repeated delays would reduce the near-term earnings conversion of the enlarged plan.
HOUSTON LOAD GROWTH: STRONG COMMITMENTS, BUT A CHANGING MIX
The company’s large-load position remains differentiated by existing network capacity, substantial prior customer commitments, and a diversified regional industrial base. At the Q2 call, management disclosed more than 17 GW submitted to Batch Zero, approximately 14 GW expected to qualify as base or studied load, signed facility-extension agreements, and approximately $900 million of customer cash commitments and security.
Within that prior 14 GW, approximately 10 GW had both required studies approved, while approximately 4 GW had completed only part of the required process. The current call maintains high confidence in the 10 GW but reduces expected studied load to approximately 2 GW. The withdrawal therefore represents approximately 14% of the earlier 14 GW eligible pool and approximately 50% of the previously identified studied-load category.
The concentration of attrition in the less-developed category supports management’s assertion that the screening process is distinguishing more mature projects from weaker commitments. It does not eliminate execution risk within the surviving 10 GW. Base-load classification in this context is a procedural designation, not evidence of a guaranteed capacity factor, completed construction, or irrevocable energization permission.
The total 2030 target requires a careful like-for-like comparison. Q2 commentary described nearly all of the 14 GW of eligible Batch Zero projects being energized by the end of 2030, plus approximately 2 GW of distribution growth over the next several years. Q3 commentary instead describes at least 14 GW in total, including smaller transmission and distribution additions.
These statements do not establish a precise downgrade from 16 GW to 14 GW because the distribution timing, category definitions, and “at least” qualification are not identical. They do establish that the current 14 GW headline is not an increase over the prior comparable disclosure. Management’s claim that smaller-load growth more than offsets the studied-load withdrawals requires a clearer reconciliation against growth already included in the prior outlook.
The distinction between capacity, energization, and actual demand is equally important. A project can be electrically connected before reaching its ultimate operating load. Customer ramp schedules, contracted billing minimums, utilization, and coincidence with system peaks determine the timing and amount of cash contribution. The 14 GW figure should not be treated as 14 GW of immediate, fully utilized incremental demand.
The ERCOT process remains an independent constraint. ERCOT’s June 18, 2026 announcement established a system-wide batch framework for qualified projects of at least 75 MW, designed to allocate available capacity and identify required upgrades. Subsequent Utility Dive reporting described the state-directed audit and the December 10 target for reporting its findings. That report also quoted ERCOT indicating that the earlier April 2027 study timetable would not be met.
December 10 is therefore a material verification catalyst, not a guaranteed energization date. Management’s confidence is supported by its assertion that customers had already pursued the required community and project-readiness measures, but company confidence cannot substitute for ERCOT approvals or a workable construction and commissioning schedule.
DISTRIBUTION GROWTH: POTENTIALLY BETTER ECONOMICS, NOT YET QUANTIFIED
Distribution-level growth is an increasingly important component of the thesis. Management reported nearly 1 GW of distribution load requests over the preceding year, alongside strong warehouse activity, advanced manufacturing below 75 MW, and smaller data centers associated with inference workloads. Approximately 2% population growth remains a background contributor.
This creates a broader opportunity set than a narrow hyperscale-training thesis. Distribution customers can add demand across warehouses, suppliers, manufacturing, logistics, and localized computing infrastructure. Such diversification may reduce dependence on individual very large projects, although these activities can still share exposure to the same regional investment cycle.
Wells stated that “the distribution rates do provide a different economic opportunity from an earnings standpoint than transmission.” This supports the possibility of a favorable earnings mix, but the call did not quantify the difference. Distribution growth can require additional substations, feeders, transformers, and operating expense, so a higher billing rate cannot be directly translated into a higher incremental return.
The scale indicators also require proper categorization. Nearly 1 GW of requests is not equivalent to signed, secured, or energized load. Commercial leasing growth of more than 30% is a useful corroborating indicator, not a direct electricity-demand forecast. The economic significance depends on the type of tenant, electrical intensity, actual occupancy, and required network reinforcement.
Smaller project size also should not be assumed to eliminate regulatory scrutiny. Although the Batch Zero threshold is 75 MW, the reported community-impact review extends to certain data-center and crypto facilities of at least 25 MW. Distribution growth may have a different approval pathway, but it is not necessarily insulated from broader state policy.
TRANSMISSION EXPANSION: A FAVORABLE INITIAL MIX WITH MORE COMPLEXITY AHEAD
The newly announced transmission projects are at 345 kV and 138 kV, rather than additional 765 kV projects. Approximately 85% of the initial identified projects are brownfield and use existing rights of way. That distinction lowers some siting and landowner risk and can improve execution speed.
The 85% figure refers to the identified project mix, not necessarily 85% of capital dollars, mileage, or future expansions. Brownfield work still requires equipment, outage coordination, engineering, and approvals. Nevertheless, it represents a more executable starting point than an equivalent program dominated by entirely new transmission corridors.
The remaining opportunity may be more difficult and more expensive. Management indicated that the announced program addresses approximately 50% of the capacity need currently anticipated for Batch 1, while early Batch 1 interest is already trending above Batch Zero. The call did not provide a definitive Batch 1 GW total or a reliable capital-cost conversion.
Wells explicitly rejected a linear extrapolation of the current spending package: “there will be an upward bias on future transmission CapEx revisions” as the company exhausts brownfield opportunities and moves toward greenfield construction. This is simultaneously a growth opportunity and a risk warning. Higher capital intensity can expand rate base, but it also increases financing requirements, permitting exposure, construction duration, and affordability pressure.
The company expects another transmission-study update in the first half of 2027 and plans 765 kV filings during that period. The remaining opportunity should therefore be valued as probability-weighted future investment, not as approved, fully financed rate base.
RATE-BASE GROWTH VERSUS EPS GROWTH
The gap between enterprise rate-base growth above 14% and EPS growth of approximately 8%–9% was the most important unresolved financial issue in the Q&A. Wells Fargo and Wolfe Research both pressed management on the difference.
Foster stated that the company has “historically been able to convert that rate base growth into earnings growth with about a 200 basis point delta.” When asked whether the larger current gap reflected conservatism, Wells answered that it was “definitely more of the latter.”
These responses support the possibility of upside, but they do not provide a modelable earnings bridge. Rate-base growth does not translate directly into EPS growth. Relevant variables include regulated equity ratios, allowed and earned returns, debt funding, holding-company financing costs, construction timing, depreciation, regulatory lag, share issuance, and business mix.
Using 14% rate-base growth and 8%–9% EPS growth gives an approximately 5–6 percentage-point difference. The analyst’s suggested approximately 2 percentage points of dilution explains only part of that gap. Management did not quantify the remaining components or establish that the historical 200-basis-point conversion relationship will recur.
The appropriate implication is that the plan appears to contain meaningful financial capacity, not that 12% EPS growth is already supported as a base case. Evidence of upside would require faster earned-return realization, better cash recovery, lower financing needs, stronger operating cash generation, or repeated guidance increases.
The company also confirmed that the Ohio gas sale has been removed from the rate-base growth calculation. The reported growth rate should therefore not be increased further on the assumption that divestiture-related denominator effects remain to be normalized.
FINANCING: IMPROVED EFFICIENCY, BUT A LARGER EQUITY REQUIREMENT
The company increased its remaining 10-year equity financing requirement by $1.6 billion to $4.5 billion. This funds 40% of the new $4 billion investment, below the 47% equity rule of thumb. Relative to applying 47% directly, the identified efficiency reduces incremental equity needs by approximately $280 million.
The absolute increase is still substantial. Moving from an implied $2.9 billion remaining requirement to $4.5 billion represents an approximately 55% increase. Describing the funding as modest is reasonable relative to the capital opportunity, but less persuasive relative to the previous equity requirement.
Approximately $4 billion of issuance is expected during 2027–2030, with $500 million–$700 million in 2027. This places approximately 89% of the remaining equity program before the end of 2030. Subtracting the 2027 amount leaves approximately $3.3 billion–$3.5 billion for 2028–2030, before offsets, changes in timing, or revisions to the plan.
At the October 26 closing price of $41.20, $4 billion of common equity would represent approximately 97 million shares before issuance costs. That is approximately 15% of the roughly 664 million diluted-share equivalent implied by reported 9-month adjusted income and EPS. This is a financing sensitivity, not a forecast: actual share issuance depends on price, timing, transaction structure, and alternative funding. It nevertheless demonstrates why gross rate-base expansion cannot be valued without considering per-share dilution.
The stated approximately 25% incremental equity funding across the $5.7 billion of capital increases also does not reconcile precisely with the rounded amounts disclosed. Dividing $1.6 billion by $5.7 billion produces approximately 28%. Rounding or other financing adjustments may explain the difference, but the underlying schedule is needed before 25% is used as a precise modeling assumption.
Management identified temporary-generation monetization, incremental demand charges, portfolio optimization, and reduced regulatory cash lag as potential offsets. These are genuine sources of flexibility, but they should not automatically be accumulated as independent EPS benefits. Management could use the same proceeds to reduce issuance or to fund further capital additions. The same cash cannot support both outcomes without an explicit allocation.
TEMPORARY GENERATION, PORTFOLIO SALES, AND CASH-FLOW QUALITY
Temporary generation remains a potentially valuable financing option. The units currently serving the San Antonio area are expected to return by the end of March 2027. Management is considering either a sale, producing upfront proceeds, or a sublease, producing cash flow potentially extending through 2029.
The economically relevant benefit is the net cash released after associated obligations, transaction costs, and taxes. No proceeds estimate was provided. Because associated gains are excluded from adjusted earnings, monetization should initially be modeled as a financing event rather than a direct adjusted EPS catalyst. Its eventual earnings value would arise through lower financing costs, lower share issuance, or reinvestment in regulated assets.
Further portfolio optimization is also possible, but no additional business was formally designated for sale. Wells did not identify a jurisdiction that would be excluded from consideration and emphasized the company’s history of addressing transaction-related dissynergies.
Asset recycling is not costless financing. A sale eliminates the divested business’s earnings and can leave stranded overhead, tax leakage, or regulatory conditions. Value creation depends on the sale multiple, retained costs, financing savings, and the return earned on reinvested proceeds. The Ohio transaction demonstrates execution capability, but not that future divestitures will necessarily be accretive.
Additional sales would also increase concentration in Houston electric growth. That could improve the group’s growth profile while making the equity more exposed to Texas regulation, major storms, transmission execution, and large-load commissioning.
The demand-charge inconsistency is especially important in this financing context. At $6 million per GW per year, 1 GW generates $6 million annually. At the repeatedly stated Q2 rate of $6 million per GW per month, the annual amount is $72 million. Across several GW, the difference materially changes the prospective financing benefit.
Neither version should be capitalized directly as incremental net income. Demand-charge collections must be evaluated alongside tariff treatment, cost recovery, customer ramping, operating costs, and subsequent rate adjustments. Until the units are confirmed, the prudent approach is to preserve the qualitative financing upside without incorporating a precise cash-flow amount.
BALANCE SHEET AND INTEREST-RATE EXPOSURE
Adjusted FFO-to-debt under Moody’s methodology was 13.7% at Q3, compared with 13.4% at Q2. Management identified approximately 50 basis points of prospective benefit associated with the October 1 Ohio sale and approximately 60 basis points from the expected CAMT refund.
Adding these effects mechanically to 13.7% produces approximately 14.8%, before other changes. This is an illustrative pro forma calculation rather than a reported ratio or an unconditional forecast. Debt balances, operating cash flows, sale accounting, and refund timing can change the final result.
The timing distinction matters. At Q2, management expected part of the CAMT recovery during Q3. The current call described an October refund filing and expected a year-end benefit. The eventual improvement may be larger than the earlier partial recovery, but the cash had not yet been reflected in the quarter-end metric. Credit improvement dependent on a refund should not be treated as already realized.
Stable rating outlooks across agencies reduce near-term credit concern, but do not remove the need to fund a substantial investment program. Asset-sale proceeds and tax refunds can strengthen the balance sheet without representing recurring operating cash generation. Sustaining the cushion ultimately depends on timely earnings conversion and cash recovery.
The approximately $300 million of 2027 maturities limits near-term refinancing exposure. It does not eliminate interest-rate risk because new capital investment requires additional borrowing. The observed Q3 interest headwind already demonstrates that exposure.
As a simple sensitivity, a 100-basis-point increase in the cost of $1 billion of debt adds $10 million of annual pretax interest expense. Assuming a 25% tax rate and approximately 664 million shares, that is about $0.011 per share before regulatory recovery or capitalization. This is not company guidance, but it illustrates why financing assumptions remain material even when scheduled maturities are modest.
REGULATORY RECOVERY: A MAJOR ADVANTAGE WITH A LONG-CYCLE LIMITATION
Houston Electric’s latest DCRF filing requested a $73 million annual revenue-requirement increase, with interim rates implemented at the end of September. The latest TCOS filing received approval for another $29 million annual increase. Together, they represent approximately $102 million of annual revenue requirement, not $102 million of incremental net income.
The DCRF timing is favorable relative to Q2 commentary, which had anticipated updated charges in November. Earlier interim implementation provides a tangible example of reduced recovery lag. Because implementation occurred near quarter-end, most of the benefit should occur after Q3.
Management indicated that nearly all of the new capital additions fall within tracker mechanisms, generally recoverable through filings made twice annually. Across the company, more than 80% of recovery occurs through these mechanisms. This materially reduces the dependence on infrequent comprehensive rate cases.
The limitation is that efficient recovery after assets enter service does not necessarily finance years of construction beforehand. Wells acknowledged that a larger proportion of future investment will be long-cycle work and that relatively low regulated equity ratios in Texas could strain the balance sheet. His interest in interim recovery of transmission investment is therefore a substantive financing issue, not merely a procedural preference.
The Minnesota filing is expected to use a 3-year forward-looking rate framework, allowing adjustments across successive test years rather than leaving a gap between cases. The combined North and South Indiana gas filing is planned for December and is expected to reduce bills for a significant number of residential customers. Neither filing yet provides a quantified earnings contribution in the call.
The regulatory strategy is supportive, but legislative improvements should remain outside the base case until enacted and implemented. Existing trackers are an established advantage; prospective construction-period cash recovery is an additional opportunity.
INDIANA: ATTRACTIVE OPTIONALITY WITHOUT A CONTRACTED EARNINGS BRIDGE
Management continues to anticipate signing a large-load agreement in Indiana by year-end. The call clarified approximately 700 MW of existing available capacity, with the ability to expand to approximately 1.4 GW through transmission upgrades and conversion of a simple-cycle plant.
These figures describe available or expandable system capacity, not the size of an executed customer contract. No counterparty, contracted demand, ramp schedule, investment budget, minimum-payment commitment, or return profile was disclosed.
The staged development strategy is sensible. Utilizing existing capacity should require less capital and carry less construction risk than building entirely new generation. If demand remains within approximately 1.4 GW, management sees no need to complicate the structure with a separate generation company. Demand beyond that level could justify isolating incremental generation assets in a separate entity.
That structure would not by itself eliminate risk. Customer concentration, fuel supply, interconnection, construction cost, contract tenor, parent guarantees, and residual asset value would remain material. A signed agreement with appropriate financial security would represent a significant milestone, but an economic-development announcement without those details would not establish a bankable earnings stream.
AFFORDABILITY AND RELIABILITY AS CONDITIONS FOR GROWTH
Wells stated: “The path to affordable rates is through growth.” The underlying logic is sound when additional customers contribute toward shared fixed costs and fund the incremental infrastructure they require. Management expects the anticipated demand additions to generate approximately $5 billion of customer savings over the next 10 years.
These savings are a management projection, not a guaranteed reduction in total electricity bills. Delivery charges, commodity prices, generation costs, consumption, and other riders all influence the final bill. Similarly, management’s assertion that Houston delivery rates have remained effectively flat since 2014 should not be interpreted as evidence that customers’ total energy bills have been flat.
The affordability thesis works best when load arrives on time, runs at the expected utilization, and remains financially obligated for its infrastructure. It weakens when customers delay or cancel after the utility has committed capital. The studied-load withdrawals therefore reinforce the importance of deposits, contractual minimums, cancellation protection, and project-specific cost allocation.
Management also cited nearly 40% improvement in reliability over several years and expects further resiliency opportunities to become clearer in the second half of 2027, ahead of a new System Resiliency Plan filing by year-end. The call did not define the reliability metric sufficiently to independently assess that percentage. Additional spending will need to demonstrate measurable service improvement and customer benefit to sustain regulatory support.
IMPLICATION: VALUATION, MARKET EXPECTATIONS, AND SCENARIOS
Stock Analysis records an October 26 closing price of $41.20. At that pre-call reference price, CenterPoint traded at approximately 21.6 times the new 2026 EPS midpoint and 19.8 times the 2027 midpoint. The same price history indicates an approximately 12% increase from September 30. The call therefore arrived after a meaningful share-price recovery, although the causes of that recovery cannot be attributed from the earnings materials alone.
The valuation sensitivity is more consequential than the $0.01 current-year guidance increase. At $2.08 of 2027 EPS, 18 times earnings implies $37.44, 20 times implies $41.60, 22 times implies $45.76, and 24 times implies $49.92. Relative to $41.20, those values represent approximately -9%, +1%, +11%, and +21%, excluding dividends. These are illustrative valuation sensitivities, not peer-derived fair-value targets.
At approximately 20 times earnings, the shares already require confidence in sustained execution. A higher multiple would need to be supported by demonstrated durability, lower financing uncertainty, and successful customer conversion. Conversely, a lower multiple could arise even if earnings guidance is met, particularly if interest rates rise or the market discounts a more capital-intensive, more dilutive growth path.
The base case carries an illustrative 55% probability. The company delivers within the 2027 range and compounds EPS at approximately 8.5% from the $1.91 2026 midpoint through 2030, producing approximately $2.65 of EPS. The announced program is substantially executed, tracker recovery remains effective, and financing alternatives provide some relief without eliminating common-equity issuance. This case is consistent with management’s outlook and does not require assuming that the unexplained rate-base-to-EPS gap closes.
The bull case carries an illustrative 25% probability. Batch Zero approvals largely validate management’s confidence, distribution additions convert into billable load, Batch 1 supports further economic projects, and monetization or improved cash recovery reduces dilution. EPS growth of 10%–11% from the 2026 midpoint would produce approximately $2.80–$2.90 in 2030. This exceeds management’s stated range and requires evidence of superior per-share conversion, not merely another increase in gross capital spending.
The bear case carries an illustrative 20% probability. Customer ramps are delayed, greenfield transmission becomes more expensive, equity issuance remains substantial, and regulatory cash recovery fails to keep pace with construction. EPS growth of 5%–6% would produce approximately $2.32–$2.41 in 2030. This outcome does not require demand to disappear; timing mismatches, financing costs, and dilution alone could weaken per-share growth materially.
These probabilities are judgmental scenarios rather than statistically estimated outcomes. The principal asymmetry is that further capital announcements are likely to be easier to produce than equivalent increases in per-share value. Capital growth is supportive only to the extent that returns, recovery timing, and financing preserve economic value for existing shareholders.
RECOMMENDATION AND CATALYSTS
The HOLD recommendation reflects a constructive operating outlook balanced against limited immediate consensus upside and unresolved financing assumptions. The call strengthens confidence in an approximately 8%–9% earnings trajectory through 2030. It does not yet establish that the market is materially underestimating 2027 earnings or that the historical conversion between rate-base growth and EPS can be restored without qualification.
The highest-priority near-term catalyst is the December 10 ERCOT audit milestone. Confirmation that the approximately 10 GW higher-confidence pool remains eligible would reduce a meaningful uncertainty. The next questions would concern energization schedules, customer ramping, and the status of the remaining approximately 2 GW of studied load.
A signed Indiana agreement by year-end would provide another catalyst, particularly if accompanied by contract size, customer security, investment requirements, and expected bill effects. The Minnesota and Indiana gas filings will provide evidence on the company’s ability to reduce lag while maintaining affordability.
By the end of Q1 2027, temporary-generation monetization and recovery of the delayed 2026 capital deployment should become observable. The first-half 2027 transmission update and 765 kV filings will test whether the next wave of investment can maintain the initial program’s execution quality and financing efficiency. Additional resiliency visibility is expected in the second half of 2027.
A more positive recommendation would be supported by verified demand-charge economics, a lower equity requirement without corresponding loss of earnings capacity, contracted and secured large-load conversion, and a quantified explanation of how rate-base growth can produce EPS growth above the current range.
The thesis would weaken if the 10 GW higher-confidence pool suffers substantial attrition, energization slips without offsetting customer payments, capital deferrals persist, incremental financing repeatedly exceeds expectations, or credit metrics remain dependent on temporary cash benefits. Adverse affordability outcomes or restrictions on timely recovery would also impair the growth model.
The central conclusion is that CenterPoint has improved the visibility of its investment opportunity more than it has improved the visibility of incremental shareholder returns. The announced program supports a credible regulated-growth story. The next stage of value creation depends on demonstrating that customer demand, construction execution, regulatory recovery, and financing remain synchronized.
SOURCE BASIS AND DISCLOSURE LIMITS
Financial comparisons reflect the October 27, 2026 earnings call, the accompanying Bloomberg consensus notice, the company’s Q3 earnings release furnished as Exhibit 99.1, and prior earnings-call disclosures dated July 28 and February 19, 2026. Regulatory context reflects ERCOT’s June 18 Batch Zero announcement and subsequent Utility Dive reporting on the audit timetable. Valuation uses the October 26 closing price reported by Stock Analysis. Project-level customer contracts, detailed annual financing schedules, and the underlying demand-charge tariff were not available for independent verification. The inconsistent demand-charge units remain unresolved and have not been treated as a confirmed economic change.
COMPANY EMPLOYEES ON THE CALL
• Jason Wells, Chair of the Board, President and Chief Executive Officer. • Christopher Foster, Chief Financial Officer. • Ben Vallejo, Vice President, Investor Relations and Corporate Planning.
RESEARCH ANALYSTS ON THE CALL
• Shahriar “Shar” Pourreza, Wells Fargo Securities. • Nicholas Campanella, Barclays. • Steven Fleishman, Wolfe Research. • Julien Dumoulin-Smith, Jefferies. • Jeremy Tonet, JPMorgan Securities. • Richard Sunderland, Truist Securities. • Anthony Crowdell, Mizuho. • Ross Fowler, Bank of America.
Key Read-Throughs
KEY READ-THROUGHS FROM CENTERPOINT ENERGY’S Q3 2026 EARNINGS CALL
CenterPoint’s update most strongly supports investment in conventional grid construction, distribution equipment, and technologies that increase usable capacity on existing networks. The company added $4 billion to its capital plan, accelerated another $1.5 billion, and expects $4.5 billion of those combined investments to be deployed by 2030. The less obvious implication is that scarce transmission capacity, customer readiness, and financing are becoming more important than headline electricity-demand forecasts. Approximately 2 GW of prospective studied load withdrew, while the surviving 10 GW of higher-confidence demand requires substantial infrastructure investment. This favors suppliers paid to build the network and owners of genuinely available power capacity, while challenging valuations that capitalize unapproved development pipelines or equate utility capital growth with per-share earnings growth. The following conclusions distinguish demonstrated commercial relationships from sector exposure; impact assessments describe incremental business implications, not predicted share-price returns.
GRID CONSTRUCTION AND ELECTRICAL EQUIPMENT
BROWNFIELD TRANSMISSION IS A MORE EXECUTABLE OPPORTUNITY THAN THE HEADLINE MEGAPROJECT TRADE (READ-THROUGH 1)
Affected company: Quanta Services (PWR: US). Direction: Positive. Magnitude: Medium for the multiyear addressable opportunity, with substantially greater confidence in demand direction than in any company-specific revenue allocation.
CenterPoint stated that approximately 85% of the initial transmission projects identified are brownfield, predominantly at 345 kV and 138 kV. The company expects $4.5 billion of incremental and accelerated investment to be deployed by 2030, beginning in 2027. Wells emphasized existing rights of way and reconductoring, explaining that these assets allow the company to expand capacity faster while minimizing disruption. This is not principally an announcement of additional 765 kV greenfield projects.
The transmission mechanism is direct at the industry level: reconductoring, substation modifications, protection-system upgrades, and expansion of existing transmission infrastructure require engineering, specialized electrical construction, outage coordination, and skilled crews. Existing corridors reduce some land-acquisition and siting uncertainty, improving the probability that announced spending converts into executable work. For Quanta, the opportunity is therefore broader and potentially nearer-dated than a thesis dependent on large new transmission corridors.
The less obvious positive is that a brownfield-heavy program can sustain contractor demand even if politically sensitive greenfield projects encounter delays. Conversely, brownfield work is not automatically easy or high-margin. Construction on operating networks requires tightly managed outages and specialized labor, while fixed-price contracts can expose contractors to execution losses. The 85% figure describes the project mix, not necessarily the share of spending.
Quanta’s publicly disclosed transmission partnership with American Electric Power (AEP: US) establishes relevant engineering, procurement, construction, and equipment-supply capabilities. It does not establish that Quanta has won the new CenterPoint work. No contractor allocation was disclosed on this call.
Near-term actionability centers on 2027 backlog formation and project awards rather than an immediate 2026 earnings upgrade. The first-half 2027 transmission-study update provides another catalyst. The longer-duration implication is a widening market for conventional grid upgrades before the larger greenfield construction cycle fully develops.
DISTRIBUTION GROWTH BROADENS ELECTRICAL DEMAND BEYOND THE LARGEST DATA-CENTER CAMPUSES (READ-THROUGH 2)
Affected companies: Hubbell (HUBB: US) and Eaton (ETN: Ireland). Direction: Positive. Magnitude: Medium for relevant electrical businesses; the CenterPoint-specific earnings contribution is not quantifiable from disclosed information.
CenterPoint reported nearly 1 GW of distribution-level load requests over the preceding year. Management identified advanced manufacturing below 75 MW, commercial warehouses, and smaller inference-oriented data centers as contributors. Wells described a “fundamentally different trend at the distribution level” and highlighted demand from suppliers and businesses supporting the initial large industrial developments.
The mechanism extends beyond additional electricity consumption. More connection points and local load concentrations require transformers, distribution switchgear, connectors, protection equipment, feeders, and customer-side electrical systems. Hubbell participates through utility infrastructure components and electrical products. Eaton participates through utility distribution equipment and customer-side power-distribution systems. These are relevant product exposures, not confirmed allocations of CenterPoint procurement.
This is a more diversified demand signal than another hyperscale-campus announcement. Electrical investment can arise from manufacturing, logistics, commercial facilities, and distributed computing, reducing dependence on the completion of individual very large projects. The company’s approximately 2% population-growth backdrop adds a separate source of distribution demand.
Hubbell’s contemporaneous Q3 disclosure independently corroborates the transmission mechanism: its Utility Solutions growth was led by distribution, transmission, and substations, while Electrical Solutions benefited from strong data-center demand. CenterPoint’s commentary strengthens confidence in the breadth and duration of those end markets rather than identifying a previously undisclosed customer contract.
The magnitude should not be overstated. Load requests are not purchase orders, and the call does not establish that smaller facilities require more equipment per MW than larger campuses. Some requests may not proceed. Nevertheless, a broader population of customers creates more potential equipment orders and reduces reliance on a narrow set of hyperscale projects.
Near-term trading catalysts are order growth, backlog conversion, and capacity-expansion utilization in upcoming supplier results. The fundamental effect should develop through 2027–2030 as requests become funded connections. The preferred exposure is to businesses serving both utility and customer-side electrical infrastructure, rather than treating the opportunity exclusively as high-voltage transmission.
GRID STABILITY IS BECOMING A SEPARATE SPENDING CATEGORY, NOT JUST AN ACCESSORY TO NEW LINES (READ-THROUGH 3)
Affected company: Siemens Energy (ENR: Germany). Direction: Positive. Magnitude: Low immediate consolidated earnings impact from the identified Houston opportunity, but medium strategic significance for Grid Technologies.
CenterPoint organized its transmission investment around import capacity, system stability, and intra-regional capacity. In the Q&A, Wells specifically identified stability investments and non-wires alternatives as areas likely to expand as larger loads connect. This matters because the limiting factor is not always conductor capacity; it can also be the network’s ability to remain stable under changing operating conditions.
The mechanism favors equipment and controls that improve voltage stability, manage reactive power, and increase the amount of demand the existing network can safely serve. Such investment can complement new transmission lines or unlock capacity before larger construction projects are completed. It creates a distinct procurement opportunity rather than simply increasing the number of conventional transmission structures.
Siemens Energy has a documented connection to this opportunity. CenterPoint’s separately announced Project TALON will use Siemens Energy transmission grid-stabilizing technology. The Greater Houston Partnership’s description of the project identifies the supplier and explains that the technology is intended to respond rapidly to demand changes, support reliability, and increase usable capacity. That relationship is stronger evidence than assuming a supplier benefits merely because it sells grid equipment.
The earnings call did not announce a new Siemens Energy award, disclose the supplier’s contract value, or establish that all stability spending will use the same technology. The positive read-through is that CenterPoint’s wider planning framework supports a category in which Siemens Energy already has a local reference project.
The first-half 2027 transmission update is the clearest prospective catalyst for additional scope. The longer-duration opportunity is replication across networks where large loads create stability constraints. The investment implication is positive for grid-technology content, not an automatic positive revision to Siemens Energy’s gas-turbine order outlook.
DATA-CENTER INFRASTRUCTURE
CONDITIONAL MEGAWATTS REQUIRE A DISCOUNT; ENERGIZED AND CONTRACTED CAPACITY DESERVES A PREMIUM (READ-THROUGH 4)
Affected companies: Cipher Digital (CIFR: US) and IREN (IREN: Australia). Direction: Negative for the value attributed to unapproved development capacity; relative positive for already energized, contracted assets and more mature projects. Magnitude: Potentially high for development-option valuations, but limited immediate impact on earnings from operating facilities.
CenterPoint disclosed that approximately 2 GW of studied load withdrew during the state’s review process, while management remained confident in approximately 10 GW of base load. Relative to the approximately 4 GW of studied load discussed at the prior call, that represents approximately 50% attrition in the less-developed category. The relevant conclusion is not that every studied project has a similar failure probability. It is that apparently credible utility pipelines can still lose substantial capacity during verification.
Cipher’s October investor presentation identifies approximately 3.4 GW of pipeline capacity as subject to the ERCOT batch process. It separately identifies Colchis as a 1 GW conditional base-load project and Apollo as a 900 MW studied-load submission. IREN’s September announcement describes its 2 GW Sweetwater hub as conditionally included as base load, while expressly noting that classifications remain subject to ongoing approvals.
The valuation mechanism is straightforward. Delayed or unsuccessful approval postpones rental or computing revenue, extends capital-carrying costs, and can leave equipment, land, or construction commitments ahead of monetization. As an illustration, a 1-year delay reduces the present value of otherwise unchanged future cash flows by approximately 9% at a 10% discount rate, before additional costs. Failure to obtain the anticipated capacity has a more severe effect.
The differentiation within each company is critical. Cipher’s contracted and energized assets should not receive the same haircut as its unapproved development pipeline. Similarly, IREN’s energized Sweetwater substation and base-load classification are evidence of progress, but neither establishes that the full 2 GW is built, operating, or revenue-generating. Its disclosed initial 300 MW development target is a different metric from total site potential.
These are statewide procedural read-throughs, not evidence that Cipher or IREN is among CenterPoint’s withdrawing customers. The call does not identify the withdrawing parties or establish that these companies have failed any requirement.
The December 10 ERCOT audit milestone is the most actionable near-term catalyst. Confirmation of classifications, capacity allocation, and energization pathways can materially change development valuations before reported earnings change. The longer-duration implication is a wider valuation gap between operational infrastructure and unapproved site potential. A blanket bearish conclusion on either company would ignore that distinction.
POWER GENERATION AND COMPETITIVE ELECTRICITY
HOUSTON’S NETWORK BUILD SUPPORTS EXISTING GENERATION VALUE, BUT HEDGING DELAYS EARNINGS TRANSMISSION (READ-THROUGH 5)
Affected companies: Vistra (VST: US) and NRG Energy (NRG: US). Direction: Positive for the longer-term commercial value of existing ERCOT generation and customer-supply capabilities. Magnitude: Medium to potentially high over several years, but low for immediate earnings revisions from this call alone.
CenterPoint maintained confidence in approximately 10 GW of higher-confidence load and expects at least 14 GW of total additions by the end of 2030. Wells described significant additional Batch 1 demand and noted that the newly identified transmission program addresses only approximately 50% of the capacity need currently anticipated for that batch.
The key distinction is that the announced Houston investment principally expands the ability to deliver electricity; it does not itself supply an equivalent amount of new generation. Successful energization therefore creates additional demand for electricity, dispatchable capacity, commercial hedging, and customer-supply arrangements. Existing ERCOT generators can benefit through higher utilization, more valuable future contracting opportunities, and greater demand for reliable supply.
Vistra and NRG have established generation and retail positions in Texas, allowing participation through both physical production and commercial customer relationships. The strongest conclusion is improved long-term demand for those capabilities. It is not that every additional MW necessarily raises spot prices or spark spreads. New generation, storage, demand flexibility, fuel costs, and transmission expansion can offset scarcity effects.
The near-term earnings limitation is particularly clear for Vistra. Its Q2 disclosure stated that approximately 94% of expected 2027 generation volumes and 72% of 2028 volumes were hedged as of August 3. These company-wide figures do not measure Houston-specific exposure, but they demonstrate why a stronger future load outlook should not be translated directly into an immediate EBITDA increase.
NRG’s retail obligations create a similar analytical requirement: higher wholesale prices can increase generation value while raising the cost of serving customers. The relevant exposure is the net generation, retail, and hedge position, not gross generation capacity.
The December audit outcome can affect forward-market expectations and equity sentiment before it affects earnings. More durable benefits depend on actual energization, customer ramping, new supply contracts, and hedge roll-off, principally through 2028–2030. The constructive read-through is strongest for existing assets and integrated commercial capabilities, rather than assuming all proposed new generation will earn attractive returns.
REGULATED UTILITIES AND FINANCING
THE GAP BETWEEN CAPITAL GROWTH AND PER-SHARE VALUE IS WIDENING (READ-THROUGH 6)
Affected companies: CenterPoint Energy (CNP: US), American Electric Power (AEP: US), and Sempra (SRE: US). Direction: Negative for valuations based primarily on capital-plan expansion without a financing bridge; positive relative differentiation for demonstrably funded growth. Magnitude: Medium for sector valuation and potentially high for the economics of incremental projects. No peer-specific EPS downgrade follows automatically.
CenterPoint expects enterprise rate-base growth above 14%, but only approximately 8%–9% EPS growth through 2030. Its remaining equity financing requirement increased by $1.6 billion to $4.5 billion, approximately $4 billion of which is expected during 2027–2030. The remaining equity requirement therefore increased approximately 55%, even though the new investment is being funded with less equity than the company’s usual rule of thumb.
The current quarter demonstrates the mechanism rather than merely forecasting it. Growth and rate recovery contributed $0.09 of EPS, while financing costs absorbed $0.04. Increasing the regulated asset base can create attractive earnings opportunities, but interest costs, additional shares, construction timing, and recovery lag determine how much of that growth reaches existing shareholders.
This is especially relevant to large investment programs such as those of AEP and Sempra’s Texas utility interests. The read-through is not that their financing requirements equal CenterPoint’s. It is that incremental capital announcements should be evaluated against available operating cash flow, parent equity contributions, asset-recycling proceeds, and the timing of cash recovery.
Sempra’s announced base-plan framework, designed around operating cash flow and capital recycling rather than new common-equity issuance, illustrates the distinction. That framework does not mean every future Oncor investment is financed without additional capital. It does mean that funded base-plan growth and unfunded upside should not be assigned identical valuations.
CenterPoint also exposed a limitation of otherwise favorable tracker mechanisms. Management said nearly all newly added capital is recoverable through existing trackers, generally with twice-annual filings. Yet Wells separately warned that a rising share of long-cycle transmission work could strain balance sheets and supported consideration of interim recovery. Efficient recovery after assets enter service does not necessarily fund several years of construction beforehand.
Near-term catalysts are financing updates, asset-sale proceeds, equity issuance, and evidence of cash recovery. Longer-duration differentiation will depend on whether utilities can expand infrastructure without repeatedly increasing dilution. The cross-sector implication favors critical suppliers relative to utility owners when project volume grows faster than owners’ cash generation: suppliers can monetize construction activity while utilities continue to fund the assets.
INDUSTRIAL REAL ESTATE
HOUSTON’S INDUSTRIAL MULTIPLIER SUPPORTS WAREHOUSE CASH FLOW, NOT JUST DATA-CENTER LAND VALUES (READ-THROUGH 7)
Affected company: EastGroup Properties (EGP: US). Direction: Positive. Magnitude: Medium for Houston operations and low-to-medium at the consolidated company level.
CenterPoint reported industrial and commercial leasing activity more than 30% above the prior year. Wells highlighted commercial warehouses, smaller advanced-manufacturing facilities, and the suppliers supporting large industrial developments. He described the demand as extending beyond the initial customer into its broader business ecosystem.
EastGroup provides a measurable public-market exposure to this regional signal. Its Q3 supplemental disclosure lists approximately 7.4 million square feet in Houston, representing 9.6% of annualized base rent, with 97.3% leased. The same disclosure shows 5.2% quarterly growth in Houston same-property cash NOI and an 18.7% cash rental-rate increase on new and renewal leases signed during the quarter.
The transmission mechanism is stronger demand for logistics, distribution, and light-industrial space as new manufacturing and commercial activity expands. Higher leasing velocity can reduce downtime and concessions, support renewal economics, and improve absorption of development projects. The direct benefit is property cash flow and development execution, not electricity revenue.
The less obvious opportunity is outside the most crowded data-center infrastructure trade. Suppliers, logistics providers, and smaller industrial businesses require physical facilities even when they are not themselves large electricity users. CenterPoint’s distribution-load commentary provides an independent operating signal that this broader ecosystem is expanding.
The existing 97.3% leased rate limits the amount of immediate upside available from simply filling vacant buildings. Incremental value is more likely to emerge through lease rollover, sustained tenant demand, and development absorption. EastGroup’s disclosed Houston projects under construction also create a pathway for growth beyond its stabilized portfolio.
The limitation is geographic. CenterPoint’s commentary supports Houston industrial fundamentals, not a national warehouse recovery or an office-property thesis. New local supply can also absorb part of the demand benefit, and utility energization delays can postpone occupancy for power-intensive tenants.
This is principally a 2027–2028 fundamental read-through rather than a sharp event-driven trade. Upcoming leasing, renewal-spread, and development-occupancy disclosures are the relevant catalysts. The actionable conclusion is a favorable regional earnings signal for a landlord with documented Houston exposure, rather than a broad rerating argument for all industrial real estate.
Report record
- Sector
- Utilities
- Industry
- Multi-Utilities
- Fiscal period end
- September 30, 2026
- Report date
- October 27, 2026
- Analysis
- 6193 words
- Read-throughs
- 2731 words
- Content fingerprint (PDF)
df4d63094029- Content fingerprint (analysis)
214683822696- Content fingerprint (read-throughs)
73e35556923a
Prepared from the company's earnings release and earnings call transcript. Figures as reported by the company. For information only. Not investment advice.
More from CenterPoint Energy, Inc.
No other reports yet.
All CenterPoint Energy, Inc. reports
More in Utilities
Visibility Improved, Guidance Did Not, and Dominion Stayed Contested
Follow @AtlasPeakRes on X for new earnings reports as they publish.