An Internationally Led Recovery, Not Yet an Earnings Recovery
Earnings Reports
HF Sinclair Corporation FQ3 2026 Earnings Report
HF Sinclair Corporation (DINO) FQ3 2026 earnings: Near-term earnings power is substantially higher, but the quarter is not a sustainable run rate. Full earnings analysis, key read-throughs, and the one-page exhibit from Atlas Peak Research.
HF Sinclair Corporation (DINO)
Sector: Energy · FQ3 2026 · Period end September 30, 2026 · Reported October 28, 2026
HF Sinclair’s Q3 2026 earnings call supports a substantial upward reassessment of near-term earnings and cash-generation capacity, but not the treatment of the reported quarter as a sustainable earnings run rate.
Download the one-page report (PDF)
View one-page exhibit
Download analysis (.md)
Download read-throughs (.md)
Post to X
One-Page Exhibit
Earnings Analysis
EXECUTIVE CALL SUMMARY: HF Sinclair Corporation (10/28/26)
HF Sinclair’s Q3 2026 earnings call supports a substantial upward reassessment of near-term earnings and cash-generation capacity, but not the treatment of the reported quarter as a sustainable earnings run rate. Adjusted EPS of $11.75 exceeded the supplied Bloomberg consensus of $8.18 by 43.6%, while adjusted EBITDA of $2.984 billion exceeded consensus of $2.11 billion by 41.4%. The fundamental result remained strong after allowing for the substantial small refinery exemption, or SRE, benefit discussed during Q&A. However, the distinction between earnings recognition, cash realization and recurring operating performance is central to interpreting the quarter.
The most important qualification is that the approximately $500 million-$600 million SRE benefit cited by analysts was recognized through an expense reversal rather than monetization of excess renewable identification numbers, or RINs. Management explained the mechanism but did not explicitly confirm that dollar range. Using the analysts’ range as a sensitivity, adjusted EBITDA excluding the estimated SRE benefit would have been approximately $2.384 billion-$2.484 billion, still 13.0%-17.7% above the supplied consensus. This indicates that the result was not merely an accounting-driven beat, although the estimated SRE benefit represented 57%-69% of the headline EBITDA surprise. Consensus treatment of SRE benefits was not disclosed, so this calculation is a normalization sensitivity rather than a precise attribution of the earnings beat.
The call’s strongest fundamental messages were sustained refining-market tightness, 105% refining capture excluding SRE benefits, widening Canadian heavy-crude discounts, continued marketing growth and substantial profitability in renewable diesel. The balance sheet strengthened to $559 million of net cash, and quarterly operating cash flow of $1.784 billion supported $1.647 billion of free cash flow before shareholder distributions. These results provide meaningful financial flexibility ahead of higher organic investment and the planned lubricants separation.
The principal offsets were lower Q4 crude-processing guidance, a 12.9% increase in the 2026 capital budget, the refusal to recommit to the historical $7.25-per-throughput-barrel refining cost target, a delay in Westline Connect’s final investment decision, and incomplete disclosure of the economics of the post-Mississauga lubricants business. Renewables, lubricants and midstream EBITDA also declined sequentially, notwithstanding favorable management commentary. The acceleration in consolidated earnings was overwhelmingly a refining phenomenon.
The appropriate investment stance is a valuation-dependent Hold rather than an unconditional Buy based on the headline earnings multiple. The quarter warrants higher near-term earnings expectations and greater confidence in liquidity and capital-return capacity. It does not establish that exceptional refining margins, SRE reversals or current base-oil profitability deserve a full recurring-earnings valuation. A definitive price-based recommendation requires a verified equity valuation, updated forward earnings expectations and a more complete 2027 investment and separation framework.
OBSERVATION: FINANCIAL PERFORMANCE AND THE COMPOSITION OF THE BEAT
The company’s October 28 earnings release reported GAAP net income attributable to shareholders of $2.015 billion, or $11.38 per diluted share, compared with $403 million, or $2.15 per share, in Q3 2025. Adjusted net income increased to $2.079 billion from $459 million, a 352.9% increase. Adjusted EPS increased 381.6%, with the stronger per-share growth partly reflecting a 5.7% reduction in weighted-average diluted shares to 175.9 million from 186.5 million.
The sequential improvement was similarly substantial. Adjusted EPS increased 121.3% from $5.31 in Q2 2026, while adjusted EBITDA increased 101.3% from $1.482 billion. Revenue increased only 4.5% sequentially to $10.857 billion, highlighting that the earnings acceleration primarily reflected margin expansion and regulatory-accounting benefits rather than a comparable increase in physical business activity. Revenue exceeded the supplied Bloomberg estimate by 19.2%, but revenue is a less informative performance measure than realized margins, product volumes and cash conversion for this business.
Refining generated $2.582 billion of adjusted EBITDA, compared with $661 million in Q3 2025 and $1.023 billion in Q2 2026. The segment accounted for 86.5% of consolidated adjusted EBITDA and 90.9% of its year-over-year increase. Consequently, management’s emphasis on a diversified portfolio should not obscure the current economic concentration in refining.
The remaining segments contributed $423 million of EBITDA before corporate costs and eliminations: lubricants and specialties generated $174 million, renewables $109 million, midstream $101 million and marketing $39 million. These businesses provided meaningful earnings support, but their combined contribution remained small relative to refining. Corporate, other and elimination effects reduced aggregate segment EBITDA by approximately $21 million.
The sequential composition is particularly important. Refining EBITDA increased by $1.559 billion, while lubricants declined by $33 million, renewables declined by $14 million and midstream declined by $11 million. Marketing increased by $11 million. The consolidated quarter therefore demonstrated exceptionally strong refining economics rather than uniformly accelerating profitability across the portfolio.
OBSERVATION: EARNINGS QUALITY, SRE ACCOUNTING AND CASH REALIZATION
The reported adjusted results retain substantial benefits that should not automatically be treated as recurring. The company’s non-GAAP reconciliation excludes specified restructuring, impairment and inventory-valuation items, but it does not exclude the SRE benefit. “Adjusted” therefore does not mean normalized through the cycle.
Vivek Garg provided the call’s most consequential accounting clarification: “With the SRE granted towards the end of the quarter, we essentially ended up reducing our expense or reversing our expense that we had already taken over the period.” He then stated, “While you see the benefit come through in earnings, you will actually not see any of that benefit come through cash flow statement.”
The mechanism is economically different from receiving a cash refund. Refining compliance expenses had been accrued as obligations were generated. The exemptions reduced those obligations, leaving incremental RINs in inventory. Management had not sold those RINs and retained the flexibility to use eligible inventory against future compliance requirements. The benefit therefore has potential future cash value through avoided purchases or eventual sales, but that value was not realized as incremental Q3 operating cash flow.
This distinction prevents 2 analytical errors. The SRE-related expense reversal should not be projected as an ordinary quarterly margin contribution. Conversely, the absence of immediate cash realization does not imply that the benefit has no economic value. Its ultimate realization depends on eligible compliance uses, RIN prices, inventory restrictions, future obligations and regulatory outcomes. The call did not provide enough detail to establish the precise monetization schedule or a complete recurring-versus-retroactive benefit split.
Using the analyst-cited $500 million-$600 million range, refining EBITDA excluding the estimated SRE benefit would have been $1.982 billion-$2.082 billion. That remains approximately 3.0-3.2 times Q3 2025 refining EBITDA and almost 2 times Q2 2026 EBITDA. The underlying refining result was therefore exceptionally strong even without the estimated exemption-related uplift.
Applying the reported adjusted effective tax rate of 23.8% and approximately 175.9 million diluted shares produces an illustrative SRE EPS contribution of approximately $2.17-$2.60. Subtracting this from reported adjusted EPS gives approximately $9.15-$9.58. These estimates are not company-provided alternative EPS figures and do not fully reproduce participating-security allocations or any item-specific tax differences. They nevertheless demonstrate that a substantial operating earnings improvement remains after removing the estimated SRE benefit.
The remaining non-GAAP adjustments require separate treatment. The company’s $64 million net adjustment from GAAP to adjusted net income reflected $84 million of pretax adjustments, less $20 million of associated tax effects. Pretax adjustments included $54 million of accelerated depreciation, $28 million of impairments, $28 million of severance, $3 million of separation costs and $1 million of acquisition-related costs, offset by removal of a $30 million inventory-valuation benefit.
Accelerated depreciation should not be added back again to adjusted EBITDA because depreciation is already excluded from EBITDA. Similarly, the $30 million renewable inventory-valuation benefit has already been removed from the reported $109 million of renewables adjusted EBITDA. Neither item represents additional upside to the adjusted EBITDA figure.
Lubricants’ $22 million FIFO benefit remains in adjusted EBITDA. Removing that benefit as well as the analyst-estimated SRE amount would produce consolidated EBITDA of approximately $2.362 billion-$2.462 billion. This is a useful narrower normalization, but not a midcycle estimate: extraordinary refining and base-oil market conditions would still be embedded in the result.
OBSERVATION: REFINING OPERATIONS, REGIONAL PERFORMANCE AND CAPTURE
Refining’s earnings improvement did not depend on higher aggregate processing volumes. Crude charge averaged 614,060 barrels per day, down 3.9% year over year and approximately 4.0% sequentially. Total refinery throughput, which includes non-crude feedstocks, averaged 659,980 barrels per day. These measures are not interchangeable, and the crude-charge guidance should not be compared directly with Bloomberg’s total-throughput estimate.
The Q3 crude-charge result was 1.5% above the 605,000-barrel-per-day midpoint of the prior 590,000-620,000 guidance range, although below its upper end. Total throughput exceeded the supplied consensus by 0.8%. Consolidated utilization was 90.6%, compared with 94.3% a year earlier and consensus of 91.1%. The combination of modest throughput outperformance and slightly lower-than-expected utilization does not support attributing the financial beat primarily to an unusually large operational volume surprise.
Regional performance was consistent with the El Dorado turnaround. Mid-Continent crude charge declined to 250,340 barrels per day from 280,240, while utilization declined to 96.3% from 107.8%. West crude charge increased to 363,720 barrels per day from 358,810, and utilization improved to 87.0% from 85.8%. West sales of produced refined products increased 5.2% to 400,020 barrels per day and exceeded the supplied consensus by 3.2%.
Consolidated sales of produced refined products nevertheless declined to 643,540 barrels per day from 661,140 a year earlier and 668,670 in Q2. The result was consequently driven by dramatically higher earnings per barrel rather than increasing aggregate sales.
Adjusted refinery gross margin reached $54.22 per produced barrel sold, compared with $19.16 a year earlier and $25.95 in Q2. After reported operating expenses, the margin was $44.81 per produced barrel, compared with $11.82 and $17.87, respectively. The estimated SRE benefit equates to approximately $8.45-$10.13 per produced barrel sold. Excluding that sensitivity leaves adjusted gross margin of approximately $44.09-$45.77 and gross margin less operating expenses of approximately $34.68-$36.36.
Steve Ledbetter stated, “If you strip out SRE, our capture was right at 105%.” This supports the proposition that realized commercial performance was strong beyond the exemption benefit. Management attributed the improvement to reliability, better product placement, transfers and optimization across refineries, higher-value product opportunities and expansion of the branded channel.
However, 105% capture is a relationship to a benchmark, not a direct measure of permanent efficiency. Capture can reflect crude differentials, product mix, local pricing, inventory timing and benchmark construction in addition to operational improvements. The call did not provide a complete bridge separating these factors. The evidence supports improved execution, but not the conclusion that the entire capture advantage is structural.
OBSERVATION: OPERATING COSTS AND THE NON-REAFFIRMATION OF THE PRIOR TARGET
Refining operating expenses increased to $557 million from $447 million a year earlier and $491 million in Q2. Operating expenses per throughput barrel increased to $9.18 from $7.12 year over year and $7.93 sequentially, increases of 28.9% and 15.8%, respectively. On a produced-barrel-sold basis, operating expenses were $9.41 versus $7.34 a year earlier.
This deterioration is material despite the extraordinary margin environment. Management identified environmental accrual true-ups, performance-related employee-benefit charges, inflation in catalysts and chemicals, higher sulfuric-acid costs and additional maintenance undertaken to improve reliability. Lower processing volumes also reduced fixed-cost absorption.
Some expenses are plausibly episodic, but the call did not quantify the individual components or provide a normalized cost bridge. Environmental accrual adjustments can have subsequent cash implications, while higher maintenance spending may recur even when individual projects are described as unusual. Performance-related compensation can normalize with earnings, but chemical and maintenance inflation may persist.
The historical $7.25 target was explicitly presented on a throughput-barrel basis in the company’s December 2025 investor presentation. Ledbetter did not recommit to it for 2027. Instead, he emphasized, “Ultimately, we want to improve not only cost, but total earnings.” That is economically appropriate when incremental spending protects highly profitable production, but it changes the modeling assumption. The historical target should no longer be treated as reaffirmed guidance.
The difference between Q3’s $9.18 and the prior $7.25 target equates to approximately $117 million over Q3 throughput, or approximately $465 million annualized at the same daily volume. This is not a forecast of recoverable savings because it combines temporary items, activity levels and potentially durable cost changes. It illustrates the significance of the unresolved cost base.
The investment implication is asymmetric. In the current environment, modest spending that prevents downtime can generate attractive returns. When cracks normalize, a higher underlying cost structure becomes much more visible. Reliability improvements and cost discipline therefore need to be evaluated together rather than accepting either higher expenses or lower expenses as intrinsically favorable.
IMPLICATION: REFINING MACROECONOMICS AND THE DURATION OF EXCESS RETURNS
Management’s macroeconomic outlook remained constructive, but its duration should be treated as a forecast rather than a verified industry fact. Franklin Myers stated that full recovery of affected refining assets and product availability was unlikely “until sometime in 2028.” Ledbetter cited approximately 4 million barrels per day of refining production offline, consisting of approximately 2.5 million in the Middle East and 1.5 million in Russia.
The Q2 call had cited approximately 5 million-7 million barrels per day of refining capacity offline and described supportive markets potentially extending into 2028. The lower Q3 figure is not directly comparable because the terminology shifted between capacity and production, and no asset-level reconciliation was provided. Nevertheless, the quantified outage assessment changed even as management characterized the broader environment as largely unchanged. The call does not establish a constant physical supply deficit.
Management’s distinction between crude availability and product availability is economically important. Improved transit through the Strait of Hormuz does not immediately restore damaged refining units, utilities, storage, ports or supporting infrastructure. Crude supply can improve while distillate production remains constrained. That configuration can support favorable refining margins even without a proportionate increase in crude prices.
However, full restoration of damaged capacity is not required for margins to normalize. Incremental restarts, higher utilization elsewhere, product-trade adjustments, Chinese export changes, inventory rebuilding or demand destruction can materially reduce scarcity premiums before the final damaged refinery returns. The 2028 recovery assessment should therefore not be translated into an assumption that Q3 margins persist until 2028.
Management itself acknowledged this distinction. Ledbetter stated, “This margin environment we are enjoying currently will come back to normal.” That admission is central to the capital-allocation strategy: extraordinary cash generation is being used to improve asset reliability, market access and less cyclical earnings streams before normalization occurs.
The statements concerning historically low inventories, Chinese export restraint and the timing of foreign refinery repairs were management assessments. The call did not provide the geographic definitions, underlying time series or asset-level repair schedules necessary to validate them independently. The appropriate investment framework is consequently scenario-based, with product balances and realized regional cracks taking precedence over a fixed geopolitical end date.
IMPLICATION: WCS DISCOUNTS AND THE EL DORADO HEAVY-CRUDE OPPORTUNITY
Widening Western Canadian Select differentials provide an additional feedstock advantage, but the exposure must be defined carefully. Management described the ability to process slightly more than 100,000 barrels per day of total heavy crude, with a substantial portion consisting of WCS. This was a capability statement, not disclosure of actual WCS throughput or its precise share of the current crude slate.
Approximately 100,000 barrels per day represents about 16% of Q3 crude charge, but that should not be interpreted as actual WCS penetration. The earnings release reported heavy sour crude at approximately 12% of total feedstocks, and Canadian exposure also includes other crude categories.
Management attributed the wider differential to Canadian production growing faster than export capacity, elevated freight costs, crude held on tankers, altered trade flows and additional Venezuelan supply into the Gulf Coast. Ledbetter cited observed differentials above $25 and into $30, while expecting some moderation but generally wider differentials through 2027.
A quoted WCS discount is not equivalent to incremental refinery profit. Delivered economics depend on transportation, competing crude prices, sulfur content, density, conversion capability, hydrogen requirements, energy consumption and the value of residual products. HF Sinclair’s asphalt network can improve the economics of heavier feedstocks, but this advantage also varies with seasonal asphalt demand and regional realizations.
The El Dorado vacuum furnace project provides a concrete asset-level opportunity. Management expects improved reliability, better product yields and the capacity to process up to an additional 10,000 barrels per day of advantaged heavy crude. This is feedstock flexibility, not necessarily an increase in total refinery throughput.
For scale, an additional $5 per barrel of net feedstock advantage across 100,000 barrels per day would represent approximately $183 million annually before secondary operating effects. For the incremental 10,000-barrel-per-day capability, an illustrative $10-per-barrel net advantage would generate approximately $36.5 million annually before incremental costs and downtime. Neither assumption is company guidance.
The project is attractive because its value can arise from reliability and slate flexibility even if exceptional WCS discounts narrow. However, the current $25-$30 headline differential cannot be applied mechanically as the project’s incremental margin because the displaced crude already has its own price and yield characteristics.
OBSERVATION: Q4 OPERATING GUIDANCE AND CHANGES TO THE OUTLOOK
Q4 crude-charge guidance of 560,000-600,000 barrels per day implies a midpoint of 580,000, down 5.5% from Q3 actual processing. The range is approximately 2.3%-8.8% below Q3. Management attributed the outlook to the continuing El Dorado turnaround.
At the midpoint, the volume reduction represents approximately 3.13 million fewer crude barrels over a 92-day quarter. An illustrative $20-$30 of incremental contribution per lost crude barrel would imply approximately $63 million-$94 million of earnings exposure before product-yield differences, fixed-cost absorption, maintenance expenses and any offsetting margin changes. This is a sensitivity, not an EBITDA forecast.
The lower guide means that completion of the turnaround should not be equated with immediate full-quarter production recovery. Restart timing and operational stabilization remain important Q4 variables. There was no disclosed prior Q4 crude-charge range against which to characterize the new guidance as a formal downward revision.
The call did not provide numerical Q4 refining-margin guidance, a renewable-diesel capture forecast, a full-year 2027 earnings outlook or a 2027 capital budget. Favorable commentary on Q4 renewables should not be substituted for explicit unit-margin guidance. Similarly, continued discussion of reliability improvement does not constitute a reaffirmation of the $7.25 cost target.
OBSERVATION: MARKETING AND MIDSTREAM
Marketing delivered the clearest sequential improvement outside refining. EBITDA increased to $39 million from $29 million a year earlier and $28 million in Q2, increases of 34.5% and 39.3%. Branded sales volumes increased to approximately 420 million gallons from 360 million a year earlier and 387 million in Q2.
The release reported 1,852 branded sites, up 8.6% from 1,705 a year earlier. This is broadly consistent with, but below, the approximately 10% annual site-growth objective discussed on the Q2 call. Volume growth exceeded site-count growth, indicating that the improvement was not explained solely by a larger network. Differences in site productivity, network composition and customer activity also matter.
EBITDA per reported branded gallon increased to approximately $0.093 from $0.080 a year earlier. This is a useful aggregate indicator rather than a pure station-level margin because segment earnings include licensing and other marketing activities. The combination of higher volumes and improved aggregate unit profitability nevertheless supports a favorable assessment.
Management also emphasized the refining benefit from shifting lower-value bulk and unbranded barrels into branded channels. This is an important integration advantage: marketing growth can improve both marketing earnings and realized refinery netbacks. Consolidated analysis must avoid counting internal transfer economics twice, but better access to final demand can create genuine incremental value.
Midstream moved in the opposite direction. EBITDA declined 11.4% year over year to $101 million and 9.8% sequentially from $112 million. The earnings release showed total pipeline and terminal activity declining to approximately 2.00 million barrels per day from 2.06 million, while segment operating expenses increased to $68 million from $50 million.
Pipeline volumes increased modestly, but terminal and loading-rack volumes declined. The call did not provide a detailed earnings bridge explaining the operating-cost increase. The evidence therefore supports less cyclical potential, not immunity from operating-cost pressure or refinery-related activity changes.
Approximately $135 million of the segment’s $169 million of reported revenue was intersegment revenue. This is a reminder that substantial midstream earnings are linked to the same refining system. The business can improve earnings visibility, but its economic independence from refining should not be overstated.
Marketing and midstream together generated only 4.7% of consolidated Q3 adjusted EBITDA. Their strategic importance is greater than this peak-cycle share suggests, but a meaningful change in consolidated earnings stability requires sustained growth over several years.
OBSERVATION: RENEWABLE DIESEL, UTILIZATION AND POLICY DEPENDENCE
Renewables adjusted EBITDA improved to $109 million from a $13 million loss a year earlier. Produced sales volumes increased to 63.2 million gallons from 57.2 million, while adjusted gross margin increased to $2.11 per gallon from $0.18. Operating expenses per gallon declined to $0.37 from $0.39.
The annual comparison demonstrates a substantial turnaround. However, EBITDA declined 11.4% from Q2’s $123 million despite higher sales volumes. EBITDA per produced gallon declined approximately 16% sequentially, from about $2.05 to $1.72. The business remained highly profitable, but the quarterly progression was not uniformly improving.
Management identified direct feedstock procurement, reduced reliance on brokers, proximity-based sourcing, better market placement and operating discipline as the principal execution improvements. More than 50% of sales were placed outside California, including the Pacific Northwest, Canada and New Mexico. This reduces concentration in a market exposed to substantial renewable-diesel supply and low-carbon-credit volatility.
Geographic diversification is not equivalent to reduced policy dependence. The reported earnings improvement also reflected higher RIN prices and greater producer tax credit benefits. Net profitability remains exposed to feedstock costs, diesel prices, tax-credit eligibility, carbon-intensity treatment, regional clean-fuel programs, transportation and compliance rules.
The broader portfolio’s RIN exposure is complex. Higher RIN values support renewable production economics but can increase the cost of refining obligations that are not exempt. The company also disclosed intersegment sales of renewable fuels and RINs that eliminate in consolidation. Gross segment sensitivities should therefore not be added without considering obligations, exemptions, external sales and internal transfers.
Ledbetter reported 72% utilization excluding the Cheyenne turnaround, compared with 67% in Q2 excluding the Parco outage. This indicates improved underlying availability, but these adjusted utilization measures are not actual fleet-wide utilization. Management characterized utilization above 70% as the economically attractive operating range given the co-located facilities. Maximizing nameplate utilization is therefore not necessarily the correct earnings objective.
The response to the question about Q3 unusual items was incomplete. The earnings release confirms that the $30 million inventory-valuation benefit was excluded from adjusted EBITDA, but management did not provide a comprehensive bridge of tax-credit recognition, feedstock timing and other potential nonrecurring benefits. This matters because Q1 2026 included $49 million of prior-year producer tax credit benefits. The absence of a similar disclosed Q3 item does not independently establish that every component of current profitability is recurring.
Q4 commentary was favorable but unquantified. Management did not commit to a specific capture rate or confirm the magnitude of any feedstock-lag benefit. The appropriate conclusion is that operating execution has improved materially, while the sustainability of current profitability remains partly dependent on regulatory and commodity-price relationships.
OBSERVATION: LUBRICANTS PERFORMANCE BEFORE SEPARATION
Lubricants and specialties generated $174 million of adjusted EBITDA, up 123.1% year over year but down 15.9% from Q2’s $207 million. The reported FIFO benefit declined to $22 million from $46 million sequentially, compared with $2 million in Q3 2025.
Excluding FIFO, EBITDA was approximately $152 million, versus $161 million in Q2 and $76 million a year earlier. Underlying earnings therefore doubled year over year and declined only 5.6% sequentially. Approximately $24 million of the $33 million sequential EBITDA decline was explained by the smaller FIFO benefit.
Physical sales volumes declined 5.7% year over year to 30,190 barrels per day, while the finished-product share increased to 52% from 49%. Stronger pricing, product mix and base-oil market conditions were therefore more important than volume growth.
Matt Joyce emphasized cost recovery, pricing discipline, new business wins and tighter Group II and Group III base-oil markets. Longer-term contracted customer gains are potentially more durable than temporary base-oil scarcity. However, contract duration alone does not establish margin durability without disclosure of pricing formulas, raw-material pass-through, minimum volumes and customer termination provisions.
The current earnings level should not be extrapolated directly into the standalone company. Annualizing reported Q3 EBITDA produces $696 million, while annualizing EBITDA excluding FIFO produces $608 million. Both figures are substantially above the approximately $300 million-$350 million historical EBITDA reference discussed on the Q2 call. That earlier reference was a rough operating benchmark and aspiration, not a detailed post-separation forecast.
OBSERVATION: LUBRICANTS SEPARATION, MISSISSAUGA AND THE EARNINGS BRIDGE
The separation and the Mississauga retirement are related but economically distinct transactions. The spin changes ownership and financial reporting. The retirement changes the production and supply model, removes assets and costs, and creates a need to replace internally produced base oils.
Management’s proposed model substitutes external procurement and distribution agreements for part of the existing manufacturing base. The Q2 call described agreements with global base-oil manufacturers and continued access to Tulsa production. Potential benefits include lower fixed costs, reduced sustaining capital, lower working capital, greater procurement flexibility and more focused investment in finished lubricants and specialties.
These benefits must be weighed against lost manufacturing margins, supplier dependence, logistics requirements, inventory buffers and the allocation of legacy environmental liabilities. Closing production during a period of unusually strong base-oil margins makes the distinction between current earnings and long-run asset economics particularly important.
Joyce’s Q3 wording was appropriately qualified: the new model is intended to “help offset some of the historical contribution that came from Mississauga.” This does not establish full replacement of the refinery’s EBITDA. When pressed on future earnings, management did not provide a quantified bridge from current segment EBITDA to standalone profitability.
The unresolved items include the Mississauga earnings contribution being relinquished, procurement economics, fixed-cost removal, stranded corporate costs, incremental public-company expenses, transitional service charges, ongoing capital requirements, working-capital release and the cash cost of shutdown and remediation. Without these details, a more capital-light business cannot automatically be assumed to generate higher absolute free cash flow.
Q3’s $27 million Mississauga impairment, $28 million of severance and $54 million of accelerated depreciation should not be treated as a complete estimate of remaining closure costs. The impairment and accelerated depreciation are principally noncash, whereas severance and other future obligations can consume cash. The call did not establish a comprehensive remaining cash-cost envelope.
Timing was described with varying degrees of precision. Myers referred to completion around the middle of 2027. Garg referred to the Mississauga transition being substantially completed in the second half of 2027. Joyce described separation as on track for the second half of 2027, with operational readiness by early Q3.
Relative to July’s original 12-18-month separation framework, the current commentary concentrates attention around the earlier portion of the original window. It does not provide a single definitive completion date. Operational readiness, legal distribution and final plant-transition activities may occur at different times.
The key work streams are now moving from planning into execution: the private letter ruling process, Form 10 preparation, leadership appointments, IT separation and operating agreements. These activities are necessary but do not establish that regulatory, tax or execution conditions have been satisfied.
The earnings release added that the separation is expected to involve distribution of at least 80.1% of the new company’s shares. This should not be modeled as a confirmed distribution of 100% with no retained interest. Final ownership, capitalization and any retained-stake disposition remain relevant to valuation.
Management explicitly rejected an aggressively leveraged spin. Joyce stated, “We don’t plan to load this up with debt.” This favors the standalone company’s resilience and growth flexibility, but it limits the assumption that a large debt-funded payment will automatically be available to the parent.
IMPLICATION: CASH FLOW, LIQUIDITY AND SHAREHOLDER RETURNS
Operating cash flow of $1.784 billion increased 18.1% from Q2’s $1.510 billion. After $137 million of capital expenditures, free cash flow was approximately $1.647 billion, up 18.3% sequentially. The $114 million of turnaround spending was already included in operating cash flow and should not be deducted again.
For the first 9 months, reported operating cash flow totaled approximately $3.751 billion and capital expenditures totaled $357 million, implying approximately $3.394 billion of free cash flow. These cash figures demonstrate that the business generated substantial liquidity independently of immediate SRE monetization. They do not establish a sustainable annual run rate because working capital, taxes, turnaround timing and exceptional market conditions remain influential.
Cash increased to $3.333 billion from $2.262 billion at June 30. With debt of $2.774 billion, net cash was $559 million. The approximately $5.3 billion of total liquidity included an undrawn $2 billion revolver; the revolver is borrowing capacity, not additional equity value.
The quarter’s cash movements are broadly consistent with operating cash flow less capital expenditures and shareholder returns: $1.784 billion less $137 million and $572 million equals approximately $1.075 billion, close to the reported $1.071 billion increase in cash. There was no evidence in these figures of substantial unexplained cash leakage.
Shareholder returns comprised $479 million of repurchases and $93 million of dividends. The quarterly dividend remained $0.525 per share following Q2’s 5% increase, equivalent to $2.10 annually if maintained. Repurchases accounted for approximately 84% of Q3 distributions.
The most important capital-return guidance was Garg’s statement: “We expect to end the year at our target payout ratio of 50%, and that is what you should be expecting.” The company’s historical investor materials define this ratio as dividends plus repurchases divided by adjusted net income, not free cash flow.
Using reported quarterly return totals, distributions through Q3 were approximately $1.004 billion against $3.166 billion of year-to-date adjusted net income, a payout ratio of approximately 31.7%. Reaching 50% for the full year therefore implies Q4 distributions equal to approximately $579 million plus 50% of Q4 adjusted net income, subject to reporting conventions and implementation.
Illustratively, Q4 adjusted net income of $1.0 billion, $1.5 billion or $2.0 billion would imply Q4 total distributions of approximately $1.079 billion, $1.329 billion or $1.579 billion. These are arithmetic implications of the stated annual framework, not separate quarterly buyback guidance.
The accounting basis matters because adjusted net income includes the SRE benefit before its cash realization. Applying the payout formula to the estimated after-tax SRE contribution increases the implied annual distribution target by approximately $191 million-$229 million. The balance sheet provides capacity to fund that timing difference, but the earnings-based distribution formula is not identical to a same-period cash-payout formula.
Repurchases have demonstrably reduced the share count, but reduction alone does not establish value creation. The economic return depends on repurchase prices relative to normalized intrinsic value. Peak-cycle earnings can make superficially low EPS multiples misleading, particularly when the same cash has competing uses in long-duration growth projects.
OBSERVATION: CAPITAL SPENDING AND WESTERN MARKET EXPANSION
The revised 2026 budget comprises $725 million of sustaining capital and turnarounds plus $150 million of growth capital, totaling $875 million. The December 2025 framework was $650 million of sustaining capital and turnarounds plus $125 million of growth capital, totaling $775 million. Q2 management had left that budget unchanged while acknowledging that projects under evaluation could alter it.
The revision therefore increases total spending by $100 million, or 12.9%. Sustaining and turnaround spending increases by $75 million, or 11.5%, while growth spending increases by $25 million, or 20.0%. The increase is manageable against current cash generation, but it reduces free-cash-flow expectations relative to a model retaining the prior budget.
This guidance includes categories beyond the capital-expenditure line in the cash-flow statement, particularly turnaround spending. Comparing the $875 million budget directly with $357 million of year-to-date capital expenditures would overstate the amount necessarily remaining to be spent.
Management did not provide a numerical 2027 budget. Statements that sustaining and turnaround spending remain range-bound through the cycle are qualitative. They do not establish that total 2027 investment will remain near the revised 2026 level, particularly as Western Gateway, Westline Connect and marketing investments advance.
Westline Connect’s first phase is designed to add approximately 35,000 barrels per day of capacity moving Rockies supply into Utah and Nevada, with service targeted for 2029. The capacity and service target are broadly consistent with the Q2 discussion, but final investment decision moved from the previously contemplated Q4 2026 timing to Q1 2027.
Ledbetter explained that route and scope alternatives could improve the outcome. This can represent disciplined project development rather than deterioration in commercial prospects. It nevertheless introduces an additional period of uncertainty, and the call did not quantify cost, tariffs, customer commitments, ownership economics or expected returns.
The project’s attraction extends beyond pipeline earnings. Moving barrels into higher-value destinations can improve refinery netbacks, reduce local oversupply and support marketing growth. At 35,000 barrels per day, an illustrative $5-per-barrel net system benefit would represent approximately $64 million annually at full utilization. This is a scale sensitivity, not a forecast, and should not be added to pipeline EBITDA if doing so duplicates tariff or transfer-pricing effects.
Western Gateway provides a separate route to improve access from El Dorado, Tulsa and Artesia into Southwest markets. Management views the projects as complementary and expects to fund commitments with cash and operating cash flow rather than revolver drawings. However, complementarity cannot be fully assessed without market-by-market demand, competing supply, tariff and capacity analysis.
The central timing issue is that Westline Connect is targeted for 2029, after management’s expected period of broader refining-system recovery begins. Project underwriting therefore must rely on durable regional supply deficits and competitive delivered costs, not persistence of Q3 2026 scarcity margins.
California refinery closures and high operating costs may support Western product imports, but competing pipelines, marine imports, fuel-efficiency improvements and electrification can reduce the eventual margin opportunity. New infrastructure can also compress the regional price differentials that initially justified construction. Attractive integration benefits require competitive economics after that response.
Management’s comments on E15 similarly describe a strategic risk rather than a confirmed policy outcome. Greater ethanol penetration could reduce petroleum gasoline requirements at a given level of finished-fuel demand, increasing the value of diversified market access. The timing and extent of any change were not established on this call.
IMPLICATION: MANAGEMENT TRANSITION AND STRATEGIC CONTINUITY
Steve Ledbetter’s appointment as CEO and president effective January 1, 2027 represents continuity rather than a strategic reset. The priorities remain reliability, commercial optimization, technology, disciplined capital allocation and expansion of integrated marketing and midstream earnings.
Franklin Myers’ continued executive-chair involvement provides continuity through the separation. The supplied leadership notice ties that role to completion of the lubricants transaction, while the call described active transition support during the initial quarters of 2027.
The clearest capital-allocation signal was Ledbetter’s statement that “the majority of our growth is going to be targeted at organic opportunities.” Management is not signaling a material refining acquisition program. Selective marketing joint ventures and highly integrated midstream opportunities remain possible, but large inorganic deployment is not the stated priority.
That reduces the immediate risk of an expensive, transformational acquisition during a period of elevated industry earnings. It does not remove execution risk: simultaneous refinery projects, logistics development, technology investment, a supply-model transition and a public-company separation create a substantial internal delivery agenda. No quantified AI-related cost reduction or capital-return target was disclosed, so technology references should not be assigned separate earnings value.
IMPLICATION: ILLUSTRATIVE 2027 EARNINGS SCENARIOS
A scenario framework is more appropriate than annualizing Q3’s approximately $11.9 billion adjusted EBITDA rate. The following cases are analytical sensitivities, not management guidance or consensus forecasts. They exclude another large SRE reversal and FIFO gains. They measure the combined economic businesses attributable to current shareholders, including lubricants after separation, rather than predicting HF Sinclair’s post-spin consolidated reporting perimeter.
The base case carries a 50% probability. It assumes refining produced-product sales of 650,000 barrels per day and realized gross margin less operating expenses of $20 per produced barrel, substantially below Q3’s approximately $35-$36 excluding the estimated SRE benefit. After approximately $280 million of refining SG&A, refining EBITDA would be approximately $4.47 billion. Adding approximately $420 million of midstream EBITDA, $160 million of marketing, $300 million of renewables and $350 million of lubricants, less $120 million of corporate and separation-related overhead, produces combined EBITDA of approximately $5.6 billion. This case assumes partial margin normalization, reasonable refinery reliability and no major disruption to the lubricants transition.
The bull case carries a 25% probability. It assumes persistent product scarcity, sustained favorable heavy-crude economics and produced-product sales of 670,000 barrels per day. At $30 per barrel of margin after operating expenses and approximately $300 million of refining SG&A, refining EBITDA would be approximately $7.04 billion. Midstream, marketing, renewables and lubricants contributions of approximately $450 million, $180 million, $450 million and $500 million, respectively, less $120 million of corporate overhead, produce combined EBITDA of approximately $8.5 billion. Even this case remains below the headline Q3 annualized rate because it does not repeat the estimated SRE reversal.
The bear case carries a 25% probability. It assumes faster product-supply normalization or weaker demand, less favorable crude differentials and produced-product sales of 620,000 barrels per day. At $9 per barrel of margin after operating expenses and approximately $280 million of refining SG&A, refining EBITDA would be approximately $1.76 billion. Adding approximately $380 million of midstream EBITDA, $130 million of marketing, $100 million of renewables and $280 million of lubricants, less $120 million of corporate overhead, produces approximately $2.5 billion of combined EBITDA. This is not a severe trough case; it assumes the businesses remain profitable without current scarcity economics.
The probability-weighted result is approximately $5.5 billion of combined EBITDA. The dispersion is more informative than the midpoint. At 650,000 barrels per day, each $1 change in realized refining margin after operating expenses represents approximately $237 million of annual EBITDA before secondary effects. That sensitivity is larger than many individual organic growth opportunities discussed on the call.
RECOMMENDATION: VALUATION FRAMEWORK, CATALYSTS AND INVALIDATION
The earnings event is fundamentally positive, but the valuation framework must distinguish temporary windfall earnings from sustainable operating improvements. The strongest evidence of durable value creation is better reliability, commercial optimization, branded-channel growth, greater crude-slate flexibility and preservation of balance-sheet capacity. The weakest basis for valuation is capitalization of a single quarter containing a large SRE reversal and exceptional product-market tightness.
A sum-of-the-parts approach is appropriate, provided segment interdependencies and corporate costs are handled consistently. Refining should be valued on normalized margins and capital requirements. Marketing and midstream can merit different valuation treatment where contracts, customer diversification and cash conversion support it. Renewables require explicit regulatory and feedstock sensitivities. Lubricants require standalone earnings and free-cash-flow disclosure rather than reliance on the current segment run rate.
The separation does not create the full value of the lubricants business from nothing. Existing shareholders already own that economic interest. Incremental value must arise from improved operations, lower capital intensity, better capital allocation or a reduced conglomerate discount, net of separation costs, stranded costs and lost synergies.
For scale, a 2-turn multiple uplift applied to $300 million-$350 million of sustainable lubricants EBITDA would represent approximately $600 million-$700 million of incremental enterprise value before those offsets. Spread across Q3’s diluted share count, that equates to approximately $3.4-$4.0 per current share. This is a valuation sensitivity, not a price target or evidence that such a rerating will occur.
The $559 million net cash position provides approximately $3.18 per diluted share of balance-sheet value at the quarter-end share count. Only genuinely distributable surplus cash should be treated as available beyond operating needs, approved growth commitments and separation obligations. Future free cash flow and future repurchases must not be counted again if already reflected in the valuation.
The immediate catalysts are El Dorado restart performance, realization of the additional heavy-crude capability, Q4 processing volumes and fulfillment of the annual 50% payout commitment. These should become visible through Q4 2026 results and early 2027 disclosures. Strong cash returns would validate management’s framework, while a sustained cost overhang or delayed restart would weaken the operating improvement thesis.
Q1 2027 brings the CEO transition, the targeted Westline Connect investment decision and the need for a detailed 2027 capital budget. Project cost, commercial commitments, expected returns and the balance between sustaining and discretionary investment will determine whether retained cash is being deployed at attractive normalized returns.
The principal separation catalysts are the Form 10, standalone financial statements, tax and regulatory progress, capitalization, supply agreements and quantified Mississauga exit economics. Early Q3 operational readiness and second-half 2027 completion remain the most relevant management milestones, but should not be treated as an unconditional closing commitment.
The constructive operating thesis would weaken if refining capture deteriorates after SRE effects are removed, elevated operating costs persist without compensating reliability gains, WCS discounts narrow without offsetting product margins, or renewable profitability falls sharply as credit and feedstock relationships normalize. The separation thesis would weaken if lost manufacturing earnings, stranded expenses and transition costs materially exceed procurement and capital-intensity benefits.
Conversely, a stronger investment conclusion would be supported by durable ex-SRE capture, demonstrable improvement in normalized refinery costs, disciplined completion of the capital-return commitment, attractive fully disclosed Western project economics and standalone lubricants cash generation that substantiates the capital-light model.
The central conclusion is that HF Sinclair generated substantially more underlying earnings and cash than the headline accounting qualification alone would suggest. The quarter improved financial flexibility and near-term earnings visibility. The investment opportunity now depends less on recognizing that Q3 was exceptional and more on determining how much of that exceptional cash generation can be converted into durable per-share value before refining margins normalize.
COMPANY EMPLOYEES ON THE CALL
• Franklin Myers, Chief Executive Officer; continuing executive chair following the CEO transition. • Steve Ledbetter, President and Chief Operating Officer; appointed Chief Executive Officer and President effective January 1, 2027. • Vivek Garg, Acting Chief Financial Officer, Vice President, Chief Accounting Officer and Controller. • Valerie Pompa, President, Growth, Technology and Transformation. • Matthew “Matt” Joyce, Senior Vice President, Lubricants and Specialties. • Craig Biery, Vice President, Investor Relations.
RESEARCH ANALYSTS ON THE CALL
• Neil Mehta, Goldman Sachs. • Manav Gupta, UBS. • Theresa Chen, Barclays. • Doug Leggate, Wolfe Research. • Phillip Jungwirth, BMO. • Matthew Blair, TPH. • John Royall, Piper Sandler. • Jason Gabelman, TD Cowen.
Key Read-Throughs
KEY READ-THROUGHS FROM HF SINCLAIR’S Q3 2026 EARNINGS CALL
HF Sinclair’s results indicate a redistribution of earnings across the energy value chain rather than a broad-based demand acceleration. Scarce refining capacity and constrained product availability are supporting downstream margins, while widening Canadian heavy-crude discounts transfer additional value from upstream producers to capable refiners. The strongest cross-sector implications are favorable for complex refiners, selected renewable-fuel producers and Western logistics owners; adverse for unintegrated heavy-oil producers and fuel-consuming airlines; and increasingly challenging for the long-duration scarcity value of California refining assets. The critical distinctions are between accounting gains and cash generation, temporary scarcity and sustainable competitive advantage, and project-level benefits versus materiality to a listed parent. Impact assessments below describe earnings exposure, not predicted share-price movements. Management’s expectation of incomplete global refining recovery until 2028 remains a forecast, not an established endpoint for elevated margins.
CANADIAN OIL PRODUCTION AND COMPLEX REFINING
WIDER WCS DISCOUNTS FAVOR REFINERS OVER UNINTEGRATED HEAVY-OIL PRODUCERS (READ-THROUGH 1)
Affected companies: Athabasca Oil Corporation (ATH: Canada), materially negative; Canadian Natural Resources (CNQ: Canada), moderately negative through its non-upgraded heavy-oil exposure; Cenovus Energy (CVE: Canada) and Suncor Energy (SU: Canada), comparatively better insulated, although not necessarily net beneficiaries.
Supporting evidence: Ledbetter stated that Canadian production is “outpacing egress” and cited WCS differentials “anywhere north of $25 up into $30.” Although management expects some moderation, it anticipates differentials remaining wider through at least 2027. HF Sinclair also expects its El Dorado furnace project to enable processing of up to an additional 10,000 barrels per day of heavy crude.
The transmission mechanism is a direct transfer of margin from producers selling discounted heavy barrels to refiners capable of converting them into valuable products. Holding benchmark crude prices constant, a wider WCS discount lowers producer realizations and operating netbacks. Refiners with suitable conversion capacity benefit from cheaper feedstock, particularly when finished-product margins remain elevated. Consequently, a bullish view on petroleum products does not imply an equally bullish view on Canadian bitumen producers.
Athabasca is the clearest concentrated negative exposure. Its September 2026 presentation assumed a US$12.50-per-barrel WCS differential for 2027 onward, substantially narrower than the spot conditions described by HF Sinclair. Its thermal production is bitumen, without an offsetting refining business. The same presentation disclosed approximately C$24 million of 2027 adjusted funds-flow sensitivity to a US$1 change in WCS prices. Holding WTI and other assumptions constant, a US$5 wider differential would therefore imply approximately C$120 million of adverse annual funds-flow sensitivity around that planning case. This is a local sensitivity, not a forecast; royalties, production, blending economics and other nonlinearities affect larger changes.
The discrepancy between Athabasca’s planning assumptions and HF Sinclair’s medium-term differential commentary is more actionable than the observation that WCS is currently weak. It creates a specific risk to cash-flow expectations embedded in growth and capital-return plans. Athabasca’s September presentation also described 2027 onward as unhedged, increasing the relevance of differential assumptions, subject to subsequent changes in its hedge book.
Canadian Natural Resources has substantial heavy-oil exposure but a more diversified production portfolio, including synthetic crude and natural gas. Its consolidated impact should therefore be less concentrated than Athabasca’s. Cenovus and Suncor possess refining and upgrading operations that can offset part of the upstream pressure. Those offsets are not complete: the degree of protection depends on downstream availability, actual crude slates, internal transfers and the relationship between synthetic-crude prices and bitumen discounts.
Near-term trading catalysts are Canadian producer realizations, differential-sensitive cash-flow revisions and disclosure of hedging or transportation protection. The longer-duration issue is whether production growth continues to exceed effective market access through 2027. A normalization in freight, additional export capacity or stronger heavy-crude demand would weaken the negative upstream read-through. Stronger outright crude prices could also offset the earnings effect without eliminating the relative advantage of downstream integration.
REFINING MARGINS REMAIN STRONG AFTER SRE NORMALIZATION, BUT THE ACCOUNTING WINDFALL DOES NOT TRANSFER AUTOMATICALLY TO PEERS (READ-THROUGH 2)
Affected companies: Valero Energy (VLO: United States), strongly positive operating read-through; Marathon Petroleum (MPC: United States), moderately to strongly positive; Phillips 66 (PSX: United States), moderately positive at the consolidated level.
Supporting evidence: HF Sinclair generated approximately $2.6 billion of refining adjusted EBITDA despite crude charge declining to approximately 614,000 barrels per day from 639,000 a year earlier. Ledbetter stated, “If you strip out SRE, our capture was right at 105%.” Analysts cited approximately $500 million-$600 million of exemption-related benefits, while management confirmed that the benefit arose through expense reversals rather than immediate RIN monetization.
The strongest positive implication is that underlying refining profitability remains exceptional even after removing the analyst-estimated SRE benefit. Using the earnings release’s $2.582 billion of refining EBITDA, the resulting sensitivity is approximately $1.982 billion-$2.082 billion, compared with $661 million a year earlier. Lower processing volumes did not prevent a substantial increase in underlying earnings. This supports a positive read-through to peers with reliable operating assets, favorable crude access and exposure to the affected product markets.
Valero is a particularly direct beneficiary of strong refining margins and complex conversion capacity. Marathon Petroleum benefits through its large refining system, although its midstream exposure dilutes consolidated sensitivity. Phillips 66 similarly benefits in refining, but its broader mix of midstream, chemicals and other operations makes a given refining-margin change less concentrated at the group level.
The mechanism is higher realized product revenue relative to crude and conversion costs, supplemented where applicable by discounted heavy-feedstock access. At a hypothetical 1 million barrels per day of exposed sales, a sustained $1-per-barrel improvement in realized margin represents approximately $365 million of annual pretax operating contribution before secondary effects. This illustrates materiality rather than predicting any company’s actual margin improvement.
The important negative qualification concerns extrapolation of HF Sinclair’s headline earnings beat. Garg stated, “While you see the benefit come through in earnings, you will actually not see any of that benefit come through cash flow statement.” Exemption eligibility, covered compliance years, prior accruals and RIN inventory positions differ across refiners. HF Sinclair’s estimated benefit cannot be applied to competitors on a capacity-proportional basis.
Nor does 105% capture establish that competitors will achieve equivalent capture. Regional product prices, refinery configuration, crude sourcing, maintenance and marketing arrangements remain company-specific. HF Sinclair’s result supports the industry margin backdrop, not a mechanically identical peer earnings surprise.
Near-term catalysts are Q4 realized cracks, operating availability and peer explanations of earnings-to-cash conversion. Where peers have already reported Q3, HF Sinclair provides corroboration rather than new advance evidence of their reported results. The longer-duration implication is favorable only while product scarcity persists. Ledbetter explicitly acknowledged, “This margin environment we are enjoying currently will come back to normal.” Product margins can decline before all damaged global refining capacity has been restored, making a permanent capitalization of current earnings inappropriate.
MIDSTREAM INFRASTRUCTURE AND WESTERN FUEL MARKETS
WESTERN GATEWAY CREATES CONTRACTED EARNINGS AND MARKET ACCESS, WITH DIFFERENT BENEFITS FOR KINDER MORGAN AND PHILLIPS 66 (READ-THROUGH 3)
Affected companies: Kinder Morgan (KMI: United States), moderately positive over the project-development horizon; Phillips 66 (PSX: United States), moderately positive, with additional refining and marketing benefits beyond pipeline earnings.
Supporting evidence: HF Sinclair characterized Western Gateway as complementary to Westline Connect, emphasized the value of connecting El Dorado, Tulsa and Artesia to Southwest markets, and stated that its commitments would be funded with cash and operating cash flow. Ledbetter explained that equity participation “somewhat backstops our placement” while expanding more stable cash-flow businesses.
The direct supplier and partner relationship is established by the August 11 Western Gateway announcement. Phillips 66, Kinder Morgan and HF Sinclair own 49.9%, 35.1% and 15%, respectively. The proposed system has 230,000 barrels per day of design capacity, is supported primarily by 10-year take-or-pay contracts and targets completion in 2029. These were previously announced terms, not new disclosures on the earnings call.
For Kinder Morgan, the mechanism is incremental contracted transportation earnings and improved use of an existing Western products network. The company is contributing its SFPP East and West Line assets, with the West Line intended to reverse direction toward California. This provides a way to reposition infrastructure as Western fuel-supply patterns change, rather than remaining dependent on historical flows from California toward Arizona.
The valuation distinction is important. Kinder Morgan’s contributed assets were assigned approximately $1.5 billion of value, supplemented by approximately $250 million of cash contributions. Existing earnings from those assets are not entirely new project earnings. The relevant benefit is incremental cash flow above the contributed business, adjusted for ownership, funding and execution risk. Treating the project’s full future earnings as wholly additive would overstate the benefit.
Phillips 66 has a broader transmission mechanism. In addition to pipeline ownership, the project connects its Central Corridor and Gulf Coast refining assets to Southwest and Western marketing markets. That can improve refinery netbacks, support branded distribution and provide an outlet for barrels that otherwise compete in more heavily supplied regions. Its approximately $2.5 billion cash commitment is also substantially larger, so the opportunity carries greater capital-deployment exposure.
HF Sinclair’s call reinforces sponsor commitment and the commercial rationale, but it does not establish a new immediate earnings contribution. Its decision to hold cash for organic projects reduces financing concerns at the partner level, while the emphasis on integrated value supports the durability of the intended supply arrangement.
Near-term catalysts are permits, construction progress, capital-spending schedules and evidence that contractual economics remain intact. The fundamental earnings shift is principally a 2029-and-beyond event. Westline Connect’s delayed Q1 2027 investment decision should not be confused with Western Gateway, which had already reached final investment decision. They are distinct projects with different capacities, ownership and development status.
CALIFORNIA REFINERS BENEFIT FROM CURRENT SCARCITY BUT FACE A LONGER-TERM EROSION OF REGIONAL PRICING POWER (READ-THROUGH 4)
Affected companies: PBF Energy (PBF: United States), strongly positive near-term market exposure but a potentially material negative longer-duration competitive read-through; Marathon Petroleum (MPC: United States), a similar but less concentrated effect at the consolidated level.
Supporting evidence: Ledbetter linked the Western expansion strategy to “recent refinery closures and the cost to operate” in California, adding that the combination of Western Gateway and Westline Connect should be competitive in supplying Western markets. Westline Connect’s initial phase would add approximately 35,000 barrels per day of movement from Rockies production into Utah and Nevada, with service targeted for 2029.
The non-consensus distinction is between the value of a near-term product shortage and the durability of the infrastructure barriers that support it. California refinery closures increase the scarcity value of remaining production today. Over time, those same closures attract investment that brings outside supply into the region and reduces incumbent refiners’ geographic protection.
PBF has substantial direct exposure through Torrance and Martinez. Its published refinery descriptions identify 166,000 barrels per day of capacity at Torrance and 157,000 at Martinez. Torrance is particularly relevant to Southern California competition, while Martinez provides Northern California exposure. Marathon’s Los Angeles refining operations face a related competitive mechanism, although the effect is more diluted across its larger portfolio.
The potential negative transmission occurs through delivered-product competition. Inland refiners gain an outlet into high-price Western markets, while California producers face a more competitive supply alternative to local production and marine imports. Western Gateway can also reduce Arizona’s reliance on California-origin barrels, potentially changing the economics of an important outlet for California refineries.
The result need not be an absolute decline in Western product demand. A change in the marginal supply source can compress regional pricing premiums even if fuel consumption remains stable. That makes the development relevant to terminal-value assumptions and long-dated earnings expectations, not only to quarterly volume forecasts.
This is not an immediate bearish earnings signal for PBF or Marathon. Until new infrastructure is operational, the call’s evidence points toward continued support from product scarcity. Existing refinery reliability and local operating constraints can dominate near-term performance. In addition, fuel specifications, permitting, transport costs and product compatibility constrain how much nominal pipeline capacity becomes directly competitive California supply.
The near-term catalyst is continued realization of strong regional margins. The longer-duration negative catalyst is successful construction and commissioning around 2029, followed by demonstrated delivery of competitive barrels. Further local closures or stronger-than-expected demand could absorb the new supply and limit premium compression. The high-conviction conclusion is that permanent scarcity should not be assumed merely because current refining capacity is being retired.
RENEWABLE FUELS AND FEEDSTOCKS
RENEWABLE-DIESEL PROFITABILITY SUPPORTS DARLING, BUT FEEDSTOCK AND MARKET ACCESS MATTER MORE THAN MAXIMUM UTILIZATION (READ-THROUGH 5)
Affected companies: Darling Ingredients (DAR: United States), moderately to strongly positive through Diamond Green Diesel and its integrated feedstock position; Valero Energy (VLO: United States), positive but smaller in consolidated importance than its conventional refining exposure.
Supporting evidence: HF Sinclair reported $109 million of renewables adjusted EBITDA on approximately 63 million gallons of sales, compared with a $13 million loss a year earlier. The $30 million inventory-valuation benefit was excluded from adjusted EBITDA. Management emphasized direct feedstock procurement, proximity-based sourcing, flat operating costs and placement of more than 50% of sales outside California. Ledbetter described the economically attractive utilization range as “north of 70%,” rather than maximum nameplate operation.
The favorable industry read-through is that renewable diesel can generate substantial operating profit without full utilization when producers optimize feedstock costs, product destinations and regulatory value. HF Sinclair’s result therefore supports a margin-led recovery rather than a thesis dependent on indiscriminate volume growth.
Darling has a direct earnings connection through its 50% ownership of Diamond Green Diesel, with Valero owning the other 50%. Its feedstock collection and processing operations also provide exposure across the supply chain. The transmission is higher renewable-fuel realizations and credits relative to feedstock and conversion costs, supported where available by advantaged sourcing and logistics.
This conclusion is corroborated by Darling’s October 22 disclosure, which had already reported Diamond Green Diesel’s Q3 volumes of 314.9 million gallons and approximately $204.2 million of adjusted EBITDA attributable to Darling after discount and broker fees. Darling also stated that commercial timing differences were expected to benefit Q4. HF Sinclair’s favorable Q4 commentary provides independent support for the operating environment, but the DGD result was already public and should not be presented as a newly discovered Q3 surprise.
The economic sensitivity is meaningful. At DGD’s reported Q3 volume, a $0.10-per-gallon change in net EBITDA margin would change quarterly joint-venture EBITDA by approximately $31.5 million and Darling’s 50% share by approximately $15.7 million, before other adjustments. Actual sensitivity depends on product mix, feedstock contracts, credit recognition and commercial timing.
The key limitation is that HF Sinclair’s profitability cannot be transferred directly to DGD on a per-gallon basis. The companies differ in procurement, geography, product mix, accounting and regulatory qualification. HF Sinclair’s renewables EBITDA also declined from $123 million in Q2 despite higher volumes, so the call does not establish uninterrupted sequential margin expansion.
Higher RIN prices benefit renewable-fuel economics, but SRE awards do not automatically reinforce that benefit. Exemptions can reduce compliance demand, while reallocation rules and future standards may offset that effect. The simultaneous strength in HF Sinclair’s refining and renewables segments should not be interpreted as proof that every regulatory outcome is favorable to both.
The immediate trading catalyst is Darling’s scheduled October 28 earnings release and October 29 call, particularly Q4 margin expectations, commercial timing and cash distributions from DGD. The longer-duration favorable shift is the value of integrated sourcing and diversified product placement. Durable profitability depends more on those capabilities and policy economics than on a simple return to maximum industry utilization.
LUBRICANTS AND BASE OILS
MISSISSAUGA’S RETIREMENT TRANSFERS MANUFACTURING DEMAND TO NAMED SUPPLIERS WITHOUT REMOVING THE FINISHED-LUBRICANT CUSTOMER BASE (READ-THROUGH 6)
Affected companies: SK Innovation (096770: South Korea), positive for its lubricants operations but less material at the diversified parent; Chevron (CVX: United States), positive for base-oil volumes and distribution reach, with low consolidated earnings materiality.
Supporting evidence: HF Sinclair confirmed progress toward retiring Mississauga’s refining assets and separating lubricants during 2027. Matt Joyce stated, “We’re not going to be manufacturing base oils any longer, but we’re not walking away from the market.” He also described tighter Group II and Group III markets and strong performance in finished lubricants and specialties.
The direct commercial relationships are supported by the previously announced supply agreements. Chevron Products Company will supply Group II base oils, while SK Enmove, operating within SK On under listed parent SK Innovation, will supply Group III base oils. HF Sinclair’s lubricants business will also distribute Chevron-branded Group II products in Canada and selected U.S. regions and YUBASE Group III products in selected North American markets.
The transmission mechanism is more specific than a generic benefit from another refinery closure. A manufacturer is becoming a purchaser and distributor while retaining finished-product brands, customer relationships, blending operations and market access. The suppliers can therefore gain replacement supply demand and distribution access without needing to recreate HF Sinclair’s downstream customer franchise.
This is a favorable read-through for the supplying businesses, particularly if existing capacity can serve the incremental contracts without substantial new capital. Long-term commercial arrangements can also provide greater volume visibility than relying entirely on spot-market sales. Contracted volume and margin details were not disclosed, so incremental earnings cannot be quantified from the call.
The timing creates an additional industry implication. Mississauga’s retirement is expected during a period in which management believes global base-oil supply remains constrained. Removing domestic production before a full international supply recovery can increase North American dependence on replacement suppliers and imports. The effect is likely to be more durable than the quarter’s $22 million FIFO benefit, which does not represent a permanent improvement in demand.
The distinction between business-level and equity-level materiality is essential. Even a meaningful base-oil contract is unlikely to materially change Chevron’s consolidated earnings outlook. SK Innovation’s lubricants business is more relevant to its operating mix, but the parent’s broader refining, energy and battery exposures can dominate valuation. This is therefore a high-conviction supplier-level positive, not a stand-alone basis for a strong parent-company stock recommendation.
The near-term catalyst is evidence that transition volumes, distribution arrangements and customer qualifications are progressing. The longer-duration shift occurs as Mississauga exits manufacturing during 2027 and replacement supply becomes established. Existing global spare capacity, pricing concessions, logistics costs or reduced lubricant demand could limit the benefit. The retirement supports supplier opportunity, but does not establish a permanent shortage or unrestricted pricing power.
AIRLINES AND FUEL-CONSUMING TRANSPORT
PRODUCT SCARCITY IS AN AIRLINE COST HEADWIND EVEN IF CRUDE AVAILABILITY IMPROVES; DELTA HAS A PARTIAL INTERNAL OFFSET (READ-THROUGH 7)
Affected companies: American Airlines Group (AAL: United States) and United Airlines Holdings (UAL: United States), materially negative gross fuel-cost exposure; Delta Air Lines (DAL: United States), negative fuel-cost exposure but relatively better insulated by its refinery business.
Supporting evidence: HF Sinclair described the disruption as “mainly a distillate story,” cited approximately 4 million barrels per day of refining production offline and distinguished modest improvement in crude transit from continuing limitations on refining capacity. Management also stated that the underlying product tightness was unlikely to resolve quickly.
The mechanism is a higher price for refined fuel relative to crude, not necessarily a further increase in the oil benchmark itself. Jet fuel competes within the middle-distillate production system and is exposed to refinery availability, product inventories and regional logistics. Improved crude flows can therefore coexist with elevated jet-fuel prices and refining premiums.
American and United are large net consumers of jet fuel without an owned refinery providing an equivalent internal offset. Higher fuel costs reduce operating margins unless recovered through fares, ancillary revenue, capacity changes or other savings. Ticket prices and fuel costs do not reset on identical schedules, creating earnings exposure even when the industry ultimately passes through part of the increase.
For scale, a $5-per-barrel increase in the jet-fuel premium over crude equates to approximately $0.119 per gallon. For each 1 billion gallons consumed, that represents approximately $119 million of additional fuel expense before hedging, pricing recovery and changes in activity. The magnitude is material relative to airline operating profits, although the call alone does not establish how much of the cost is incremental to existing airline guidance.
Delta provides the important relative-value distinction. Its Trainer refinery can capture some of the refining margin that the airline otherwise pays through jet-fuel purchases. This offsets part of the industry cost shock, but does not turn Delta into a net beneficiary of expensive fuel. Refinery operating costs, maintenance, compliance expenses and differences between refinery output and airline consumption prevent a complete hedge.
Delta’s already published October 9 results illustrate the mechanism. The company reported a Q3 refinery benefit of $0.13 per gallon and assumed approximately $0.40 per gallon in its Q4 outlook, while still projecting an approximately $4.25 all-in fuel price based on the stated forward curve. HF Sinclair’s call reinforces the economic rationale for that offset rather than creating a new forecast for Delta’s results.
The high-conviction relative conclusion is that refining scarcity is more damaging to an otherwise comparable airline without an internal refining offset. It does not establish a complete ranking of airline equities because premium demand, international exposure, labor costs, balance sheets and capacity discipline can outweigh the fuel difference.
Near-term catalysts are jet-fuel differentials, airline fuel guidance and evidence of fare recovery during Q4 2026 and early 2027. The longer-duration pressure depends on the persistence of refining constraints, not simply the crude-price trajectory. A recovery in refining output or sustained fare increases would reduce the negative earnings effect. The call does not justify applying the same magnitude of downside to every transport company: fuel-surcharge arrangements and pass-through mechanisms differ materially across airlines, trucking and rail.
Report record
- Sector
- Energy
- Industry
- Oil & Gas Refining & Marketing
- Fiscal period end
- September 30, 2026
- Report date
- October 28, 2026
- Analysis
- 6986 words
- Read-throughs
- 3577 words
- Content fingerprint (PDF)
68a05deb7aab- Content fingerprint (analysis)
4b4116a59df4- Content fingerprint (read-throughs)
fe33d2c35da6
Prepared from the company's earnings release and earnings call transcript. Figures as reported by the company. For information only. Not investment advice.
More from HF Sinclair Corporation
No other reports yet.
All HF Sinclair Corporation reports
More in Energy
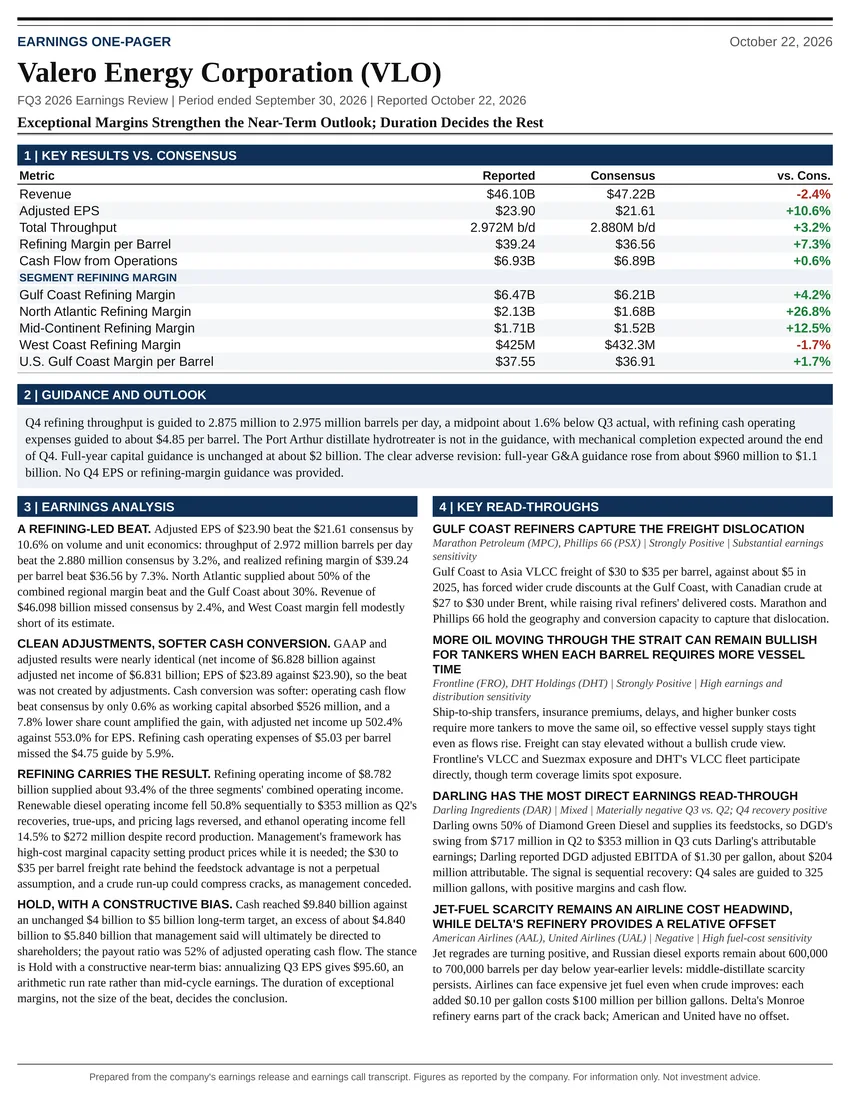
Exceptional Margins Strengthen the Near-Term Outlook; Duration Decides the Rest
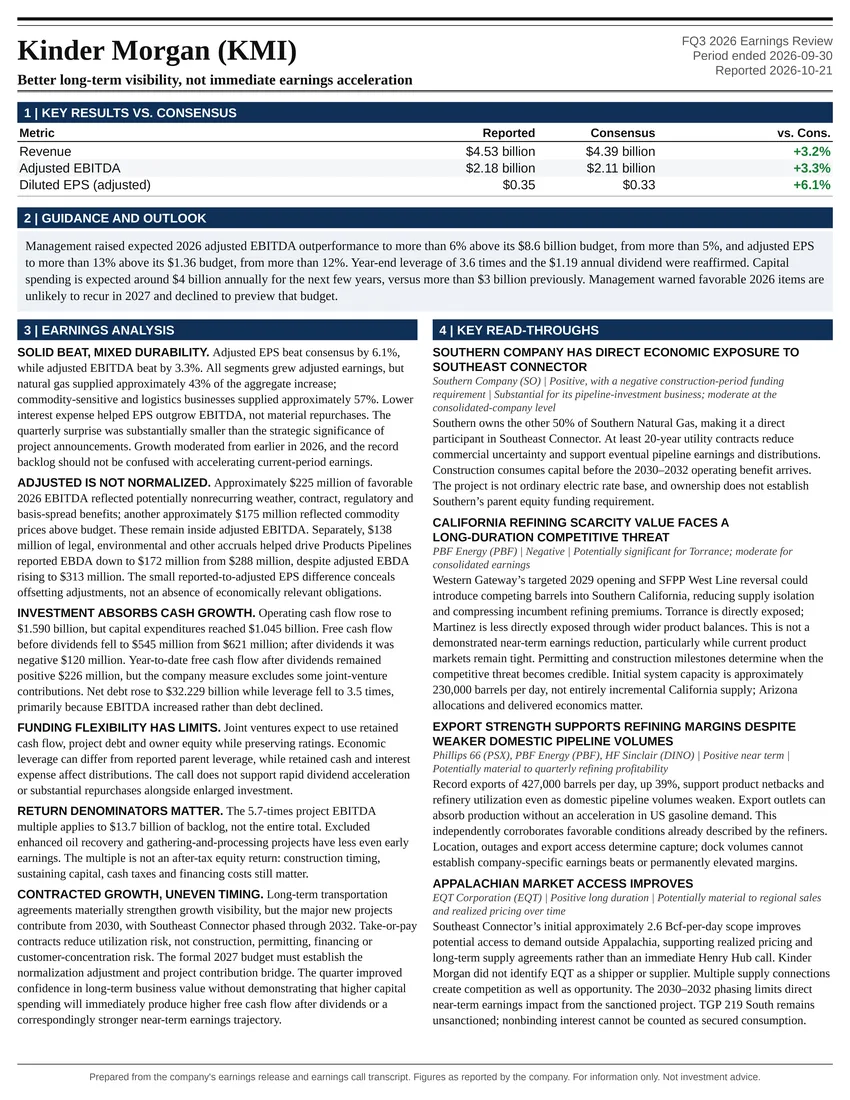
Better long-term visibility, not immediate earnings acceleration
Follow @AtlasPeakRes on X for new earnings reports as they publish.