An Internationally Led Recovery, Not Yet an Earnings Recovery
Earnings Reports
Valero Energy Corporation FQ3 2026 Earnings Report
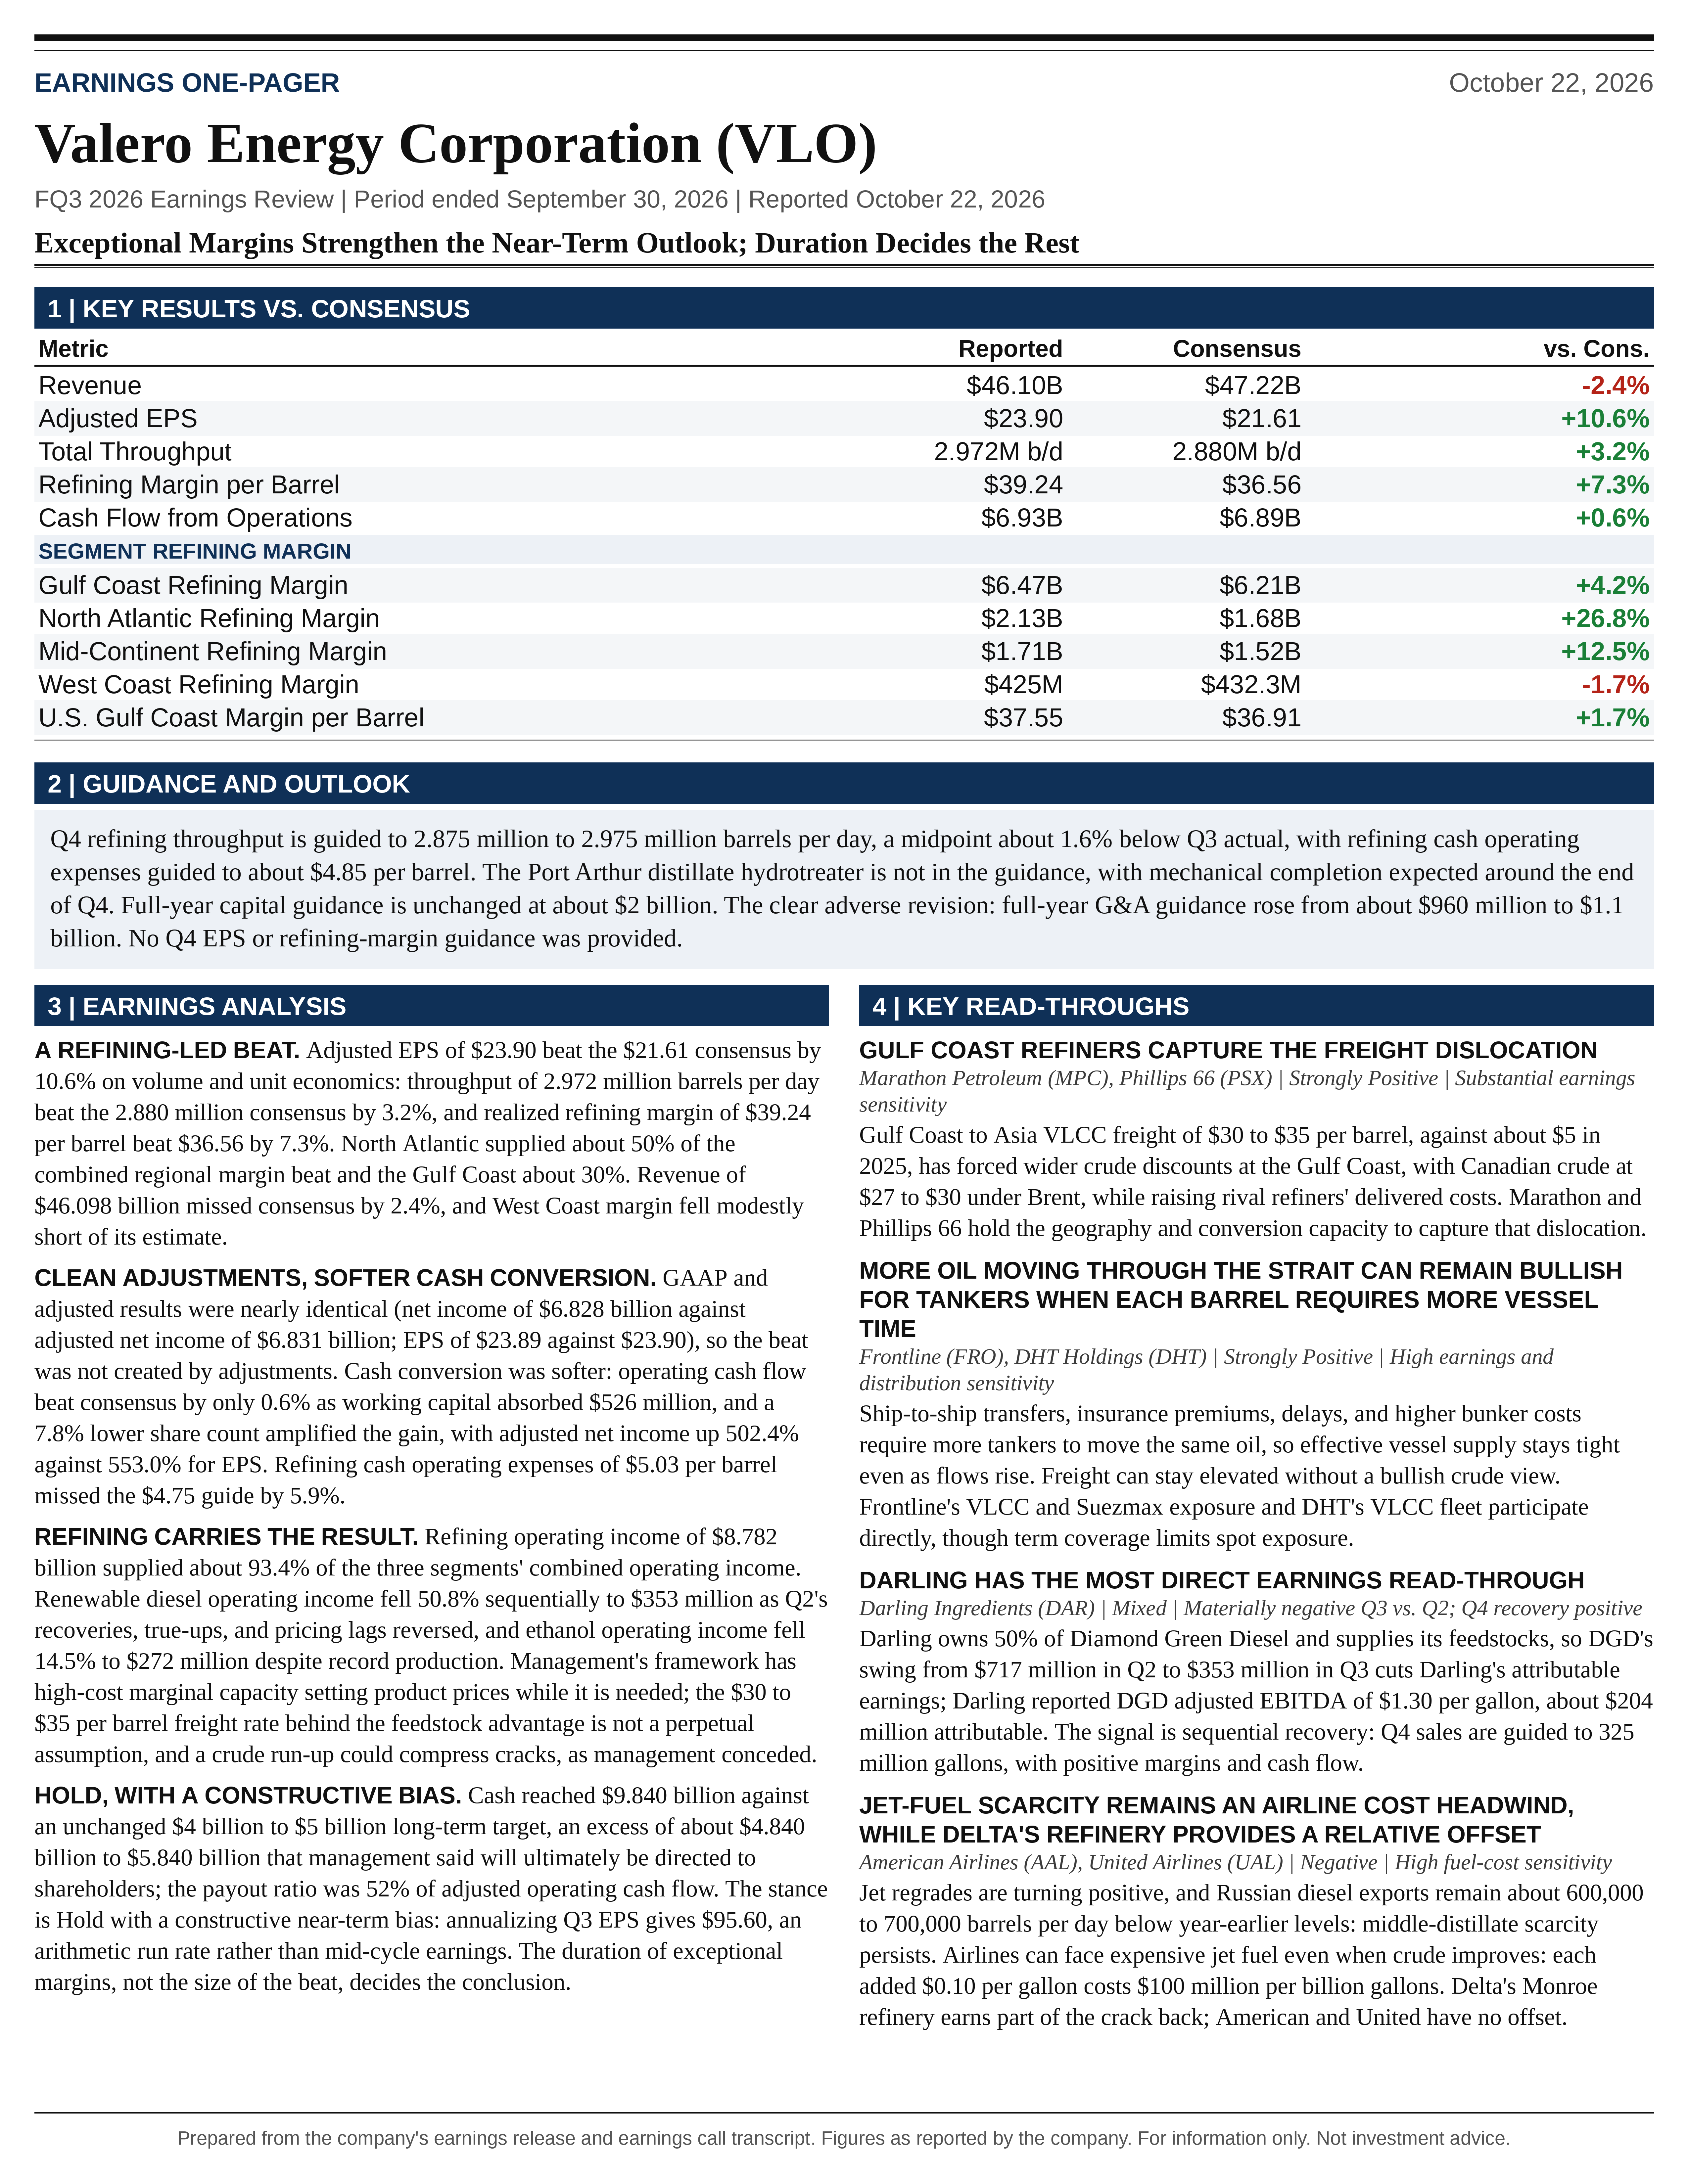
Valero Energy Corporation (VLO) FQ3 2026 earnings: Exceptional Margins Strengthen the Near-Term Outlook; Duration Decides the Rest. Full earnings analysis, key read-throughs, and the one-page exhibit from Atlas Peak Research.
Valero Energy Corporation (VLO)
Sector: Energy · FQ3 2026 · Period end September 30, 2026 · Reported October 22, 2026
Valero’s Q3 2026 results materially strengthen the near-term earnings outlook, but the investment conclusion depends more on the duration of exceptional refining margins than on the size of the reported earnings beat.
Download the one-page report (PDF)
View one-page exhibit
Download analysis (.md)
Download read-throughs (.md)
Post to X
One-Page Exhibit
Earnings Analysis
EXECUTIVE CALL SUMMARY: Valero Energy Corporation (10/22/26)
Valero’s Q3 2026 results materially strengthen the near-term earnings outlook, but the investment conclusion depends more on the duration of exceptional refining margins than on the size of the reported earnings beat. Adjusted EPS of $23.90 exceeded the supplied Bloomberg consensus of $21.61 by 10.6%, increased 553.0% from $3.66 in Q3 2025, and rose 90.6% from $12.54 in Q2 2026. The result reflects extraordinary refining profitability, throughput above prior guidance, and substantial operating leverage. It does not establish that the current earnings run rate represents sustainable mid-cycle profitability. The appropriate fundamental stance is Hold with a constructive near-term earnings bias, rather than an unconditional Buy based on annualizing the quarter.
The most important message from the call is that Valero is benefiting from a favorable separation between crude availability and product availability. Management sees a sufficiently supplied crude market, but constrained refining capacity, tight product inventories, and costly international transportation. Elevated tanker freight depresses export-parity crude prices on the U.S. Gulf Coast while increasing the delivered costs of competing international refiners. Valero’s complex Gulf Coast system can therefore acquire advantaged feedstocks while selling products into markets priced by materially higher-cost suppliers. This mechanism is more specific, and more economically important, than a generalized bullish view on oil prices.
The quarter also contained meaningful qualifications. Refining cash operating expenses exceeded prior guidance, full-year G&A guidance increased 14.6%, renewable diesel operating income declined 50.8% sequentially, and ethanol operating income declined 14.5% despite record production. Operating cash flow exceeded consensus by only 0.6%, substantially less than the EPS beat. These factors do not undermine the strength of the result, but they demonstrate that the quarter was not uniformly ahead of expectations across costs, cash conversion, and business segments.
Q4 operating guidance is supportive, although aggregate refining throughput is expected to decline modestly from Q3. Management highlighted favorable heavy-crude discounts, winter butane blending, Arctic diesel premiums, and improving jet regrades as capture-rate tailwinds. However, the Port Arthur distillate hydrotreater is not contributing to the Q4 guidance, and management did not provide an EPS forecast or a quantitative refining-margin forecast. The principal negative guidance revision was the increase in 2026 G&A from approximately $960 million to $1.1 billion.
Capital allocation remains an important support for equity value. Cash reached $9.840 billion, compared with the unchanged $4 billion to $5 billion long-term target. This represents approximately $4.840 billion to $5.840 billion above the target range, or approximately $17.00 to $20.50 per Q3 diluted weighted-average share. Management explicitly stated that excess cash will ultimately be directed toward shareholders. The timing remains discretionary, however, and the current 52% payout ratio is not a commitment to distribute all incremental free cash flow immediately.
OBSERVATION: EARNINGS QUALITY AND THE CONSENSUS BEAT
The earnings release reports adjusted net income attributable to Valero of $6.831 billion, compared with $1.134 billion in Q3 2025. GAAP net income was $6.828 billion, leaving only a $3 million difference between reported and adjusted earnings. The near-equivalence of GAAP and adjusted EPS, $23.89 and $23.90, respectively, confirms that the exceptional result was not created by large headline adjustments. Nevertheless, a small GAAP-to-adjusted reconciliation does not mean that all recognized profits are economically recurring. Commodity dislocations, feedstock-pricing lags, tax-credit capture, and temporary logistics advantages remain embedded in operating results.
Adjusted net income increased 502.4% year over year, less than the 553.0% increase in adjusted EPS. Rounded diluted weighted-average shares declined from 309 million to 285 million, a reduction of 7.8%. Share-count contraction therefore amplified the earnings improvement, although the overwhelming driver was the expansion in operating profit rather than financial engineering.
Revenue was $46.098 billion, up 43.3% year over year but 2.4% below the supplied Bloomberg consensus of $47.220 billion. The revenue shortfall is not inconsistent with the earnings beat. Refining profitability depends on product realization relative to delivered feedstock costs, operating expenses, and yields, rather than on revenue in isolation. Lower feedstock costs can reduce revenue-linked commodity values while expanding margin. The available disclosures do not provide a complete price-volume reconciliation of the revenue miss, so its precise cause cannot be established.
The Bloomberg notice shows throughput of 2.972 million barrels per day against consensus of 2.880 million, a 3.2% beat. Realized refining margin was $39.24 per barrel against $36.56 expected, a 7.3% beat. Both volume and unit economics therefore contributed positively. Applying the $2.68 per barrel margin outperformance to actual quarterly throughput produces an illustrative $733 million gross-margin benefit. This is not a complete EPS bridge because operating costs, regional mix, taxes, noncontrolling interests, and differences between separately averaged consensus estimates must also be incorporated.
The geographic distribution of the beat is particularly informative. Gulf Coast refining margin was $6.472 billion versus $6.210 billion expected, a $262 million positive variance. North Atlantic refining margin was $2.127 billion versus $1.680 billion expected, a $447 million positive variance. Mid-Continent refining margin was $1.706 billion versus $1.520 billion expected, a $186 million positive variance. West Coast refining margin was $425 million versus $432.3 million expected, a modest shortfall.
The North Atlantic accounted for approximately 50% of the combined regional refining-margin beat, while the Gulf Coast accounted for approximately 30%. The call’s emphasis on Gulf Coast crude advantages should therefore not obscure the importance of North Atlantic product-market strength to the actual earnings surprise. Gulf Coast realized margin per barrel exceeded consensus by only approximately 1.7%, materially less than the systemwide margin beat.
Consensus comparisons here use the supplied Bloomberg notice consistently. Other published earnings summaries show different consensus estimates, including materially different revenue expectations, and should not be mixed into the same earnings bridge.
OBSERVATION: REFINING PERFORMANCE AND HISTORICAL COMPARABILITY
Refining operating income was $8.782 billion, compared with $1.610 billion a year earlier. Adjusted refining operating income increased from $1.665 billion to $8.774 billion, a 427.0% increase. Refining contributed approximately 93.4% of the combined operating income of the 3 operating segments before corporate costs. Despite the improvement in renewable fuels relative to 2025, Valero’s current earnings sensitivity remains overwhelmingly concentrated in petroleum refining.
Total refining margin increased from $3.731 billion to $10.730 billion. Realized margin per throughput barrel increased from $13.14 to $39.24, or 198.6%. Adjusted operating income per barrel increased from $5.86 to $32.09. The much greater percentage increase in operating profit than in gross margin reflects the operating leverage of a largely fixed-cost asset base.
The year-over-year throughput decline requires adjustment for the changed asset footprint. Total throughput fell 3.7%, from 3.087 million to 2.972 million barrels per day. West Coast throughput, however, declined from 259,000 to 119,000 barrels per day following Benicia’s cessation of refining operations. Excluding the West Coast, throughput increased approximately 0.9%. The headline volume decline therefore does not indicate deteriorating utilization across the continuing system.
The Q3 volume result also exceeded management’s own guidance. The regional guidance issued on the Q2 call summed to 2.800 million to 2.900 million barrels per day, with a midpoint of 2.850 million. Actual throughput exceeded the midpoint by 122,000 barrels per day and the upper end by 72,000 barrels per day. Gulf Coast throughput of 1.874 million barrels per day exceeded its prior upper guide of 1.830 million, while North Atlantic throughput of 507,000 barrels per day exceeded its prior upper guide of 470,000. Execution and asset availability were therefore material contributors, not merely favorable commodity prices.
Cost performance was less favorable. Refining cash operating expenses were $5.03 per barrel, compared with prior Q3 guidance of $4.75, Q2 actual expenses of $4.70, and Q3 2025 adjusted expenses of $4.71. The variance against guidance was 5.9%, equivalent to approximately $77 million at actual throughput. Since throughput was above guidance, weaker fixed-cost absorption alone cannot explain the miss. The call did not provide a quantified explanation sufficient to distinguish energy, maintenance, labor, or other operating-cost effects.
Accounting comparability also matters. Refining depreciation and amortization declined from $728 million to $580 million year over year. The prior-year quarter included approximately $100 million of incremental Benicia depreciation. West Coast adjusted operating income improved from approximately breakeven to $305 million, but that improvement combines stronger margins with a smaller operating footprint and substantially lower depreciation. It should not be interpreted as a clean same-asset profitability comparison.
Benicia decommissioning and redevelopment activities have been reported in Corporate and Other since Q2 2026. Consequently, the disappearance of Benicia from West Coast refining results does not imply that all associated corporate cash costs or obligations have disappeared.
IMPLICATION: FREIGHT IS CREATING A REGIONAL MARGIN ADVANTAGE
Randy Hawkins identified freight as the central crude-market dislocation: “the cost to move a VLCC from the Gulf Coast to Asia is now averaging around $30 to $35 per barrel,” compared with approximately $5 per barrel in 2025. This represents a 6x to 7x increase. Management attributed the pressure to ship-to-ship transfers, insurance premiums, transshipment delays, and higher bunker costs.
The economic transmission is straightforward. Gulf Coast crude must compete for export demand. When the cost of delivering that crude to Asia rises sharply, the Gulf Coast purchase price must adjust downward relative to destination pricing to preserve the export arbitrage. Domestic refiners located close to the crude supply can capture part of that discount without paying the same long-haul transportation cost. This advantage can arise even when benchmark crude prices remain elevated.
The same mechanism affects Latin American heavy crude. Gulf Coast refiners have a shorter transportation route than Asian buyers, while Latin American sellers must price against the economics of alternative destinations. Valero’s ability to switch among Canadian, Venezuelan, and other heavy-sour grades increases its bargaining and optimization flexibility.
The advantage is not uniform across Valero’s system. Management acknowledged greater freight exposure at Pembroke and on the West Coast, with more limited exposure at Quebec City because much of its crude arrives by pipeline. Time-chartered vessels buffer some exposure to spot freight, but the call did not disclose charter coverage, expiry dates, or the proportion of transportation costs protected. A quantified hedge benefit cannot therefore be inferred.
Product exports introduce another distinction. Higher freight can improve Valero’s relative competitiveness in Latin America, where Gulf Coast barrels compete with longer-haul European supply. For diesel exported to Europe, higher freight can temporarily close the arbitrage and reduce export netbacks until European prices adjust. Management’s expectation that Europe will raise prices sufficiently to attract required barrels is plausible in a structurally short market, but it is not equivalent to immediate or complete contractual freight pass-through.
This creates an important distinction between structural advantage and temporary windfall. Gulf Coast access to domestic crude, pipelines, complex conversion capacity, and low-cost energy is durable. A $30 to $35 per barrel Gulf Coast-to-Asia freight rate is not a prudent perpetual assumption. Normalization of shipping efficiency could narrow crude discounts and improve the competitiveness of overseas refiners simultaneously.
The potential reversal therefore operates through both sides of the refining margin: higher relative feedstock costs for Valero and lower marginal delivered product costs from competitors. This is a more consequential normalization risk than a simple decline in tanker rates considered in isolation.
IMPLICATION: HIGHER MID-CYCLE MARGINS ARE PLAUSIBLE, BUT CURRENT MARGINS ARE NOT A FLOOR
Gary Simmons described low-complexity Far East refiners as earning margins of only approximately $2 to $3 per barrel after relevant freight effects. He argued that higher regional natural-gas prices further increase the product-price incentive required to keep those facilities operating. The central assertion was that “the world needs that capacity to be running today.”
This supports a marginal-cost interpretation of global refining economics. If low-complexity, high-cost international facilities are needed to balance product demand, global product prices must compensate those suppliers sufficiently to sustain production. A complex Gulf Coast refiner can then earn substantial inframarginal rents through lower feedstock costs, lower energy costs, and higher-value product yields.
The argument is consistent with the Q2 call, when management said mid-cycle product cracks were increasingly being set by European hydroskimming economics rather than by more competitive cracking capacity. Q3 extended that framework by emphasizing extreme freight costs and low-complexity Asian refining economics. It did not provide a new numerical mid-cycle margin or EPS target.
The condition embedded in the argument is critical. High-cost capacity sets prices only while it remains necessary to balance demand. Additional product supply, stronger utilization elsewhere, inventory rebuilding, lower transportation costs, or weaker consumption could displace that marginal capacity. Its current operating costs therefore do not constitute an unconditional long-term floor under Valero’s margins.
The earnings release supports the importance of the regional energy-cost advantage. The U.S. natural-gas reference price averaged $2.47 per million British thermal units in Q3, compared with $2.70 a year earlier. At the same time, management described rising natural-gas costs in competing international regions. The quarter was therefore not simply a broad inflationary uplift in refining costs; it reflected widening regional differences in the cost of converting crude into products.
IMPLICATION: HEAVY-CRUDE OPTIONALITY IS VALUABLE, BUT BENEFITS MUST BE SIZED CORRECTLY
Management reported record Venezuelan crude processing during Q3, followed by a shift toward more competitive Canadian barrels in Q4. Hawkins stated that Canadian crude discounts on the Gulf Coast had widened “to as high as $27 to $30 under Brent.” The earnings release shows a Q3 average Brent-minus-Western Canadian Select Houston differential of $16.49 per barrel, compared with $6.93 a year earlier.
The cited Q4 extremes are therefore approximately $10.50 to $13.50 per barrel wider than the Q3 average reference differential. However, a spot high is not a quarterly average, and a published reference discount is not identical to Valero’s realized delivered acquisition cost. Timing, quality, contractual terms, transportation, and crude mix all affect capture.
Heavy-sour crude accounted for 512,000 barrels per day in Q3, or approximately 17.2% of total throughput. Applying a $27 to $30 discount to the entire 2.972 million barrels per day refining system would materially overstate the benefit. Heavy-sour crude also requires additional conversion, hydrogen, sulfur removal, and residue management; its discount is not pure incremental profit.
As an illustrative sensitivity, a $5 per barrel improvement across 512,000 barrels per day for a 92-day quarter represents approximately $236 million before tax and before incremental processing costs or changes in mix. The exposure is meaningful, but it is smaller than the sensitivity to a comparable change in systemwide product margins.
The more durable investment attribute is not dependence on Venezuelan supply specifically. It is the ability to select among competing heavy-sour sources and process those barrels efficiently. Venezuelan production growth remains subject to execution, investment, infrastructure, and policy risks. Canadian supply growth also requires sufficient transportation capacity. Optionality across sources is therefore more valuable than underwriting any single announced upstream production target.
OBSERVATION: DEMAND RESILIENCE IS SUPPORTIVE BUT NARROWLY MEASURED
Management reported that U.S. wholesale-network gasoline sales were up 4% year over year and distillate sales were up approximately 2%, both measured on a 7-day average basis. Canadian and U.K. gasoline and distillate sales were broadly flat. U.K. home-heating-oil sales were down approximately 10%, which management attributed to warm weather and customers delaying purchases.
These observations are encouraging, particularly given elevated product prices. They do not, however, establish that total U.S. or global consumption is growing at the same rates. A company wholesale network is affected by market share, customer mix, local supply availability, and purchasing patterns. A 7-day comparison is also sensitive to weather, holidays, and timing. The data support resilience within Valero’s commercial footprint, not a definitive economy-wide demand estimate.
Management’s interpretation of lower U.K. heating-oil sales is that some purchases have been deferred rather than permanently lost. That could create a later replenishment surge when colder weather arrives. The alternative outcome is that continued mild weather or affordability constraints suppress demand further. The call did not quantify customer inventories or distinguish weather effects from price sensitivity.
Gasoline market structure provides a separate, more directly observable indication of tightness. Simmons highlighted that gasoline remained backwardated in October, after peak driving season and during the transition to higher-RVP winter gasoline. He also cited a closed Northwest Europe-to-PADD 1 import arbitrage and insufficient economics to manufacture and store summer-grade gasoline.
Together, these conditions imply that prompt barrels remain more valuable than deferred barrels and that rebuilding seasonal inventories is not being strongly rewarded. They are constructive for spring 2027, but they are not a guarantee of spring scarcity. Demand, production, import economics, and the forward curve can change substantially before the next driving season.
The most important qualification came late in the call. When challenged on the risk that higher crude prices could compress diesel cracks, Simmons responded: “if for some reason crude runs up, I do think that it could cause some compression of refinery cracks.” This is a material limitation on the earlier statement that no demand destruction was visible.
The favorable environment is not simply high oil prices. It is high product values relative to accessible crude costs. If consumer affordability limits further increases in diesel prices while crude continues rising, refining margins can compress even before significant volume destruction appears. The approximately $5 per gallon diesel price cited by the analyst was not endorsed by management as a precise demand-destruction threshold.
OBSERVATION: Q4 GUIDANCE AND CHANGES FROM PRIOR EXPECTATIONS
Q4 refining throughput guidance totals 2.875 million to 2.975 million barrels per day, with a midpoint of 2.925 million. The midpoint is approximately 1.6% below Q3 actual throughput. The guide is constructive relative to normal seasonal maintenance expectations, but it does not imply sequential systemwide volume growth.
The Gulf Coast midpoint is 1.880 million barrels per day, essentially flat with Q3 actual throughput of 1.874 million. Mid-Continent guidance has a midpoint of 450,000 barrels per day versus 472,000 actual, North Atlantic guidance has a midpoint of 490,000 versus 507,000, and West Coast guidance has a midpoint of 105,000 versus 119,000. The volume outlook therefore combines sustained Gulf Coast strength with lower expected throughput elsewhere.
Refining cash operating expenses are guided to approximately $4.85 per barrel, down 3.6% from Q3 actual expenses but above the $4.75 previously expected for Q3. At the Q4 throughput midpoint, the $0.18 per barrel sequential reduction represents approximately $48 million of quarterly savings relative to holding Q3 unit costs constant. This is helpful but modest compared with the effect of even a small change in realized refining margin.
Management described the Q4 capture outlook as “mainly tailwinds.” The identified drivers were cheaper heavy-sour feedstocks, butane blending into winter gasoline, Arctic diesel premiums in the North Atlantic, and improving jet regrades. Lower propylene and naphtha values are partial offsets, while stronger aromatics provide support.
Capture and benchmark margins must be modeled separately. Better capture means that Valero monetizes its particular feedstocks, products, and commercial opportunities more effectively relative to an indicator. It does not guarantee rising absolute earnings if benchmark cracks weaken sufficiently. The call supports favorable capture assumptions, not an explicit commitment to sequential EPS growth.
The Port Arthur DHT clarification is particularly important. Simmons stated: “The DHT really isn’t in the guidance.” Mechanical completion is not expected until around the end of Q4. Any model incorporating a full-quarter Q4 restoration benefit would therefore overstate management’s operating outlook.
On the Q2 call, management expected repairs to be completed and the unit returned to service by year-end. The Q3 discussion retained the year-end completion objective but emphasized mechanical completion near quarter-end. This is not an announced delay, although it argues against assuming a material earnings contribution before 2027. Mechanical completion and stable commercial operation should not be treated as identical milestones.
The $250 million repair-cost estimate is unchanged, remains included in sustaining-capital guidance, and is still expected to be substantially insured. The call did not specify the timing of insurance recoveries or the amount of lost-margin compensation, if any. Insurance expectations should therefore not be converted into a specific near-term cash inflow without additional disclosure.
The refinery has continued to operate at normal throughput despite the DHT outage. Its restoration should principally improve product-processing flexibility and value capture rather than be modeled automatically as a large increase in crude throughput.
Full-year capital-investment guidance remains approximately $2 billion, including $1.7 billion of sustaining expenditure and $300 million of growth expenditure. With $1.205 billion of attributable capital investment recorded through September, the unchanged annual guide implies approximately $795 million in Q4 if fully spent. That would be approximately 85% above Q3’s $429 million. Consequently, Q4 free cash flow may face a material capital-spending headwind even if operating earnings remain strong.
The clear adverse guidance revision was G&A. Full-year guidance increased from approximately $960 million on the Q2 call to $1.1 billion, an increase of $140 million or 14.6%. Q3 G&A was $308 million versus $233 million in Q2, and year-to-date G&A was $826 million. The revised annual guide implies approximately $274 million in Q4. The call did not provide a detailed explanation for the annual increase, so neither a wholly recurring cost reset nor a wholly temporary expense should be assumed.
Q4 net interest expense is guided to approximately $135 million, down from $144 million in Q3. Total depreciation and amortization is approximately $700 million, compared with $684 million in Q3. The $700 million figure is omitted from the supplied initial draft but appears in an alternate published transcript of the same call. No quantitative Q4 EPS, tax-rate, or refining-margin guidance was provided.
IMPLICATION: 2027 MAINTENANCE COULD EXTEND PRODUCT TIGHTNESS
Management cited consultant estimates that approximately 1.5 million barrels per day of global refinery turnaround activity had been deferred. This supports the possibility of heavier maintenance in 2027 and greater unplanned-downtime risk at facilities that have postponed work.
The figure refers to refinery capacity associated with deferred maintenance, not to a guaranteed 1.5 million barrels per day reduction in annual 2027 product supply. The duration, timing, and overlap of the eventual turnarounds determine the actual lost production. Treating the figure as a continuous annual supply deficit would materially overstate its significance.
Valero reiterated that it has not deferred its own maintenance. Simmons stated: “We haven’t really changed anything in terms of our philosophy on maintenance and taking our turnarounds.” This is consistent with the Q2 discussion and supports relative reliability rather than a new maintenance-policy change.
The investment implication is asymmetric. Industry downtime can support product margins, but Valero captures that benefit only while its own system remains available. The Port Arthur DHT incident and the DGD storm-related disruption demonstrate that disciplined maintenance does not eliminate operational risk.
Management also cited approximately 1.4 million barrels per day of Russian refining capacity offline on a 3-month-average comparison with 2024. The Q2 call referenced 1.7 million to 1.9 million barrels per day offline at that time. These figures use different timing and comparison conventions and should not be directly subtracted to estimate recovered capacity.
Russian diesel exports were described as remaining approximately 600,000 to 700,000 barrels per day below year-earlier levels even after announced changes. Management could not provide a reliable restoration timetable. The call therefore supports continued supply uncertainty, not a precise forecast for Russian refinery recovery.
The assertion that sanctions changes mainly redirect trade rather than create new physical supply is economically relevant but incomplete. Changes in sanctions can still affect effective availability through financing, insurance, shipping efficiency, voyage length, and market access. Even without increasing refinery output, more efficient trade can lower delivered costs and reduce scarcity premiums.
OBSERVATION: RENEWABLE DIESEL RECOVERY VERSUS SEQUENTIAL DETERIORATION
Renewable diesel operating income was $353 million, compared with a $28 million loss in Q3 2025. Sales volumes increased 26.0% year over year to 3.423 million gallons per day. Segment margin increased from $0.50 to $1.62 per gallon, while operating income improved from a loss of $0.11 to a profit of $1.12 per gallon.
The year-over-year recovery is substantial. The sequential result is materially weaker. Operating income declined from $717 million in Q2 to $353 million, a reduction of 50.8%, while daily sales fell from approximately 3.8 million gallons to 3.423 million. Actual Q3 sales were approximately 2.2% below the prior guide of 3.5 million gallons per day.
Management explained that Q2 benefited from unusual recoveries, modeling adjustments, year-to-date true-ups, and favorable feedstock-pricing lags. Q3 experienced the reverse combination of less favorable pricing timing, a storm-related disruption at DGD 3, and a higher proportion of feedstocks that did not qualify for the expected production tax credit.
This distinction is essential to estimating normalized earnings. Q2’s $717 million should not be treated as a clean recurring baseline, while Q3’s $353 million should not automatically be treated as normalized either. The call did not quantify the contribution of each temporary factor, leaving a material uncertainty in the underlying run rate.
The earnings release shows strong underlying commodity and credit support. The D4 RIN reference price averaged $2.23 versus $1.13 a year earlier, while the NYMEX ultra-low-sulfur diesel reference price averaged $4.33 per gallon versus $2.35. Feedstock costs also rose, including used cooking oil from $0.62 to $0.76 per pound. The year-over-year improvement therefore reflects the combined movement of product prices, regulatory credits, feedstock costs, and operating efficiency rather than any single input.
Management expects a structurally tight D4 market to persist into 2027 and described Q4 renewable diesel margins and cash flow as positive. However, management also acknowledged that capture is difficult to forecast. Product cargo pricing, feedstock purchase timing, credit values, and tax-credit eligibility can move asynchronously, making a contemporaneous margin indicator an imperfect predictor of reported results.
Q4 sales guidance of 325 million gallons equates to approximately 3.533 million gallons per day, up 3.2% from Q3 actual sales. Total operating expenses are guided to $0.53 per gallon, including $0.23 of depreciation and other noncash costs. This implies cash operating expenses of approximately $0.30 per gallon, compared with $0.28 in Q3. The volume recovery is therefore partly offset by higher guided unit costs.
The tax-credit discussion requires a regulatory qualification. Management’s shorthand that foreign feedstocks do not capture the PTC should not be interpreted as excluding all non-U.S. feedstocks. IRS Notice 2026-53 states that eligible transportation fuel must be derived exclusively from feedstocks produced or grown in the U.S., Mexico, or Canada. The economically relevant distinction is eligible versus ineligible feedstock origin, not simply domestic versus imported.
Darling’s feedstock position and greater vegetable-oil processing provide potential advantages under the current policy framework. Those advantages are not unlimited. Increased industry demand for qualifying feedstocks can raise their prices and transfer part of the subsidy benefit upstream. Carbon-intensity differences, logistics, and conversion economics also remain relevant.
DGD is a 50%-owned joint venture that Valero consolidates. Its $353 million segment operating income is not wholly attributable to Valero shareholders. The same ownership distinction must be applied to cash flow, capital expenditure, and valuation. Assigning 100% of DGD earnings to Valero would overstate the economic contribution.
Strong D4 values are also not an unqualified groupwide benefit. They support renewable diesel economics but increase the compliance burden embedded in petroleum-fuel economics. The release’s market-reference RVO cost increased from $6.38 to $14.34 per barrel year over year. Most reported petroleum product-margin references are already RVO-adjusted, so subtracting that obligation again would double-count the cost.
OBSERVATION: ETHANOL GROWTH, TAX CREDITS, AND PROJECT TIMING
Ethanol operating income increased 48.6% year over year to $272 million, while production increased 3.5% to a record 4.799 million gallons per day. Segment margin increased from $0.83 to $1.03 per gallon, and operating income per gallon increased from $0.43 to $0.62. The improvement was therefore driven predominantly by unit economics rather than volume growth.
Sequentially, operating income declined from $318 million despite higher production. Record volume should not be confused with record profitability. Q3 cash operating expenses were approximately $0.37 per gallon, compared with the $0.35 implied by prior guidance. Including depreciation, actual operating expenses were approximately $0.41 versus the prior guide of $0.39.
Q4 production guidance is 4.9 million gallons per day, or approximately 450.8 million gallons for the quarter, up 2.1% from Q3. Total operating expenses are guided to $0.38 per gallon, including $0.04 of noncash costs, implying cash expenses of $0.34. The guidance therefore combines modest volume growth with improved unit costs, providing an operating tailwind even without stronger commodity margins.
The quarter’s profitability should not be reduced to a simple ethanol-minus-corn spread. The corn reference price increased from $4.02 to $4.78 per bushel year over year, while the ethanol reference price increased from $1.96 to $2.10 per gallon. Coproduct economics, production tax credits, commercial realization, and operating performance help explain why segment profitability improved despite the faster increase in the corn reference price.
On the Q2 call, management discussed ethanol debottlenecking opportunities totaling approximately 100 million to 200 million gallons annually over the following 1 to 2 years. Q3 characterized the program as quick-cycle, relatively low-capital “capacity creep,” without replacing that earlier volume range with a new quantified target. Relative to approximately 1.7 billion gallons of stated annual capacity, the earlier range represents approximately 6% to 12% potential expansion.
Management also identified late 2027 to mid-2028 as the hoped-for timing for carbon-sequestration projects at selected ethanol sites. These projects could reduce carbon intensity and improve export-market attractiveness, but they are not near-term Q4 or full-year 2027 earnings drivers. Permitting, construction, transportation and storage arrangements, verification, and commissioning remain relevant execution dependencies.
The Q2 call discussed an ethanol production-tax-credit expectation of approximately $0.17 per gallon for 2026 and approximately $0.19 for 2027 through 2029. Q3 did not provide an updated numerical credit estimate. Those earlier figures remain useful context, but they were not explicitly reaffirmed as new guidance on this call.
The current statutory 45Z period extends through 2029. A project starting in late 2027 or mid-2028 has a shorter remaining period of currently legislated credit support than a project operating from early 2026. Longer-term valuation must therefore distinguish ongoing low-carbon product value from tax benefits that require future policy extension.
OBSERVATION: CAPITAL PROJECTS AND ACQUISITION DISCIPLINE
The $230 million St. Charles FCC optimization project was completed during Q3 on schedule and within budget, fulfilling the timing communicated on the Q2 call. The project increases production of higher-value products, including alkylate and gasoline, and improves utilization of existing alkylation capacity.
Management stated that “the EBITDA generated in the third quarter actually exceeded our FID for the project,” despite the project not operating for the full quarter. This indicates performance above the investment-case benchmark, but the comparison period and benchmark amount were not disclosed. The statement does not establish that the project recovered its entire $230 million investment during Q3, nor does it support a precise realized return calculation.
The project’s benefit is seasonal. Management expects greater value during Q2 and Q3 gasoline season than during Q4 and Q1. A full quarter of availability in Q4 therefore does not necessarily translate into a proportionately larger contribution than the partial Q3 period. The more informative test of sustained project performance is the 2027 gasoline season.
Future refining investment remains focused on feedstock flexibility, heavy-sour debottlenecking, internal VGO availability, product yields, and utilization of existing conversion assets. This is economically distinct from adding large amounts of standalone crude-distillation capacity.
Management noted that expensive purchased VGO could compress FCC economics even when headline refining margins were strong. Increasing internal VGO production can improve commercial flexibility and reduce dependence on a constrained intermediate market. This supports projects that relieve specific bottlenecks rather than simply maximize aggregate crude throughput.
Acquisition interest remains concentrated in the Gulf Coast, ethanol, and potentially the North Atlantic. No transaction was announced. Quebec-related comments should be interpreted as willingness to evaluate strategically complementary assets, not evidence of an active acquisition process.
Lane Riggs emphasized that investments must make sense “for the entire economic cycle” rather than be “romanced by the prompt situation.” This is particularly important with cash elevated and refining assets generating unusually high current profits. Acquiring assets at valuations that capitalize temporary margins could destroy value despite strong near-term earnings accretion.
The unchanged $300 million growth-capital allocation, despite extraordinary cash generation, supports the credibility of management’s investment discipline. It also indicates that the principal near-term use of excess capital is more likely to be shareholder distributions than a major acceleration in organic capacity expansion.
OBSERVATION: CASH CONVERSION, BALANCE SHEET, AND DISTRIBUTIONS
Reported operating cash flow was $6.932 billion, compared with $1.881 billion a year earlier and Bloomberg consensus of $6.890 billion. The result was only $42 million above consensus despite the substantial earnings beat. Working capital absorbed $526 million, while reported cash flow included $205 million attributable to the other DGD joint-venture member on Valero’s adjusted basis.
The precise reconciliation is $6.932 billion plus the $526 million working-capital use, less $205 million of partner-attributable adjusted DGD cash flow, producing $7.253 billion of adjusted operating cash flow. The adjustment improves comparability with Valero’s shareholder-return framework, but working-capital movements remain real demands on liquidity.
Reported operating cash flow less consolidated capital investment was approximately $6.500 billion. Adjusted operating cash flow less attributable capital investment was approximately $6.824 billion. These are different measures with different ownership and working-capital treatment and should not be presented interchangeably.
A 52% payout ratio applied to $7.253 billion of adjusted operating cash flow implies approximately $3.772 billion of shareholder returns, subject to rounding. This compares with $2.6 billion and a 59% payout ratio in Q2. The payout percentage declined, but the approximate dollar distribution increased materially.
The dividend was $1.20 per share, compared with $1.13 a year earlier, representing 6.2% growth. Management did not announce a new dividend-policy framework or a special dividend. The stated preference remains durable, measured dividend growth supplemented by flexible repurchases.
Cash of $9.840 billion exceeded reported debt of $8.579 billion by $1.261 billion. Including $2.422 billion of finance lease obligations, net debt-like obligations were approximately $1.161 billion. This distinction explains why conventional debt net of cash is negative while management still reports a positive 4% net debt-to-capitalization ratio. Describing the balance sheet simply as debt-free would omit material lease obligations.
The company also had $5.3 billion of additional liquidity excluding cash. Near-term scheduled debt maturities are limited, with $146 million remaining in 2026 and slightly more than $500 million in 2027. These amounts do not materially constrain the shareholder-return framework given current liquidity.
Management’s rationale for holding excess cash is to protect distribution capacity during commodity volatility and potentially accelerate repurchases after a pullback. Bhullar stated: “Over time, all the excess cash we’re accumulating will ultimately be directed towards our owners.” This is a strong statement of allocation preference, but it does not specify a distribution schedule.
The $4.840 billion to $5.840 billion above the long-term cash target is a useful measure of potential distribution capacity, not a guaranteed immediately distributable amount. Consolidated cash includes joint-venture balances, and future working-capital, operating, decommissioning, and investment requirements can affect timing.
The quality of repurchases will ultimately depend on valuation. Reducing the share count is mechanically accretive to EPS, but economic value is created only when shares are repurchased below an appropriate estimate of intrinsic value. Exceptional current earnings do not by themselves establish that condition.
IMPLICATION: EARNINGS SENSITIVITY AND VALUATION
At the Q4 throughput midpoint of 2.925 million barrels per day, each $1 per barrel change in realized refining margin represents approximately $269 million of quarterly pretax operating profit, before secondary effects. At a 23% assumed tax rate and 285 million diluted shares, this equates to approximately $0.73 of quarterly EPS.
On an annualized basis, the same $1 per barrel margin sensitivity is approximately $1.07 billion pretax, or $2.88 per share after tax under those assumptions. A $5 per barrel change would therefore alter annualized EPS by approximately $14.40. These sensitivities illustrate why margin duration dominates the valuation debate.
Annualizing Q3 adjusted EPS produces $95.60. That figure is an arithmetic run rate, not a defensible estimate of normalized earnings. It embeds exceptional product cracks, unusually favorable logistics dislocations, high operating availability, and current regulatory-credit economics.
Valuation should distinguish the finite value of the current high-margin period from sustainable post-disruption earnings and separately identified excess cash. Applying a normal valuation multiple to peak earnings while also assuming that peak cash generation persists would overstate value. Conversely, ignoring already accumulated excess cash and demonstrated distribution capacity would understate the benefits already realized.
There is also a double-counting risk. A valuation should not add current excess cash to equity value while simultaneously assuming that the same cash funds repurchases that reduce the share count without reducing the cash balance. The distribution mechanism changes the composition of shareholder value; it does not create an additional independent pool of value.
No sufficiently verified contemporaneous share price or forward valuation framework is established by the supplied materials. The evidence therefore supports a fundamental earnings judgment, but not a precise price target or quantified share-price upside.
ILLUSTRATIVE Q4 SCENARIOS
The following scenarios are analytical sensitivities rather than management guidance or consensus forecasts. Each assumes 2.925 million barrels per day of refining throughput, $4.85 per barrel of refining cash operating costs, total depreciation reconciled to approximately $700 million, approximately $274 million of G&A excluding depreciation, $135 million of net interest expense, and $127 million of other income, consistent with Q3. A 23% tax rate and 285 million diluted shares are assumed. Renewable diesel earnings are adjusted approximately for 50% joint-venture ownership after tax. Additional buybacks, unusual charges, and tax surprises are excluded.
The base case carries a 50% probability and assumes a realized refining margin of $35 per barrel, approximately 10.8% below Q3. This allows for some normalization later in the quarter despite supportive initial conditions and capture tailwinds. Renewable diesel operating income is assumed at $350 million and ethanol operating income at $280 million. The resulting EPS is approximately $20.75, with refining operating income of approximately $7.5 billion. Adding this to reported year-to-date adjusted EPS of $40.22 produces approximately $61.00 for full-year 2026.
The bull case carries a 25% probability and assumes a realized refining margin of $43 per barrel, approximately 9.6% above Q3. Persistent freight dislocations, wider heavy-crude discounts, resilient winter demand, and constrained competing refinery output support this outcome. Renewable diesel operating income is assumed at $450 million and ethanol operating income at $330 million. The resulting EPS is approximately $26.85, with refining operating income of approximately $9.7 billion and full-year adjusted EPS of approximately $67.00.
The bear case carries a 25% probability and assumes a realized refining margin of $25 per barrel, approximately 36.3% below Q3. Potential drivers include faster normalization of freight, improved product availability, weaker demand, or crude-price increases that are not fully passed through into products. Renewable diesel operating income is assumed at $200 million and ethanol operating income at $200 million. The resulting EPS is approximately $13.05, with refining operating income of approximately $4.8 billion and full-year adjusted EPS of approximately $53.30.
The probability-weighted Q4 EPS is approximately $20.35. The probabilities are judgmental and are not calibrated to market-implied distributions. Even the bear-case refining margin remains well above Q3 2025’s $13.14, so it represents a near-term normalization scenario rather than a full-cycle trough. The range demonstrates that earnings can decline sharply from Q3 while remaining exceptionally strong relative to historical performance.
RECOMMENDATION: CONSTRUCTIVE EARNINGS OUTLOOK, DISCIPLINED VALUATION
The fundamental recommendation is Hold, with a positive view of near-term operating conditions and shareholder-return capacity. The call provides strong evidence of asset quality, commercial flexibility, and capital discipline. It does not establish that the equity is undervalued at any prevailing price, nor does it justify treating Q3 earnings as permanent.
The most important near-term catalysts are the persistence of heavy-crude discounts and favorable capture through Q4, the conversion of reported demand resilience into sustained product-market tightness, and evidence that DGD’s feedstock eligibility and pricing-lag issues are moderating. Port Arthur DHT mechanical completion around year-end is a separate operational milestone, with stable service and improved product economics more relevant to 2027.
During the 2027 maintenance and gasoline seasons, the key tests are whether deferred industry turnarounds materially constrain supply, whether product inventories remain tight after transportation conditions normalize, and whether St. Charles delivers sustained incremental earnings during its strongest seasonal period. Carbon-sequestration projects are later catalysts, beginning potentially in late 2027 through mid-2028.
The constructive thesis would weaken if freight normalization rapidly compresses Gulf Coast crude discounts, product inventories rebuild despite strong refinery runs, wholesale demand deterioration broadens beyond weather-sensitive categories, or crude appreciation consistently outpaces product-price increases. Repeated operating-cost overruns, further unexplained corporate-cost escalation, deterioration in reliability, or acquisition spending based on peak-cycle economics would weaken the company-specific case.
The strongest evidence for a genuinely higher mid-cycle would be durable profitability after abnormal freight and conflict-related disruptions subside. Continued strong margins under more normal logistics, supported by heavy-crude availability, disciplined global capacity additions, and sustained demand, would justify a more durable earnings reset. Until that evidence emerges, the exceptional quarter should be valued as a combination of realized cash creation, continuing near-term opportunity, and substantial normalization risk.
SOURCE AND TRANSCRIPT QUALIFICATIONS
Financial figures and accounting definitions are drawn from Valero’s Q3 2026 earnings release and accompanying tables, distributed through Business Wire. Consensus comparisons use the supplied Bloomberg earnings notice. Prior guidance and sequential operating comparisons use the published Q2 2026 call transcript dated 07/30/26. The missing Q4 depreciation figure was corroborated in an alternate published transcript of the current call. The feedstock-eligibility qualification follows IRS Notice 2026-53 and associated Treasury and IRS guidance.
The supplied transcript is an initial draft and contains omitted figures, transcription errors, and inconsistent speaker labels. Geopolitical flows, deferred-maintenance estimates, Russian capacity outages, and near-term freight quotations remain management observations or cited consultant estimates rather than independently established forecasts. Participant lists below follow the supplied roster and operator introductions; unidentified labels are not treated as additional confirmed individuals.
COMPANY EMPLOYEES ON THE CALL
• Lane Riggs, Chairman of the Board, Chief Executive Officer and President. • Gary Simmons, Executive Vice President and Chief Operating Officer. • Homer Bhullar, Senior Vice President and Chief Financial Officer. • Rich Walsh, Executive Vice President and General Counsel. • Randy Hawkins, Vice President, Crude and Feedstocks Supply and Trading. • Brian Donovan, Vice President, Investor Relations. • Eric Herbort, Director, Investor Relations and Finance.
RESEARCH ANALYSTS ON THE CALL
• Sam Margolin, Wells Fargo. • Manav Gupta, UBS. • Neil Mehta, Goldman Sachs. • Theresa Chen, Barclays. • Phillip Jungwirth, BMO Capital Markets. • John Royall, Piper Sandler. • William Blair, Tudor, Pickering, Holt & Co. • Joe Laetsch, Morgan Stanley. • Doug Leggate, Wolfe Research. • Jason Gabelman, TD Cowen.
Key Read-Throughs
KEY READ-THROUGHS FROM VALERO ENERGY’S Q3 2026 EARNINGS CALL
Valero’s call describes a redistribution of profits across the energy supply chain, not a uniform improvement in energy-sector fundamentals. The central distinction is between adequately supplied crude markets and constrained transportation-fuel markets. Expensive, inefficient shipping is depressing export-parity crude realizations in advantaged producing regions while increasing the cost of competing international supply. Complex U.S. refiners and spot-exposed crude tanker owners benefit, while unintegrated heavy-oil producers and fuel consumers face identifiable offsets. Renewable fuels present a separate opportunity: domestic feedstock access and production-tax-credit eligibility increasingly determine which companies capture regulatory value. The most actionable signals are the direct implications for Darling’s joint venture, the persistence of Gulf Coast refining advantages, and the separation between airline fuel exposure and Delta’s partial refining hedge. The conclusions below distinguish operating sensitivity from an earnings surprise already reflected in company guidance. Magnitude assessments refer to earnings and cash-flow exposure, not forecast share-price changes. Country labels indicate corporate domicile.
PETROLEUM REFINING
GULF COAST REFINERS CAPTURE THE FREIGHT DISLOCATION THROUGH BOTH FEEDSTOCK COSTS AND PRODUCT COMPETITIVENESS (READ-THROUGH 1)
Affected companies: Marathon Petroleum Corporation (MPC: United States) and Phillips 66 (PSX: United States). Direction and magnitude: strongly positive for exposed refining operations; substantial consolidated earnings sensitivity, although diluted by their respective midstream and other businesses.
The supporting commentary is unusually specific. Randy Hawkins stated that Gulf Coast-to-Asia VLCC freight was approximately $30 to $35 per barrel versus approximately $5 in 2025. Because Gulf Coast crude must price competitively for export, higher freight has “forced the discounts to widen in all grades.” Canadian crude discounts on the Gulf Coast had reached $27 to $30 below Brent. Gary Simmons simultaneously described strong Latin American product demand and a Gulf Coast freight advantage over European suppliers serving those markets.
The transmission mechanism is a combination of cheaper relative feedstock acquisition and stronger relative product netbacks. Marathon’s Galveston Bay and Garyville refineries and Phillips 66’s Gulf Coast operations possess the geography and conversion capabilities needed to participate in that advantage. They can process locally available or comparatively short-haul crude without incurring the same transportation burden as distant buyers, while selling into product markets influenced by higher-cost international supply. This is more powerful than a simple increase in benchmark gasoline or diesel cracks because it can improve actual capture relative to those indicators.
The magnitude can be material even without assuming that every barrel receives the quoted heavy-crude discount. Each $1 per barrel of sustained incremental margin across 100,000 barrels per day represents approximately $36.5 million of annual pretax contribution before secondary effects. The applicable exposure is the relevant feedstock and product slate, not total company throughput multiplied by the largest quoted spot discount.
The geographic negative counterpart is Thai Oil Public Company Limited (TOP: Thailand), with moderately negative relative refining economics versus Gulf Coast competitors because its seaborne crude procurement does not receive the same local export-parity advantage. This is a relative competitiveness conclusion, not a forecast of absolute refining losses. Management’s cited $2 to $3 per barrel margins for some low-complexity Asian refiners cannot be assigned to Thai Oil’s more complex system.
The near-term catalysts are peer earnings commentary, delivered-crude differentials, and Q4 capture rates. The longer-duration positive is Gulf Coast infrastructure and feedstock flexibility. The abnormal freight premium itself is cyclical. More efficient shipping could simultaneously narrow Gulf Coast crude discounts and improve overseas refinery competitiveness, reversing both components of the current advantage. Valero’s own operating-cost miss also cautions against translating favorable benchmarks directly into an equivalent peer EPS beat.
BENICIA’S NON-RESTART SUPPORTS CALIFORNIA INCUMBENTS MORE THAN REFINERY-REOPENING HEADLINES SUGGEST (READ-THROUGH 2)
Affected companies: PBF Energy Inc. (PBF: United States) and Marathon Petroleum Corporation (MPC: United States). Direction and magnitude: positive, with potentially high earnings sensitivity for PBF’s California exposure and a more moderate consolidated impact for Marathon.
Rich Walsh stated that Benicia had been safely idled since April and that “we have no plans to restart it.” He identified the need to rebuild inventories, recruit staff, and undertake an extensive turnaround before any restart. Lane Riggs extended the point to other closed refineries, explaining that restarting them would be difficult within a timeframe that addresses prompt shortages.
The principal beneficiaries are remaining California operators, including PBF’s Martinez and Torrance refineries and Marathon’s Los Angeles refinery. Reduced local supply increases reliance on imports that must satisfy California fuel specifications and bear transportation costs and delivery lead times. That supports the scarcity value of reliable in-state production and can preserve elevated local product margins.
The less obvious implication is that higher product prices alone may not induce a rapid supply response. Benicia remains closed despite extraordinary refining profitability elsewhere. Management’s decision indicates that regulatory, staffing, maintenance, and longer-term operating considerations can outweigh attractive prompt margins. Political announcements about reopening capacity should therefore not be treated as equivalent to funded, permitted, staffed restart projects.
The immediate trading relevance is the potential reversal of any assumption that administrative pressure will quickly restore substantial California supply. The longer-duration effect is tighter effective capacity and a higher value placed on operating reliability. PBF’s benefit remains conditional on its own plant availability and costs; regional scarcity does not compensate shareholders for barrels a refinery cannot produce. Imported-crude freight and California operating expenses are also offsets, so stronger local cracks do not translate dollar-for-dollar into higher net earnings.
MARINE SHIPPING
MORE OIL MOVING THROUGH THE STRAIT CAN REMAIN BULLISH FOR TANKERS WHEN EACH BARREL REQUIRES MORE VESSEL TIME (READ-THROUGH 3)
Affected companies: Frontline plc (FRO: Cyprus) and DHT Holdings, Inc. (DHT: Marshall Islands). Direction and magnitude: strongly positive for available spot exposure, with high earnings and cash-distribution sensitivity.
Hawkins described rising flows through the Strait alongside ship-to-ship transfers in the Gulf of Oman that are “requiring more tankers to move the same amount of oil.” Insurance premiums, transfer delays, and higher bunker costs compound the effect. The cited Gulf Coast-to-Asia freight cost of $30 to $35 per barrel versus $5 in 2025 demonstrates the severity of the logistics dislocation.
The important distinction is between physical oil supply and effective vessel supply. Higher transit volumes do not automatically normalize freight if cargoes continue consuming additional vessel days through transfers, waiting, or inefficient routing. Freight can remain elevated even as the crude market becomes better supplied. This directly benefits owners of commercially available crude tankers rather than requiring a bullish view on crude prices.
Frontline’s VLCC and Suezmax exposure and DHT’s VLCC fleet provide direct participation. Their own 2026 disclosures already show substantial earnings from elevated rates, so Valero’s commentary is confirmation of persistence rather than discovery of a previously unrecognized freight cycle. The next marginal earnings effect depends on unbooked days and contract expiries. DHT has meaningful fixed-rate coverage, and Frontline has also added term charters; neither should be modeled as entirely exposed to each new spot-rate increase.
As an illustrative sensitivity, an additional $10,000 per day of net time-charter-equivalent earnings across 10 vessels for a full year represents approximately $36.5 million before changes in operating expenses and off-hire. The quoted freight cost per barrel is not itself a tanker-owner margin: voyage duration, ballast positioning, fuel, insurance, and charter terms determine realized economics.
The near-term catalysts are new fixtures, Q4 booking updates, and cash distributions. The longer-duration question is whether altered trade routes and security procedures remain inefficient after the immediate disruption eases. This is principally a cyclical logistics opportunity, not evidence that current freight rates are permanent. It also creates a cross-sector correlation: tanker owners and Gulf Coast refiners can both lose part of their exceptional profitability if shipping efficiency normalizes. The call’s emphasis on dirty freight should not be extrapolated mechanically to all product-tanker markets.
RENEWABLE FUELS AND AGRICULTURAL PROCESSING
DARLING HAS THE MOST DIRECT EARNINGS READ-THROUGH, BUT THE SIGNAL IS SEQUENTIAL RECOVERY RATHER THAN A RETURN TO Q2 WINDFALL PROFITS (READ-THROUGH 4)
Affected company: Darling Ingredients Inc. (DAR: United States). Direction and magnitude: materially negative for the Q3 contribution relative to Q2, but positive for Q4 recovery potential and the underlying 2027 operating outlook.
Valero reported renewable diesel operating income of $353 million versus $717 million in Q2, a 50.8% sequential decline, despite remaining substantially above the prior-year loss. Management identified Q2 recoveries, true-ups, and favorable feedstock-pricing lags, followed by Q3 storm disruption, less favorable pricing timing, and lower production-tax-credit capture. The call therefore rejects a simple extrapolation of Q2 profitability.
Darling owns 50% of Diamond Green Diesel and supplies important feedstocks to the business. This is an actual joint-venture and supplier relationship, not an inferred industry comparison. Lower DGD profitability directly reduces Darling’s attributable earnings contribution, while qualifying domestic feedstock demand can support a separate part of Darling’s business.
Darling’s same-day statement provides an important cross-check. It reported DGD adjusted EBITDA of $1.30 per gallon on 314.9 million gallons sold, with approximately $204 million attributable to Darling under its stated methodology. That figure should be used rather than simply taking half of Valero’s renewable diesel operating income or adding depreciation without reconciling accounting and commercial differences.
The forward signal is more constructive. Valero expects 325 million gallons of Q4 sales, approximately 3.2% above Q3, and described margins and cash flow as positive. Management emphasized maximizing feedstock supplied by Darling and increasing vegetable-oil processing. Darling separately stated that timing differences affecting Q3 should benefit Q4 and provided 2026 combined adjusted EBITDA guidance of $2.2 billion to $2.3 billion.
The magnitude remains significant: a $0.10 per gallon change in DGD EBITDA at 325 million quarterly gallons equates to approximately $16.25 million for Darling’s 50% share, before differences in reported definitions. This is EBITDA sensitivity, not an equivalent increase in net income or immediate cash distributions.
The near-term catalysts are Darling’s October 28 results and October 29 call, particularly the bridge from Q3 timing effects to Q4 realization. However, the same-day statement means much of the direct read-through is already public. The longer-duration positive is Darling’s combination of feedstock access and renewable-fuel ownership. The critical negative is that Q2 contained temporary benefits, while higher feedstock prices, RIN volatility, and policy changes can absorb part of the apparent margin opportunity. A recovery thesis does not require, and should not assume, a return to the Q2 peak.
VEGETABLE-OIL PROCESSORS CAN CAPTURE PART OF THE RENEWABLE-FUEL SUBSIDY THROUGH FEEDSTOCK PRICING (READ-THROUGH 5)
Affected companies: Archer-Daniels-Midland Company (ADM: United States) and Bunge Global SA (BG: Switzerland). Direction and magnitude: positive for qualifying North American oilseed-processing operations; moderate potential consolidated earnings impact because both companies have diversified geographic and business exposures.
The decisive call commentary was that DGD is “maximizing vegetable oil runs” while positioning for a D4 shortfall expected to continue into 2027. Management also described the advantage of feedstocks that qualify for the production tax credit. This is a concrete operating response from a major renewable-fuel producer, rather than only an announced industry capacity target.
Additional renewable diesel demand increases the value of soybean oil and other eligible vegetable oils relative to alternative uses. For ADM and Bunge, the benefit can appear through higher processing utilization, improved oil realization, and stronger demand for existing North American assets. The effect is most direct in the crush and processing businesses, not necessarily in every part of their agricultural merchandising networks.
The supplier-customer transmission is important. The tax credit is earned at the fuel-production stage, but competitive procurement can transfer part of that value to feedstock suppliers. Stronger oilseed-processing economics can therefore coexist with disappointing renewable diesel capture. A forecast that assumes expanding processor margins and unchanged low feedstock costs for fuel producers risks allocating the same economic benefit twice.
ADM’s July announcement of approximately 700,000 metric tons of additional annual North American crush capacity illustrates the strategic response. Those projects are scheduled largely for 2028 and early 2029, so the immediate opportunity is in existing capacity and utilization rather than an imminent surge from those investments. ADM’s Green Bison joint venture with Marathon also demonstrates how refiners are integrating upstream into feedstock supply.
The principal limitation is the soybean-meal coproduct. Higher oil demand can encourage more crushing and increase meal supply, potentially depressing meal prices and offsetting part of the oil benefit. Feedstock inflation and competitive capacity additions also constrain the improvement. The high-conviction conclusion is stronger demand for qualifying vegetable oil, not an unconditional expansion in every processor’s total margin.
The near-term catalysts are crush margins, utilization, feedstock procurement patterns, and 2027 commercial commitments. The longer-duration opportunity depends on policy-supported demand continuing to absorb additional processing capacity. Eligibility also requires precision: current 45Z rules permit qualifying feedstocks from the U.S., Canada, and Mexico, so the call’s shorthand about foreign feedstocks should not be interpreted as excluding all non-U.S. supply.
ETHANOL’S EXPORT DEMAND AND TAX-CREDIT ECONOMICS SUPPORT EXISTING PRODUCERS, WHILE INDUSTRY CAPACITY CREEP LIMITS THE TERMINAL UPSIDE (READ-THROUGH 6)
Affected companies: REX American Resources Corporation (REX: United States) and Archer-Daniels-Midland Company (ADM: United States). Direction and magnitude: positive, with a potentially substantial effect on REX’s concentrated ethanol exposure and a more modest consolidated effect on ADM.
Valero produced a record 4.8 million gallons per day of ethanol in Q3 and guided to 4.9 million in Q4. Operating income increased to $272 million from $183 million a year earlier. Management described export demand as strong and stated that its capacity additions are “all pointed at growing exports.” It also said 45Z is encouraging ethanol producers to pursue higher volumes.
The transmission mechanism combines utilization, export realization, coproduct economics, and production-tax-credit capture. Additional production can improve fixed-cost absorption, while qualifying lower-carbon output can earn incremental regulatory value. REX’s ethanol concentration makes these changes more consequential to consolidated earnings than they are for a diversified processor such as ADM.
The export statement is more informative than a generic assertion of strong U.S. gasoline demand. Domestic blending constraints can limit the growth of conventional ethanol consumption, making access to overseas markets important for absorbing incremental gallons. Valero’s willingness to expand specifically for exports supports the industry’s ability to monetize additional output without relying exclusively on higher domestic blend rates.
The near-term positive should nevertheless be sized from margins rather than production records. Valero’s ethanol operating income declined from $318 million in Q2 despite higher Q3 output. Record volumes therefore do not establish peak or accelerating profitability. A $0.05 per gallon improvement across 100 million attributable gallons represents $5 million of pretax contribution, but corn costs, energy, coproduct prices, and credit eligibility determine whether that improvement is realized.
The near-term catalysts are export volumes, producer margin guidance, and demonstrated credit realization. The longer-duration catalysts are debottlenecking and carbon-intensity reductions. Valero’s sequestration projects were discussed for late 2027 to mid-2028, reinforcing that the carbon-capture uplift is not an immediate sectorwide earnings event.
The principal negative is supply response. Management explicitly indicated that 45Z is encouraging “all ethanol producers” to evaluate higher volumes. Broad capacity creep can eventually compete away part of the benefit unless exports and other demand absorb the additional supply. Tax credits also should not be added again to earnings models where they are already recognized in reported segment or gross profit.
CANADIAN UPSTREAM
WIDER HEAVY-CRUDE DISCOUNTS TRANSFER VALUE FROM UNINTEGRATED PRODUCERS TO REFINERS, EVEN WHEN BENCHMARK OIL REMAINS STRONG (READ-THROUGH 7)
Affected companies: Athabasca Oil Corporation (ATH: Canada) and Baytex Energy Corp. (BTE: Canada). Direction and magnitude: negative for unprotected heavy-oil realizations, potentially material to cash flow. Cenovus Energy Inc. (CVE: Canada) and Suncor Energy Inc. (SU: Canada) have partial offsets through downstream integration, although those offsets are not exact.
The supporting commentary is the widening of Canadian crude discounts on the Gulf Coast to $27 to $30 below Brent and Valero’s resulting shift toward Canadian barrels. Management also expects incremental crude supply to be disproportionately heavy and sour, including from Canada and Venezuela.
For an unintegrated producer, a wider applicable quality or location discount reduces the realized price received for a barrel even if Brent or WTI remains elevated. Athabasca’s thermal-oil exposure and Baytex’s Canadian heavy-oil production make the differential an important component of cash generation. The same discount that supports a refinery’s feedstock economics can represent foregone producer revenue.
The qualification is essential: a Gulf Coast Brent-to-Canadian-crude differential is not identical to the WTI-to-WCS differential at Hardisty. The quoted $27 to $30 must not be subtracted mechanically from company benchmark assumptions. Transportation commitments, marketing destinations, blending costs, hedges, and local supply conditions determine how much of the Gulf Coast weakness reaches each producer.
The operating sensitivity is nevertheless significant. A $5 per barrel deterioration in realized pricing across 100,000 barrels per day represents approximately $182.5 million of annual revenue before royalty, tax, and hedging offsets. This is a scaling illustration, not a claim that either company has exactly that exposed volume or has incurred that specific deterioration.
Cenovus and Suncor provide a useful competitive contrast. Their refining operations can recover part of the value lost through weaker upstream differentials, making consolidated earnings less directly exposed than those of unintegrated heavy-oil producers. The protection depends on refinery availability, crude sourcing, geography, and product margins; it is not a perfect hedge.
The near-term catalysts are realized-price disclosures, WCS differentials at the actual sales locations, hedge settlements, and Gulf Coast crude balances. The longer-duration issue is whether heavy-crude supply grows faster than accessible conversion capacity. Valero’s interest in heavy-sour debottlenecking is supportive of future demand, but investment plans do not create immediate processing capacity. This is a negative basis read-through, not a blanket prediction that Canadian producer earnings must fall if benchmark oil rises sufficiently.
INDUSTRIAL MAINTENANCE AND ASSET-INTEGRITY SERVICES
DEFERRED TURNAROUNDS CREATE A 2027 SERVICE OPPORTUNITY THAT DOES NOT REQUIRE A NEW-REFINERY CONSTRUCTION CYCLE (READ-THROUGH 8)
Affected company: TEAM, Inc. (TISI: United States). Direction and magnitude: moderately positive for service demand and operating leverage, with the ultimate equity effect dependent on execution, financing costs, and working-capital requirements.
Valero cited consultant estimates that approximately 1.5 million barrels per day of global refinery turnaround activity had been deferred. Simmons said this points to heavier maintenance in 2027 and potentially greater unreliability at facilities that postponed work. Valero separately reiterated that it is maintaining its own planned turnaround schedule.
The demand mechanism is directly relevant to TEAM’s inspection, heat-treating, mechanical, repair, and turnaround services. Extended refinery runs increase the importance of inspection and corrective work, while deferred planned maintenance must eventually be executed. When outages occur, service intensity can include valve repair, machining, bolting, heat treatment, and integrity assessment rather than only routine staffing.
The more actionable distinction is between maintenance expenditure and major growth capital. Valero held annual capital guidance at approximately $2 billion despite extraordinary cash generation and continues to prioritize short-cycle optimization. That is a stronger signal for specialized maintenance and asset-integrity providers than for an indiscriminate expansion in large engineering and construction awards.
TEAM’s own operating disclosures demonstrate the connection between turnaround activity and service revenue. However, the Valero call does not establish that TEAM has won specific contracts or that all deferred global work lies within its accessible markets. The 1.5 million-barrel-per-day figure measures capacity associated with deferred activity, not a disclosed service-spending pool or continuous production loss.
The near-term catalysts are 2027 scheduling, customer commitments, technician utilization, and maintenance-related revenue guidance. The longer-duration support is the need to sustain reliability in a heavily utilized, aging asset base. Labor constraints, overtime, project execution, and mobilization costs can absorb part of the revenue benefit. The high-conviction positive is the direction of maintenance demand, not a predetermined EBITDA increase.
AIRLINES AND TRANSPORTATION
JET-FUEL SCARCITY REMAINS AN AIRLINE COST HEADWIND, WHILE DELTA’S REFINERY PROVIDES A DISTINCT RELATIVE OFFSET (READ-THROUGH 9)
Affected companies: American Airlines Group Inc. (AAL: United States) and United Airlines Holdings, Inc. (UAL: United States). Direction and magnitude: negative, with high gross fuel-cost sensitivity and a potentially material earnings effect before fare recovery. Delta Air Lines, Inc. (DAL: United States) has a positive relative offset through its refinery, although its overall airline business remains exposed to elevated fuel costs.
Valero reported that jet regrades were turning positive again and described continued strength in distillate export demand. Management also cited substantial Russian refining outages and diesel exports remaining approximately 600,000 to 700,000 barrels per day below year-earlier levels. These observations point to persistent scarcity in the middle-distillate complex rather than merely a high crude price.
The transmission mechanism is the jet-fuel premium over crude. Airlines can face expensive jet fuel even when crude supply improves if refining capacity, product inventories, or transportation remain constrained. A crude-price decline is therefore not sufficient by itself to establish a proportional reduction in airline fuel costs.
American and United do not have Delta’s captive-refinery offset. Delta’s Monroe operation can earn refining margin while the airline incurs higher fuel costs, partially offsetting widening product cracks at the consolidated level. This is an operating hedge against part of the crude-to-product spread, not full protection against higher crude prices, refinery downtime, or all delivered jet-fuel costs.
The magnitude is straightforward: each additional $0.10 per gallon costs $100 million per 1 billion gallons consumed, before fare increases, schedule adjustments, hedges, or operating offsets. The realized earnings impact depends on the ability to reprice tickets and manage capacity. Valero’s evidence does not establish that passenger demand is weak, nor does it justify treating higher fuel expense as an equal-sized decline in airline profit.
The near-term catalysts are Q4 realized jet-fuel prices, changes in jet cracks, refinery contributions, and airline unit-revenue performance. Much of the elevated fuel environment is already visible in airline guidance, so an incremental negative earnings catalyst requires costs to exceed the assumptions embedded in that guidance or fare recovery to disappoint.
The longer-duration implication is that refining scarcity can prolong transportation-cost inflation after crude-market conditions improve. It also argues against extrapolating the same earnings effect across all transportation companies: contractual fuel surcharges can transfer a larger portion of fuel inflation to customers in some freight businesses. For airlines, the highest-conviction distinction is the direct cost exposure at American and United versus Delta’s partial offset from owning refining capacity.
Report record
- Sector
- Energy
- Fiscal period end
- September 30, 2026
- Report date
- October 22, 2026
- Analysis
- 7039 words
- Read-throughs
- 3656 words
- Content fingerprint (PDF)
415a65f20338- Content fingerprint (analysis)
d5ef466028f9- Content fingerprint (read-throughs)
f84bd05b7883
Prepared from the company's earnings release and earnings call transcript. Figures as reported by the company. For information only. Not investment advice.
More from Valero Energy Corporation
No other reports yet.
All Valero Energy Corporation reports
More in Energy
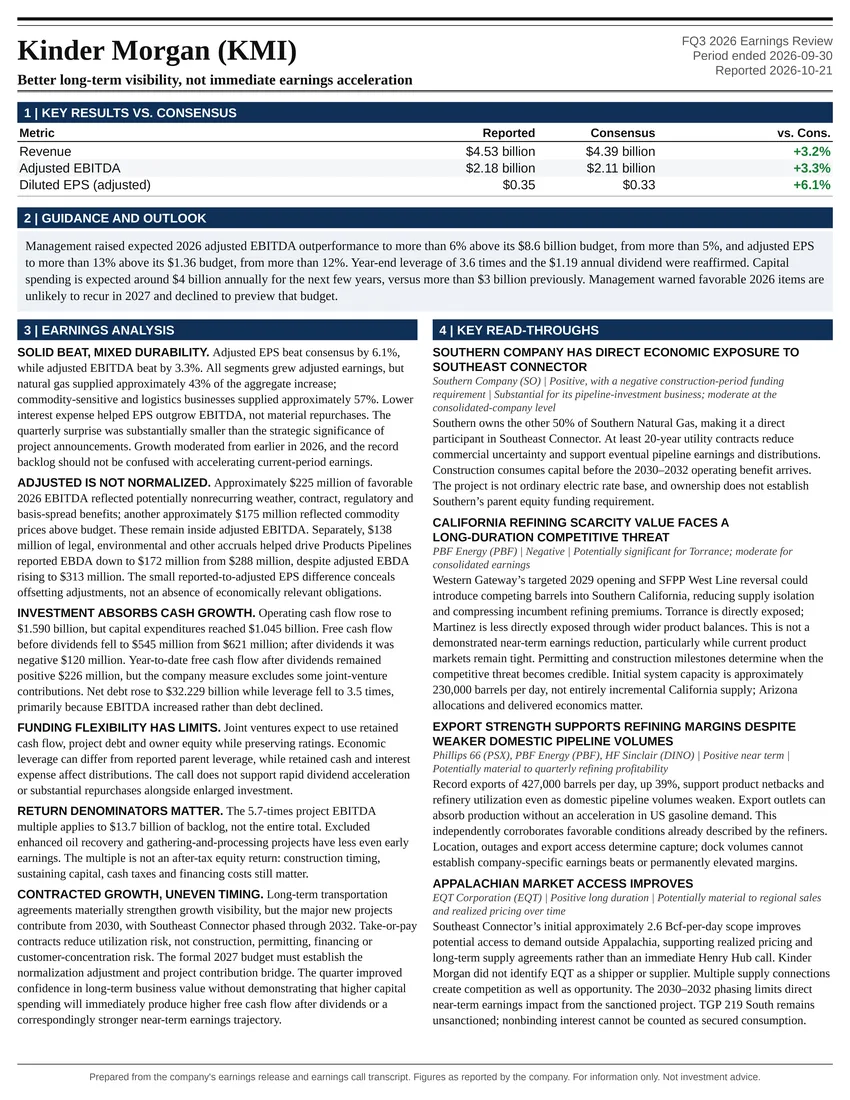
Better long-term visibility, not immediate earnings acceleration
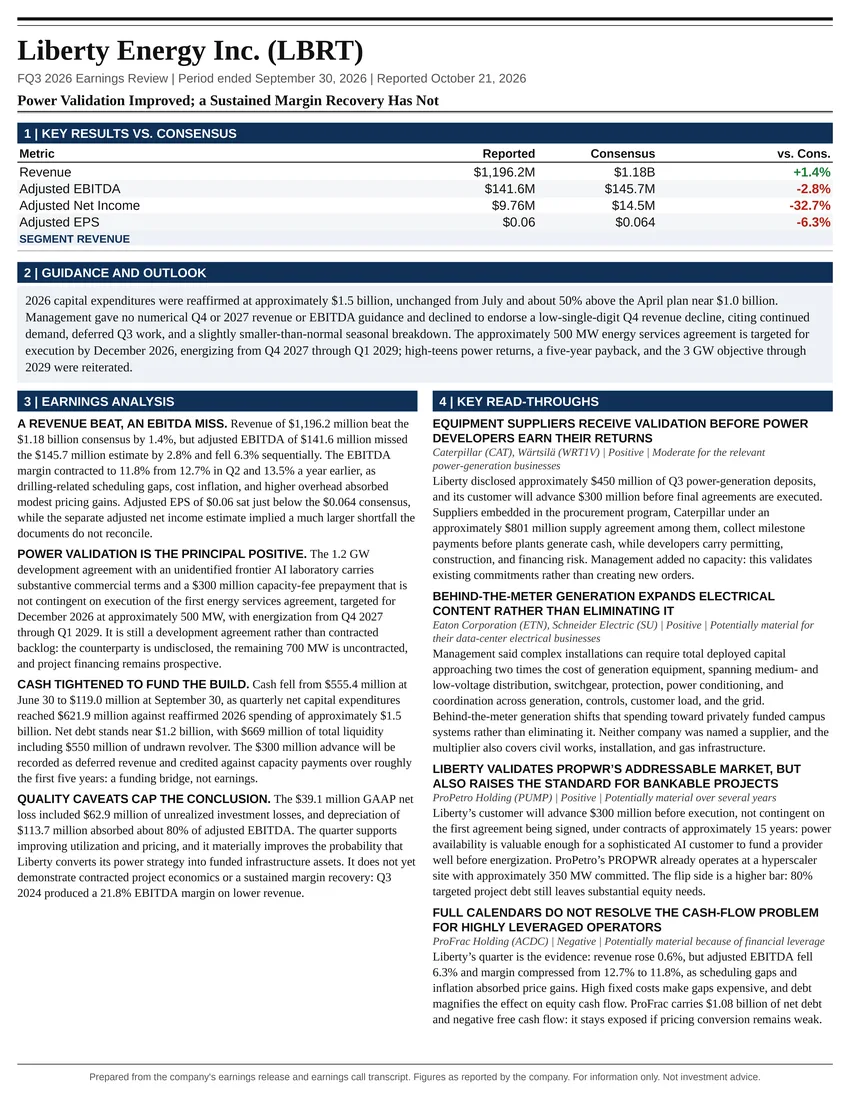
Power Validation Improved; a Sustained Margin Recovery Has Not
Follow @AtlasPeakRes on X for new earnings reports as they publish.