An Internationally Led Recovery, Not Yet an Earnings Recovery
Earnings Reports
Liberty Energy FQ3 2026 Earnings Report
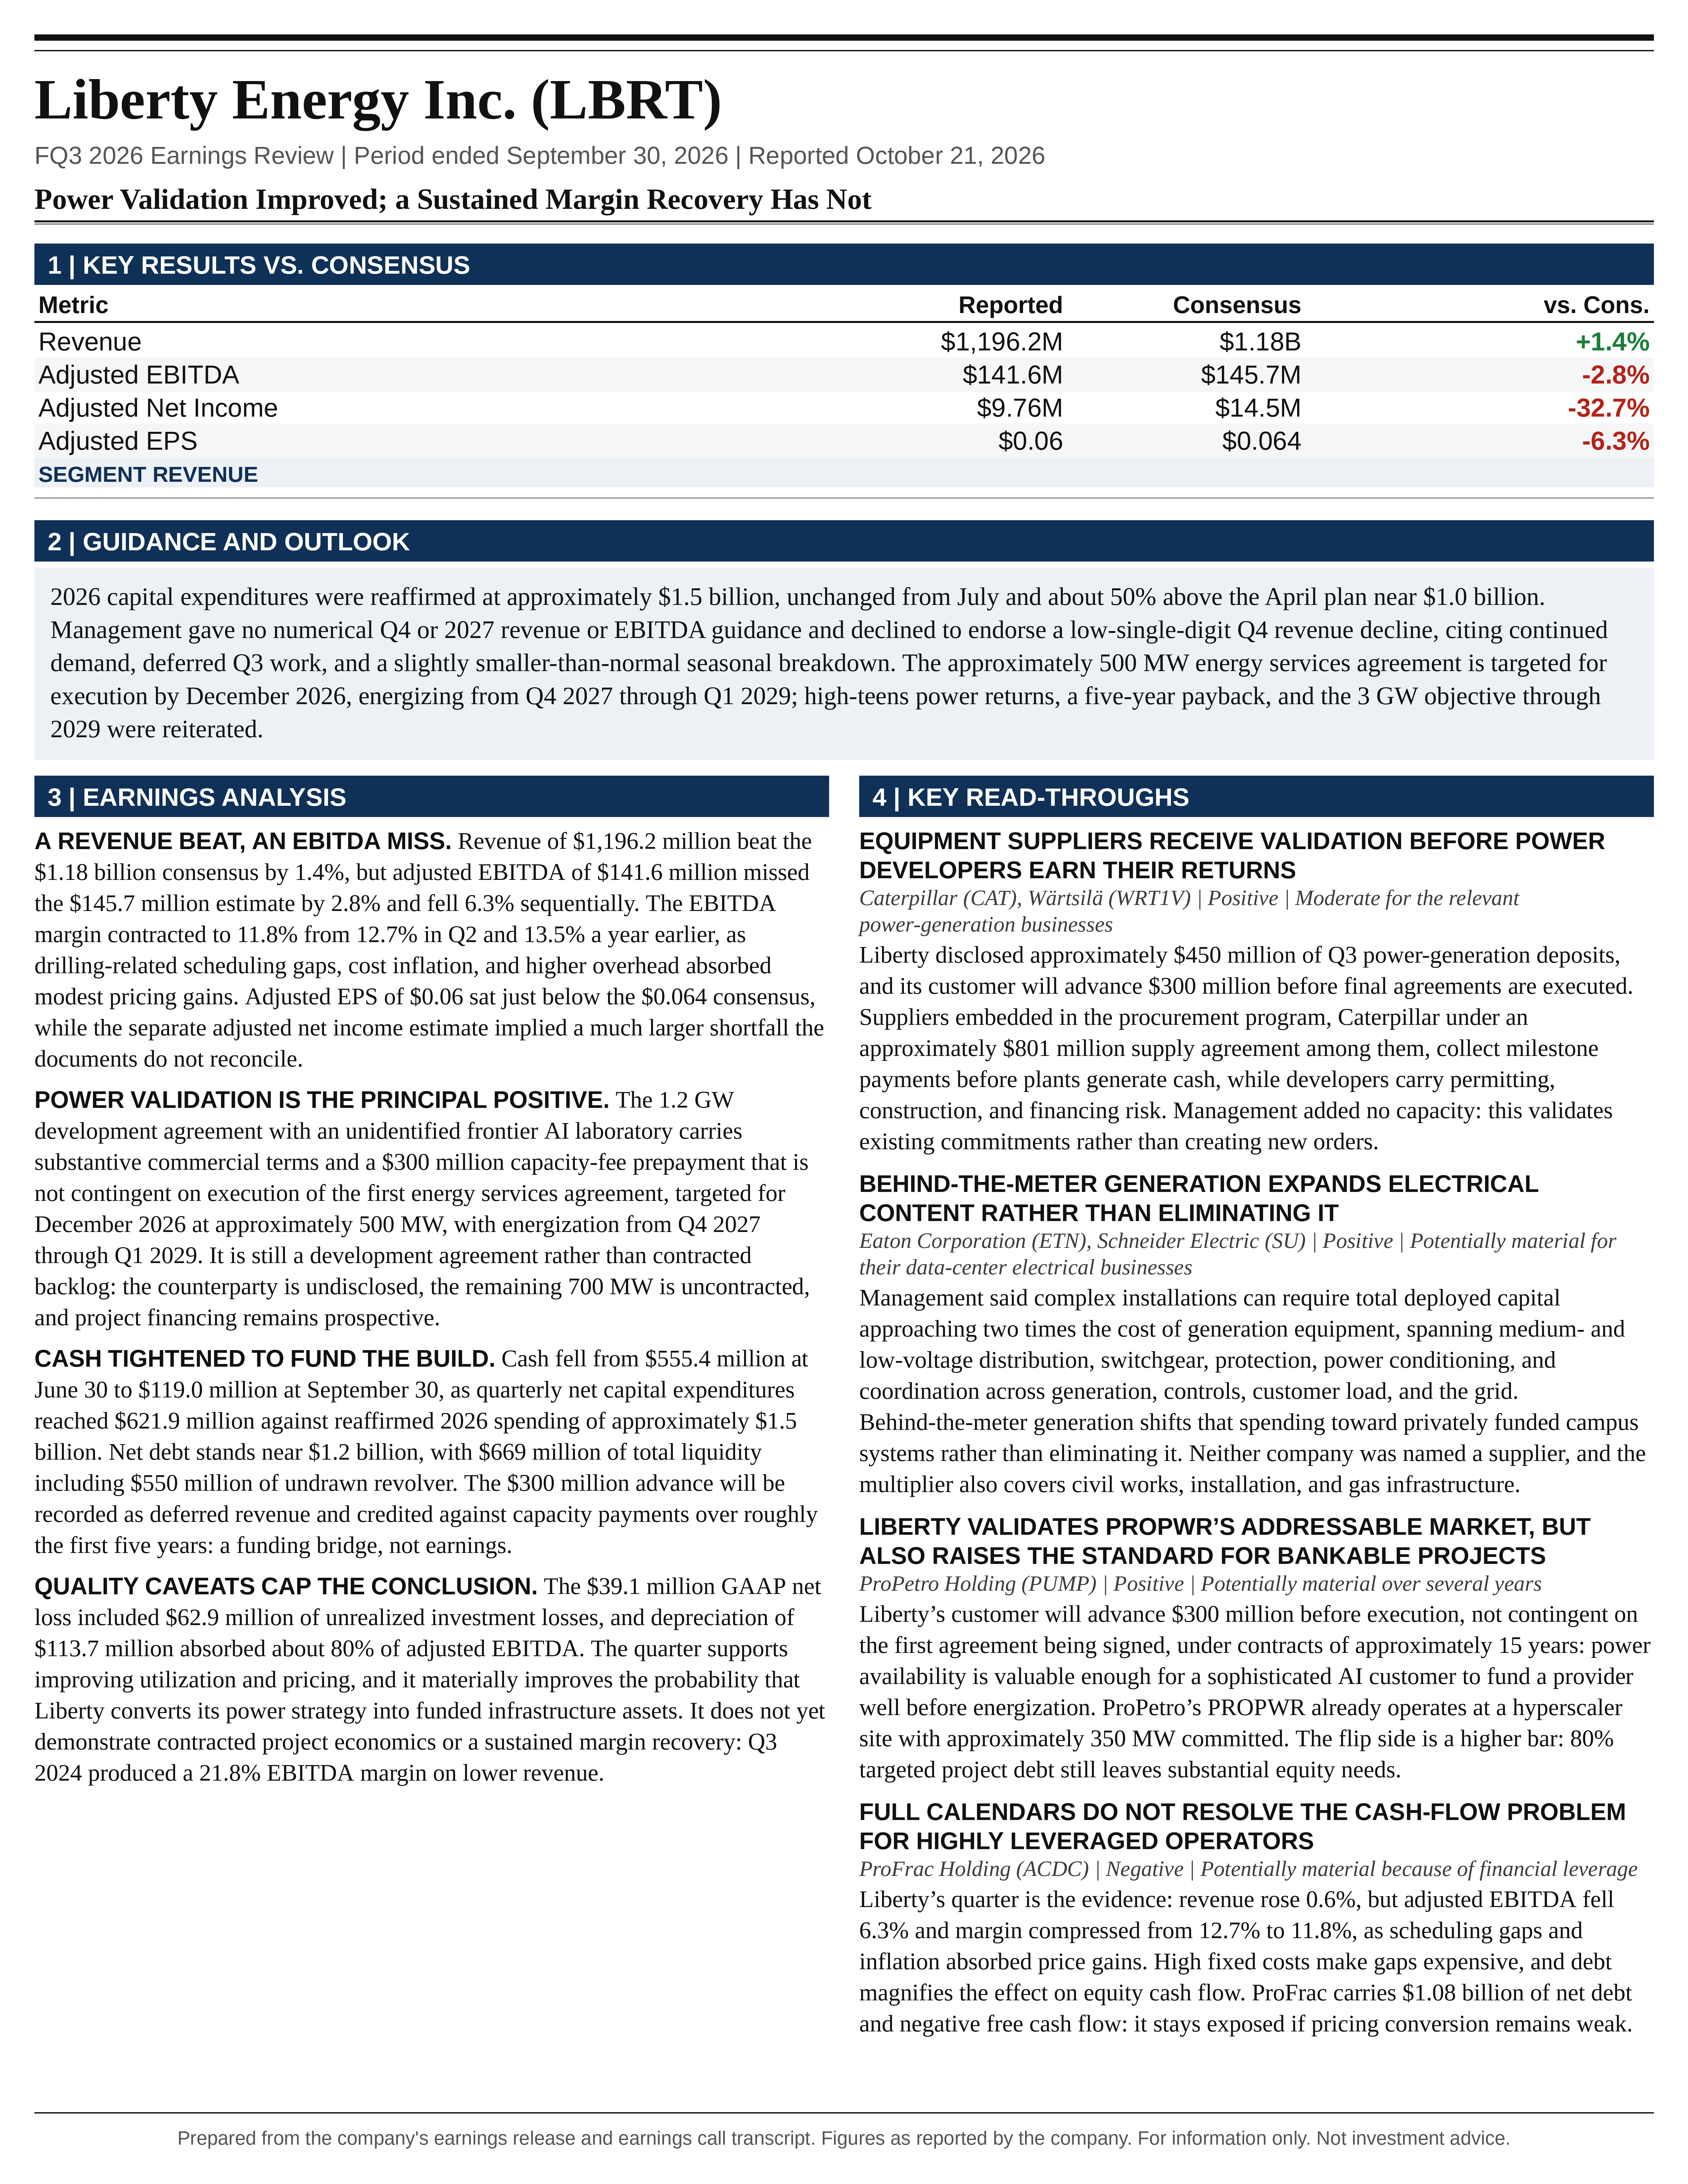
Liberty Energy (LBRT) FQ3 2026 earnings: Power Validation Improved; a Sustained Margin Recovery Has Not. Full earnings analysis, key read-throughs, and the one-page exhibit from Atlas Peak Research.
Liberty Energy (LBRT)
Sector: Energy · FQ3 2026 · Period end September 30, 2026 · Reported October 21, 2026
Liberty Energy’s Q3 2026 call was strategically constructive but operationally mixed. The principal positive was a meaningful improvement in the commercial credibility and near-term funding of Liberty Power Innovations, rather than an acceleration in current earnings.
Download the one-page report (PDF)
View one-page exhibit
Download analysis (.md)
Download read-throughs (.md)
Post to X
One-Page Exhibit
Earnings Analysis
EXECUTIVE CALL SUMMARY: Liberty Energy Inc. (10/22/26)
Liberty Energy’s Q3 2026 call was strategically constructive but operationally mixed. The principal positive was a meaningful improvement in the commercial credibility and near-term funding of Liberty Power Innovations, rather than an acceleration in current earnings. The 1.2 GW development agreement with an unidentified frontier AI laboratory and infrastructure platform, supported by a capacity-fee prepayment identified during Q&A as $300 million, represents substantially stronger customer commitment than an unfinanced project pipeline. However, the initial approximately 500 MW energy services agreement remains targeted for execution by December 2026, project financing remains prospective, and energization is scheduled from Q4 2027 through Q1 2029. The announcement reduces commercial-development risk without eliminating contractual, construction, financing, or operating risk.
The operating quarter was less compelling than the headline 26% revenue growth suggests. Revenue of $1.196 billion exceeded the supplied Bloomberg consensus by approximately 1.4%, but adjusted EBITDA of $141.6 million missed by 2.8%. Adjusted EBITDA declined 6.3% sequentially despite revenue increasing 0.6%, and the EBITDA margin contracted to 11.8% from 12.7% in Q2 2026 and 13.5% in Q3 2025. Drilling-related scheduling gaps, cost inflation, and higher overhead prevented modest pricing improvement from translating into stronger profitability. The quarter supports an improving utilization and pricing environment, but not yet a sustained recovery in margins.
The most consequential financial development is the transition from equipment procurement funded at the corporate level toward customer-supported, project-financed infrastructure development. That transition is occurring against a substantially reduced cash balance. Cash declined from $555.4 million at June 30 to $119.0 million at September 30, while quarterly net capital expenditures reached $621.9 million. The expected $300 million customer advance materially improves the Q4 funding bridge, but it represents cash collected against future services, not incremental lifetime revenue or permanent equity capital. Successful conversion of the development agreement into financeable ESAs is therefore central to both the growth thesis and balance-sheet protection.
The appropriate investment stance is HOLD, with a more constructive view of the power opportunity but insufficient evidence to underwrite the full 3 GW deployment plan at mature infrastructure valuations. The strongest near-term catalysts are receipt of the customer advance, execution of the initial ESA, disclosure of counterparty support and project economics, and committed project financing. Aggressive accumulation based solely on the 1.2 GW headline would overstate the degree of de-risking. Conversely, treating Liberty solely as a pressure-pumping company would disregard a materially improved commercial pathway into long-duration power infrastructure.
QUARTERLY PERFORMANCE AND EXPECTATIONS
The detailed earnings release provides a more precise assessment than the rounded call figures. Q3 revenue was $1,196.2 million, compared with $1,188.6 million in Q2 2026 and $947.4 million in Q3 2025. Adjusted EBITDA was $141.6 million, compared with $151.1 million sequentially and $127.7 million a year earlier. Adjusted net income was $9.8 million, down 32.0% sequentially from $14.3 million but improved from an adjusted loss of $9.5 million in Q3 2025. The result was a modest revenue beat accompanied by weaker-than-expected conversion of revenue into earnings.
Against the supplied Bloomberg consensus of $1.18 billion in revenue and $145.7 million in adjusted EBITDA, Liberty generated approximately $16.2 million more revenue but $4.1 million less EBITDA. The implied consensus EBITDA margin was approximately 12.3%, about 51 basis points above the reported result. This is a more informative measure of the earnings shortfall than revenue growth alone. Additional activity and pricing were insufficient to offset the combined effects of scheduling inefficiencies, input costs, and overhead.
Reported adjusted EPS of $0.06 was effectively in line at headline rounding precision with the supplied $0.064 consensus, although numerically below it. The separate adjusted net income estimate of $14.5 million implies a much larger 32.7% shortfall. These consensus figures do not reconcile using Liberty’s approximately 167.0 million adjusted diluted shares: $0.064 multiplied by that share count implies approximately $10.7 million, not $14.5 million. Different estimate populations, definitions, or update timing may explain the discrepancy, but the available information does not establish which. The defensible conclusion is a modest EBITDA miss and approximately in-line rounded EPS, rather than an internally consistent 33% earnings miss across all measures.
The sequential operating bridge is particularly revealing. Revenue increased $7.6 million, while costs of services, excluding depreciation, increased $14.8 million and G&A increased $2.3 million. The contribution remaining after service costs declined from $208.3 million to $201.1 million. That margin fell from 17.5% to 16.8%. Consequently, the weakness was not confined to higher corporate spending; profitability deteriorated within the revenue-to-service-cost relationship before overhead.
EARNINGS QUALITY AND ACCOUNTING DISTINCTIONS
The $39.1 million GAAP net loss should not be interpreted as a comparable deterioration in operating cash generation. It included $62.9 million of investment losses, described on the call as unrealized fair-value losses on non-core equity investments. Q2 had included $42.9 million of investment gains, producing a $105.8 million sequential swing in this line alone. The company’s investment carrying value declined from $191.3 million to $127.3 million. These marks remain economically relevant to asset value, but they should be separated from the earnings capacity of completions and power services.
The distinction between adjusted EBITDA and adjusted net income also matters. The EBITDA reconciliation adds back $10.0 million of total stock-based compensation, whereas the approximately $5 million cited in the call’s G&A discussion refers only to the compensation included in that expense category. Total equity compensation was therefore approximately double the G&A-only figure. Adjusted EBITDA also removes asset-disposal gains and losses, while the adjusted net income reconciliation does not remove those items. The measures cannot be compared as though their adjustment policies were identical.
An operating earnings measure calculated as adjusted EBITDA less total stock compensation and depreciation was approximately $17.9 million in Q3, versus $27.0 million in Q2. This analyst-calculated measure removes the transaction and disposal distortions affecting reported operating income. Reported operating income actually increased from $12.7 million to $19.3 million, largely because Q2 included transaction costs and asset-disposal losses that did not recur on the same basis. The underlying sequential earnings trajectory was weaker than that GAAP operating-income comparison suggests.
Depreciation of $113.7 million absorbed approximately 80% of adjusted EBITDA. The resulting gap between EBITDA and equity earnings is important for valuation: an apparently moderate EBITDA multiple does not automatically translate into an attractive distributable-cash yield. Depreciation is not a precise measure of maintenance capital requirements, but the business remains asset intensive, and management continues to fund equipment replacement and technology upgrades.
The year-over-year recovery in adjusted net income also benefited materially from lower depreciation and interest expense. Depreciation declined by $9.3 million and net interest expense declined by $5.0 million relative to Q3 2025. Those combined improvements account for more than half of the approximately $26.5 million increase in adjusted pretax income derived from the company’s reconciliation. The move from an adjusted loss to an adjusted profit is genuine, but it is not solely evidence of stronger operating margins.
HISTORICAL CONTEXT
The longer historical comparison tempers the recovery narrative. In Q3 2024, Liberty generated $247.8 million of adjusted EBITDA on $1.139 billion of revenue, an EBITDA margin of 21.8%. Q3 2026 revenue was approximately 5.1% higher, but EBITDA was 42.8% lower. Q3 2023 produced $319.2 million of EBITDA on $1.216 billion of revenue, a 26.3% margin. Current revenue is therefore close to earlier high-earnings periods, while profitability remains substantially depressed. Business mix and investment spending have evolved, but revenue scale alone is clearly not a sufficient proxy for earnings recovery.
The year-to-date figures reinforce that conclusion. Revenue increased 14.8% to $3.406 billion during the first 9 months of 2026, while adjusted EBITDA declined 12.2% to $418.6 million. The corresponding EBITDA margin fell from 16.1% to 12.3%. Q3’s positive year-over-year EBITDA growth represents improvement against a weak comparison, not evidence that the full-year earnings trajectory has normalized. Even if Q4 EBITDA merely matched Q3, full-year EBITDA would be approximately $560.3 million, still 11.7% below 2025’s $634.1 million.
The latest release reported trailing adjusted pretax return on capital employed of approximately 2%. That figure is depressed by capital committed before the associated power assets produce earnings, but it remains the current enterprise-level return outcome. It should not be conflated with management’s high-teens prospective project IRRs, which use different cash-flow timing, measurement conventions, and asset populations.
GUIDANCE: WHAT CHANGED AND WHAT DID NOT
The clearest numerical guidance item was the reaffirmation of approximately $1.5 billion of 2026 capital expenditures. This compares with approximately $1.0 billion maintained on the April 2026 call and raised to $1.5 billion on the July call, primarily because of larger deposits for long-lead power equipment. The October message was therefore unchanged relative to July, but still approximately 50% above the earlier annual plan. The absence of another increase is modestly reassuring; it does not reverse the substantial escalation in the year’s capital commitment.
The Q4 operating outlook improved qualitatively relative to July. On the Q2 call, management said it was too early to assess Q4 seasonality because private operators could respond quickly to changes in commodity prices. The current call indicates continued demand, no evident customer budget exhaustion, and completion work deferred from Q3. Michael Stock consequently described an expected “slightly smaller-than-normal seasonal breakdown for Q4.” This is a more constructive demand assessment, but not numerical revenue or EBITDA guidance.
Management explicitly declined to endorse the low-single-digit revenue decline proposed by an analyst. Ron Gusek stated, “we’re not prepared to give a specific number around that.” Neither that analyst’s revenue assumption nor a particular decremental margin should therefore be represented as company guidance. Historical seasonality is also variable: Q4 2025 revenue increased 9.6% sequentially and EBITDA increased 23.4%. A generic seasonal decline is not a reliable substitute for a customer-level activity forecast.
The 2027 completions outlook became more confident, but remains conditional. July commentary already expressed a positive longer-term view, while emphasizing macroeconomic uncertainty and customer caution. October added evidence of tighter equipment availability, substantial progress through the RFP season, and a stronger forward oil curve. Management cited 2027 oil prices above approximately $85 as improving customers’ hedging opportunities. Nevertheless, Gusek explicitly rejected the implication that a return to mid-cycle economics should be assumed for 2027. The change is better visibility into modest pricing improvement, not a quantified earnings upgrade.
Power-return targets remained broadly unchanged. July commentary specified a 17%-18% unlevered return and a 5-6-year cash payback. October reiterated high-teens returns and clarified an approximately 5-year payback for a 15-year ESA, potentially extending toward 6 years for a 20-year agreement. The approximately 3 GW capacity objective through 2029 also remained intact, with no additional capacity announced. The material change was commercial progress toward deployment, not a higher capacity target or a higher return hurdle.
The expected tax expense rate for the remainder of 2026 declined modestly from approximately 25% on the July call to approximately 24%. The expectation of no material 2026 cash tax payments was unchanged. No numerical 2027 revenue, EBITDA, or capital expenditure guidance was provided.
COMPLETIONS: TIGHTER CAPACITY, BUT STILL LIMITED MARGIN CAPTURE
The central operating distinction is between utilization strength and pricing power sufficient to expand margins. Management estimated that improved activity had absorbed approximately 15-18 incremental industry frac crews, leaving limited immediately available capacity. Gusek stated, “Our calendar is full.” Most Liberty fleets already have identified customers for 2027, and some customers continued the relationship without a formal competitive RFP. These observations support utilization visibility and customer retention.
They do not establish non-cancellable backlog or a guaranteed pricing outcome. On the July call, management indicated that take-or-pay arrangements were not generally its preferred commercial approach. A full calendar therefore should not be assigned the same certainty as a long-term infrastructure contract. Customer drilling schedules, commodity economics, weather, and operational disruptions remain relevant even when anticipated utilization is high.
The Q3 drilling delays illustrate that distinction. Accelerated Q2 completions consumed previously drilled but uncompleted inventory faster than drilling could replace it. In several cases, Liberty caught up with the drilling program and lacked an alternative location for the affected fleet, creating unexpected calendar gaps. Management characterized this as unusual and expects some displaced work to occur in Q4. That explanation is operationally plausible, but the financial impact was not quantified. A modeled add-back for “temporary delays” would therefore be speculative.
The deeper implication is that greater completion efficiency increases dependence on adequate well inventory and coordinated drilling schedules. Strong customer demand does not necessarily translate into uninterrupted billed activity. The relevant monitoring variables are not simply rig count and contracted fleets, but available completion-ready wells, customer scheduling buffers, fleet relocation flexibility, and utilization actually realized.
Pricing should improve gradually rather than immediately across the entire fleet. Contracts can reset quarterly, semiannually, or annually, and premium fleets surrendered less price during the downturn than conventional diesel equipment. That resilience supports downside protection, but it can also limit the percentage rebound relative to lower-quality competitors. Liberty can outperform through utilization, execution, and customer retention without necessarily displaying the industry’s largest headline price increases.
Management’s cost commentary was constructive but incomplete. Tariff-related and lubricant cost increases were described as largely stabilized, and Gusek indicated that much of the earlier inflation had probably been offset. Labor and trucking remain the principal prospective pressures, partly because data-center construction competes for overlapping resources. No quantified inflation hurdle was supplied. Consequently, gross price increases cannot yet be converted reliably into net EBITDA improvement.
At the current quarterly revenue level, a sustained 100-basis-point improvement in EBITDA margin would add approximately $12 million of quarterly EBITDA, or $48 million annually. That sensitivity is meaningful relative to current profitability. However, a 1% increase in the existing service-cost base would add approximately $10 million of quarterly expense. These illustrative sensitivities demonstrate why pricing recovery must be evaluated net of inflation and operating inefficiency, rather than as a standalone bullish indicator.
NATURAL GAS TECHNOLOGY AND THE DIVISION OF CUSTOMER VALUE
Natural gas represented more than 60% of total fuel consumed across Liberty’s fleets during the quarter. Management estimated annualized customer fuel savings exceeding $1 billion and described approximately $50 million of potential annual savings when an individual customer moves from diesel to natural-gas-powered equipment under the prevailing fuel-price relationship. These are estimates of customer economics, not Liberty revenue or EBITDA.
The investment value is principally improved equipment utilization, customer retention, and a stronger basis for negotiating returns on technology investment. Management continues to target less than a 3-year cash payback on next-generation frac equipment. Fuel savings can allow Liberty to raise its service price while still reducing the customer’s total well cost. That is a more durable commercial proposition than demanding higher prices without an offsetting productivity benefit.
The monetization ceiling remains market determined. Gusek explicitly cautioned, “there is still a limit beyond which we cannot go.” Competitors also offer gas-powered equipment, customers retain negotiating power, and the diesel-to-gas spread can narrow. The reported $1 billion of customer savings should therefore not be treated as a pool of earnings that Liberty can capture at an arbitrary percentage.
There is also a strategic interaction between the businesses. Expanding gas-fired power demand can support natural gas drilling and completion activity, while potentially increasing delivered gas costs and competing for labor, transportation, and equipment. The portfolio does not benefit uniformly from every aspect of AI infrastructure growth. Contractual fuel pass-through and operational efficiency will determine how much of that growth becomes shareholder value.
THE 1.2 GW AGREEMENT: MATERIAL VALIDATION, NOT FULLY CONTRACTED BACKLOG
The development agreement represents a meaningful progression from equipment reservations and prospective projects toward customer-backed deployment. It includes substantive commercial terms, an expected significant cash payment before ESA execution, a targeted first approximately 500 MW ESA by December, and a phased energization schedule. Stock stated that “all the major commercial terms are agreed upon,” with remaining work concentrated on legal drafting and site-specific requirements.
The distinction between a development agreement and an executed ESA remains essential. The initial 500 MW represents approximately 42% of the announced 1.2 GW program and approximately 17% of Liberty’s 3 GW deployment objective. The remaining approximately 700 MW is expected to be contracted through additional building- or site-specific ESAs. Management described standardized terms as reducing the effort required for subsequent agreements, but no complete signing schedule was disclosed.
The phased structure is commercially logical. Data-center campuses are built in large increments, and separate agreements can align power commitments with individual buildings, financing packages, and permits. It also means that later phases remain exposed to customer construction decisions and evolving compute demand. Agreement on a framework does not guarantee the timing or completion of every phase.
The counterparty remains unidentified. Management emphasized financial quality and financing suitability, but that is not equivalent to disclosure of an investment-grade obligor or an unconditional guarantee from a large public technology company. An AI laboratory, an infrastructure platform, a data-center owner, and a financing vehicle can have materially different credit profiles. The actual contractual obligor, guarantee package, termination rights, and collateral arrangements are more important to bankability than the “frontier AI” description.
Earlier announcements also require careful classification. The January Vantage agreement contemplated up to 1 GW over approximately 5 years, including a 400 MW reservation for 2027. Combining that reservation with the new 1.2 GW framework produces 1.6 GW, or approximately 53% of the 3 GW objective, but not 1.6 GW of disclosed fully executed long-term ESAs. Earlier 330 MW reservations, the PowerBridge campus opportunity, and broader site-development figures should not be added mechanically without confirming overlap and contract status.
Management’s statement that its largest 8 opportunities exceed available generation capacity supports the existence of a substantial commercial pipeline. It does not establish conversion probability, contract profitability, or protection against correlated cancellations across AI customers.
THE $300 MILLION PREPAYMENT: FUNDING BENEFIT AND FUTURE CASH OBLIGATION
The capacity prepayment is arguably the most important incremental detail from Q&A. Management initially described the amount as “hundreds of millions of dollars” and subsequently identified $300 million. The payment applies to the entire 1.2 GW relationship, rather than exclusively to the first 500 MW project. Gusek also clarified that receipt is “not contingent on execution of the ESA.”
The payment has real evidentiary value. A substantial cash commitment before completion of final documentation is stronger commercial support than an expression of interest or an unbacked reservation. It also reduces the immediate need to fund long-lead equipment solely through corporate liquidity.
The accounting and economic treatment is equally important. Management expects the payment to be recorded as deferred revenue and credited against capacity payments over approximately the first 5 years of the contracts. It is not Q4 operating earnings. Once services are delivered, the associated revenue can be recognized without equivalent contemporaneous cash collection because the cash was received earlier.
Across the full program, $300 million equates to approximately $250 per kW. A simple 5-year allocation corresponds to approximately $60 million annually, or $50 per kW-year, although actual recognition and payment credits will depend on phased commencement dates and final contractual allocation. Those figures describe the timing of customer payments, not incremental project profitability.
The advance must not be counted simultaneously as free corporate cash, additional project revenue, and an unchanged stream of future cash capacity fees. Nor can it automatically be assumed to reduce required equity while leaving an 80% project-debt allocation unchanged. Lenders will evaluate the remaining cash receivables, any refund obligations, restrictions on use, and the resulting debt-service coverage.
Refundability and termination provisions were not disclosed. A non-refundable advance would offer stronger downside protection than a payment that becomes repayable after a permitting failure, cancellation, or missed delivery milestone. Until those terms are available, the advance is best viewed as a material funding bridge and commitment signal, not a complete transfer of development risk to the customer.
PROJECT ECONOMICS AND CAPITAL INTENSITY
Management’s reiterated high-teens return target is encouraging because it applies to the full deployed scope, rather than generation equipment alone. Stock emphasized, “we do not dilute our capital returns.” The intended commercial principle is that additional balance-of-plant complexity should command additional compensation rather than simply increasing the investment denominator.
That principle is not yet a verified outcome. The current call did not disclose project-specific capacity fees, construction costs, operating expense, maintenance reserves, availability guarantees, or cash-flow schedules. Management described complex installations approaching approximately 2 times the cost of generation equipment after including the broader facility. That is a balance-of-plant multiplier, not a disclosed $2 million-per-MW price for this agreement.
The July call supplied a useful, but non-project-specific, reference point: approximately $5 billion-$6 billion to develop 3 GW, including inflation and associated infrastructure. Applying that portfolio average mechanically implies approximately $1.67 million-$2.0 million per MW. On that assumption, the new 1.2 GW program would require approximately $2.0 billion-$2.4 billion, and an initial 500 MW phase approximately $833 million-$1.0 billion. These are analytical scale estimates, not newly issued project guidance, and could change with redundancy, storage, power-quality requirements, and site conditions.
At the stated target of approximately 80% debt and 20% equity, that illustrative 1.2 GW capital requirement would imply $1.6 billion-$1.92 billion of project debt and $400 million-$480 million of equity before determining the treatment of customer advances. Across the full 3 GW portfolio, the analogous equity requirement would be approximately $1.0 billion-$1.2 billion. Project financing substantially reduces the corporate capital burden relative to outright ownership funded entirely with equity, but does not eliminate it.
The payback and IRR targets are broadly compatible under favorable assumptions. A simplified investment generating annual cash equal to 20% of initial capital for 15 years, with no residual value, produces an unlevered IRR of approximately 18.4%. However, delaying all operating cash flows by 1 year after the capital has already been spent reduces that simplified return to approximately 15.3%. A 10% capital overrun without repricing reduces it to approximately 16.3%. These are sensitivities, not Liberty forecasts, but they illustrate how delivery timing and cost protection can determine whether the stated hurdle is achieved.
Higher project leverage can amplify equity returns, but also increases sensitivity to financing terms. With debt equal to 80% of project capital, a 100-basis-point increase in borrowing cost adds annual interest equal to approximately 4% of the initial equity contribution, before amortization and other effects. A high-teens unlevered project target is therefore insufficient to establish the eventual equity return without knowing debt pricing, amortization, reserve requirements, and distribution restrictions.
LIQUIDITY AND THE CAPITAL-RECYCLING MODEL
Liberty ended Q3 with approximately $1.2 billion of net debt and $669 million of total liquidity, including approximately $550 million of undrawn revolving availability. The unused revolver provides meaningful protection, but cash itself had fallen by $436.4 million during the quarter. The expected customer advance is arriving at an important point in the spending cycle.
On a consistent net-capital-spending assumption, the $1.5 billion annual plan less $976.8 million spent through September leaves approximately $523.2 million for Q4. Starting cash of $119.0 million plus the expected $300 million advance totals approximately $419 million. Adding approximately $16.3 million of quarterly dividends implies that about $120.5 million of additional cash generation would be needed to cover those uses before other financing outflows and any desired ending cash balance. Timing differences and the spending definition can change that arithmetic, but the basic conclusion is that the advance does not independently fund the entire remaining annual program.
Management’s statement that no further Q4 financing is anticipated therefore depends on operating cash generation, payment timing, working capital, and receipt of the advance as expected. This is not evidence of an immediate liquidity crisis, given the available revolver. It is evidence that execution of the cash bridge matters and that “not capital limited” should not be interpreted as unlimited financial flexibility.
The assertion that completions generates positive free cash flow cannot be independently quantified from the current-quarter disclosures. Approximately $450 million of Q3 spending was associated with power-generation deposits, but the remaining capital spending also includes other power investments, digiFleets, maintenance, and additional projects. Subtracting the deposits from total capital expenditure does not isolate completions capital expenditure. The current release also does not provide a complete Q3 operating cash-flow reconciliation.
Historical consolidated cash generation demonstrates the importance of this distinction. For the first 6 months of 2026, the filed cash-flow statement reported $141.4 million of operating cash flow against $354.9 million of net capital expenditure, implying approximately negative $213.5 million of conventional free cash flow before dividends. Positive free cash flow within the base business can coexist with substantial consolidated cash consumption. Segment-level cash generation and corporate funding needs should be assessed separately.
The proposed capital-recycling process is economically coherent: corporate funds secure equipment; executed ESAs support project financing; project vehicles acquire or receive the assets; financing proceeds reimburse part of the corporate investment; and recovered cash funds subsequent projects. Its scalability depends on repeated successful financing closes. If an early project fails to obtain expected leverage or experiences material delays, the problem can propagate into funding for later projects.
CONVERTIBLE DEBT AND PROJECT FINANCING
The 0% coupon convertible financing was a significant funding advantage, but it was not costless. The first-half cash-flow statement shows $1.295 billion of convertible proceeds, $186.5 million spent on capped calls, and $36.8 million of debt-issuance costs. Subtracting those cash outlays leaves approximately $1.072 billion before repayment of existing debt and other uses. The capped-call and issuance expenditures together represented approximately 17.2% of gross convertible proceeds.
The approximately $65 and $72 figures referenced on the call are effective economic protection levels associated with capped calls, not the underlying initial conversion prices. The original financing releases specified initial conversion prices of approximately $34.50 for the 2031 notes and $37.44 for the 2032 notes, with capped-call limits of approximately $65.10 and $72.00. The structures mitigate dilution or excess conversion payments within their terms; they do not eliminate debt principal, all potential dilution, or the cost of the hedge.
The notes mature in 2031 and 2032, substantially earlier than the end of prospective 15-year power contracts beginning in 2027-2029. That maturity profile is manageable if commissioning and project capital recycling proceed as planned, but delays would reduce the operating history and cash generation available before corporate refinancing becomes relevant.
The project-financing timetable is now more specific. Management expects activity to launch in early 2027 and indicated that financing can take approximately 8 weeks to 3-4 months after ESA execution, depending on the structure and diligence requirements. A December ESA therefore does not automatically imply a January financing close. Independent engineering reports, permits, construction arrangements, insurance, and counterparty diligence remain substantive conditions.
The target 80% project leverage is also not a committed lender outcome. Reducing leverage from 80% to 70% would increase required equity by 50%, assuming unchanged project cost. At a $5 billion-$6 billion portfolio cost, that would increase equity requirements by approximately $500 million-$600 million. This sensitivity is more relevant than a generic statement that infrastructure capital is available.
Non-recourse financing limits contractual recourse under the eventual documents; it does not necessarily remove project debt from consolidated accounts or eliminate economic exposure. Ownership and control determine consolidation, while completion support, guarantees, reserve funding, and reputational considerations can preserve important corporate risks.
TECHNICAL DIFFERENTIATION AND EXECUTION RISK
Liberty’s strongest differentiation claim is integrated delivery rather than ownership of generation equipment alone. The proposed scope includes gas procurement and interconnection, generation architecture, controls, power quality, construction, operations, and eventual participation in grid markets. That approach can reduce interface risk for customers that historically relied on utilities to supply power.
The reported testing with the National Laboratory of the Rockies is technically relevant because it connected physical generation equipment and Liberty’s controls to a representative synthetic grid, rather than relying entirely on modeled equipment behavior. Management stated that the work supported its control methodology, applicable IEEE compliance, and operation across an islanded-to-grid-connected project lifecycle.
This is useful engineering evidence, but not proof of performance at a fully deployed 500 MW or 1.2 GW campus. The call did not disclose field availability, sustained transient-load performance, battery duration, reserve margins, black-start results, protection-coordination details, or quantified service guarantees. Successful hardware testing reduces a category of technical uncertainty; it does not establish commercial uptime over a 15-year term.
Multi-OEM procurement supports supply-chain access and reduces dependence on a single equipment supplier. It also increases integration, maintenance, spare-parts, and controls complexity. Liberty’s September 18 filing described supplier liability limits, force-majeure provisions, and termination charges for certain equipment commitments. The relationship between those protections and the eventual customer-facing service obligations will be important. Supplier compensation for delayed equipment may not cover the full economic consequences of a missed data-center energization date.
The earlier disclosed procurement commitments also show that capital risk precedes fully contracted offtake. As of June 30, Liberty had approximately $1.3 billion of equipment supply contracts, followed by a separate approximately $801 million Caterpillar contract in July. These amounts should not be added to the broader deployment budget as incremental spending. They demonstrate the scale of committed procurement within that strategy. The September filing explicitly stated that its additional contract disclosures did not represent new capital commitments.
Permitting and local acceptance remain material constraints. Management has identified backup sites in different jurisdictions and believes capacity can be redirected if a primary location encounters opposition. This reduces single-site concentration risk, but relocation can still require revised gas arrangements, engineering, permits, construction schedules, and financing diligence. The protection is optionality, not immunity from delay.
The Wyoming Buffalo Run discussion further distinguishes development pipeline from near-term earnings. Management described an approximately 16-18-month permitting process and potential execution beginning in late 2028, extending into 2029 and 2030. The final hyperscale customer remains to be established. That opportunity should be treated as longer-dated development potential, not incremental contracted earnings in the immediate forecast.
VALUATION AND THE MARKET’S CURRENT UNDERWRITING
A Bloomberg snapshot at 17:56 UTC on October 22 showed Liberty at $15.92, approximately 4.6% below the October 21 close of $16.69. This is an intraday observation, not a closing price, and does not isolate the effect of the earnings release from broader market influences.
Using approximately 163.2 million shares and the latest reported net debt produces a simplified equity value of approximately $2.6 billion and enterprise value of approximately $3.8 billion, before lease and non-core-investment adjustments. That corresponds to approximately 6.5 times trailing adjusted EBITDA of $576.1 million and 6.7 times annualized Q3 EBITDA of $566.5 million.
Those multiples neither establish excessive valuation nor prove that power optionality is free. Applying an illustrative 5-6 times multiple to annualized Q3 consolidated EBITDA as a rough proxy for legacy-business earning power assigns approximately $2.8 billion-$3.4 billion of enterprise value. The residual is approximately $0.4 billion-$0.9 billion. This is a valuation diagnostic, not a formal sum-of-the-parts analysis: consolidated EBITDA includes existing power-related operations and development costs, and the calculation omits several balance-sheet adjustments.
The central valuation issue is the present value of power cash distributions after all remaining investment, project debt service, maintenance, taxes, and restrictions. Assigning a mature infrastructure multiple to prospective project EBITDA while subtracting only current corporate debt would overstate equity value. It would fail to account adequately for the capital still required to create those earnings.
The dividend increase is a modest confidence signal rather than a major alteration in capital allocation. Raising the quarterly payment from $0.09 to $0.10 increases annualized cash distributions by approximately $6.5 million at the current share count, to approximately $65 million. The indicated yield at $15.92 is approximately 2.5%. That incremental cash commitment is small relative to the power-development program and does not materially de-risk its financing.
ILLUSTRATIVE OPERATING SCENARIOS
A base case assigned a 50% probability assumes the first approximately 500 MW ESA is executed around year-end, project financing follows during early 2027, and initial power remains broadly on schedule for late 2027. Completions utilization stays strong, with gradual net pricing improvement but no return to historical peak margins. Illustrative 2027 consolidated revenue of $4.8 billion and an EBITDA margin of 13.5% would produce approximately $648 million of EBITDA. This assumes limited initial power contribution, consistent with management’s earlier expectation that material income-statement impact begins in 2028.
A bull case assigned a 25% probability assumes timely execution of additional ESAs, financing close to targeted leverage, manageable construction costs, and stronger conversion of completions pricing into margins. Illustrative 2027 revenue of $5.1 billion and an EBITDA margin of 15.5% would produce approximately $791 million of EBITDA. Even that margin remains substantially below Q3 2024 profitability. Equity upside would depend additionally on the market assigning greater value to a demonstrably financeable power portfolio, rather than simply extrapolating the completions recovery.
A bear case assigned a 25% probability assumes a 6-12-month delay in material power milestones, weaker financing terms, and a completions environment in which cost inflation or customer activity reductions offset pricing. Illustrative 2027 revenue of $4.4 billion and an EBITDA margin of 9.5% would produce approximately $418 million of EBITDA. Lower project leverage would increase corporate equity requirements precisely when the base business generates less cash. The critical downside mechanism is therefore a combined earnings and funding squeeze, not merely a lower completions multiple.
These judgmental scenarios imply probability-weighted 2027 EBITDA of approximately $626 million, roughly 11% above annualized Q3 performance. They are analytical sensitivities, not management guidance, consensus estimates, or statistically calibrated probabilities. A precise equity-price target remains insufficiently supported without project-level cash flows, final financing terms, and clarity on future corporate funding requirements.
CATALYSTS, DISCONFIRMING EVIDENCE, AND PORTFOLIO IMPLICATIONS
The immediate catalyst sequence is unusually concrete. Q4 should establish whether the customer advance arrives on time. December should establish whether the initial ESA is executed. Early 2027 should establish whether financing progresses from adviser discussions to binding commitments and cash reimbursement. Subsequent disclosures should show whether the remaining approximately 700 MW moves into executed agreements and whether the original energization schedule remains credible.
The completions thesis requires separate validation. Q4 should indicate whether deferred work is recovered rather than lost, while early 2027 should reveal whether RFP pricing translates into better realized margins. Continued full utilization without margin improvement would weaken the assertion that equipment scarcity is producing attractive economic recovery. Rising revenue accompanied by persistently weak incremental profitability would remain a warning signal.
The power thesis would be materially impaired by failure to receive the advance as expected, a substantial unexplained ESA delay, weak counterparty guarantees, refund provisions that substantially limit the advance’s protection, leverage materially below the target, or capital inflation that cannot be passed through. Repeated changes in site selection or energization dates would also undermine the speed-to-power value proposition.
Liberty’s portfolio characteristics are changing, but diversification should not be overstated. The company increasingly combines oilfield-service cyclicality with AI infrastructure spending, long-duration project valuation, construction execution, and financing-market exposure. These risks are not independent. An economic slowdown can weaken upstream activity and infrastructure funding simultaneously, while AI construction can raise labor and logistics costs for the completions business. Exposure should therefore be assessed against both energy-service holdings and existing AI infrastructure, data-center, and private-credit-sensitive positions.
The evidence supports maintaining exposure selectively rather than establishing a full-sized infrastructure-growth position before contract and financing verification. An illustrative event-driven allocation ceiling of 0.5%-1.0% of portfolio NAV, paired with a 20% price-risk budget, corresponds to approximately 10-20 basis points of intended portfolio loss. At the observed $15.92 reference price, that price-risk level is approximately $12.75. Such a limit cannot protect against gaps, and a broken contract or funding thesis warrants reassessment regardless of the share price. The appropriate catalyst-review horizon is approximately 3-6 months; the underlying operating-investment horizon extends through 2027-2029.
The decisive investment distinction is between improving probability and proven value creation. The quarter materially improved the probability that Liberty can convert its power strategy into funded infrastructure assets. It did not yet demonstrate the contracted economics or cash distributions required to capitalize the entire opportunity at mature valuations. Meanwhile, the existing business remains profitable but substantially below earlier margin levels. The next stage of the thesis depends on contracts, financing, and realized operating margins, not additional pipeline announcements alone.
SOURCE BASIS
Financial comparisons are drawn from Liberty Energy’s October 21, 2026 and July 22, 2026 earnings releases, the January 28, 2026 full-year release, the October 16, 2024 release and its historical comparative figures, the June 30, 2026 Form 10-Q, and the September 18, 2026 equipment-contract filing. Guidance comparisons incorporate the April 23 and July 23, 2026 calls. Current-quarter quotations are from the October 22, 2026 final transcript. Consensus figures are from the accompanying Bloomberg earnings notice. Convertible terms are supported by the February 4 and March 26, 2026 financing releases and the subsequent quarterly filing. Market prices are from Bloomberg’s October 22 intraday snapshot and October 21 historical close. Project extrapolations and probability cases are explicitly analytical assumptions rather than company forecasts.
COMPANY EMPLOYEES ON THE CALL
• Ron Gusek, Chief Executive Officer, President and Director. • Michael Stock, Chief Financial Officer and Treasurer. • Anjali Voria, Vice President of Investor Relations, as identified in the call introduction and issuer release; the transcript participant header lists Director of Investor Relations.
RESEARCH ANALYSTS ON THE CALL
• Alexa Breno, Goldman Sachs. • Arun Jayaram, JPMorgan. • Dan Kutz, Morgan Stanley. • Derek Podhaizer, Piper Sandler. • Eddie Kim, Barclays. • Jeff LeBlanc, TPH Research. • John Daniel, Daniel Energy Partners. • Josh Silverstein, UBS. • Keith Mackey, RBC Capital Markets. • Marc Bianchi, TD Cowen. • Saurabh Pant, Bank of America. • Scott Gruber, Citigroup. • Stephen Gengaro, Stifel.
Key Read-Throughs
KEY READ-THROUGHS FROM LIBERTY ENERGY’S Q3 2026 EARNINGS CALL
Liberty’s call strengthens the investment case for the physical infrastructure required to deliver AI power, while challenging assumptions about how quickly developers and oilfield-service companies can convert strong demand into shareholder cash flow. The most actionable distinction is between suppliers receiving equipment deposits, integrated providers securing customer commitments, and asset owners still carrying construction and financing risk. In completions, scarce high-specification equipment is supporting utilization and pricing, but Liberty’s sequential margin contraction demonstrates that a full operating calendar does not guarantee earnings acceleration. The highest-conviction implications favor generation equipment, electrical infrastructure, integrated gas-to-power platforms, and technologically differentiated frac fleets. The clearest negatives concern leveraged service providers dependent on rapid margin recovery and upstream budgets assuming continued service-cost deflation. Magnitudes below refer to fundamental exposure, not projected share-price movements. Country designations refer to equity listing markets.
POWER GENERATION EQUIPMENT
EQUIPMENT SUPPLIERS RECEIVE ECONOMIC VALIDATION BEFORE POWER DEVELOPERS EARN THEIR RETURNS (READ-THROUGH 1)
Affected companies: Caterpillar (CAT: US) and Wärtsilä (WRT1V: Finland). Direction and magnitude: Positive; moderate for the relevant power-generation businesses, but limited immediate consolidated earnings impact from this announcement alone. Confidence is highest in improved order funding and execution visibility, not incremental order intake.
Liberty disclosed approximately $450 million of Q3 power-generation deposits and a customer capacity prepayment subsequently identified as $300 million. Management also reiterated confidence in obtaining the equipment required for approximately 3 GW of energization by the end of 2029. These statements support suppliers already embedded in Liberty’s procurement program. Caterpillar’s approximately $801 million supply agreement was disclosed previously, while Liberty’s Q2 release identified Wärtsilä among its contracted equipment suppliers. Neither relationship establishes which manufacturer will supply the newly announced 1.2 GW program.
The transmission mechanism is stronger customer funding behind existing equipment commitments. Liberty initially funded long-lead purchases through corporate convertible debt; customer advances and eventual project financing should reduce dependence on that finite corporate funding pool. Manufacturers can receive milestone payments before the power plants generate operating cash, while developers remain exposed to permitting, construction, and financing completion. The relative investment implication favors established equipment suppliers over treating every announced generation developer as an equivalent beneficiary.
The distinction between validation and new orders is critical. Asked about additional generation capacity, management stated, “We haven’t added or announced any additional capacity.” The announcement therefore does not justify adding another 1.2 GW to supplier order forecasts on top of previously secured equipment. The near-term catalyst is evidence that the initial ESA and financing convert procurement commitments into executable projects. The longer-duration benefit is equipment delivery followed by maintenance, parts, and service demand as the installed base operates. Commercial terms determine how much aftermarket value each supplier retains.
ELECTRICAL INFRASTRUCTURE
BEHIND-THE-METER GENERATION EXPANDS ELECTRICAL CONTENT RATHER THAN ELIMINATING IT (READ-THROUGH 2)
Affected companies: Eaton Corporation (ETN: US) and Schneider Electric (SU: France). Direction and magnitude: Positive; potentially material for their data-center electrical businesses over multiple years, with a modest immediate earnings read-through. Neither company was identified as a supplier to the announced Liberty project.
The supporting commentary is unusually important for assessing equipment content. Management explained that complex data-center installations can require total deployed capital approaching approximately 2 times the cost of generation equipment. Gusek emphasized “seamless coordination across generation, controls, customer load, and the broader electric grid,” alongside volatile AI loads and strict voltage and frequency requirements.
The transmission mechanism is additional demand for medium- and low-voltage distribution, switchgear, protection systems, power conditioning, UPS integration, and energy-management infrastructure. Moving generation behind the meter does not remove the need to distribute and stabilize electricity. It can add interfaces between engines, batteries, campus loads, and future grid connections. Eaton’s disclosed portfolio includes precisely these components, while Schneider’s recent medium-voltage and high-density power offerings address the same architectural requirements.
The non-obvious implication is that bypassing a utility interconnection queue need not reduce electrical infrastructure spending. It can shift spending from utility-owned infrastructure toward privately funded campus systems while increasing system complexity. However, the balance-of-plant multiplier also includes civil works, installation, gas infrastructure, and other costs. It cannot be translated directly into Eaton or Schneider revenue, nor treated as proof that electrical equipment content doubles.
Near-term trading relevance centers on order mix, backlog conversion, and customer demand for integrated systems rather than an immediate Liberty-linked earnings revision. The fundamental benefit develops through the 2027-2029 construction and commissioning cycle. Liberty’s proprietary controls also limit any assumption that an external supplier automatically captures the complete software and integration layer.
INTEGRATED DATA-CENTER INFRASTRUCTURE
SLB HAS A VERIFIED COMMERCIAL ROUTE INTO THE OPPORTUNITY, NOT MERELY AN AI ADJACENCY (READ-THROUGH 3)
Affected company: SLB (SLB: US). Direction and magnitude: Positive; meaningful strategic validation, but currently modest and unquantified at the consolidated earnings level.
Liberty repeatedly argued that customers want an integrated solution spanning gas supply, engineering, construction, power quality, operation, and eventual grid participation. Management also highlighted partnerships incorporating hybrid power systems, advanced energy management, and waste-heat recovery. The relevant confirmed relationship is the July 2026 agreement to form an alliance with SLB: SLB provides modular infrastructure, project execution capabilities, and international reach, while Liberty contributes generation, intelligent controls, and operational expertise.
The mechanism is improved access to projects where developers prefer a coordinated infrastructure package over separately procuring multiple systems. Liberty’s larger commercial commitment strengthens the credibility of the route to market that the alliance was designed to address. SLB also brings an existing delivery capability: its July announcement reported more than 1.3 GW of prefabricated modular data-center infrastructure shipped since April 2024. The exposure is therefore supported by operating activity, not solely a prospective diversification narrative.
The important limitation is that the call did not disclose an SLB purchase order, project revenue share, or mandatory participation in the 1.2 GW development. Liberty’s success cannot be booked mechanically into SLB backlog. The high-conviction positive is that integrated modular delivery is gaining commercial relevance and SLB has a documented relationship positioned to address it.
Near-term catalysts are project-specific scope awards and disclosure that SLB infrastructure is included in executed developments. Longer term, repeatable campus designs could improve manufacturing utilization, shorten installation cycles, and support international expansion. Relative to a large power-asset owner, an infrastructure supplier can participate without necessarily funding the entire generation asset throughout its operating life.
DISTRIBUTED POWER OPERATORS
LIBERTY VALIDATES PROPWR’S ADDRESSABLE MARKET, BUT ALSO RAISES THE STANDARD FOR BANKABLE PROJECTS (READ-THROUGH 4)
Affected company: ProPetro Holding (PUMP: US). Direction and magnitude: Positive for PROPWR’s commercial opportunity; potentially material over several years. The associated negative is a higher evidentiary threshold for assigning value to equipment reservations and unsigned projects.
The call provides stronger evidence of customer willingness to commit capital to independent power providers. Liberty’s customer is expected to advance $300 million before final ESA execution, while the prospective contracts contemplate approximately 15-year terms. Management said the prepayment is “not contingent on execution of the ESA.” This supports the proposition that power availability is sufficiently valuable for a sophisticated AI customer to commit funds well before energization.
ProPetro has a relevant, independently established operating platform rather than a hypothetical exposure. Its Q2 disclosures described PROPWR assets operating at a hyperscaler data-center site, approximately 350 MW committed under contract at that reporting point, and a Caterpillar framework supporting a much larger future equipment program. Those disclosures provide a credible basis for reading Liberty’s agreement as validation of the broader independent power-services model. They do not establish that ProPetro will receive equivalent pricing, advances, or financing terms.
The precise mechanism is greater acceptance of specialist power providers as long-duration counterparties, potentially improving customer willingness to sign contracts and lenders’ willingness to underwrite the resulting cash flows. The competitive implication is also important: Liberty’s claim of differentiated integration should not be interpreted as proof that the opportunity is exclusive. ProPetro already has operating evidence in the same broad market.
The negative qualification concerns capital intensity. Liberty’s targeted 80% project debt implies substantial remaining equity requirements, while customer advances reduce later cash collections as capacity fees are credited. ProPetro’s own financing arrangements and available liquidity must therefore be assessed separately; Liberty’s funding solution cannot simply be applied to PROPWR.
ProPetro’s October 28 earnings release is a concrete near-term catalyst for testing contract conversion, deployment, and financing progress. The larger fundamental benefit depends on converting reserved equipment into funded, operating assets. Capacity announcements without those steps deserve a lower valuation than executed contracts backed by demonstrable financing and customer credit.
NATURAL GAS INFRASTRUCTURE
THE CLEANER AI READ-THROUGH IS CONTRACTED GAS DELIVERY, NOT AN IMMEDIATE NATIONAL GAS-PRICE SPIKE (READ-THROUGH 5)
Affected companies: Kinder Morgan (KMI: US) and Williams Companies (WMB: US). Direction and magnitude: Positive; moderate and potentially durable for contracted infrastructure growth, but small near-term earnings impact from Liberty’s development alone.
Liberty described its offering as extending from gas supply and interconnection through generation and long-term operation. Management is already advancing gas supply, permitting, and construction planning for additional sites. It also emphasized demand growth from AI power consumption, while acknowledging that current North American gas markets remain balanced by record production and ample inventories.
The mechanism is demand for firm transportation, lateral pipelines, compression, metering, storage, and potentially integrated gas procurement. A data center that bypasses the electricity grid still requires dependable fuel delivery. The infrastructure opportunity therefore survives even if abundant production prevents a large increase in Henry Hub prices. Revenue supported by long-term transportation or service commitments can be more directly linked to this buildout than an unhedged commodity-price thesis.
The scale is locally meaningful but should not be overstated nationally. As an illustration, 1.2 GW operating at 85% utilization with an 8-9 MMBtu/MWh heat rate would consume approximately 0.19-0.21 Bcf of gas per day. These are assumptions, not Liberty operating guidance. Demand would also emerge in phases beginning in late 2027, rather than immediately.
Kinder Morgan’s exposure is supported by its existing network and current development activity. Its October 21 release disclosed additional Creekside Lateral phases backed by long-term agreements with data-center and industrial customers, with phased service expected in Q4 2026 and Q4 2027. This corroborates the same transmission mechanism, but no connection between Creekside and Liberty’s unnamed customer has been disclosed.
Williams has an additional competitive dimension. Its Power Innovation platform combines gas marketing, gathering, transportation, and on-site generation. Liberty’s emphasis on an integrated gas-to-power solution supports the value of those capabilities. Williams should therefore be viewed as both a potential beneficiary of gas demand and a competitor for integrated power opportunities, not automatically as Liberty’s supplier.
Near-term catalysts are transportation agreements, project sanctions, and financing commitments. The larger cash-flow contribution follows commissioning. Geography remains decisive: Texas, the broader Southern US, and alternative sites in other states create different infrastructure beneficiaries. The call does not support assigning all prospective gas demand to a particular pipeline corridor.
OILFIELD SERVICES
FUEL ECONOMICS FAVOR HIGH-SPECIFICATION FRAC FLEETS MORE THAN A BROAD INDUSTRY RE-RATING (READ-THROUGH 6)
Affected companies: ProPetro Holding (PUMP: US) and Patterson-UTI Energy (PTEN: US). Direction and magnitude: Positive; moderate for utilization, retention, and pricing resilience, with potentially greater relevance to their completions businesses than to diversified group earnings.
Liberty reported natural gas substitution exceeding 60% of fleet fuel consumption and estimated annualized customer savings above $1 billion. Management illustrated potential savings of approximately $50 million annually when a customer moves from diesel to natural-gas-powered equipment under prevailing conditions. It also estimated that improved demand had absorbed approximately 15-18 incremental industry frac crews and stated, “Our calendar is full.”
The transmission mechanism is a lower total completion cost for customers using efficient gas-powered equipment. That advantage can protect fleet utilization and allow service providers to negotiate higher compensation while preserving customer savings. ProPetro’s FORCE electric fleets and broader gas-burning equipment portfolio address this demand. Patterson-UTI’s NexTier operations also offer electric and dual-fuel fleets. The benefit is tied to the actual equipment and fuel configuration, not simply to being a pressure-pumping company.
The less obvious point is that the best fleets can win through utilization and customer retention before they exhibit dramatic price increases. Liberty indicated that advanced fleets surrendered less pricing during the downturn, so their recovery percentage may look smaller than that of conventional equipment. A weaker headline pricing rebound does not necessarily imply a weaker competitive position.
The key constraint is that customer fuel savings are not service-provider revenue. Gusek acknowledged that “there is still a limit beyond which we cannot go.” Rival technologies, customer bargaining power, and changes in diesel-to-gas economics limit monetization. Different gas-powered systems also have different efficiency and maintenance profiles; Liberty’s savings estimates should not be applied indiscriminately to peers.
The near-term catalysts are remaining 2027 RFP outcomes, realized utilization, and contract repricing. The fundamental shift is a continued migration of work toward equipment delivering the lowest all-in customer cost. This favors technology-specific exposure over an indiscriminate bet that every frac fleet will regain historical economics.
LEVERAGED OILFIELD SERVICES
FULL CALENDARS DO NOT RESOLVE THE CASH-FLOW PROBLEM FOR HIGHLY LEVERAGED OPERATORS (READ-THROUGH 7)
Affected company: ProFrac Holding (ACDC: US). Direction and magnitude: Negative for assumptions of rapid earnings and cash-flow normalization; potentially material because of financial leverage. This is a risk to recovery forecasts, not evidence of an imminent liquidity event.
The strongest supporting evidence is Liberty’s actual result. Revenue increased approximately 0.6% sequentially, but adjusted EBITDA declined 6.3%, and the EBITDA margin fell from 12.7% to 11.8%. Management cited drilling-related delays, cost inflation, and continuing labor and trucking pressure despite modest price improvement. It also explicitly resisted the suggestion that 2027 should be modeled as a return to mid-cycle economics.
The transmission mechanism is weaker conversion of pricing and utilization gains into cash available after maintenance spending and interest. High fixed operating costs make scheduling gaps expensive, while inflation absorbs part of headline price increases. Higher debt then magnifies the effect on equity cash flow and financial flexibility.
ProFrac is particularly exposed to that distinction. Its Q2 release reported approximately $1.08 billion of net debt, $69 million of adjusted EBITDA, and negative free cash flow, while guiding to stronger Q3 stimulation results from pricing and steady utilization. Liberty’s quarter demonstrates a credible industry-wide mechanism through which those favorable operating inputs can produce less profit than expected. ProFrac’s subsequent refinancing improved borrowing flexibility, but does not eliminate the need for sustained operating cash conversion.
The negative read-through is not that ProFrac lacks high-specification equipment. Its own disclosures describe fleet upgrades and demand for advanced assets. The issue is that technological investment, maintenance, and debt service must all be funded while the margin recovery remains incremental.
The near-term trading catalyst is whether ProFrac’s next results demonstrate the expected pricing conversion after costs and downtime. The longer-duration risk is a prolonged period in which EBITDA improves but free cash flow remains insufficient to reduce leverage meaningfully. Liberty’s performance supports a higher underwriting hurdle for leveraged recovery equities than for the strongest-balance-sheet suppliers benefiting from the same activity environment.
UPSTREAM OIL AND GAS
SERVICE-COST DEFLATION IS BECOMING A LESS RELIABLE INPUT TO 2027 SHALE BUDGETS (READ-THROUGH 8)
Affected companies: Diamondback Energy (FANG: US) and Permian Resources (PR: US). Direction and magnitude: Modestly negative for gross completion-cost assumptions and marginal well economics, holding commodity prices constant. The call does not establish a net earnings downgrade for either company, and neither was identified as the customer associated with a specific Liberty fleet.
Liberty described tight equipment availability, substantial progress securing 2027 fleet placements, and plans to seek price increases above inflation. Repricing can occur quarterly, semiannually, or annually. Management also identified labor and trucking as continuing cost pressures and linked those pressures partly to competition from data-center construction.
The mechanism is higher purchased-service cost within drilling and completion programs. If service prices rise, an operator must accept a larger capital budget, reduce activity, or offset the increase through productivity, procurement, and fuel savings. Large Permian operators have scale and negotiating advantages, but they remain exposed to the availability and cost of premium equipment and field logistics.
The cross-sector implication is that AI investment can raise shale-development costs through shared labor and transportation markets before it meaningfully increases gas consumption. Upstream portfolios can therefore acquire an indirect AI-related inflation exposure even without owning a data-center or power-development asset.
The offset is substantial and prevents an overly bearish interpretation. Gas-powered fleets can reduce fuel costs, and improved commodity hedging opportunities can strengthen overall well economics. Consequently, the high-conviction negative is narrower than a bearish upstream call: continued service-cost deflation should not be assumed automatically in 2027 capital-efficiency forecasts.
The near-term catalysts are producer budget announcements and disclosures separating service pricing, fuel costs, and operating productivity. The longer-duration implication is greater value for operators that secure efficient equipment and preserve supply-chain flexibility. Stronger oil realizations and higher service costs should be modeled separately rather than allowing the commodity benefit to obscure pressure on capital efficiency.
CROSS-PORTFOLIO CONCLUSION
The most defensible expression of the call is differentiated exposure to funded physical infrastructure rather than a broad AI-power or oilfield-services basket. Caterpillar and Wärtsilä have confirmed procurement relationships; Eaton and Schneider address the electrical content required by increasingly complex power architectures; SLB has a documented integration partnership; and Kinder Morgan and Williams have businesses capable of monetizing reliable gas delivery and integrated power demand. ProPetro has relevant exposure through both premium completions and distributed power, although those exposures are linked because completions cash generation helps fund power investment.
The strongest negative is the gap between demand visibility and cash-flow realization. That gap matters most for leveraged service operators and for valuations that treat development agreements as equivalent to financed, operating assets. The unnamed AI counterparty should not be attributed to a particular hyperscaler, and the announced generation capacity should not be translated into immediate semiconductor revenue or a blanket negative forecast for incumbent utilities. Those conclusions exceed the evidence.
Evidence limitation: prior-research recall was incomplete because retrieval timed out. These conclusions rely on the supplied transcript and directly checked public company disclosures rather than unverified prior research context.
Report record
- Sector
- Energy
- Fiscal period end
- September 30, 2026
- Report date
- October 21, 2026
- Analysis
- 6210 words
- Read-throughs
- 2989 words
- Content fingerprint (PDF)
e5da4e3081fe- Content fingerprint (analysis)
e9323867a7b6- Content fingerprint (read-throughs)
bf8c6dd03d6a
Prepared from the company's earnings release and earnings call transcript. Figures as reported by the company. For information only. Not investment advice.
More from Liberty Energy
No other reports yet.
More in Energy
Exceptional Margins Strengthen the Near-Term Outlook; Duration Decides the Rest
Better long-term visibility, not immediate earnings acceleration
Follow @AtlasPeakRes on X for new earnings reports as they publish.