An Internationally Led Recovery, Not Yet an Earnings Recovery
Earnings Reports
Kinder Morgan FQ3 2026 Earnings Report
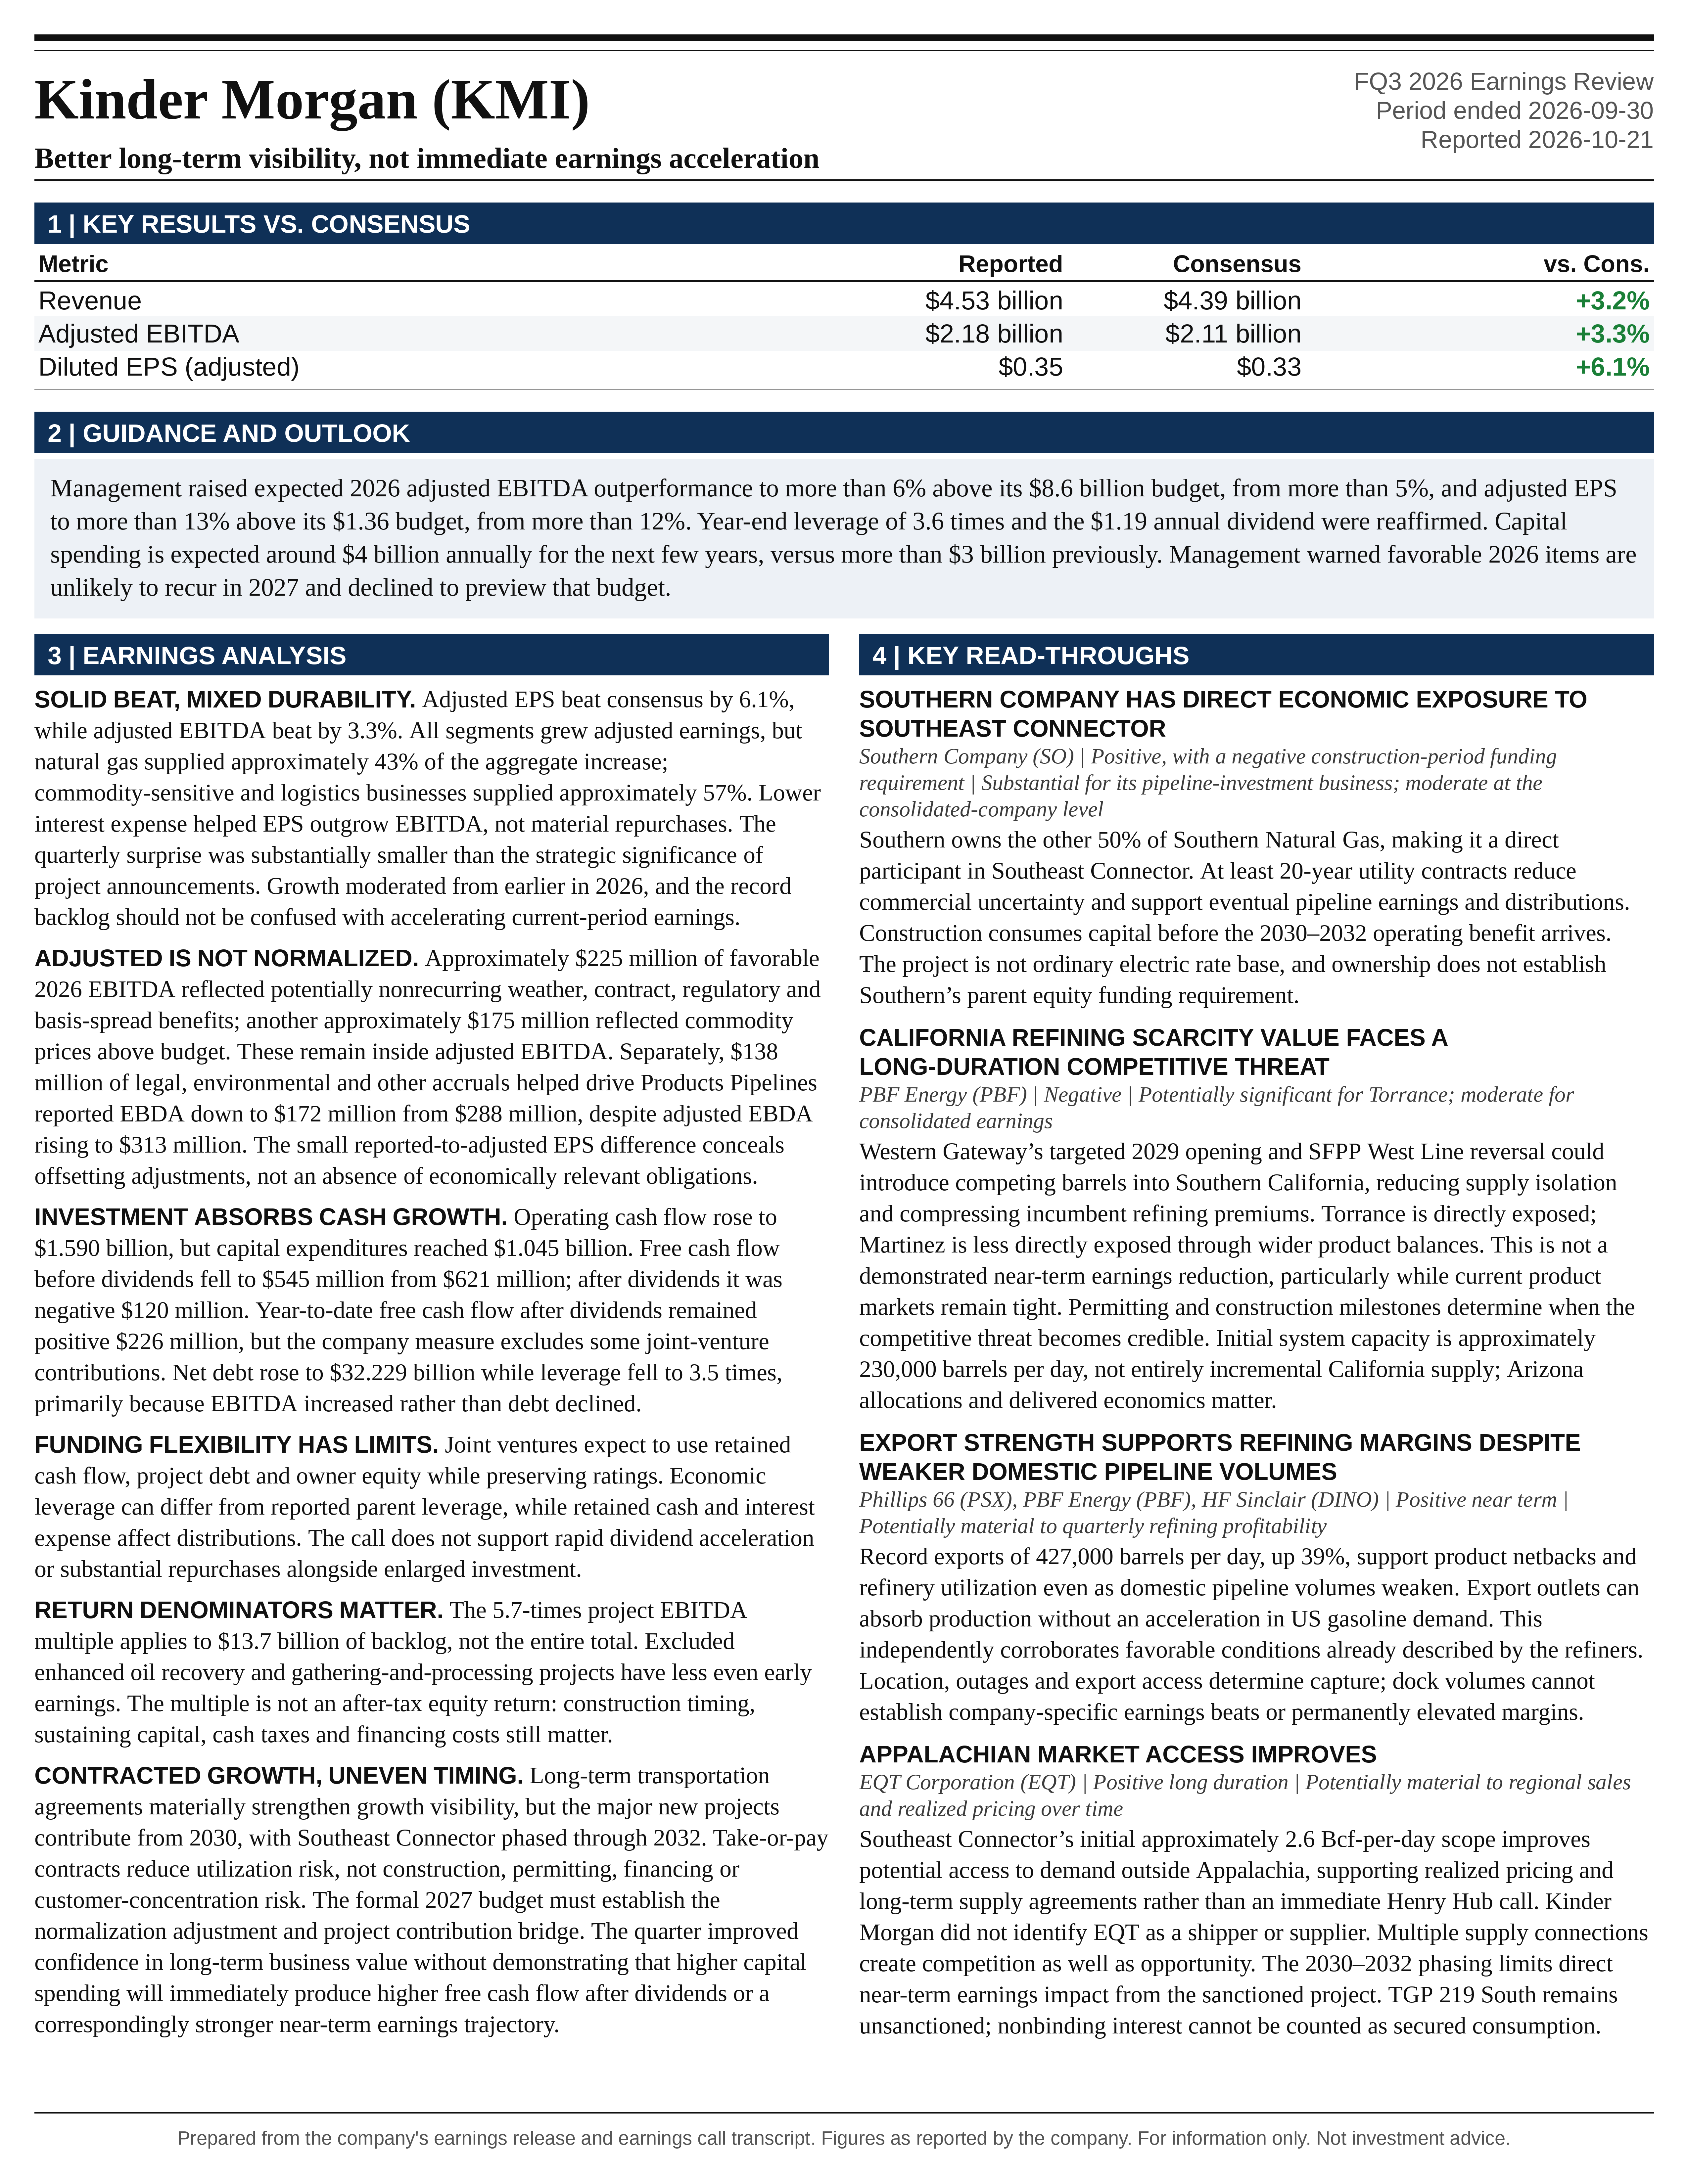
Kinder Morgan (KMI) FQ3 2026 earnings: Better long-term visibility, not immediate earnings acceleration. Full earnings analysis, key read-throughs, and the one-page exhibit from Atlas Peak Research.
Kinder Morgan (KMI)
Sector: Energy · FQ3 2026 · Period end September 30, 2026 · Reported October 21, 2026
Kinder Morgan’s Q3 2026 earnings call materially strengthened the credibility and duration of its contracted growth outlook, but did not establish a correspondingly stronger near-term earnings trajectory.
Download the one-page report (PDF)
View one-page exhibit
Download analysis (.md)
Download read-throughs (.md)
Post to X
One-Page Exhibit
Earnings Analysis
EXECUTIVE CALL SUMMARY: Kinder Morgan Inc. (10/21/26)
Kinder Morgan’s Q3 2026 earnings call materially strengthened the credibility and duration of its contracted growth outlook, but did not establish a correspondingly stronger near-term earnings trajectory. The principal positive development was the conversion of substantial prospective investment opportunities into sanctioned projects supported by long-term transportation agreements. The principal qualification was management’s explicit warning that unusually favorable 2026 conditions will create a difficult comparison in 2027. The earnings-based investment conclusion is constructive over a multiyear horizon, but more restrained over the next 12 months. Maintaining exposure is better supported than increasing exposure solely because of the record backlog.
Adjusted EPS of $0.35 exceeded the supplied Bloomberg consensus of $0.33 by 6.1%, while adjusted EBITDA of $2.18 billion exceeded the $2.11 billion estimate by 3.3%. Revenue of $4.531 billion exceeded the approximately $4.39 billion estimate by 3.2%. These were solid results, but the magnitude of the quarterly earnings surprise was substantially smaller than the strategic significance of the project announcements. The expansion backlog increased to $14.4 billion, including $13.2 billion of natural gas projects, and the expected annual capital-spending cadence increased to approximately $4 billion from the prior indication of more than $3 billion.
The most important distinction is between better long-term visibility and immediate earnings acceleration. Southeast Connector and Permian Link account for approximately $4.7 billion of Kinder Morgan’s new project commitments, but their contributions begin in 2030, with Southeast Connector entering service in phases through 2032. Meanwhile, approximately $225 million of favorable 2026 EBITDA reflects items management considers potentially nonrecurring, and another $175 million reflects commodity prices above budget. Those benefits remain in reported adjusted EBITDA. Consequently, the headline adjusted results are not equivalent to a fully normalized earnings base.
Management raised its expected 2026 outperformance against budget, but the increase was incremental rather than transformational. The July outlook called for adjusted EBITDA more than 5% above budget and adjusted EPS more than 12% above budget. The October outlook increased those thresholds to more than 6% and more than 13%, respectively. Applied mechanically to the stated budgets, the updated thresholds imply adjusted EBITDA above approximately $9.116 billion and adjusted EPS above approximately $1.5368. These thresholds are close to the supplied full-year consensus of $9.11 billion and $1.54. The release therefore represents a clear improvement against internal budget, but not a large new uplift against the market’s existing full-year expectations.
QUARTERLY PERFORMANCE AND THE COMPOSITION OF GROWTH
Q3 net income attributable to Kinder Morgan increased to $764 million from $628 million, while adjusted net income increased to $792 million from $648 million. Reported EPS increased to $0.34 from $0.28, and adjusted EPS increased to $0.35 from $0.29. Adjusted EBITDA increased by $189 million, or approximately 9.5%, from $1.991 billion. Revenue increased 9.3% from $4.146 billion.
The earnings improvement was not driven by a shrinking share count. Weighted-average shares increased modestly to approximately 2.227 billion from 2.224 billion. Adjusted net interest expense declined to $430 million from $445 million, providing a $15 million benefit, while depreciation, depletion, and amortization increased more slowly than EBITDA. The faster growth in adjusted EPS than EBITDA therefore reflects earnings leverage through relatively fixed expenses and lower interest costs, rather than financial engineering through material repurchases.
Growth remained healthy but moderated from earlier in 2026. Q2 adjusted EBITDA increased 12% year over year, compared with approximately 9% in Q3, while adjusted EPS growth moderated from 32% to 21%. Sequentially, Q3 adjusted EBITDA was slightly below Q2’s $2.199 billion, and adjusted EPS declined from $0.37 to $0.35. These comparisons do not establish operational deterioration because seasonality and discrete benefits differ across quarters. They do establish that the record backlog announcement should not be confused with accelerating current-period earnings.
Year-to-date adjusted EBITDA reached $6.918 billion, up 13% from $6.120 billion, while adjusted EPS increased to $1.20 from $0.91. The distinction between the 13% year-to-date EBITDA increase and the lower growth implied by the full-year guidance threshold is important: the updated outlook does not require the exceptionally strong earlier growth rate to persist through Q4.
All 4 segments generated higher adjusted earnings, but the source of incremental profit was more diversified than the natural gas investment narrative suggests. Natural Gas Pipelines adjusted segment EBDA increased by $86 million, Products Pipelines by $25 million, Terminals by $40 million, and CO2 by $48 million. Natural gas therefore represented approximately 43% of the aggregate $199 million increase in adjusted segment earnings. The other businesses collectively supplied approximately 57%. Consolidated adjusted EBITDA increased by slightly less because of corporate and other reconciliation items.
This matters for earnings quality. Natural gas infrastructure is the dominant source of future investment, but commodity-sensitive and logistics-related activities contributed disproportionately to Q3’s incremental earnings. A valuation framework that treats the entire quarterly improvement as equivalent to long-term contracted pipeline growth would overstate the durability of the current earnings mix.
ADJUSTED EARNINGS AND MATERIAL EXCLUDED ITEMS
The relatively small difference between reported EPS of $0.34 and adjusted EPS of $0.35 conceals significant offsetting adjustments. The October earnings release identifies $138 million of legal, environmental, and other accruals, $3 million of risk-management adjustments, a $71 million divestiture gain, and a $42 million income-tax adjustment. These netted to only $28 million.
The $138 million accrual is particularly relevant because it substantially affected Products Pipelines. That segment’s reported EBDA declined to $172 million from $288 million, despite adjusted segment EBDA increasing to $313 million. Thus, the statement that every segment grew is accurate for adjusted earnings, but not for reported segment performance.
Excluding separately identifiable legal and environmental accruals can improve operating comparability. It does not establish that the associated obligations have no economic cost. The release does not provide sufficient detail to determine the ultimate cash payments, timing, recoveries, or recurrence risk. Conversely, the $71 million terminal divestiture gain was appropriately excluded from adjusted earnings and should not be treated as recurring operating profitability.
There are therefore 2 separate normalization questions. The first concerns items excluded by the company from adjusted earnings. The second concerns unusual operating benefits that remain inside adjusted EBITDA, including weather, favorable basis spreads, contract settlements, and commodity pricing. The second question is more important for forecasting 2027.
2026 GUIDANCE: WHAT ACTUALLY CHANGED
The July 22 earnings release established a 2026 budget of $8.6 billion in adjusted EBITDA and $1.36 in adjusted EPS, with expected results more than 5% and more than 12% favorable to those budgets. The October release increased the expected outperformance to more than 6% and more than 13%.
Using the rounded budget figures, the EBITDA threshold increased from approximately $9.030 billion to $9.116 billion, while the EPS threshold increased from approximately $1.5232 to $1.5368. The changes in those mathematical thresholds are approximately $86 million and $0.0136 per share. Because both statements use “more than,” these calculations do not establish exact changes in management’s internal point forecasts.
The supplied Bloomberg notice lists $8.6 billion and $1.36 under “still sees” annual forecasts. Those figures are the budget reference points, not the best representation of management’s updated expected outcome. The issuer’s written release and the call explicitly anticipate results above those levels. Treating the budget figures as current expected results would materially mischaracterize the guidance.
Against consensus, the updated EBITDA threshold is only approximately $6 million above the supplied $9.11 billion estimate, while the EPS threshold rounds to approximately the supplied $1.54 estimate. The guidance message is therefore continued operational outperformance and modestly higher expectations, rather than a substantial positive reset to market forecasts.
Year-end leverage guidance remained 3.6 times. That is an improvement from the original 3.8-times budget, but it is unchanged from the July outlook. Similarly, the annual dividend remains $1.19 per share. The call’s reference to a quarterly dividend of “$29.75 per share” is a transcription error. The issuer release confirms $0.2975 per share, consistent with the $1.19 annualized amount.
The full-year thresholds also provide a useful Q4 earnings hurdle. Subtracting year-to-date EBITDA of $6.918 billion from approximately $9.116 billion implies Q4 EBITDA above approximately $2.198 billion. The comparable Q4 2025 figure was $2.271 billion, derived from the release’s full-year and year-to-date historical figures. The updated threshold therefore permits a Q4 outcome approximately 3.2% below the prior-year quarter. Similarly, subtracting year-to-date adjusted EPS of $1.20 from approximately $1.5368 implies a remaining-quarter threshold of approximately $0.337.
These are mechanical implications of rounded, open-ended guidance, not separate quarterly forecasts. Nevertheless, they demonstrate that management’s upgraded annual outlook does not require continued double-digit growth in the final quarter.
THE 2027 NORMALIZATION PROBLEM
The most consequential caution came from CFO David Michels: “some of those items that we experienced this year, it’s unlikely that we’re going to see those again next year.”
Management identified approximately $225 million of favorable 2026 contributions from Winter Storm Fern, extended Northeast cold weather, a Terminals contract buyout, a favorable FERC rate true-up, and unusually favorable Waha-to-Houston Ship Channel spreads. Commodity prices above the budget’s $60-per-barrel WTI assumption contributed another approximately $175 million.
Together, these amounts total approximately $400 million. Relative to the roughly $516 million EBITDA uplift represented by the 6% threshold, they account for approximately 78%. Because actual outperformance is expected to exceed that threshold, the final proportion could be lower. The important conclusion remains that a substantial majority of the identified budget outperformance is associated with benefits that should not automatically be extrapolated.
Subtracting the entire $400 million from the approximately $9.116 billion guidance threshold produces an illustrative budget-price, normalized reference of approximately $8.716 billion. This is not company guidance and is not a prediction that all commodity benefits disappear. It is a diagnostic calculation showing how much of the headline performance depends on conditions outside a straightforward recurring-growth trajectory.
The hurdle for 2027 growth is consequently meaningful. Replacing only the $225 million of potentially nonrecurring items requires approximately 2.5% growth elsewhere merely to keep EBITDA flat against the 2026 reference. Replacing the full $400 million requires approximately 4.4%. Achieving 5% reported EBITDA growth would require approximately $681 million of incremental contributions if only the $225 million reverses, or approximately $856 million if the entire $400 million reverses.
These requirements are not impossible, but the call did not provide a quantified bridge demonstrating that they will be achieved. Management expressly declined to preview the 2027 budget. Kim Dang’s statement that “the growth is not going to be even every single year” should therefore be treated as substantive guidance about the shape of the earnings trajectory.
There is also an internal economic offset within the infrastructure thesis. Additional pipeline capacity can generate new contracted earnings while reducing the regional bottlenecks that create unusually favorable optimization margins on existing assets. The unusually favorable Waha spread is not independent of the infrastructure shortages Kinder Morgan is helping alleviate. Long-term contracted growth can replace scarcity-driven earnings without making every historical trading or optimization benefit permanent.
BACKLOG QUALITY AND THE CORRECT RETURN DENOMINATOR
The $14.4 billion backlog represents an approximately 50% increase from the rounded $9.6 billion figure reported in Q2. Management added $5.4 billion of projects and placed approximately $700 million into service. The rounded opening balance, additions, completions, and closing balance differ by approximately $100 million when mechanically reconciled. The disclosures do not provide enough precision to attribute that small difference to a specific adjustment.
The more important change is the quality and composition of the backlog. Natural gas projects represent approximately 92% of the total. More than 75% of the backlog now supports power generation and local distribution demand, compared with more than 60% in the Q2 release. Southeast Connector and Permian Link account for approximately 87% of Q3 project additions. The increase is therefore concentrated in large, demand-supported infrastructure commitments rather than a broad accumulation of small speculative projects.
A critical methodological distinction appears in the written release. The 5.7-times project EBITDA multiple applies to $13.7 billion of the backlog, not the entire $14.4 billion. Kinder Morgan excludes the capital and EBITDA associated with CO2 enhanced oil recovery and gathering-and-processing projects because their early-year returns can be more favorable but less even.
Applying 5.7 times to the covered $13.7 billion implies approximately $2.40 billion of first-full-year project EBITDA. Applying it indiscriminately to $14.4 billion produces approximately $2.53 billion, but that calculation mixes scopes. Management’s approximately $2.5 billion total incremental EBITDA discussion is a useful aggregate indication, but the written methodology does not support assuming that every backlog dollar earns the same 5.7-times multiple.
The comparable Q2 calculation was $8.5 billion of covered projects at 5.6 times, implying approximately $1.52 billion of first-full-year project EBITDA. The covered-project contribution has therefore increased by approximately $886 million. That change is not equivalent to the EBITDA of the newly announced projects alone because projects entering service leave the backlog and the mix of excluded investments changes.
The reciprocal of 5.7 times is approximately 17.5%, but that is an EBITDA-to-capital ratio, not an after-tax equity return or project IRR. It excludes the timing of construction spending and does not establish cash taxes, sustaining capital, financing costs, or final shareholder cash distributions. The analyst’s reference to mid-teen after-tax IRRs was not a new project-specific return disclosure by management.
Construction discipline remains central. If project EBITDA were unchanged and capital costs increased 10%, a 5.7-times multiple would rise to approximately 6.27 times, reducing the EBITDA-to-capital ratio to approximately 15.9%. A 20% overrun would raise the multiple to approximately 6.84 times and reduce that ratio to approximately 14.6%. These sensitivities illustrate why cost-sharing provisions and contractual protections matter even when demand risk is substantially reduced.
SOUTHEAST CONNECTOR: A SIGNIFICANT COMMERCIAL DE-RISKING EVENT
Southeast Connector is the most strategically consequential announcement. Kinder Morgan’s expected share of project cost is approximately $3.1 billion. The initial scope provides approximately 2.6 Bcf per day of transportation capacity through approximately 470 miles of new pipeline and associated compression, with phased service beginning in Q4 2030 and continuing through 2032.
The project is supported by at least 20-year take-or-pay contracts with strong investment-grade utilities. This is materially stronger evidence of monetizable demand than interconnection requests, preliminary customer discussions, or a nonbinding open season. Dang explicitly distinguished committed demand from remaining opportunities: “We have enough signed commitments today to support going forward in FID in the project.”
Management identified potential expansion to approximately 3.5 Bcf per day, representing approximately 35% more capacity than the initially sanctioned scope. That upside is not yet equivalent to committed investment or revenue. Additional customers remain subject to precedent agreements and credit review, and the capital requirement would depend on their delivery points and service requirements.
The project also has strategic value beyond its initial contracted earnings. Its connections can support further expansions on upstream and connecting systems. However, those follow-on opportunities should be valued as conditional options rather than automatically added to committed backlog.
Although the written release emphasizes Appalachian supply, the call describes access to multiple pipeline corridors and supply basins. Tennessee Gas Pipeline, Columbia Gas, Texas Eastern, and other interconnections can provide alternative paths, including potential Gulf Coast supply. This flexibility reduces dependence on a single producing region and can improve reliability and delivered-cost competition.
The appropriate conclusion is substantial commercial de-risking, not elimination of project risk. Large-scale construction, permitting, commissioning, downstream power development, and ultimate customer performance remain relevant. A 20-year reservation obligation can protect revenue from low utilization, but its effectiveness depends on the contract’s commencement conditions, termination provisions, guarantees, and counterparty credit.
PERMIAN LINK: HIGH-QUALITY CONTRACTING WITH CONCENTRATED CUSTOMER EXPOSURE
Permian Link is designed to transport approximately 2.8 Bcf per day through approximately 434 miles of new pipeline. Total project cost is approximately $4.2 billion, of which Kinder Morgan’s share is approximately $1.6 billion. These ownership scopes matter: the $1.6 billion investment is a partial economic interest, while the 2.8 Bcf-per-day capacity describes the whole project.
The anchor is an A-rated hyperscaler supporting new power generation in the Texas Panhandle under a contract of at least 20 years. This represents tangible conversion of data-center-related electricity demand into contracted gas infrastructure investment. It is more economically meaningful than general commentary about artificial intelligence or aggregate data-center load requests.
Customer concentration remains a distinct risk. Strong credit quality reduces default probability, but does not diversify the exposure. The call did not identify the customer or fully disclose guarantees, termination rights, construction contingencies, cost-sharing mechanics, or the synchronization of pipeline service with the customer’s generating facilities.
Management did not directly resolve whether the anchor customer will already be operating before Permian Link begins service or will ramp alongside it. The answer emphasized urgency, additional customer discussions, storage connectivity, and reliability. The commercial attractiveness of the project is clear; the precise commissioning and ramp profile is not.
Storage connectivity is a genuine differentiator. Reliable power supply requires more than annual gas volumes. Intraday flexibility, deliverability during weather events, and access to stored gas can be valuable to customers with high outage costs. Those attributes can support stronger customer retention and additional infrastructure opportunities, although the call did not quantify a separate storage-services earnings contribution.
Timing requires careful reconciliation. The written October release specifies Q3 2030 for Permian Link. Portions of the call refer more loosely to 2030 or approximately Q4. The explicit written project disclosure is the better modeling reference, while the difference reinforces that quarterly contribution should not be treated as precisely established several years in advance.
Permian Link can also expand through additional compression and incremental shippers. This creates potential capital efficiency because later expansions can use the initial pipeline investment. However, neither the incremental capital requirement nor the additional contracted earnings was disclosed.
TGP 219 SOUTH AND THE LIMITS OF THE SHADOW BACKLOG
TGP 219 South remains an important prospective catalyst rather than a sanctioned project. The nonbinding open season generated more than 2 Bcf per day of interest, but management emphasized that customer timing differs and that commitments may support staged development.
The approximately $1.5 billion capital indication applies to a brownfield-focused configuration. It does not establish the cost of delivering the entire expressed demand. Management specifically stated that a project scaled to 2 Bcf to 3 Bcf per day would cost more than $1.5 billion.
This distinction is important because the supplied analyst commentary contains differing assessments of the cost indication. TD Cowen characterized it as higher than expected, while Wells Fargo’s question described it as lower than anticipated. Those reactions can reflect different assumed project scopes rather than contradictory management disclosures.
TGP 219 South could serve both Southeast Connector and power demand along the Ohio, Kentucky, West Virginia, and Tennessee corridor. Nevertheless, upstream pipeline capacity, downstream pipeline capacity, and end-market consumption cannot simply be added together as separate incremental demand. The same gas can travel through several Kinder Morgan assets. Additional revenue opportunities can exist along that path, but the underlying physical demand should not be counted repeatedly.
Management did not provide a refreshed numerical shadow-backlog figure. The proper interpretation is that the existing opportunity set has converted meaningfully into sanctioned projects while additional opportunities remain. The prior more-than-$10-billion opportunity discussion should not be added mechanically to the new $14.4 billion backlog.
PROJECT TIMING AND THE BRIDGE THROUGH 2027 TO 2032
The call improves visibility through 2032, but leaves a potentially uneven path between current earnings and the eventual run rate. Trident is the most important example. Management stated that it remains on time and on budget, with initial delivery expected in February 2027, but that only 30% of contracted EBITDA comes on in 2027.
Kinder Morgan’s project description identifies Trident’s first phase in Q1 2027 and its second phase in Q4 2028. This resolves the potentially misleading implication in an analyst’s question that the project is principally a late-2027 event. It also prevents the opposite modeling error of assuming that February 2027 delivery produces the entire contracted earnings contribution immediately.
Other existing projects support growth before the newly sanctioned megaprojects arrive. South System Expansion 4 is expected to enter service in phases in Q4 2028 and Q4 2029, producing larger annual contributions in 2029 and 2030. Management identified the second Mississippi Crossing phase for mid-2028, supporting additional 2029 growth.
The accompanying release also identifies smaller investments that can contribute earlier. Creekside Lateral phases are expected in Q4 2026 and Q4 2027. The approximately $235 million overall project has more than 750 million cubic feet per day contracted against approximately 1.3 Bcf per day of physical capacity, with further expansion potential. This demonstrates both real contracted demand and remaining capacity that should not yet be treated as fully monetized.
The more-than-$500-million Plantation North gathering expansion is expected to be completed by year-end 2026. The approximately $139 million Pasadena connectivity project and $30 million export-terminal expansion are expected in 2027. Bear Creek Storage, with approximately $120 million of Kinder Morgan investment and 10 Bcf of capacity, is expected in April 2029.
These projects mean that the earnings outlook before 2030 is not empty. However, their contribution schedules, contract ramps, and offsets against normalizing 2026 benefits were not sufficiently quantified to establish a reliable 2027 growth rate.
NATURAL GAS OPERATIONS, SUPPLY ECONOMICS, AND RECONTRACTING
Natural Gas Pipelines adjusted segment EBDA increased 6.1% to $1.489 billion. Transport volumes increased approximately 3%, and gathering volumes increased 14%. KinderHawk gathering volumes increased 40%, accounting for substantially all of the gathering increase discussed on the call.
Earnings benefited from transportation volumes, capacity-sale rates, park-and-loan activity, expansion projects, and gathering. The result confirms strong utilization and commercialization of the existing network. It does not establish that all incremental earnings are supported by the same long-term contractual protections as the newly sanctioned projects.
Volume growth moderated from Q2, when transportation increased 7% and gathering increased 26%. The underlying demand environment remains favorable, but the quarter does not support an assertion of uniformly accelerating physical throughput.
The supply-side discussion was directionally reasonable but not risk-free. Management expects the Permian, Haynesville, and Appalachia all to contribute to demand growth. Associated gas production depends partly on oil-directed drilling and basin development, while dry-gas growth requires adequate realized prices and infrastructure access. The existence of large geological resources does not guarantee timely production at the prices embedded in power or LNG economics.
The company stated that its pipeline agreements are not contingent on customers first securing upstream gas-supply agreements. That can insulate transportation contracting from producer-specific negotiations, but it leaves customers responsible for arranging fuel. It does not eliminate broader risks from fuel scarcity, higher delivered gas costs, or delayed downstream facilities.
Management’s response to Permian overbuilding concerns emphasized demand connectivity, existing systems’ relatively low cost positions, and access to LNG and power markets. Those are credible competitive advantages. However, the call did not quantify upcoming contract expirations, renewal rates, or downside sensitivity for older pipelines. New long-term contracts should not be assumed to eliminate recontracting risk across the legacy portfolio.
DEMAND FORECASTS: SUPPORTIVE CONTEXT, NOT CONTRACTED REVENUE
Management cited Shell’s projected global LNG demand of nearly 750 million tonnes annually by 2050, NERC’s projected increase in peak electricity demand, and Wood Mackenzie’s approximately 46 Bcf-per-day increase in North American natural gas demand by 2035. These forecasts support a substantial infrastructure opportunity, but they are not equivalent to signed transportation commitments.
The Southeast interconnection discussion requires particular caution. Management cited more than 200 GW of large-load requests and approximately 8 Bcf per day of potential gas demand. That equates to only approximately 40 million cubic feet per day per GW, substantially below the approximately 150 million cubic feet per day per GW referenced in the analyst’s question.
For illustration, 200 GW operating continuously at a heat rate of 7 MMBtu per MWh would consume approximately 32 Bcf per day, assuming approximately 1,037 Btu per cubic foot. An 8 Bcf-per-day outcome would imply roughly a 25% utilization-equivalent under those assumptions, or a materially smaller portion of the requested load being served by gas.
The call did not reconcile the assumed heat rate, utilization, gas-generation share, or attrition rate. The response was partially garbled, and management acknowledged that not all connection requests will proceed. The 8 Bcf figure therefore should not be treated as a technically precise, fully explained demand forecast. The signed utility contracts supporting Southeast Connector are the stronger evidence.
Similarly, Kinder Morgan’s existing approximately 40% share of US gas transportation is not a mechanically reliable capture rate for future demand. Geographic differences, competitive investment, asset ownership, tariffs, and repeated movements of the same gas all affect the economic outcome. Applying 40% to an industry demand forecast would produce an opportunity illustration, not a defensible earnings forecast.
PRODUCTS PIPELINES AND WESTERN GATEWAY
Products Pipelines adjusted segment EBDA increased 8.7% to $313 million despite refined-products volumes declining approximately 3% and crude-and-condensate volumes declining approximately 11%. Favorable commodity pricing and higher butane-blending volumes offset weaker physical throughput on an adjusted basis.
The volume weakness was broad enough to warrant attention. Gasoline, diesel, and jet-fuel deliveries all declined. The crude-and-condensate comparison was partly distorted by the Double H conversion to NGL service, but fewer well connections at Hiland also contributed. The conversion should not be interpreted as equivalent to an economic loss of the entire former crude business, while the residual gathering weakness remains a genuine operating consideration.
Western Gateway is strategically differentiated from the natural gas projects. It creates a new refined-products supply route into Arizona and California, with an expected 2029 in-service date. Kinder Morgan’s stated incremental cash commitment is approximately $300 million, comprising $250 million contributed to the joint venture and $50 million invested in retained assets.
The economic commitment is larger than that cash figure alone. The transaction also involves contributing existing SFPP East and West assets. Oil & Gas Journal’s account of the August transaction announcement identifies an approximately $1.5 billion contribution value for those assets. Kinder Morgan’s ownership in the resulting system is 35.1%, alongside Phillips 66 at 49.9% and HF Sinclair at 15%.
Consequently, the $300 million cash backlog entry cannot be treated as the complete economic investment supporting Kinder Morgan’s share of future joint-venture earnings. Existing asset earnings are being reorganized into a larger system. Valuation must distinguish genuinely incremental earnings from earnings attributable to assets already owned.
Management stated that there are “certain cost protections” against overruns, but did not disclose their scope or limits. The company also emphasized prudence in committing capital until permitting confidence improves. These are constructive safeguards, not evidence of a complete construction-cost guarantee.
The project’s value proposition is primarily improved supply access and logistics resilience rather than robust underlying growth in California fuel consumption. That distinction is important when assessing long-term volume, regulatory, and recontracting risk.
TERMINALS: STRONG COMMERCIAL CONDITIONS WITH CYCLICAL ELEMENTS
Terminals adjusted segment EBDA increased 14.6% to $314 million. Growth reflected expansion projects, higher commodity prices, stronger coal and petroleum-coke handling, and higher Jones Act tanker rates.
The Houston Ship Channel export operation delivered a particularly strong result. Throughput across 11 docks reached 427,000 barrels per day, up 39% and a record for the system. Management attributed the strength partly to global refined-products shortages and associated price dislocations.
That performance demonstrates the value of storage, blending, connectivity, and export infrastructure during disrupted markets. It also contains a cyclical element. A normalization of international product balances could reduce some of the exceptional throughput and ancillary margin opportunities without undermining the underlying franchise.
Headline utilization requires a more nuanced interpretation than the prepared remarks alone suggest. Overall liquids utilization was 92.6%, compared with 94.6% a year earlier, even though key hubs remained close to 96% utilization of available tanks. Strong commercial conditions at the most valuable locations therefore coexisted with a 2-percentage-point decline in the broader reported utilization measure.
The tanker fleet has substantial revenue visibility, with coverage of 100% for the remainder of 2026, 97% for 2027, and 80% for 2028. However, those figures assume likely options are exercised. They are not entirely equivalent to irrevocable firm commitments through those dates. The almost-3-year average firm contract duration is the cleaner indicator of contracted visibility.
CO2 AND RNG: STRONGER OPERATIONS, DIFFERENT RISK CHARACTERISTICS
CO2 adjusted segment EBDA increased 35.3% to $184 million, making it a material contributor to quarterly growth. Net oil production increased approximately 8%, SACROC production increased 11%, and NGL volumes increased 9%. CO2 sales volumes declined approximately 3%.
The production improvement matters because realized oil pricing increased only modestly, to $68.65 per barrel from $67.74. Realized NGL pricing increased more meaningfully, to $34.48 from $31.09. The earnings increase should therefore not be characterized simply as an unhedged response to higher spot crude prices.
The hedge schedule further limits that interpretation. The release lists 2027 crude hedges of approximately 19,220 barrels per day at $64.73 per barrel. That volume is approximately 71% of Q3 net oil production, although it is not a disclosed hedge percentage against forecast 2027 production. The hedges support cash-flow stability while limiting participation in higher spot prices.
Management maintained a differentiated investment hurdle for enhanced oil recovery. Anthony Ashley emphasized backwardation, geopolitical uncertainty, and testing returns at lower oil prices. This is appropriate because long-development-cycle oil investments should not be justified primarily by temporarily elevated front-end prices.
RNG volumes increased 18%, reflecting improved uptime and recovery. This indicates progress after prior operational difficulties, but the call did not disclose enough standalone earnings information to establish RNG as a material driver of consolidated value. Management’s caution about expanding through acquisitions is therefore appropriate.
The broader strategic discipline was also clear in the response to potential upstream expansion: “We’re not focused on power. We’re focused on building pipeline infrastructure.” Avoiding unnecessary entry into generation or established Appalachian gathering markets reduces the risk of diluting the company’s core competitive advantages.
CASH FLOW, CAPITAL SPENDING, AND DIVIDEND COVERAGE
The strongest qualification to the earnings growth is that investment spending is absorbing the improvement in operating cash flow.
Q3 operating cash flow increased 12.4% to $1.590 billion, but GAAP capital expenditures increased 31.8% to $1.045 billion. Company-defined free cash flow before dividends consequently declined 12.2% to $545 million from $621 million. After $665 million of dividends, quarterly free cash flow was negative $120 million, compared with negative $33 million a year earlier.
The year-to-date picture is stronger. Operating cash flow increased 19.3% to $5.041 billion, while capital expenditures increased 28.3% to $2.831 billion. Free cash flow before dividends increased to $2.210 billion, and free cash flow after dividends was positive $226 million.
However, the company’s stated free-cash-flow measure does not capture every investment-related cash requirement. The CFO’s broader capital figure, including joint-venture contributions, was approximately $3.07 billion, about $239 million above the GAAP capital-expenditure line. Subtracting that broader investment amount and $1.984 billion of dividends from operating cash flow leaves approximately negative $13 million before the approximately $500 million Monument acquisition. This broadly explains the $513 million year-to-date increase in net debt, subject to rounding and other cash movements.
The distinction is important: Kinder Morgan substantially funds its core investment program internally, but “internally funded” should not be interpreted as a guarantee that debt remains unchanged after joint-venture contributions, acquisitions, and higher capital spending.
The new spending outlook makes this trade-off more explicit. Dang stated that capital spending is “probably going to be around $4 billion-ish for the next few years.” Against management’s approximately $3 billion of annual cash flow available for expansion investment, that implies an illustrative funding difference of approximately $1 billion annually if the figures are on comparable bases and cash generation does not rise.
The dividend remains conservatively growing relative to earnings, at approximately 2% annually. That restraint preserves investment capacity. The call does not support expecting rapid dividend acceleration or substantial discretionary repurchases alongside the enlarged project program.
BALANCE SHEET AND JOINT-VENTURE FINANCING
Net debt increased to $32.229 billion from $31.716 billion at year-end 2025. Nevertheless, leverage declined from 3.8 times to 3.5 times because trailing adjusted EBITDA increased to $9.189 billion from $8.391 billion. The balance sheet improvement is therefore primarily an earnings-denominator improvement, not an absolute debt reduction.
Expected year-end leverage of 3.6 times provides financing flexibility, but the normalization risk affects that headroom. Illustratively, a $400 million EBITDA decline from an approximately $9.12 billion base would raise a 3.6-times starting leverage ratio to approximately 3.8 times if net debt were unchanged. The company would remain financially manageable, but part of the apparent capacity would disappear without any additional borrowing.
Management expects the new joint ventures to fund construction through retained cash flow, project-level debt, and owner equity contributions while preserving existing ratings. That is a sensible financing framework. It does not make the underlying capital requirements or debt risk disappear.
Economic leverage and reported parent leverage should be distinguished. Debt incurred at unconsolidated joint ventures may not appear in the same manner as consolidated parent debt, while project interest expense, retained cash, and distribution policies affect the cash ultimately available to Kinder Morgan. The disclosed EBITDA methodology also incorporates selected joint-venture adjustments rather than simply consolidating every venture’s gross operating economics.
The claim that Kinder Morgan could fund its entire share from parent resources demonstrates flexibility, but should not be interpreted as an unconditional commitment to do so without changing leverage, distributions, or other investment priorities.
PERMITTING, CONSTRUCTION, AND THE LIMITS OF CONTRACTUAL PROTECTION
Management’s permitting tone was confident. Recent FERC approvals for Mississippi Crossing and South System Expansion 4 were presented as evidence that large projects can move through the current process efficiently. The company did not make Southeast Connector’s viability dependent on proposed congressional permitting reform.
This is constructive because legislative upside need not be embedded in the base case. Nevertheless, the proposed changes described on the call are not enacted protections and should not be treated as existing law.
Recent FERC success also does not eliminate other approvals, rights-of-way, environmental conditions, litigation, equipment procurement, or construction sequencing. Southeast Connector and Permian Link together involve approximately 904 miles of new pipeline, in addition to compression and related facilities. Their execution requirements are substantially larger than those of a small brownfield expansion.
Management said it had not reduced return thresholds despite higher pipe and compression costs. That suggests favorable customer willingness to pay for scarce infrastructure. However, the call did not disclose enough project-specific cost allocation to establish that all future inflation or overruns can be passed through.
Richard Kinder described the strategy as combining “consistent growth with minimal risk.” The evidence supports relatively low utilization risk on appropriately structured take-or-pay contracts. It does not support treating the entire investment program as low risk across construction, timing, financing, counterparty concentration, and long-term valuation.
ILLUSTRATIVE 2027 SCENARIOS
A scenario framework is more appropriate than a precise forecast before formal 2027 guidance. The following cases use approximately $9.116 billion as a 2026 reference because it is the mechanical guidance threshold, not because it is an established final result. The incremental recurring contributions are analytical assumptions, not company forecasts, and the probabilities are judgmental rather than statistically estimated.
A 60% base case assumes the $225 million of potentially nonrecurring benefits disappears, half of the $175 million commodity uplift normalizes, and recurring operations plus project contributions add approximately $350 million. That produces approximately $9.15 billion of EBITDA, essentially flat against the reference. This case allows continued operational progress while recognizing the difficult comparison.
A 25% bull case assumes the $225 million reverses, commodity benefits remain broadly intact, and recurring operations plus projects contribute approximately $600 million. EBITDA would reach approximately $9.49 billion, about 4% above the reference. Such an outcome would require stronger underlying contributions than the base case and would materially improve confidence in near-term growth.
A 15% bear case assumes the full $400 million of benefits reverses and recurring operations plus projects contribute only approximately $100 million because of weaker commercial conditions, delayed ramps, or offsetting operating pressure. EBITDA would be approximately $8.82 billion, about 3% below the reference.
The probability-weighted outcome is approximately $9.19 billion, close to flat. The purpose of these cases is not to establish a new consensus estimate. It is to show that a very strong long-term project story can coexist with modest near-term reported growth. Equity returns would additionally depend on valuation, financing, dividend receipts, and changes in the discount rate.
VALUATION AND INVESTMENT IMPLICATIONS
The project announcements warrant greater confidence in the duration of growth, but do not justify capitalizing all future EBITDA as though it were already operating. Kinder’s closing indication that the backlog could take EBITDA toward $11.5 billion to $12 billion is a strategic illustration, not dated consolidated guidance.
Relative to an approximately $9.12 billion reference, that range represents approximately 26% to 32% growth. Spread over approximately 6 years, it equates to roughly 4% to 5% annualized growth before allowing for additional projects, normalization of current benefits, legacy-business changes, or execution shortfalls. The figure is substantial, but less dramatic than the absolute $2.5 billion increment can initially suggest.
Timing has a material valuation effect. At an illustrative 9% discount rate, a cash flow received 5 years from now has approximately 65% of the present value of the same amount received today. Remaining construction spending must also be funded. Adding a current trading multiple times future backlog EBITDA directly to equity value would therefore overstate value unless timing, capital requirements, financing, and ownership are handled consistently.
The supplied analyst reactions reflect this tension. TD Cowen raised its target to $40 from $38 and emphasized restored confidence in project conversion. Citi maintained a neutral stance and a $34 target, emphasizing higher spending and fewer immediate earnings benefits. The difference is economically understandable: greater confidence in eventual growth does not necessarily translate into equally attractive near-term risk-adjusted returns.
The reported 1.9% premarket share-price increase is evidence of an initially favorable reaction, not a verified closing return or proof that the backlog is undervalued. The available material does not establish a sufficiently complete current valuation framework to justify a new independent price target.
From a portfolio perspective, Kinder Morgan provides exposure to gas infrastructure, LNG, power demand, and industrial development without direct ownership of hyperscaler computing economics. However, its increasing investment concentration in power-related natural gas infrastructure means that it is not independent of the broader data-center investment cycle. A portfolio already concentrated in hyperscalers, power equipment, utilities, and LNG infrastructure could have overlapping demand-duration exposure.
The company also retains interest-rate sensitivity, commodity-sensitive earnings, construction exposure, and regulated-infrastructure risk. Its contracted revenue profile diversifies direct commodity production risk, but does not make the equity bond-like or eliminate drawdown risk.
CATALYSTS, REVIEW TRIGGERS, AND CONCLUSION
The most important near-term catalyst is the formal 2027 budget. It should establish the size of the normalization adjustment, commodity assumptions, expected project contributions, capital spending, and leverage trajectory. That disclosure is more relevant to the next 12 months of earnings than further repetition of the $14.4 billion backlog total.
Other catalysts include Trident’s initial service in early 2027, successful completion and ramping of the smaller 2026 and 2027 projects, binding commitments and eventual sanctioning for TGP 219 South, additional Southeast Connector shippers, and greater clarity on Permian Link’s customer ramp and credit protections. Longer-term milestones include permitting, construction progress, and confirmation of the 2028 through 2032 service schedules.
The principal review triggers are deterioration in normalized base-business earnings, a sustained funding gap larger than the illustrative approximately $1 billion annual difference, leverage rising without a credible earnings bridge, material customer-credit weakening, and construction delays or unrecovered overruns that impair project returns. An unrecovered 20% cost increase or a delay exceeding approximately 12 months on a major project would warrant a substantial reassessment rather than routine treatment as execution noise.
The fundamental exit criteria are impairment of the contracted-growth economics, not merely quarterly volatility. Loss of enforceable customer support, repeated return dilution, structurally weaker legacy earnings, or funding decisions that compromise balance-sheet flexibility would challenge the investment thesis. Specific portfolio weights, entry prices, and price-based stop-loss levels cannot be established from the earnings evidence without current valuation and portfolio exposure data.
The final assessment is that Q3 materially improved confidence in Kinder Morgan’s ability to convert demand into long-term contracted infrastructure investment. It did not remove the difficult 2027 comparison or demonstrate that higher capital spending will immediately produce higher free cash flow after dividends. The most defensible stance is to recognize the improvement in long-term business value while withholding a more aggressive near-term earnings or allocation conclusion until the normalized 2027 bridge and current valuation support it.
COMPANY PARTICIPANTS
• Richard D. Kinder, Executive Chairman. • Kimberly Allen Dang, Chief Executive Officer. • Dax Sanders, President. • David P. Michels, Vice President and Chief Financial Officer. • Sital Mody, President, Natural Gas Pipelines. • Anthony B. Ashley, President, CO2 and Energy Transition Ventures. • Unidentified company speaker, name and title not established in the transcript.
RESEARCH ANALYST PARTICIPANTS
• Theresa Chen, Barclays. • Julien Dumoulin-Smith, Jefferies. • Jeremy Tonet, J.P. Morgan. • Praneeth Satish, Wells Fargo. • Manav Gupta, UBS. • Jean Ann Salisbury, Bank of America. • Brandon Bingham, Scotiabank. • Keith Stanley, Wolfe Research. • John Mackay, Goldman Sachs. • Spiro Dounis, Citi. • Gabriel Moreen, Mizuho Securities. • Zack Van Everen, TPH Research. • Jason Gabelman, TD Cowen. • Harry Mottier, Barclays, as phonetically transcribed by the operator; the questioner is otherwise labeled unidentified, and the name is unconfirmed.
Key Read-Throughs
KEY READ-THROUGHS FROM KINDER MORGAN’S Q3 2026 EARNINGS CALL
Kinder Morgan’s October 21 call provides stronger evidence of executable power-related infrastructure demand than of an immediate acceleration in the broader economy. The most consequential development is the conversion of prospective demand into large pipeline projects backed by at least 20-year contracts with investment-grade utilities and an A-rated hyperscaler. The clearest beneficiaries are direct infrastructure partners, gas-generation and compression equipment suppliers, and producers positioned to access expanding demand centers. The strongest negative read-through is geographic: Western Gateway could eventually erode the supply-isolation premium earned by California refiners, while creating value for its owners and suppliers outside California. Near-term refined-products conditions remain favorable, however, and should not be confused with that longer-duration competitive threat. Magnitude assessments below refer to fundamental exposure, not predicted share-price movements.
PIPELINES AND UTILITIES
SOUTHERN COMPANY HAS DIRECT ECONOMIC EXPOSURE TO SOUTHEAST CONNECTOR, NOT JUST A GENERAL DATA-CENTER DEMAND BENEFIT (READ-THROUGH 1)
Affected company: Southern Company (SO: United States). Direction: positive for long-duration earnings visibility, with a negative construction-period funding requirement. Magnitude: substantial for its pipeline-investment business and moderate at the consolidated-company level; limited immediate operating-earnings impact.
The call identified approximately $3.1 billion of Kinder Morgan investment in Southeast Connector, initially providing approximately 2.6 Bcf per day of capacity. Management described contracts with strong investment-grade utilities lasting at least 20 years and stated: “We have enough signed commitments today to support going forward in FID in the project.” Southern Company owns the other 50% of Southern Natural Gas. This makes Southern a direct economic participant rather than merely a regional utility that might benefit from more gas availability.
The transmission mechanism is Southern’s ownership share of pipeline investment earnings and eventual cash distributions. It is not automatic recognition of 50% of project revenue, nor should the investment be treated as ordinary state-regulated electric rate base. A simple equal-ownership allocation suggests a gross economic commitment comparable to Kinder Morgan’s approximately $3.1 billion share, but that is not a disclosed Southern parent-company equity funding requirement. Management explicitly expects a combination of joint-venture cash generation, borrowing, and owner contributions.
This creates a more balanced implication than an unqualified utility growth upgrade. Contracting reduces commercial uncertainty and extends the earnings opportunity, but construction consumes capital before the full operating contribution arrives. Southern’s electric-utility investments and pipeline commitments also share exposure to the same regional load-development cycle. The positions are not independent diversification.
The near-term catalyst is Southern’s November 5 earnings update, particularly any incorporation of Southeast Connector into its investment and financing outlook. The operating benefit is predominantly a 2030–2032 development, consistent with management’s phased service schedule. The genuinely new information is commercial sanctioning and contract quality, not proof of an immediate increase in Southern’s earnings guidance.
FLORIDA GAS DEMAND PROVIDES DIRECT PARTNER CORROBORATION FOR ENERGY TRANSFER’S EXPANSION OPPORTUNITIES (READ-THROUGH 2)
Affected company: Energy Transfer (ET: United States). Direction: positive. Magnitude: potentially meaningful for Florida Gas Transmission, but modest at the consolidated level until additional projects and returns are specified.
Asked about Florida, management confirmed strong demand, projects already sanctioned with Florida Gas Transmission, and discussions with customers concerning further expansions. Sital Mody explicitly deferred detailed project commentary to Energy Transfer because it operates the system. Florida Gas Transmission is owned through the 50/50 Citrus joint venture between Energy Transfer and Kinder Morgan.
This is a more direct read-through than treating every large midstream operator as a beneficiary of Kinder Morgan’s backlog. Additional contracted Florida transportation capacity would generate economic earnings and distributions for Energy Transfer through its ownership interest. Existing rights-of-way, interconnections, compression facilities, and operating infrastructure can make extensions more efficient than building an entirely separate competing network, although project-specific returns remain necessary to establish value creation.
The geographic signal matters. Florida expansion demand is distinct from the Texas Panhandle hyperscaler project and Southeast Connector. It indicates that gas infrastructure opportunities extend across multiple demand centers rather than depending on a single customer cluster. Nevertheless, Kinder Morgan’s Southeast Connector and Permian Link investments should not be attributed to Energy Transfer; the direct shared exposure discussed here is Florida Gas Transmission.
Energy Transfer had already reported substantial power-related activity in its Q2 release, including additional Texas customer commitments and development of western gas projects. Kinder Morgan’s comments therefore corroborate an established commercial trend rather than reveal an entirely new investment cycle. Energy Transfer’s November earnings update is the next opportunity for project-specific scope, contracting, capital, and timing disclosures. No incremental Florida EBITDA amount can be established from this call alone.
REFINING AND PRODUCTS LOGISTICS
EXPORT STRENGTH SUPPORTS REFINING MARGINS DESPITE WEAKER DOMESTIC PIPELINE VOLUMES (READ-THROUGH 3)
Affected companies: Phillips 66 (PSX: United States), PBF Energy (PBF: United States), and HF Sinclair (DINO: United States). Direction: positive for near-term refining conditions. Magnitude: potentially material to quarterly refining profitability, but insufficient to establish company-specific earnings beats.
The call reported record refined-products exports of 427,000 barrels per day across Kinder Morgan’s 11 Houston Ship Channel docks, an increase of 39%. Management attributed the strength to a “worldwide shortage in refined product supplies” and associated price dislocations. At the same time, refined-products pipeline volumes declined approximately 3%.
The important inference is that weaker domestic transportation volumes do not necessarily imply weaker refinery margins. Export outlets can absorb production and support product realizations even when higher prices constrain domestic consumption. The mechanism is improved product netbacks and sustained refinery utilization, not an assumed acceleration in US gasoline demand.
Phillips 66 has direct relevance through its refining and commercial network. PBF’s coastal refining exposure also benefits from favorable product balances, while HF Sinclair participates through regional refining margins and interregional supply relationships. The impact is not identical across the companies: refinery location, outages, crude differentials, product mix, and export access determine actual capture. Kinder Morgan’s dock volumes cannot be allocated to individual refiners from the disclosed information.
This evidence extends, rather than initiates, the favorable refining narrative. Phillips 66’s Q2 release already reported strong refining margins and 96% utilization. PBF described tight global balances, while HF Sinclair explicitly expected the favorable Q2 fundamentals to persist into Q3. Kinder Morgan provides an independent physical-flow check that those conditions remained supportive during the subsequent quarter.
The near-term catalysts are the late-October refinery earnings releases and management commentary on margin capture and Q4 conditions. The negative qualification is cyclical: shortages and price dislocations are not permanent earnings. Strong exports support near-term profitability but do not justify capitalizing peak margins indefinitely, particularly when domestic volumes are already responding negatively to higher prices.
WESTERN GATEWAY BENEFITS ITS REFINER-OWNERS THROUGH BOTH LOGISTICS OWNERSHIP AND NEW MARKET ACCESS (READ-THROUGH 4)
Affected companies: Phillips 66 (PSX: United States) and HF Sinclair (DINO: United States). Direction: positive strategically, with a near-term cash-investment burden. Magnitude: meaningful for the project and relevant regional businesses; moderate potential consolidated impact, with a relatively larger commitment for HF Sinclair.
Kinder Morgan said Western Gateway would “fundamentally change the way clean products are delivered to the Desert Southwest and Southern California.” The call confirmed its approximately $300 million cash investment and expected 2029 service date. The previously announced transaction gives Phillips 66 49.9% ownership and HF Sinclair 15%, alongside Kinder Morgan’s 35.1%. The announced cash contributions are approximately $2.5 billion for Phillips 66 and $750 million for HF Sinclair.
There are 2 distinct economic channels. Ownership creates exposure to contracted transportation earnings. Separately, the system provides access from Midwest and Gulf Coast supply points to western markets, creating additional marketing and refinery-outlet opportunities. Those benefits should not be conflated: neither company necessarily supplies every barrel moving through the system, and transportation profits are not equivalent to the entire regional price differential.
The project reallocates value geographically. Lower-cost or better-connected supply outside California gains an additional route into markets historically constrained by logistics. Pipeline owners can monetize part of that connectivity value even if the resulting competition compresses destination-market product premiums.
The cash commitments also compete with debt reduction, repurchases, and other investments before operating cash flows arrive. Both companies entered this period with strong Q2 cash generation, so the commitment is not evidence of an immediate funding problem. However, the project is not a capital-light option. Kinder Morgan’s disclosure of “certain cost protections” also does not establish that all partners have identical protections or identify which party ultimately bears every overrun.
The principal near-term catalysts are permitting progress, construction commitments, and updated funding schedules. Operating benefits are predominantly a 2029-and-later development. Importantly, the joint venture and FID were announced in August. The October call confirms execution intent and adds risk-allocation commentary; it is not a fresh project award for Phillips 66 or HF Sinclair.
CALIFORNIA REFINING SCARCITY VALUE FACES A LONG-DURATION COMPETITIVE THREAT (READ-THROUGH 5)
Affected company: PBF Energy (PBF: United States). Direction: negative for the durability of California refining premiums. Magnitude: potentially significant for Torrance and moderate for consolidated earnings, but not a demonstrated near-term earnings reduction.
The supporting call evidence is Western Gateway’s intended transformation of products supply into Southern California, its 2029 target, and management’s commitment to pursuing the necessary approvals. The announced system includes reversal of the SFPP West Line to move products westward into California.
The transmission mechanism is a reduction in geographic supply isolation. Additional pipeline access can introduce competing barrels from outside the state, potentially lowering marginal delivered supply costs and compressing the regional product premium available to incumbent refiners. This is a competitive-pricing issue even if California’s local refining capacity remains constrained.
PBF’s Torrance refinery is the most directly exposed asset because the new route reaches Southern California. Martinez exposure is less direct and would operate through broader California product balances and substitution between supply sources. PBF’s Q2 disclosure confirmed Martinez’s return to full operations in May, so the threat concerns the future economics of an operating California portfolio rather than a hypothetical restart.
The approximately 230,000-barrel-per-day initial system capacity should not be treated as entirely incremental California supply. The system also serves Arizona, actual destination allocations will matter, and delivered economics depend on tariffs, compliant fuel availability, utilization, and alternative supply costs. These factors limit any defensible numerical earnings estimate.
The timing distinction is critical. This is not a high-conviction near-term short thesis against PBF, particularly while current product markets remain tight. The nearer-term valuation catalysts are permitting and construction milestones that increase the probability of a 2029 opening. The fundamental threat emerges with actual competitive supply. Cross-portfolio exposure to PBF alongside Western Gateway owners therefore contains opposing positions in the same future regional margin pool.
POWER AND COMPRESSION EQUIPMENT
LONG-TERM GAS CONTRACTS IMPROVE THE CREDIBILITY OF THE GAS-GENERATION EQUIPMENT CYCLE (READ-THROUGH 6)
Affected company: GE Vernova (GEV: United States). Direction: positive. Magnitude: meaningful confirmation for the Power business’s multiyear demand outlook, but no separately quantifiable incremental order or earnings contribution.
Southeast Connector is contracted with investment-grade utilities, while Permian Link is contracted with an A-rated hyperscaler. Management said both projects have contracts lasting at least 20 years. Those commitments are stronger evidence of intended gas-fired generation than preliminary load requests or general statements about data-center growth.
The transmission mechanism is improved probability that prospective generation projects progress through fuel infrastructure, financing, equipment procurement, installation, and operation. Gas turbines, related equipment, and eventual services become more economically credible when developers secure long-duration fuel-transportation arrangements. This supports the durability of the relevant equipment market even though Kinder Morgan is not itself ordering the generating turbines.
The order-sequencing limitation is essential. Turbine slots may have been reserved before pipeline FID. Kinder Morgan’s announcement can therefore validate projects already represented in equipment suppliers’ reservations rather than create entirely new orders. GE Vernova had already disclosed 116 GW of gas equipment backlog and slot reservations in Q2, with an expectation of at least 125 GW by year-end. The new information is downstream commitment and fuel-infrastructure progress, not permission to add the associated demand again.
Neither the turbine supplier nor the hyperscaler was identified. There is no basis to assign these projects to GE Vernova as awarded business, or to attribute the unnamed customer’s commitments to Microsoft, Amazon, Alphabet, or another specific technology company. Similarly, management acknowledged that not all of the more than 200 GW of Southeast interconnection requests will materialize.
GE Vernova’s October 28 earnings release is the immediate trading catalyst, particularly firm-order conversion, reservation quality, pricing, and production-capacity execution. The longer-duration implication concerns deliveries and services over the remainder of the decade and beyond. The call increases confidence in end-market depth; it does not independently establish a Q3 earnings beat.
COMPRESSION DEMAND AND CUSTOMER PRICE ACCEPTANCE SUPPORT CATERPILLAR’S ENERGY EXPOSURE (READ-THROUGH 7)
Affected company: Caterpillar (CAT: United States). Direction: positive. Magnitude: moderate for relevant compression and turbine activities, smaller at the consolidated-company level.
Management identified higher pipe and compression costs but said: “We have not seen a lot of customer pushback as a result of the increase in the materials costs that we’ve seen.” It also stated that return thresholds had not been reduced. Separately, Permian Link’s potential expansion through additional compression illustrates how capacity can be increased after initial pipeline construction.
The transmission mechanism is sustained demand for compression equipment, turbine-driven systems, reciprocating engines, and aftermarket services. Caterpillar participates through Solar Turbines and its broader gas-compression engine offerings. Large new pipelines require installed compression, while later expansions can generate additional equipment demand without requiring an entirely new transportation corridor. The resulting installed base can support service revenue beyond initial equipment delivery.
Customer acceptance of higher project costs is supportive of procurement resilience. It suggests that equipment inflation has not yet made the underlying transportation service uneconomic for the committed customers. However, it does not prove that Caterpillar captures every cost increase as margin, or that all equipment contracts permit repricing. Supplier manufacturing costs and capacity expansion remain separate considerations.
Caterpillar’s Q2 release already reported 17% growth in Power & Energy sales and identified increased sales of reciprocating engines used in gas compression, as well as turbines and related services. Kinder Morgan therefore corroborates a business trend already visible in Caterpillar’s results. It does not establish a new supplier award, and its project capital cannot be converted directly into Caterpillar revenue.
The next late-October earnings update is the near-term catalyst for order growth, price realization, manufacturing costs, and backlog conversion. Fundamental benefits should extend through equipment procurement and construction during the remainder of the decade, followed by services. The strongest inference is persistence of the compression cycle, not an immediate step-change in consolidated Caterpillar earnings.
NATURAL GAS PRODUCERS
APPALACHIAN MARKET ACCESS IMPROVES, BUT THE BENEFIT IS REALIZED PRICING AND LONG-TERM SALES OPTIONALITY RATHER THAN AN IMMEDIATE HENRY HUB CALL (READ-THROUGH 8)
Affected company: EQT Corporation (EQT: United States). Direction: positive for long-duration commercialization of Appalachian resources. Magnitude: potentially material to regional sales and realized pricing over time, but limited direct near-term earnings impact from the newly sanctioned projects.
The call established an initial approximately 2.6 Bcf-per-day Southeast Connector project, with potential expansion to 3.5 Bcf per day. TGP 219 South attracted more than 2 Bcf per day of nonbinding interest. Management identified Appalachian supply as an important source for the expanding Southeast market, while also emphasizing multiple possible supply basins and pipeline connections.
The transmission mechanism is improved access to demand outside a constrained producing region. Additional economically viable routes can improve the ability to sell production, reduce exposure to unfavorable local basis, and support long-duration supply agreements. For EQT, the relevant benefit is realized pricing after transportation costs and hedging, not simply a higher national benchmark price.
EQT’s own Q2 release demonstrates the commercial channel: it reported a 10-year agreement to supply approximately 325,000 dekatherms per day to Competitive Power Ventures’ proposed West Virginia generation project, with pricing linked to PJM power prices. That separate agreement was already disclosed and is not a Kinder Morgan project. It shows how proximity to power demand and commercial structuring can monetize gas at terms different from conventional in-basin sales.
Important limitations prevent an indiscriminate bullish extrapolation. Kinder Morgan did not identify EQT as a shipper or supplier on Southeast Connector or TGP 219 South. The latter is not yet sanctioned, and the approximately $1.5 billion cost indication does not cover every possible larger configuration. Upstream and downstream pipeline capacities also cannot be added together as separate incremental consumption when the same gas may travel through both systems.
Multiple supply connections create competition as well as opportunity. Gulf Coast and other gas can contest the same demand, and the call explicitly stated that transportation agreements are not contingent on customers first signing producer supply agreements. EQT must therefore capture the opportunity commercially; ownership of resources alone does not guarantee the benefit.
EQT’s late-October results and subsequent supply-contract announcements are the near-term catalysts for evidence of actual monetization. Southeast Connector’s 2030–2032 phasing makes its direct contribution predominantly long duration. The high-conviction conclusion is improved Appalachian market-access optionality, not a demonstrated near-term gas-price spike or an already-secured EQT volume award.
Report record
- Sector
- Energy
- Industry
- Oil & Gas Storage & Transportation
- Fiscal period end
- September 30, 2026
- Report date
- October 21, 2026
- Analysis
- 6845 words
- Read-throughs
- 2810 words
- Content fingerprint (PDF)
60de4a4f0bda- Content fingerprint (analysis)
f66a7d14b029- Content fingerprint (read-throughs)
657ef08f6ee0
Prepared from the company's earnings release and earnings call transcript. Figures as reported by the company. For information only. Not investment advice.
More from Kinder Morgan
No other reports yet.
More in Energy
Exceptional Margins Strengthen the Near-Term Outlook; Duration Decides the Rest
Power Validation Improved; a Sustained Margin Recovery Has Not
Follow @AtlasPeakRes on X for new earnings reports as they publish.