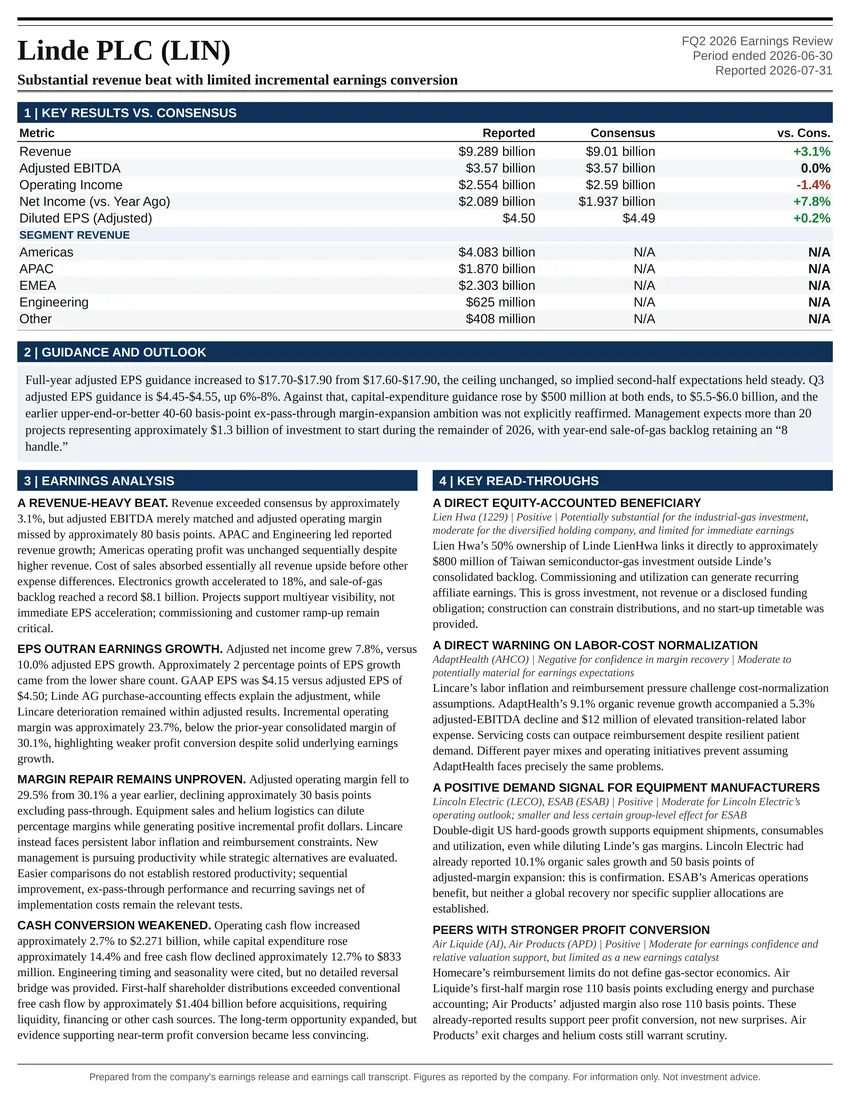
Substantial revenue beat with limited incremental earnings conversion
Earnings Reports
Freeport-McMoRan Inc. FQ3 2026 Earnings Report
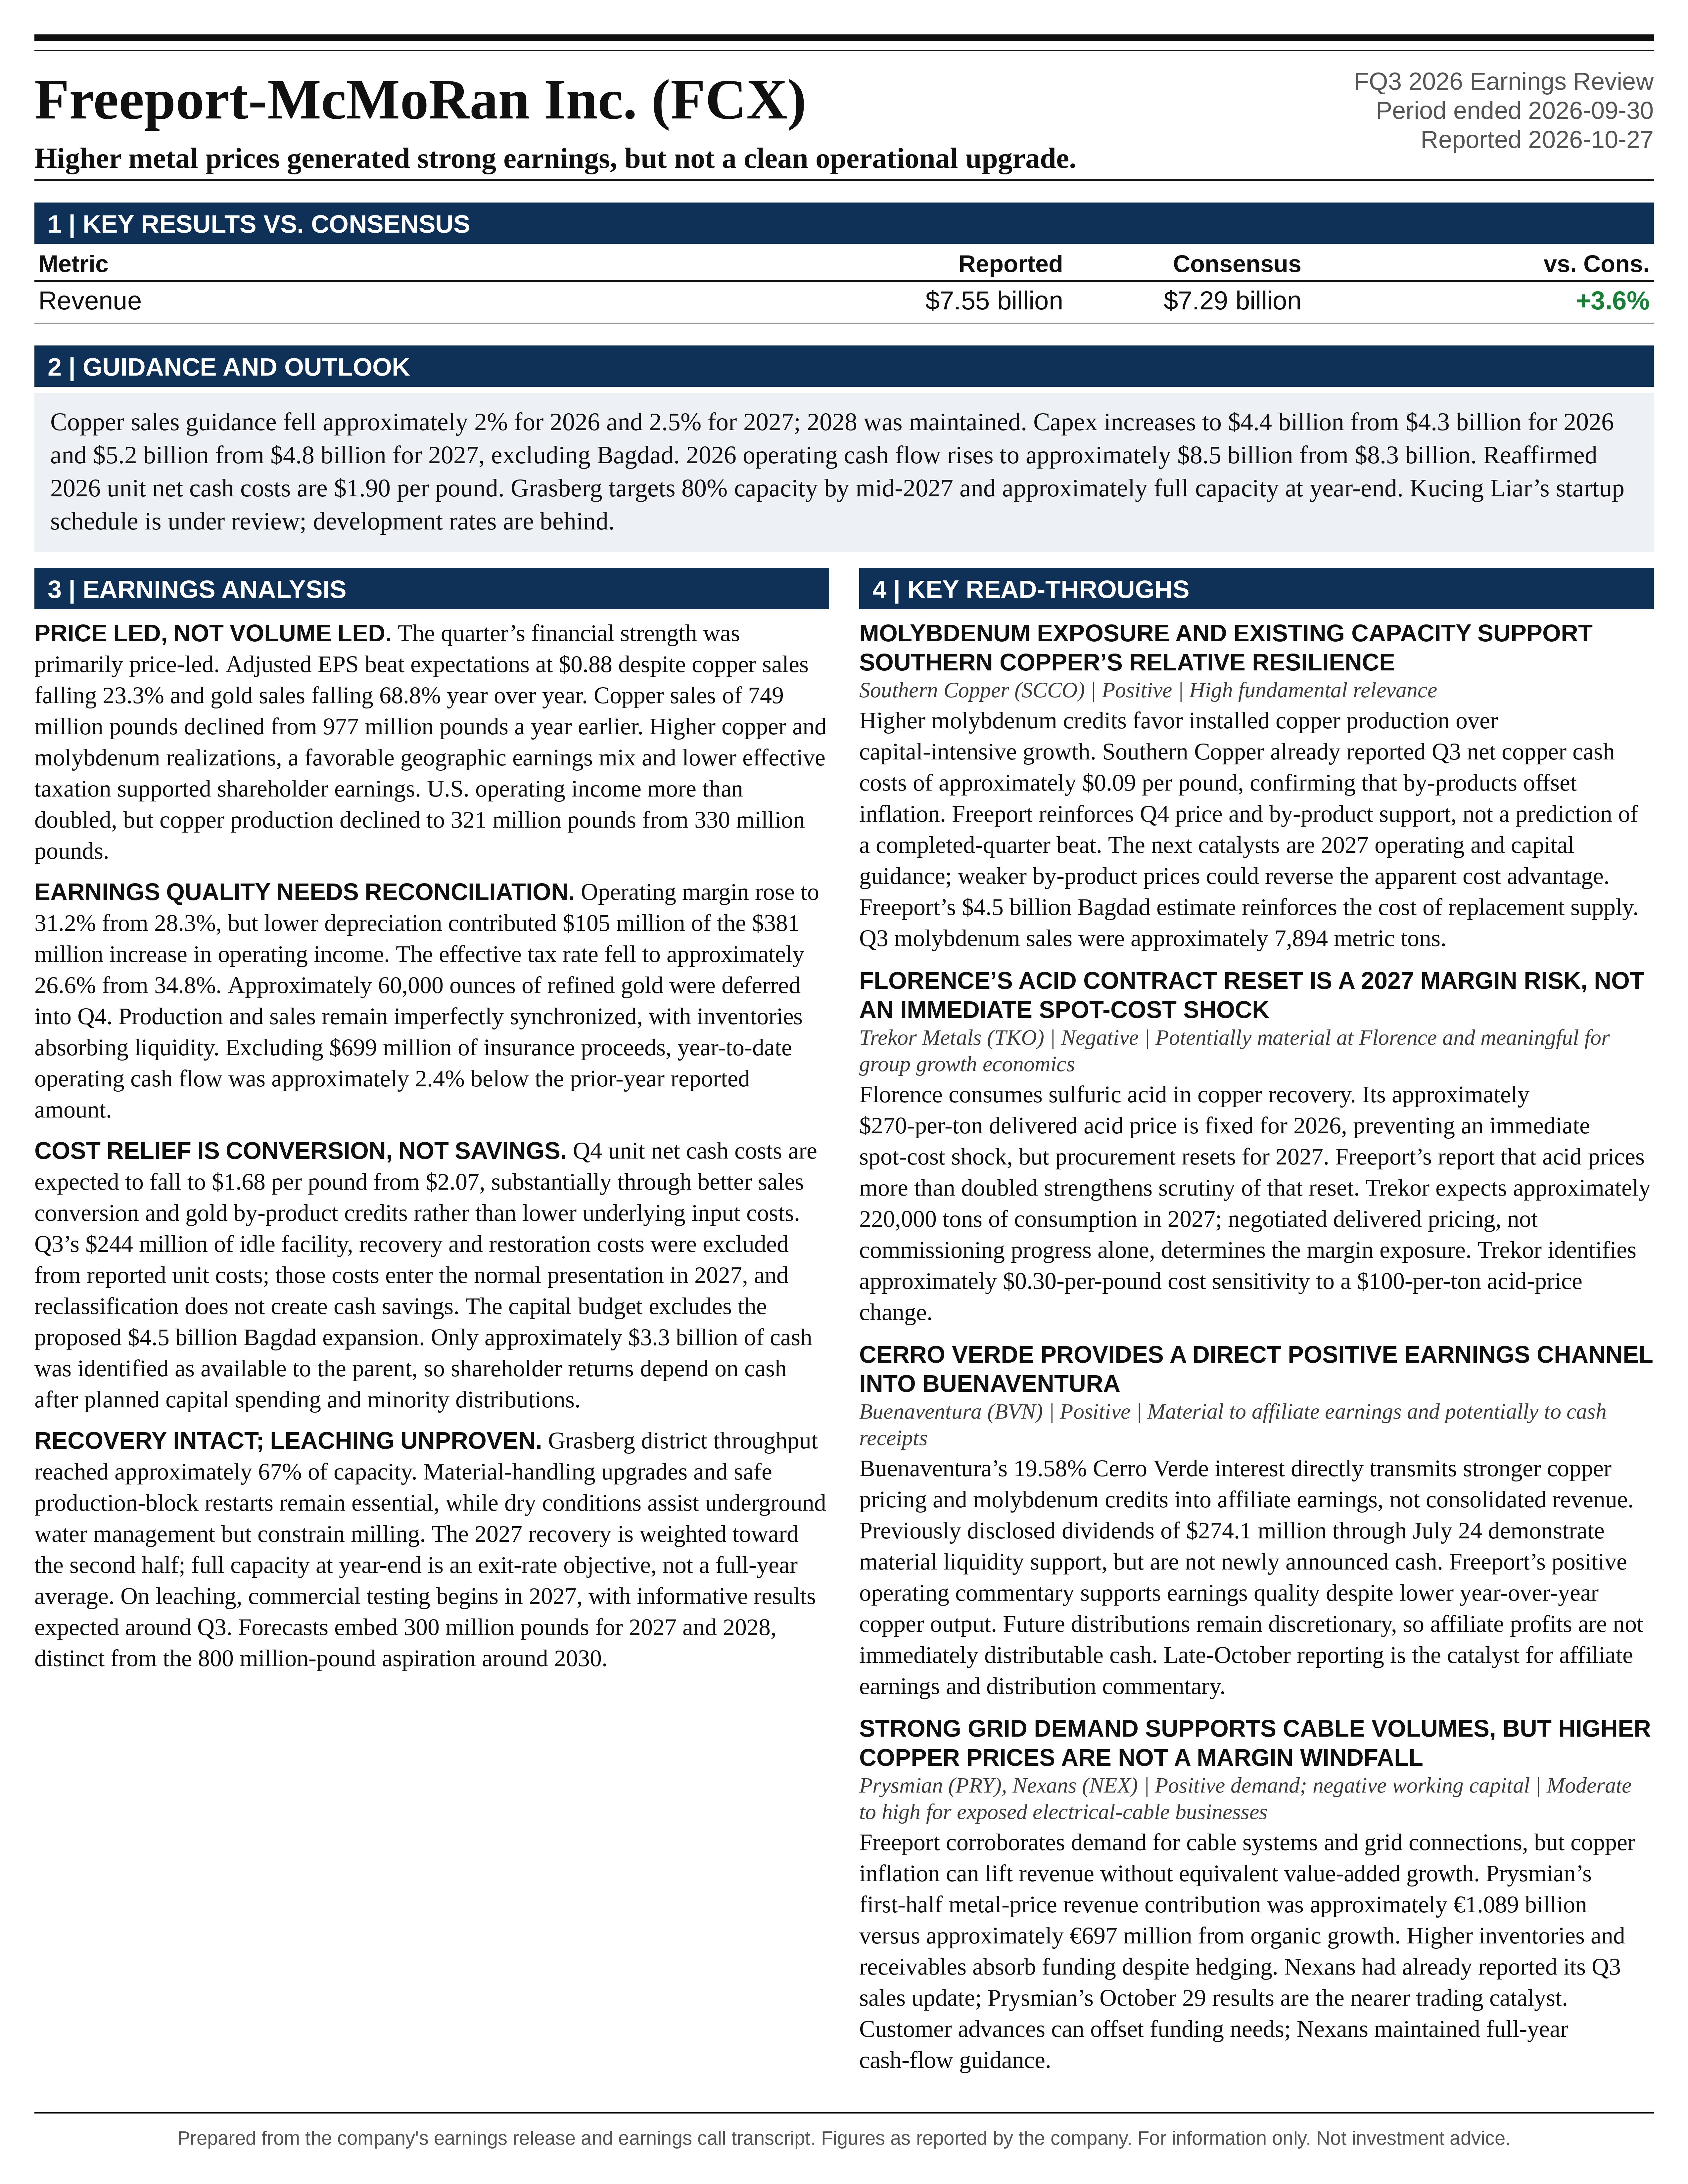
Freeport-McMoRan Inc. (FCX) FQ3 2026 earnings: Higher metal prices generated strong earnings, but not a clean operational upgrade.. Full earnings analysis, key read-throughs, and the one-page exhibit from Atlas Peak Research.
Freeport-McMoRan Inc. (FCX)
Sector: Materials · FQ3 2026 · Period end September 30, 2026 · Reported October 27, 2026
Freeport-McMoRan’s Q3 2026 earnings call supports a constructive medium-term operating outlook, but not an unqualified increase in earnings estimates or investment exposure.
Download the one-page report (PDF)
View one-page exhibit
Download analysis (.md)
Download read-throughs (.md)
Post to X
One-Page Exhibit
Earnings Analysis
EXECUTIVE CALL SUMMARY: Freeport-McMoRan (10/27/26)
Freeport-McMoRan’s Q3 2026 earnings call supports a constructive medium-term operating outlook, but not an unqualified increase in earnings estimates or investment exposure. The appropriate fundamental stance is HOLD, with incremental investment contingent on valuation and evidence that production recovery translates into attributable free cash flow. Grasberg’s recovery remains on schedule, domestic operations provide substantial exposure to elevated copper prices, and proprietary leaching technology offers potentially significant upside. However, copper sales forecasts were reduced for 2026 and 2027, capital expenditure guidance increased, and modeled 2027–2028 earnings and cash flow declined relative to the prior quarter at comparable copper prices. The call strengthened confidence in the recovery timetable while revealing a less favorable underlying cost and investment trajectory.
The quarter’s financial strength was primarily price-led rather than volume-led. Revenue increased 8.2% to $7.546 billion, operating income increased 19.3% to $2.353 billion, and net income attributable to common shareholders increased 74.2% to $1.174 billion. Adjusted EPS of $0.88 exceeded the $0.82 consensus cited in contemporaneous Kitco coverage. These results were achieved despite a 23.3% decline in copper sales and a 68.8% decline in gold sales compared with Q3 2025. Higher copper and molybdenum realizations, a favorable geographic earnings mix, and lower effective taxation supported shareholder earnings. Operational recovery is progressing, but the reported profit acceleration should not be interpreted as equivalent growth in underlying production or sustainable operating efficiency.
The principal near-term catalyst remains Grasberg. District throughput reached approximately 67% of capacity, with management maintaining targets of 80% by mid-2027 and approximately full capacity by year-end 2027. Consolidated copper sales are expected to increase from approximately 3.0 billion pounds in 2026 to 3.7 billion pounds in 2027 and more than 4.0 billion pounds in 2028. Approximately 500 million pounds of the roughly 700 million-pound increase expected in 2027 comes from Indonesia. This is predominantly a recovery of existing capacity rather than a new mine development, giving the volume increase unusually attractive incremental economics. Nevertheless, the recovery remains dependent on material-handling upgrades, safe production-block restarts, water availability, and downstream processing performance.
The most consequential longer-term opportunity is the transition from operational leaching improvements to proprietary chemical enhancement. Laboratory results indicate incremental recoveries exceeding 4x those achieved with the initial additive. Commercial testing begins in 2027, but management explicitly distinguished the 300 million pounds included in its 2027 and 2028 forecasts from the aspirational 800 million-pound opportunity around 2030. Kathleen Quirk’s statement, “This is a test. It’s a commercial test,” is the appropriate valuation boundary. The technology has potentially material option value, but laboratory performance does not establish commercial recovery rates, operating costs, or deployment economics.
Capital allocation is becoming more demanding. The 2027 capital budget increased to $5.2 billion from $4.8 billion and excludes the proposed $4.5 billion Bagdad expansion. Meanwhile, the company’s shareholder-return framework applies to available cash after planned capital spending and distributions to noncontrolling interests, not to consolidated operating cash flow. Strong copper prices can fund substantial growth and distributions simultaneously, but neither the headline cash-flow scenarios nor consolidated production volumes translate directly into cash attributable to FCX shareholders.
QUARTERLY PERFORMANCE AND EARNINGS QUALITY
The October 27 earnings release reported revenue of $7.546 billion compared with $6.972 billion in Q3 2025 and $7.029 billion in Q2 2026. Revenue therefore increased 8.2% year over year and 7.4% sequentially. Adjusted net income was approximately $1.275 billion, or $0.88 per share, compared with adjusted EPS of $0.74 in Q2. Against the consensus figures reported by Kitco, the revenue beat was approximately 2.0% and the adjusted EPS beat approximately 7.3%. Those comparisons are based on the contemporaneous published consensus rather than a separately reconciled estimate-provider dataset.
Copper production of 832 million pounds increased 5.9% sequentially but declined 8.8% year over year. Copper sales of 749 million pounds increased 5.5% sequentially, closely matching the July forecast of 750 million pounds, but declined from 977 million pounds a year earlier. Gold production increased 21.9% sequentially to 234,000 ounces, while gold sales fell to 105,000 ounces from 123,000 ounces in Q2 and 336,000 ounces a year earlier. The divergence between production and sales is central to interpreting both earnings and cash conversion.
Realized copper prices increased 39.7% year over year to $6.54 per pound. Realized gold prices increased approximately 20.7% to $4,273 per ounce, while molybdenum realizations increased 34.9% to $32.46 per pound. These increases more than offset substantially lower sales volumes. The quarter consequently demonstrates strong commodity-price leverage, but not an equivalent improvement in controllable operating performance.
Operating margin increased to 31.2% from 28.3%. However, depreciation, depletion and amortization declined to $520 million from $625 million, contributing $105 million to the $381 million increase in operating income. Operating income plus reported depreciation, depletion and amortization increased approximately 10.6%, substantially less than the 19.3% increase in operating income. This calculation is not company-adjusted EBITDA, but it illustrates that lower noncash depreciation amplified reported operating-profit growth.
Taxation and ownership mix also materially affected the conversion of operating earnings into shareholder earnings. The consolidated effective tax rate declined to approximately 26.6% from 34.8%. Net income allocated to noncontrolling interests declined to $514 million from $573 million despite higher consolidated earnings. Stronger contributions from predominantly wholly owned U.S. operations can generate disproportionately favorable attributable earnings compared with equivalent operating gains at Indonesia or Cerro Verde. This helps explain why attributable net income grew much faster than operating income.
The transcript’s statement that consolidated net income increased “over 80%” does not reconcile with the comparative financial statements. Reported net income attributable to common shareholders increased 74.2%, while consolidated net income before noncontrolling interests increased 35.4%. The financial statements provide the more reliable numerical baseline. The discrepancy does not undermine the conclusion that earnings improved substantially, but the quoted growth characterization should not be used as a precise modeling input.
Gold sales were approximately 34.4% below the July forecast of 160,000 ounces. The release attributes the shortfall primarily to timing, including approximately 60,000 ounces of refined gold deferred into Q4. That deferral is distinct from the broader 129,000-ounce difference between consolidated gold production and sales during Q3. Likewise, copper production exceeded sales by 83 million pounds, principally reflecting inventories within Indonesian downstream processing. These differences support future sales conversion, but they also demonstrate that mine production, refined output, revenue recognition and cash collection remain imperfectly synchronized.
GUIDANCE REVISIONS AND THE CHANGING EARNINGS BASELINE
Management reduced 2026 copper sales guidance by approximately 2% and 2027 guidance by approximately 2.5%. The 2026 reduction reflects shortfalls in the U.S. and Chile; the 2027 reduction reflects updated mine plans. Using rounded guidance, the revisions are approximately 60 million pounds for 2026 and approximately 95 million pounds for 2027. The precise regional bridge for the 2027 reduction was not provided, limiting the ability to distinguish temporary sequencing changes from more persistent productivity constraints.
The July release rounded 2026 copper sales guidance to 3.1 billion pounds, compared with approximately 3.0 billion pounds currently. Those rounded figures should not be used to calculate a supposedly exact 3.2% reduction when management explicitly described the underlying revision as approximately 2%. The current detailed schedule of 2.116 billion pounds sold through September plus 875 million pounds forecast for Q4 implies approximately 2.991 billion pounds for the year.
The 2028 copper outlook was maintained. Gold and molybdenum forecasts were described as unchanged across the 3-year outlook. The current 2026 gold forecast of 649,000 ounces is effectively unchanged from July’s rounded 650,000 ounces. Maintaining 2028 copper guidance while reducing 2027 supports a timing interpretation rather than an immediate impairment of ultimate capacity. It does not eliminate the economic cost of deferred cash generation or establish that the postponed volumes will be recovered without additional expenditure.
Q4 is expected to be the strongest quarter of 2026, with copper sales of 875 million pounds, up 16.8% sequentially, and gold sales of 300,000 ounces, up 185.7%. Consolidated unit net cash costs are expected to decline to $1.68 per pound from $2.07 in Q3. The forecast therefore depends on materially better sales conversion and gold by-product credits, not simply on lower underlying input costs.
The most important forecast comparison is the deterioration in modeled medium-term financial outcomes. In July, management presented average annual 2027–2028 EBITDA of approximately $13 billion at $5 copper and $20 billion at $7 copper, with operating cash flow of approximately $9.5 billion to $15.5 billion. The current call reduced those figures to more than $12 billion to $19.5 billion of EBITDA and more than $9 billion to approximately $15 billion of operating cash flow.
These are rounded sensitivities rather than precise annual guidance, but the direction is unfavorable. Moreover, the assumed molybdenum price increased from $30 to $32 per pound, while gold remained at $4,000 per ounce. Applying management’s stated molybdenum sensitivity, that change alone contributes approximately $170 million of annual EBITDA. At the $7 copper endpoint, the approximately $500 million reported decline therefore implies roughly $670 million of deterioration before the favorable molybdenum assumption, subject to rounding and other model changes. Stronger spot prices should not obscure this underlying reduction in modeled earnings capacity.
GRASBERG: RECOVERY PROGRESS, PRODUCTION CADENCE AND RESIDUAL RISK
Grasberg’s operating recovery remains the most important company-specific driver over the next 12 to 24 months. The release reported district mill throughput of approximately 141,000 metric tons per day, or 67% of capacity, including approximately 70,000 metric tons per day from the Grasberg Block Cave. This distinction matters because the district includes other underground mines; 67% should not be interpreted as a standalone utilization measure for every Grasberg Block Cave production area.
The result compares favorably with July’s expectation that district operating rates would approximate 65% of capacity during 2H 2026. Material-handling upgrades are progressing toward completion around early 2027, and Production Block 1 South remains targeted for restart by mid-2027. The 80% midyear and near-full-capacity year-end milestones remain intact.
Management expects 2027 production to be weighted toward 2H, with Q1 likely the lowest quarter. Quirk specifically stated, “PB1 South is not a huge contributor in 2027.” This indicates that the 2027 recovery should not be modeled as depending predominantly on a large immediate contribution from that block. Improvements in currently operating areas and material-handling capacity are also essential. Full capacity at year-end 2027 is an exit-rate objective, not a full-year average, leaving an important carryover benefit for 2028.
Indonesian copper sales are expected to increase from approximately 700 million pounds in 2026 to 1.2 billion pounds in 2027, an increase of approximately 71%. This accounts for approximately 71% of the consolidated increase implied by rounded guidance. Consolidated gold sales are expected to rise more than 50% in 2027 and another approximately 20% in 2028. Higher gold output improves the economics of the recovery both through additional revenue and through lower reported net copper costs.
The weather discussion revealed a genuine operating trade-off. Abnormally dry conditions reduce water-related challenges within the underground mining system and have assisted mud-management work. However, inadequate water availability constrains milling. Management is responding partly by reducing lower-grade processing to prioritize metal output. A return to normal rainfall could improve mill throughput while reducing the unusually favorable conditions currently assisting underground water management. The recovery should therefore be assessed on an integrated mine-and-mill basis rather than treating wetter or drier conditions as uniformly beneficial.
Production Block 1 Central remains a relatively small near-term contributor. Management estimated that its contribution could reach approximately 3% of copper and 6% of gold production around 2030, with little significance in 2028. This limits the direct volume exposure to that block, although it does not fully capture the broader importance of safe access, water control and production sequencing. Management also acknowledged modest delays in certain mud-management initiatives. These were described as manageable execution adjustments, not evidence that all residual risks have been eliminated.
Kucing Liar introduces a separate development risk beyond the immediate recovery. Quirk acknowledged that “we are somewhat behind on development rates in KL.” The release states that the startup schedule is under review, with development originally expected to begin contributing around the 2030 timeframe. At full rates, Kucing Liar is expected to produce approximately 750 million pounds of copper and 735,000 ounces of gold annually. That output supports continuity of district production and should not automatically be added to existing Grasberg production as entirely incremental growth. Delays could affect the transition between ore sources even if the current recovery remains successful.
IDLE-COST ACCOUNTING AND NORMALIZED GRASBERG ECONOMICS
The accounting discussion was particularly important for earnings normalization. Freeport reported $244 million of idle facility, direct recovery and restoration costs in Q3 and $934 million through September. These amounts were excluded from reported unit net cash costs. Management expects Q4 charges to be broadly similar to Q3, with costs incorporated into the normal unit-cost presentation beginning in 2027.
Quirk stated that “those costs won’t go away, but they will be in our unit cost going forward,” and described the change as “an accounting classification as opposed to a change in cost.” The idle portion principally represents fixed costs that continue while production is constrained. The future economic benefit comes from spreading those costs over greater output, not from assuming that the entire separately reported charge disappears from the cash-cost base.
A rough analytical allocation illustrates the significance. The $244 million charge equates to approximately $0.33 per consolidated copper pound sold in Q3. Adding it to the reported $2.07 unit net cash cost produces an illustrative burden near $2.40 per pound. At Indonesia alone, the charge equates to approximately $1.59 per pound, compared with the reported net cash credit of $0.84 per pound. Including that charge would convert the credit into an illustrative positive cost near $0.75 per pound. These are diagnostic calculations, not company-defined unit-cost measures or complete all-in sustaining costs.
The appropriate model should recognize genuine repair-related expenditure separately from ongoing fixed costs, preserve the impact of higher production on fixed-cost absorption, and avoid counting the removal of an accounting exclusion as an incremental cash saving. Comparisons of adjusted profitability across 2026 and 2027 will also require attention to the changing classification. A narrowing adjustment to reported earnings is not inherently evidence of lower economic spending.
U.S. OPERATIONS: PRICE LEVERAGE EXCEEDS PRODUCTIVITY IMPROVEMENT
The U.S. business remains strategically attractive because of its existing infrastructure, resource scale, predominantly wholly owned operations and exposure to domestic copper demand. Management reported that U.S. operating income more than doubled year over year. However, physical output did not show comparable improvement. Copper production declined to 321 million pounds from 330 million pounds, and sales declined to 333 million pounds from 339 million pounds.
The earnings release provides an important qualification to management’s productivity narrative. U.S. operating rates were approximately 10% higher than a year earlier but approximately 3% to 5% below expectations and below Q2 levels. Extreme weather contributed, but ore characteristics also constrained metal recovery. On the disclosed 100% operating-data basis, which includes partners’ interests at Morenci, U.S. mill throughput declined to approximately 324,600 metric tons per day from 332,700, copper grades declined to 0.29% from 0.31%, and recovery declined to 80.7% from 82.4%. The combined effect is more informative than mining-rate growth alone.
Cory Stevens acknowledged that “we’re missing expectations of where we really wanted to be.” The operating response includes additional mining equipment, higher-payload trucks, improved road and mine design, centralized analytics, and the Phoenix remote operating center. These initiatives may improve mine movement and access to better ore. They should not be assumed to resolve all metallurgical recovery issues, which depend on ore type and processing characteristics.
The analyst exchange on recoveries was revealing. An initial answer emphasized leaching technology, after which Quirk distinguished mill recoveries from leach recoveries. Management did not provide a quantified timetable for conventional mill recovery improvement. The appropriate forecast should therefore keep mine productivity, mill metallurgy and enhanced leaching as separate drivers rather than applying the prospective additive benefit across all processing routes.
U.S. site production and delivery costs increased to $3.93 per pound from $3.59 a year earlier, while by-product credits improved to $0.89 from $0.61. Consequently, net cash costs increased only modestly, to $3.16 from $3.11. Stable net costs would therefore overstate progress in controlling gross costs. Strong molybdenum pricing is masking part of the pressure from energy, consumables and lower productivity.
The historical cost target also requires qualification. During the July call, management stated that the approximately $2.50-per-pound U.S. cost objective remained an aspiration but was not achievable in 2027 under prevailing energy and acid conditions. The current call did not restore that timetable. It instead emphasized that higher copper volumes and productivity, rather than assumed input-price normalization, are the principal routes to lower unit costs.
LEACHING TECHNOLOGY: A MATERIAL OPTION WITH UNRESOLVED COMMERCIAL PARAMETERS
The existing leaching initiative has already produced measurable output. Incremental production reached 55 million pounds in Q3 and 156 million pounds through September. The current quarterly pace annualizes to approximately 220 million pounds, consistent with management’s expectation of slightly more than 200 million pounds for 2026. The 300 million-pound target for 2027 therefore represents approximately 36% growth from the current annualized pace and roughly 40% to 50% growth from likely full-year 2026 output.
The initiative’s development stages should be distinguished. Initial gains came largely from better solution distribution, sensors, targeted drilling, injection and irrigation of previously inaccessible areas. The initial additive subsequently demonstrated field performance consistent with laboratory expectations. The next stage involves newly developed proprietary additives, supplemented where beneficial by higher stockpile temperatures. Confidence in the initial additive’s laboratory-to-field transfer is useful evidence, but it does not prove that the next generation will scale equivalently.
Management described laboratory testing as showing incremental recoveries “of more than 4x those achieved with our initial additive.” This is a comparison of incremental recoveries from different additives. It does not mean total recovery will increase 4x, production will increase 4x, or all stockpiled copper will become economically recoverable. Likewise, references to a recovery uplift of 40% or more did not consistently establish whether the comparison involved a relative percentage change or percentage-point improvement. Absolute recovery assumptions should not be reconstructed from those remarks without additional definitions.
Quirk’s suggestion that leaching could eventually compete with mill recovery is potentially significant, but explicitly ore-dependent. Different starting recoveries, mineral assemblages and stockpile conditions can produce materially different outcomes. A high recovery achieved over a prolonged leach cycle is also economically different from a similar recovery obtained rapidly through milling. Recovery kinetics affect working capital, solution inventories, production scheduling and discounted value.
Commercial-scale validation must establish more than final extraction rates. Relevant variables include reagent consumption and cost, copper recovery over time, solution contact, permeability, temperature sensitivity, ore variability, manufacturing consistency, and the capacity of downstream solution-processing and electrowinning infrastructure. The call did not provide enough information to calculate commercial incremental cash costs or capital requirements at the 800 million-pound scale.
Management accepted approximately 6 to 12 months as a reasonable evaluation period, with informative results expected by around Q3 2027 and updates each quarter. Quirk observed that recoveries continue improving with longer exposure, which supports cumulative extraction but also means early results may not fully establish ultimate economics. Multiple successful field applications would carry greater valuation significance than a favorable result at a limited number of selected stockpiles.
The distinction between guidance and aspiration was clear: 300 million pounds is included in 2027 and 2028 forecasts; the 800 million-pound objective is not. Quirk stated that “the 800 million is going to depend on the results in the field.” The incremental opportunity relative to the embedded forecast is therefore approximately 500 million pounds, not 800 million pounds. At an illustrative $6 copper price, that additional output would represent $3.0 billion of annual gross metal value before operating costs, capital, royalties, taxes and ownership interests.
More than 40 billion pounds of copper is already contained in aboveground stockpiles. This is a large technical opportunity, not an equivalent statement of economically recoverable reserves. The 800 million-pound objective would equal approximately 2% of that headline inventory annually, but annual recoverability depends on access, mineralogy, kinetics and processing capacity. The strategic upside is broader than stockpiles alone: successful additives could also improve recoveries from new ore placements and change the optimal processing design for future developments.
ENERGY, ACID AND THE QUALITY OF COST PROTECTION
Energy costs are expected to be approximately $500 million higher in 2026 than in 2025, principally because of diesel, with electricity also contributing. The company consumes approximately 275 million gallons of diesel annually, including approximately 100 million gallons in the U.S. and 80 million gallons in Peru. A $1-per-gallon change would therefore represent approximately $275 million of gross annual expenditure at unchanged consumption, before contractual terms or other offsets.
Management stated that current energy conditions are incorporated into its forward financial scenarios. The modeled growth in EBITDA and cash flow consequently does not depend on assuming a return to 2025 energy prices. That is a constructive feature of the forecasts. Nevertheless, the lack of a detailed regional and input-level bridge limits the ability to separate temporary commodity inflation from structural increases in labor, maintenance, materials and electricity tariffs.
Sulfuric acid prices have more than doubled during 2026. Freeport benefits from producing acid through its smelting operations while consuming it in leaching, providing an important group-level offset. However, management clarified that U.S. operations are net acid buyers. Higher acid prices can therefore worsen U.S. mine costs even when offsetting revenues arise elsewhere. Location, transport requirements and availability also mean that vertical integration is not equivalent to a complete physical or economic hedge.
Maintaining full-year consolidated net cash cost guidance at $1.90 per pound should not be interpreted as flat underlying costs. Higher by-product credits, especially molybdenum, are offsetting inflation. Q3 net cash costs of $2.07 were approximately 48% above the prior-year level and approximately 4% above July’s quarterly forecast, partly because delayed gold sales reduced credits. The expected Q4 improvement is therefore substantially a sales-mix and by-product-credit event.
CAPITAL EXPENDITURE: A RISING BASE BEFORE BAGDAD
The 2026 capital forecast increased to $4.4 billion from $4.3 billion. The 2027 forecast increased to $5.2 billion from $4.8 billion, an 8.3% revision and an 18.2% increase over the current 2026 budget. July’s $4.8 billion forecast had itself increased approximately $300 million from the April estimate. The implied increase in the 2027 budget since April is approximately $700 million, or 15.6%.
Approximately 50% of the latest $400 million increase relates to additional mining equipment. The balance includes inflation and additional expenditure associated with Atlantic Copper’s circular project. This is not solely passive cost escalation: part represents an active decision to invest for higher productivity. However, incremental equipment purchases require demonstrated improvements in movement, utilization and copper output to earn an adequate return.
Discretionary capital is now approximately $2.0 billion for 2027, compared with $1.9 billion previously. The remaining planned capital component consequently increases to approximately $3.2 billion from $2.9 billion. This distinction matters because planned expenditure is deducted before determining cash available under the performance-based distribution framework. A rising planned-capital base can reduce the shareholder-return pool even when headline discretionary growth spending changes relatively little.
Management did not provide a 2028 capital budget or commit to spending declining after 2027. Quirk instead indicated a willingness to pursue additional investments with attractive economics and rapid paybacks. The appropriate interpretation is that capital intensity may remain elevated as Freeport seeks to maximize production from its existing resource base.
The statement that near-term volume growth “does not require new capital” should be interpreted narrowly. The recovery from approximately 3.0 billion pounds toward more than 4.0 billion pounds does not require a new transformational project comparable with Bagdad. It does not mean that recovery, sustaining operations, underground development or productivity improvements are capital-free.
BAGDAD: ATTRACTIVE STRATEGIC EXPOSURE, MATERIAL CAPITAL COMMITMENT
Bagdad’s final investment decision is expected in Q4 2026. Management stated that the necessary permits are available, the haulage fleet has been converted to autonomous operation, and preparatory work on tailings infrastructure is progressing. These factors reduce permitting and operational-readiness risk relative to a greenfield project.
The proposed expansion would add approximately 200 million to 250 million pounds of annual copper production and 10 million to 12 million pounds of molybdenum. The go-forward capital estimate remains approximately $4.5 billion. This is unchanged from the July indication, but July’s estimate was already approximately 30% above the estimate prepared in 2023. Maintaining the latest estimate is therefore incremental cost stability, not evidence that the project has avoided substantial historical inflation.
Management’s statement that “in current dollars, we’re drawing a circle around $4.5 billion” is an important qualification. The estimate is not a fixed nominal-dollar commitment insulated from future escalation. Skilled labor competition in Arizona, equipment, steel, tariffs and energy remain relevant risks. Prefabrication, owner-led project controls and established contractor relationships can mitigate execution risk but cannot eliminate market-wide inflation.
The copper increment equates to approximately 91,000 to 113,000 metric tons annually. Dividing $4.5 billion by that capacity produces gross copper capital intensity of approximately $40,000 to $50,000 per annual metric ton. Management cited approximately $35,000 per ton on a copper-equivalent basis including molybdenum. That comparison is reasonable only if by-product assumptions and cost allocation are consistent across projects.
At the modeled $32 molybdenum price, the additional 10 million to 12 million pounds would generate approximately $320 million to $384 million of annual gross revenue. Molybdenum is therefore a material component of project economics rather than a marginal credit. The earnings release stated that the project is supported at an incentive copper price near $4 per pound, but did not disclose enough detail to reconstruct an independent project IRR or NPV.
Completion is expected approximately 3.5 years after approval, implying around mid-2030 for a late-2026 decision. That is a construction timetable, not a guarantee of immediate steady-state production. The $4.5 billion also represents future incremental expenditure, not necessarily the project’s entire historical economic investment, because preparatory spending has already occurred.
The most important cash-flow clarification came at the end of the call: “for the $4.5 billion, we do not have anything in ’27 at this point.” The current $5.2 billion 2027 budget therefore excludes the expansion itself, although preparatory tailings expenditure is already included. A simple $4.5 billion allocation over 3.5 years averages approximately $1.3 billion annually, but actual spending will be uneven. This calculation illustrates the potential additional funding requirement; it is not annual guidance.
LONGER-TERM DEVELOPMENT AND RESOURCE OWNERSHIP
Safford/Lone Star remains a substantial option rather than an executable near-term investment. Initial studies are expected in 2027, but management did not provide a more precise completion date. Importantly, the optimal processing route remains under evaluation. Successful enhanced leaching could reduce or alter the need for a large concentrator, while milling and leaching may ultimately be combined. Waiting for commercial leach evidence can therefore improve capital allocation rather than simply delaying development.
El Abra offers potential production growth exceeding 700 million pounds annually. Its environmental impact study was submitted in March 2026, and the regulatory process continues. The approximately $7.5 billion preliminary capital estimate disclosed in the release is based on 2024 estimates and remains under review. Given current industry inflation, it should not be treated as a firm contemporary construction budget. The existing operation also faces nearer-term sequencing and slope-management constraints, illustrating that brownfield development still entails geotechnical and operating risk.
The 2030 production aspiration of 4.5 billion to 5.0 billion pounds is directionally consistent with adding approximately 500 million pounds of leach output above the embedded 300 million-pound level and approximately 200 million to 250 million pounds from Bagdad to the 2028 base. It is not an additive forecast independent of depletion, ore sequencing or execution. The entire 800 million-pound leach aspiration should not be added again to the base.
Indonesia’s operating-rights extension remains an important strategic catalyst but is not yet finalized. The February memorandum of understanding contemplates life-of-resource operating rights beyond 2041, with FCX maintaining its 48.76% ownership through 2041 and holding approximately 37% beginning in 2042. The formal extension application was submitted in June, and an amended license remains necessary.
The proposed extension improves continuity and long-duration resource value, but the ownership change matters economically. Moving from 48.76% to approximately 37% reduces FCX’s proportional interest by approximately 24%. Terminal valuation should therefore reflect both extended operating rights and reduced attributable participation after 2041. Government support and a signed memorandum should not be treated as equivalent to completed legal implementation.
CASH FLOW, LIQUIDITY AND SHAREHOLDER DISTRIBUTIONS
Q3 operating cash flow was $1.981 billion compared with $1.689 billion a year earlier. Capital expenditure was $1.159 billion, producing approximately $822 million of operating cash flow less capital expenditure, compared with $633 million in Q3 2025. This analytical free-cash-flow measure increased approximately 30%, although it declined from $944 million in Q2.
The year-to-date comparison requires adjustment for insurance proceeds. Reported operating cash flow through September was $5.524 billion, up from $4.942 billion, but included $699 million of proceeds from the Grasberg mud-rush insurance settlement received in Q2. Removing that cash receipt produces approximately $4.825 billion, approximately 2.4% below the prior-year reported amount. This is a simple cash-receipt adjustment, not a fully tax-normalized measure. It nevertheless demonstrates that reported year-to-date cash growth was materially assisted by a nonrecurring recovery.
Conversely, Q3 operating cash flow was stronger than the sequential headline comparison suggests because Q2 included the insurance receipt. The quarter generated nearly $2.0 billion of operating cash without a comparable settlement benefit despite approximately $400 million of working-capital and other uses. The positive implication is improving operating cash generation; the qualification is that inventories continue absorbing liquidity.
Full-year operating cash-flow guidance increased modestly to approximately $8.5 billion from $8.3 billion in July. The updated forecast assumes Q4 copper at $6.50 per pound, gold at $4,000 per ounce and molybdenum at $32 per pound. July assumed $6 copper and $30 molybdenum for 2H, with the same gold assumption. Working-capital and other uses increased from an estimated $300 million to $600 million. The modest cash-flow upgrade therefore reflects a stronger price environment offset by operating and cash-conversion pressures, not an unqualified improvement in underlying execution.
The current forecast implies approximately $3.0 billion of Q4 operating cash flow and approximately $1.2 billion of Q4 capital spending. Operating cash flow less capital expenditure would consequently approximate $1.8 billion, more than 2x the Q3 result. Meeting that requirement depends on the substantial copper and gold sales increase and improved conversion of inventories into cash.
The release also identified a regulatory complication surrounding Indonesian gold exports. Current regulations specify a 10% export duty, while the company states that its mining license does not require duties on refined gold exports. PTFI is seeking clarification because some projected gold sales may require export-market access. The issue creates potential administrative, timing and fiscal risk, but does not justify assuming that a 10% charge applies to all gold sales.
Consolidated debt of $9.398 billion less cash of $4.335 billion produces conventional consolidated net debt of approximately $5.1 billion. The company’s policy measure of approximately $1.8 billion excludes approximately $3.2 billion of downstream-processing project debt. Both measures are relevant, but the exclusion does not make project debt economically disappear. Similarly, only approximately $3.3 billion of consolidated cash was identified as available to the parent after noncontrolling interests and withholding taxes.
Liquidity appears adequate for the disclosed approximately $1.3 billion of 2027 senior-note maturities, supported by cash and revolving-credit availability. The central balance-sheet question is therefore not immediate refinancing capacity, but how aggressively the company commits to additional growth expenditure while returning capital.
The formal payout framework allocates up to 50% of available cash after planned capital spending and distributions to noncontrolling interests, subject to balance-sheet targets and Board discretion. It is not a commitment to distribute 50% of consolidated operating cash flow, nor necessarily 50% of operating cash flow after all capital expenditures. Discretionary growth projects are funded from retained cash under the framework.
Year-to-date returns totaled $955 million, comprising $650 million of dividends and $305 million of repurchases. Q3 repurchases were $102 million at an average price of $70.75 per share. Repurchased shares through September represented only approximately 0.3% of the diluted share base, so buybacks were not the principal source of EPS growth. Future repurchase effectiveness will depend on both the amount of distributable cash and valuation at execution.
COMMODITY EXPOSURE AND THE LIMITS OF THE STRUCTURAL DEMAND THESIS
The call reinforced strong demand signals from electricity infrastructure, data centers, transportation and Chinese power-grid investment. Freeport’s installed operations and brownfield expansion inventory are strategically valuable in an industry where new projects can require many years of permitting and development. Higher copper prices are signaling a need for additional capacity, and Freeport has credible opportunities to respond.
However, management’s discussion of copper moving into U.S. warehouses requires careful interpretation. Regional stock accumulation can tighten availability elsewhere and influence location premiums without establishing an equivalent increase in global end-use consumption. Inventory relocation, tariff expectations and financing conditions can coexist with genuine demand growth. Regional tightness should not automatically be converted into a quantified global structural deficit.
The earnings sensitivity is substantial. Each $0.10-per-pound change in copper corresponds to approximately $390 million of annual EBITDA in the average 2027–2028 model. A $0.50 change therefore represents approximately $1.95 billion, and a $1.00 change approximately $3.9 billion. These sensitivities are large relative to many of the identified operating improvements and forecast revisions.
Gold and molybdenum remain material secondary exposures. A $500-per-ounce change in gold represents approximately $525 million of annual EBITDA, while a $5-per-pound molybdenum change represents approximately $425 million. Strong by-product prices can mask inflation; weaker by-product prices would expose more of the underlying copper cost base.
Molybdenum also offers optionality through the wholly owned Climax and Henderson mines. Management is revisiting potential expansion opportunities, but copper remains the capital-allocation priority. Production cannot necessarily respond immediately to stronger molybdenum prices because a substantial share comes as a by-product of copper mining and follows copper mine plans. No quantified incremental primary-molybdenum capacity commitment was provided.
INVESTMENT SCENARIOS, CATALYSTS AND RISK DISCIPLINE
An illustrative 50% base case assumes that Grasberg meets its principal 2027 milestones, the 300 million-pound leach forecast is achieved without assigning value to the full 800 million-pound aspiration, and copper averages approximately $6 per pound in the modeled 2027–2028 period. With gold at $4,000 and molybdenum at $32, management’s rounded sensitivities imply annual EBITDA around $16 billion and operating cash flow around $12 billion. Equity value creation depends on converting that cash into attributable returns after planned spending, minority distributions and additional growth commitments.
An illustrative 25% bull case assumes copper near $7, successful Grasberg normalization, controlled Bagdad execution and convincing commercial leach results during 2027. Management’s existing volume model supports approximately $19.5 billion of annual EBITDA and approximately $15 billion of operating cash flow at that copper price. Leach output above the embedded forecast would be additional upside, but its contribution cannot yet be quantified reliably. Successful field validation could increase both expected cash generation and confidence in future U.S. development economics.
An illustrative 25% bear case assumes copper near $5, with no material value assigned to unproven leach scale-up. At planned volumes, management still models more than $12 billion of EBITDA and more than $9 billion of operating cash flow. However, this is not a severe operating-stress case. A simultaneous Grasberg delay, weaker by-product pricing, persistent inflation and higher growth spending would produce a materially worse outcome. Copper below $5 would further amplify downside. These probabilities are analytical judgments, not management guidance or statistically estimated outcomes.
The immediate catalysts are Q4 delivery of 875 million pounds of copper and 300,000 ounces of gold, the Bagdad investment decision, and publication of its spending schedule. Early 2027 brings material-handling completion and deployment of the next-generation additives. Mid-2027 brings the 80% Grasberg capacity target and Production Block 1 South restart. By approximately Q3 2027, commercial leach evidence should become more informative. Year-end 2027 is the key checkpoint for approaching full Grasberg capacity.
The principal adverse review triggers are another reduction in the 2027 production outlook without a clear recovery bridge, slippage in the 80% or year-end Grasberg milestones, weaker U.S. metal output despite additional equipment, sustained working-capital absorption, adverse Indonesian fiscal changes, and capital escalation without corresponding economic improvement. Failure to validate the 800 million-pound leach aspiration would reduce option value, but should not by itself invalidate a valuation based only on the embedded 300 million-pound forecast. A model that already assumes full technology success would be substantially more vulnerable.
At portfolio level, FCX is a concentrated exposure to copper, global industrial activity, electrification spending and Chinese demand, with additional gold and molybdenum sensitivity. It is not a low-correlation substitute for existing AI-infrastructure or industrial-growth positions. Grasberg adds asset-specific and sovereign risk, while energy inflation creates a cost exposure that can compound commodity volatility.
The call supports maintaining carefully sized exposure rather than increasing it solely because of headline earnings growth. For any incremental position, an illustrative initial allocation of 0.5% to 1.0% of portfolio NAV, combined with a 15% price-based stop or mandatory reduction threshold, would imply approximately 7.5 to 15 basis points of planned portfolio risk before gaps and slippage. A material thesis break should trigger review independently of the price threshold. A defensible entry price, target price and expected equity return require a current valuation incorporating attributable ownership, normalized copper assumptions and the updated capital schedule.
The central investment conclusion is that Freeport’s recovery and resource optionality remain attractive, but the quarter was not a clean operational upgrade. Higher metal prices generated strong earnings while lower production forecasts and higher spending reduced underlying forward cash-generation estimates. The most durable upside will come from safe Grasberg normalization, improved U.S. productivity and commercially validated leaching, not from treating elevated commodity prices, accounting reclassification or laboratory results as already secured shareholder value.
COMPANY REPRESENTATIVES ON THE CALL
• David Joint, Vice President, Investor Relations. • Richard C. Adkerson, Chairman of the Board. • Kathleen L. Quirk, President and Chief Executive Officer. • Maree E. Robertson, Executive Vice President and Chief Financial Officer. • Cory Stevens, Senior Vice President; President and Chief Operating Officer, Freeport-McMoRan Americas; President, FM Technical Services. • Mark J. Johnson, President and Chief Operating Officer, Freeport-McMoRan Indonesia; Executive Vice President, PT Freeport Indonesia.
RESEARCH ANALYSTS ON THE CALL
• Richard Garchitorena, Barclays. • Christopher LaFemina, Jefferies. • Katja Jancic, BMO Capital Markets. • Orest Wowkodaw, Scotiabank. • Lawson Winder, Bank of America Securities. • Timna Tanners, Wells Fargo. • William Peterson, JPMorgan. • Daniel Major, UBS. • Bob Brackett, Bernstein Research. • Nicklaus Cash, Goldman Sachs. • Brian MacArthur, Raymond James. • Liam Fitzpatrick, Deutsche Bank.
Key Read-Throughs
KEY READ-THROUGHS FROM FREEPORT-MCMORAN’S Q3 2026 EARNINGS CALL
Freeport’s call points to increasing differentiation across the copper and electrification supply chains rather than a uniformly positive commodity trade. Higher metal prices are supporting producer profitability, but additional production increasingly requires more equipment, scarce labor and expensive processing inputs. The most actionable implications are stronger demand for mining automation, greater construction-cost risk for competing Arizona projects, and sharply different economics for sulfuric-acid buyers versus sellers. Direct joint-venture interests provide more reliable company-specific signals than broad thematic extrapolation. Electrical infrastructure demand remains strong, although copper inflation can inflate cable manufacturers’ reported revenue while absorbing cash. The assessments below distinguish financial materiality from likely trading surprise and identify where Freeport corroborates information peers have already disclosed. Countries denote corporate domicile, not necessarily operating location.
MINING EQUIPMENT AND PROJECT DEVELOPMENT
AUTONOMOUS MINING BENEFITS FROM LABOR CONSTRAINTS AND APPROVED EQUIPMENT SPENDING (READ-THROUGH 1)
Affected company: Caterpillar (CAT: United States). Direction: Positive. Magnitude: Moderate for the relevant mining-equipment and technology businesses; initially small at consolidated group level.
Call evidence: Freeport increased its 2027 capital budget by $400 million, with approximately 50% attributable to additional mining equipment. Quirk also confirmed that Bagdad’s haulage fleet is fully autonomous and explained that expansion would allow the company to “continue to add autonomous trucks to scale” without proportionately increasing staffing. Labor availability was identified as a constraint on U.S. production growth.
The transmission mechanism is more specific than a general improvement in mining sentiment. Caterpillar is the verified incumbent at Bagdad: its previously announced deployment involved converting 33 Cat 793 trucks using MineStar Command for hauling. Freeport’s operating experience therefore validates an installed Caterpillar platform rather than an unspecified automation concept. Expanding an already autonomous operation creates opportunities for additional compatible equipment, controls, implementation services, maintenance and replacement parts. Higher utilization can also support aftermarket demand before substantial new mine capacity is commissioned.
The approximately $200 million increase in Freeport’s equipment budget is a confirmed customer spending signal, but it is not a disclosed Caterpillar order. Freeport did not identify suppliers for the additional equipment, and purchases elsewhere in the portfolio could involve competing manufacturers. Likewise, completion of the original Bagdad conversion should not be counted again as new revenue.
The near-term catalyst is Caterpillar’s October 29 results and commentary on mining orders, dealer demand and autonomous-fleet deployments. Bagdad’s expected Q4 investment decision is a subsequent customer-specific catalyst, although equipment orders and recognized revenue would follow their own schedules. The longer-duration implication is favorable: automation is increasingly enabling mine expansions that otherwise face labor constraints. This supports the strategic value of Caterpillar’s installed technology and service ecosystem, without establishing an immediate group-level earnings upgrade.
ARIZONA’S COPPER BOOM INCREASES CONSTRUCTION COMPETITION FOR COPPER WORLD (READ-THROUGH 2)
Affected companies: Hudbay Minerals (HBM: Canada) and Mitsubishi Corporation (8058: Japan). Direction: Negative for project execution economics at unchanged copper prices. Magnitude: Moderate for Hudbay’s development exposure; comparatively small at Mitsubishi’s diversified group level.
Call evidence: Bagdad’s estimated forward capital requirement remains approximately $4.5 billion, but Quirk qualified that estimate as being “in current dollars.” Management specifically identified competition from semiconductor construction, electricity infrastructure and data centers for skilled Arizona labor. Steel, equipment, tariffs and energy were also identified as cost pressures. Freeport expects construction to take approximately 3.5 years after approval.
Copper World faces overlapping geographic and construction-market exposures. Hudbay and Mitsubishi approved its development on October 21, before Freeport’s call, with initial growth capital of approximately $2.07 billion and production targeted for 2H 2029. Hudbay owns 70% and Mitsubishi 30%. Copper World and Bagdad would therefore draw on portions of the same regional labor, contractor and infrastructure ecosystem during overlapping construction periods.
The economic transmission is through contractor pricing, labor productivity, procurement costs and schedule risk. Competition can raise the cost of completing the existing scope or delay commissioning, reducing project NPV even if the resource and eventual production remain unchanged. As an illustrative sensitivity, a 10% increase in Copper World’s initial capital would equal approximately $207 million. The proportional economic exposure would be approximately $145 million for Hudbay and $62 million for Mitsubishi before financing arrangements or mitigation. This is a sensitivity, not evidence that an overrun has occurred.
The October 21 feasibility decision already incorporated a contemporary project estimate, so Freeport’s remarks should not be treated as a newly announced Hudbay cost increase. The incremental information is corroboration from another major Arizona operator that inflation and skilled-labor competition remain active risks.
Near-term catalysts are contracting disclosures, procurement commitments and early construction updates during late 2026 and 2027. The longer-duration risk is weaker capital efficiency across the regional development pipeline. Higher copper prices support project returns, but they also encourage simultaneous construction that can transfer part of the commodity upside to labor and suppliers.
PROCESSING CHEMICALS AND SMELTING
FLORENCE’S ACID CONTRACT RESET IS A 2027 MARGIN RISK, NOT AN IMMEDIATE SPOT-COST SHOCK (READ-THROUGH 3)
Affected company: Trekor Metals, formerly Taseko Mines (TKO: Canada). Direction: Negative for Florence’s prospective operating costs. Magnitude: Potentially material at Florence and meaningful for group growth economics.
Call evidence: Freeport stated that sulfuric acid prices had more than doubled during 2026. Quirk clarified that the U.S. business remains a net acid buyer even though acid revenues elsewhere offset some exposure at the consolidated level. The call therefore distinguishes the economics of a standalone acid-consuming operation from those of an integrated mining and smelting group.
Florence’s in-situ recovery process consumes sulfuric acid to dissolve copper before solvent extraction and electrowinning. Trekor’s October site-tour materials disclosed a fixed delivered acid price of approximately $270 per ton for 2026, expected higher pricing for 2027, and supplier negotiations beginning during October. The same materials estimated approximately 220,000 tons of acid consumption in 2027.
The contractual timing makes this a particularly actionable read-through. Freeport’s discussion does not support applying current spot inflation directly to Florence’s 2026 costs because that year’s supply is fixed-price. It does strengthen the case for scrutiny of the 2027 contract reset, especially as higher production increases absolute acid consumption.
At the disclosed consumption level, a $100-per-ton increase would represent approximately $22 million of annual gross expenditure before mitigation. Trekor separately identified an approximate $0.30-per-pound operating-cost sensitivity to a $100-per-ton acid-price change. These are substantial sensitivities for an operation whose investment appeal includes low steady-state costs. Neither calculation implies that the contract will increase by that amount.
The near-term catalyst is disclosure of 2027 acid procurement terms and the associated operating-cost outlook. The longer-duration implication is that commissioning progress and unit-cost normalization should be assessed separately from reagent inflation: higher copper output can improve fixed-cost absorption while a less favorable acid contract offsets part of that improvement. The principal uncertainty is the negotiated delivered price, not whether Florence has meaningful acid exposure.
SULFURIC ACID SUPPORTS AURUBIS, BUT GRASBERG’S RECOVERY DOES NOT GUARANTEE CONCENTRATE-FEE RELIEF (READ-THROUGH 4)
Affected company: Aurubis (NDA: Germany). Direction: Positive for sulfuric-acid revenue; negative for an investment thesis that assumes Grasberg automatically normalizes merchant concentrate availability. Magnitude: Moderate for smelting profitability, with the net effect dependent on contract realizations and other earnings drivers.
Call evidence: Freeport described sulfuric acid as a source of protection against higher processing costs because its smelters produce acid. It also confirmed that both Indonesian smelters are operating “to support our mine ramp up.” These comments identify separate economic channels that should not be conflated.
Aurubis produces sulfuric acid as a by-product of concentrate processing. Higher acid realizations can increase revenue from an existing production stream and offset pressure on treatment and refining charges. Its August results already demonstrated this mechanism: higher sulfuric-acid revenue contributed to improved earnings, while management described concentrate treatment and refining charges as remaining under pressure. Freeport’s October commentary supports persistence of the favorable acid environment rather than revealing an entirely new profit source.
The distinction between mine production and merchant concentrate supply is equally important. More Grasberg copper does not necessarily create proportionately more concentrate for independent smelters because Freeport is restoring its own downstream capacity alongside the mine. An increase in refined copper supply can coexist with continued competition for third-party concentrate. Therefore, the approximately 500 million-pound increase in Indonesian copper sales expected in 2027 cannot simply be translated into improved feedstock availability or processing fees for Aurubis.
The near-term catalysts are Aurubis’s December 2 annual results, its fiscal 2026/2027 outlook, and subsequent concentrate and acid contract disclosures. Since Aurubis had already guided toward the upper end of its earnings range in August, the call is corroborative rather than sufficient grounds for a new earnings surprise assumption.
The longer-duration implication is greater importance of earnings diversification within smelting. Acid sales, recycling, metal recovery and product premiums can provide resilience when concentrate fees are weak. This is not equivalent to a straightforward leveraged copper-price position, and stronger accounting earnings need not eliminate working-capital requirements during plant commissioning.
DIRECT COPPER-MINE OWNERSHIP AND MINORITY INTERESTS
CERRO VERDE PROVIDES A DIRECT POSITIVE EARNINGS CHANNEL INTO BUENAVENTURA (READ-THROUGH 5)
Affected company: Compañía de Minas Buenaventura (BVN: Peru). Direction: Positive. Magnitude: Material to affiliate earnings and potentially to cash receipts, although dividends remain discretionary.
Call evidence: Quirk described Cerro Verde as continuing to demonstrate “solid operating performance and productivity.” Freeport also highlighted strong copper pricing and rising molybdenum by-product contributions. This combination is particularly relevant to an existing, large-scale copper and molybdenum operation.
Buenaventura owns 19.58% of Cerro Verde. The relationship is therefore direct, not merely a shared commodity exposure. Higher realized metal prices, sustained processing performance and stronger molybdenum revenue increase the joint venture’s earnings capacity, subject to operating costs, taxes and employee profit sharing. Buenaventura recognizes its interest through affiliate earnings rather than consolidating 19.58% of Cerro Verde’s revenue.
The materiality is demonstrable. Buenaventura disclosed $274.1 million of Cerro Verde dividends received through July 24, including a $117.5 million July payment. Those distributions were already known before Freeport’s call and should not be presented as newly announced cash. However, they establish that Cerro Verde is a significant source of liquidity rather than an immaterial portfolio investment. Mechanically, a $100 million change in Cerro Verde net income would correspond to approximately $19.6 million of Buenaventura’s equity share before holding-company adjustments.
The positive signal is principally earnings quality and pricing, not an assertion of accelerating physical output. Freeport’s release showed Cerro Verde copper production below the prior-year quarter. Strong realized prices and molybdenum credits can nevertheless support higher profitability despite modestly lower tonnage.
The near-term catalyst is Buenaventura’s late-October Q3 financial reporting, particularly affiliate earnings, cash receipts and commentary on future Cerro Verde distributions. Its operating release had already disclosed production, so Freeport adds more information about operating quality and the price-cost environment than about previously unknown volumes. Longer term, Cerro Verde provides copper-linked funding capacity alongside Buenaventura’s precious-metals operations, but forecast equity-accounted profits should not be treated as immediately distributable cash.
MORENCI TRANSMITS U.S. PRODUCTIVITY AND COST PRESSURES INTO SUMITOMO METAL MINING (READ-THROUGH 6)
Affected company: Sumitomo Metal Mining (5713: Japan). Direction: Negative for Morenci operating assumptions; mixed at group level because stronger metal prices and other assets provide offsets. Magnitude: Moderate for the affected copper-mining exposure, smaller for the diversified group.
Call evidence: Freeport reported extreme weather disruptions in the U.S. that continued into Q4, lower recoveries associated with ore characteristics, and renewed inflation in electricity, materials and supplies. Cory Stevens acknowledged that “we’re missing expectations of where we really wanted to be.” Quirk specifically emphasized increasing mining rates at Morenci, where the operation processes substantially all material mined.
Sumitomo Metal Mining owns 25% of Morenci. Its disclosures identify this interest within consolidated operations, unlike its 16.8% Cerro Verde interest, which is equity-accounted. Morenci’s production, processing costs and investment requirements therefore transmit directly into Sumitomo’s copper-mining economics through the ownership interest.
The negative signal is not that copper profitability must decline. It is that a model based primarily on higher copper prices risks overstating operating conversion if it assumes improving output and stable underlying costs. Freeport’s reported U.S. site production and delivery costs increased to $3.93 per pound from $3.59 a year earlier, while stronger by-product credits masked much of that pressure in net unit costs. Those are regional figures, not Morenci-specific costs, and should not be inserted unchanged into Sumitomo’s mine model. Nevertheless, Morenci’s disclosed copper production also declined year over year, supporting caution on the physical operating outlook.
This provides a meaningful update to Sumitomo’s August characterization that its other copper mines were operating broadly according to plan. The persistence of U.S. weather disruption into Q4 increases the relevance for forward assumptions rather than merely explaining a completed quarter.
The near-term catalyst is Sumitomo’s November first-half reporting and any revisions to Morenci production, costs or spending. The longer-duration implication is that mature, low-grade copper assets increasingly require additional movement, equipment and operating sophistication to maintain output. Freeport’s proprietary leach initiative offers potential upside at Morenci, but unproven commercial results should not be used to offset a current cost headwind in Sumitomo’s base case.
COPPER PRODUCERS AND BY-PRODUCT ECONOMICS
MOLYBDENUM EXPOSURE AND EXISTING CAPACITY SUPPORT SOUTHERN COPPER’S RELATIVE RESILIENCE (READ-THROUGH 7)
Affected company: Southern Copper (SCCO: United States). Direction: Positive for ongoing cash-generation capacity. Magnitude: High fundamental relevance, but limited incremental trading surprise because the company already reported Q3 results.
Call evidence: Freeport maintained 2026 net cash-cost guidance despite higher input costs, explicitly citing by-products, particularly molybdenum, as an offset. Management also described favorable molybdenum demand and supply conditions while acknowledging that capital-cost inflation is exceeding headline inflation. The combination favors existing production with substantial by-product exposure over growth plans requiring large new capital commitments.
Southern Copper has meaningful molybdenum production alongside copper, silver and zinc. Its October 20 release reported Q3 copper cash costs net of by-product credits of approximately $0.09 per pound, with stronger by-product revenue driving the improvement. This is direct evidence that the offset described by Freeport is operating elsewhere in the sector, rather than a company-specific accounting curiosity.
The molybdenum sensitivity is economically meaningful. Southern Copper sold approximately 7,894 metric tons in Q3, equivalent to approximately 17.4 million pounds. At unchanged quarterly sales volume, a $1-per-pound molybdenum price change represents approximately $17.4 million of gross quarterly revenue before taxes, contractual timing and other adjustments. This is a revenue sensitivity, not an EBITDA forecast.
The longer-duration positive is the value of installed production capacity when replacement supply becomes more expensive. Freeport’s $4.5 billion Bagdad estimate and escalating equipment budgets reinforce the substantial cost and time required to add new copper production. Existing operations can capture higher realizations before competing projects reach production. Southern Copper is not immune to inflation or project risk, but its current cash-generating base is valuable in that environment.
The near-term read-through is confirmation of Q4 price and by-product support, not a prediction of a Q3 beat that has already occurred. Southern Copper had already reported strong operating cash flow, so Freeport’s weaker underlying year-to-date cash conversion should not be transferred mechanically across the sector. The next important catalysts are 2027 operating and capital guidance and continued evidence that by-product benefits are retained after higher gross costs.
The principal qualification is that exceptionally low net cash costs are partly a commodity-price outcome. A reversal in molybdenum or other by-product prices would reduce the apparent cost advantage even without a deterioration in mining efficiency.
ELECTRIFICATION EQUIPMENT AND CABLES
STRONG GRID DEMAND SUPPORTS CABLE VOLUMES, BUT HIGHER COPPER PRICES ARE NOT A MARGIN WINDFALL (READ-THROUGH 8)
Affected companies: Prysmian (PRY: Italy) and Nexans (NEX: France). Direction: Positive for underlying demand and capacity utilization; negative for gross working-capital requirements and potentially for margins during repricing lags. Magnitude: Moderate to high for exposed electrical-cable businesses; low incremental surprise where demand strength is already disclosed.
Call evidence: Freeport’s U.S. customers reported “robust copper demand” associated with electricity infrastructure, data-center construction and transportation. Management also cited substantial requirements for power-grid investment and continued movement of copper into U.S. warehouses. These comments provide upstream confirmation of electrical-material demand, but do not identify Prysmian or Nexans as named Freeport customers.
The fundamental mechanism is increased demand for cable systems, conductors and grid connections as electricity generation, transmission and distribution expand. Higher physical throughput and utilization can improve cable-manufacturing profitability, particularly where qualified capacity and installation capabilities are constrained. This is more directly relevant to cable businesses than to a generalized upgrade for all AI-related equities.
Timing matters. Nexans had already reported its Q3 sales update on October 22, including 9.0% group organic growth and 7.1% organic growth in electrification. Freeport therefore corroborates an already reported demand pattern rather than providing a leading signal for that completed release. Prysmian’s October 29 results are the more immediate trading catalyst, especially the separation of organic growth, metal-price effects, operating margins and cash conversion.
Copper inflation should not be confused with value-added growth. Prysmian’s first-half report identified approximately €1.089 billion of revenue growth from metal-price changes, compared with approximately €697 million from organic growth. Higher metal content can therefore produce strong reported revenue without equivalent growth in manufacturing activity or profit. Current-metal-price margin percentages can also change mechanically as the revenue denominator rises.
The cash transmission is different from the earnings transmission. Higher copper prices increase the value of inventories and receivables that must be financed. Price-adjustment mechanisms and hedging can protect economic exposure without eliminating the timing gap between purchasing metal and collecting customer cash. Supplier payment terms and customer advances can offset that requirement, particularly in large transmission projects, so the effect should not be applied uniformly across segments.
Prysmian’s first-half net operating working capital had already increased by €439 million year over year, although that entire movement cannot be attributed to copper. Nexans maintained its full-year cash-flow guidance in its October update, providing an important counterweight to a blanket cash-flow downgrade.
The longer-duration implication remains positive for electrical infrastructure demand, but the higher-quality earnings signal is growth in physical activity, value-added profitability and cash conversion, not metal-inflated sales. Cross-portfolio exposure should distinguish copper producers, which retain commodity-price upside on owned output, from cable manufacturers, whose principal opportunity is supplying more infrastructure while managing the financing and repricing of expensive metal.
Report record
- Sector
- Materials
- Industry
- Metals and Mining
- Fiscal period end
- September 30, 2026
- Report date
- October 27, 2026
- Analysis
- 6424 words
- Read-throughs
- 3008 words
- Content fingerprint (PDF)
466cc666854b- Content fingerprint (analysis)
e4055e76a03c- Content fingerprint (read-throughs)
6937c1a47d13
Prepared from the company's earnings release and earnings call transcript. Figures as reported by the company. For information only. Not investment advice.
More from Freeport-McMoRan Inc.
No other reports yet.
All Freeport-McMoRan Inc. reports
More in Materials
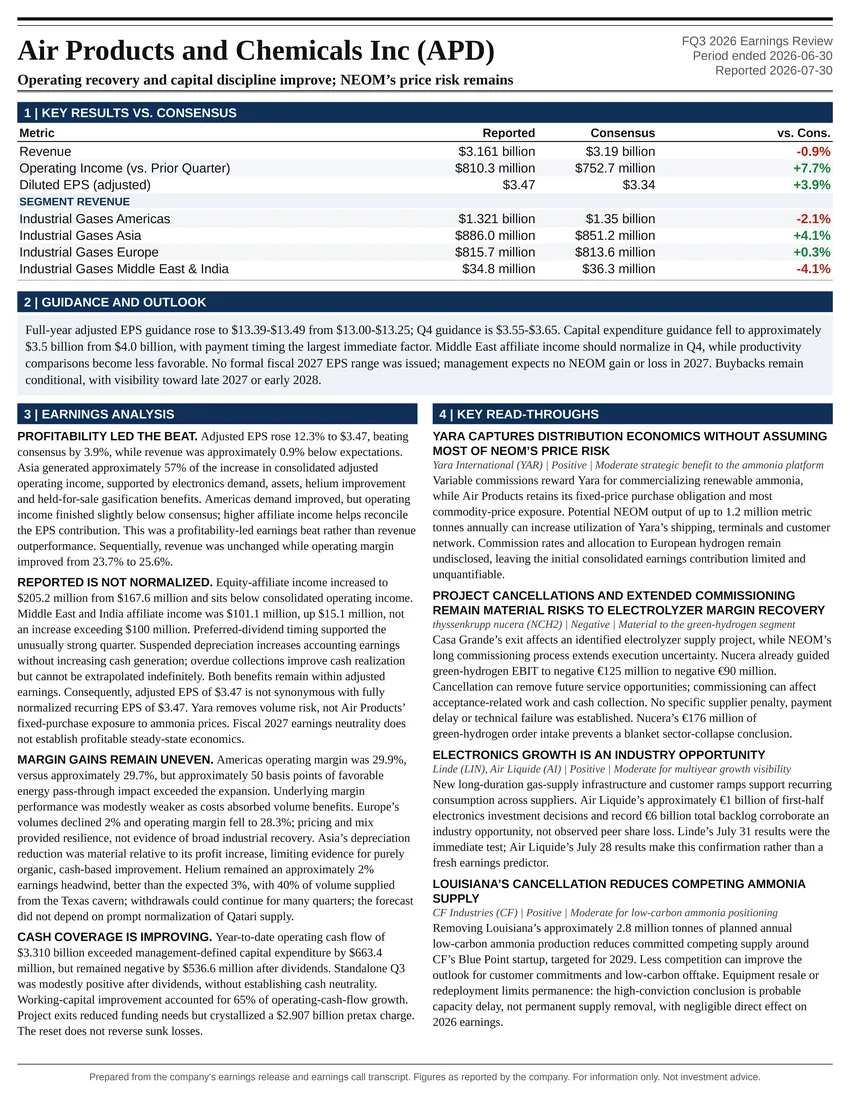
Operating recovery and capital discipline improve; NEOM’s price risk remains
Follow @AtlasPeakRes on X for new earnings reports as they publish.