Improved confidence in the current plan, not a higher near-term earnings trajectory
Earnings Reports
FirstEnergy Corp. FQ3 2026 Earnings Report
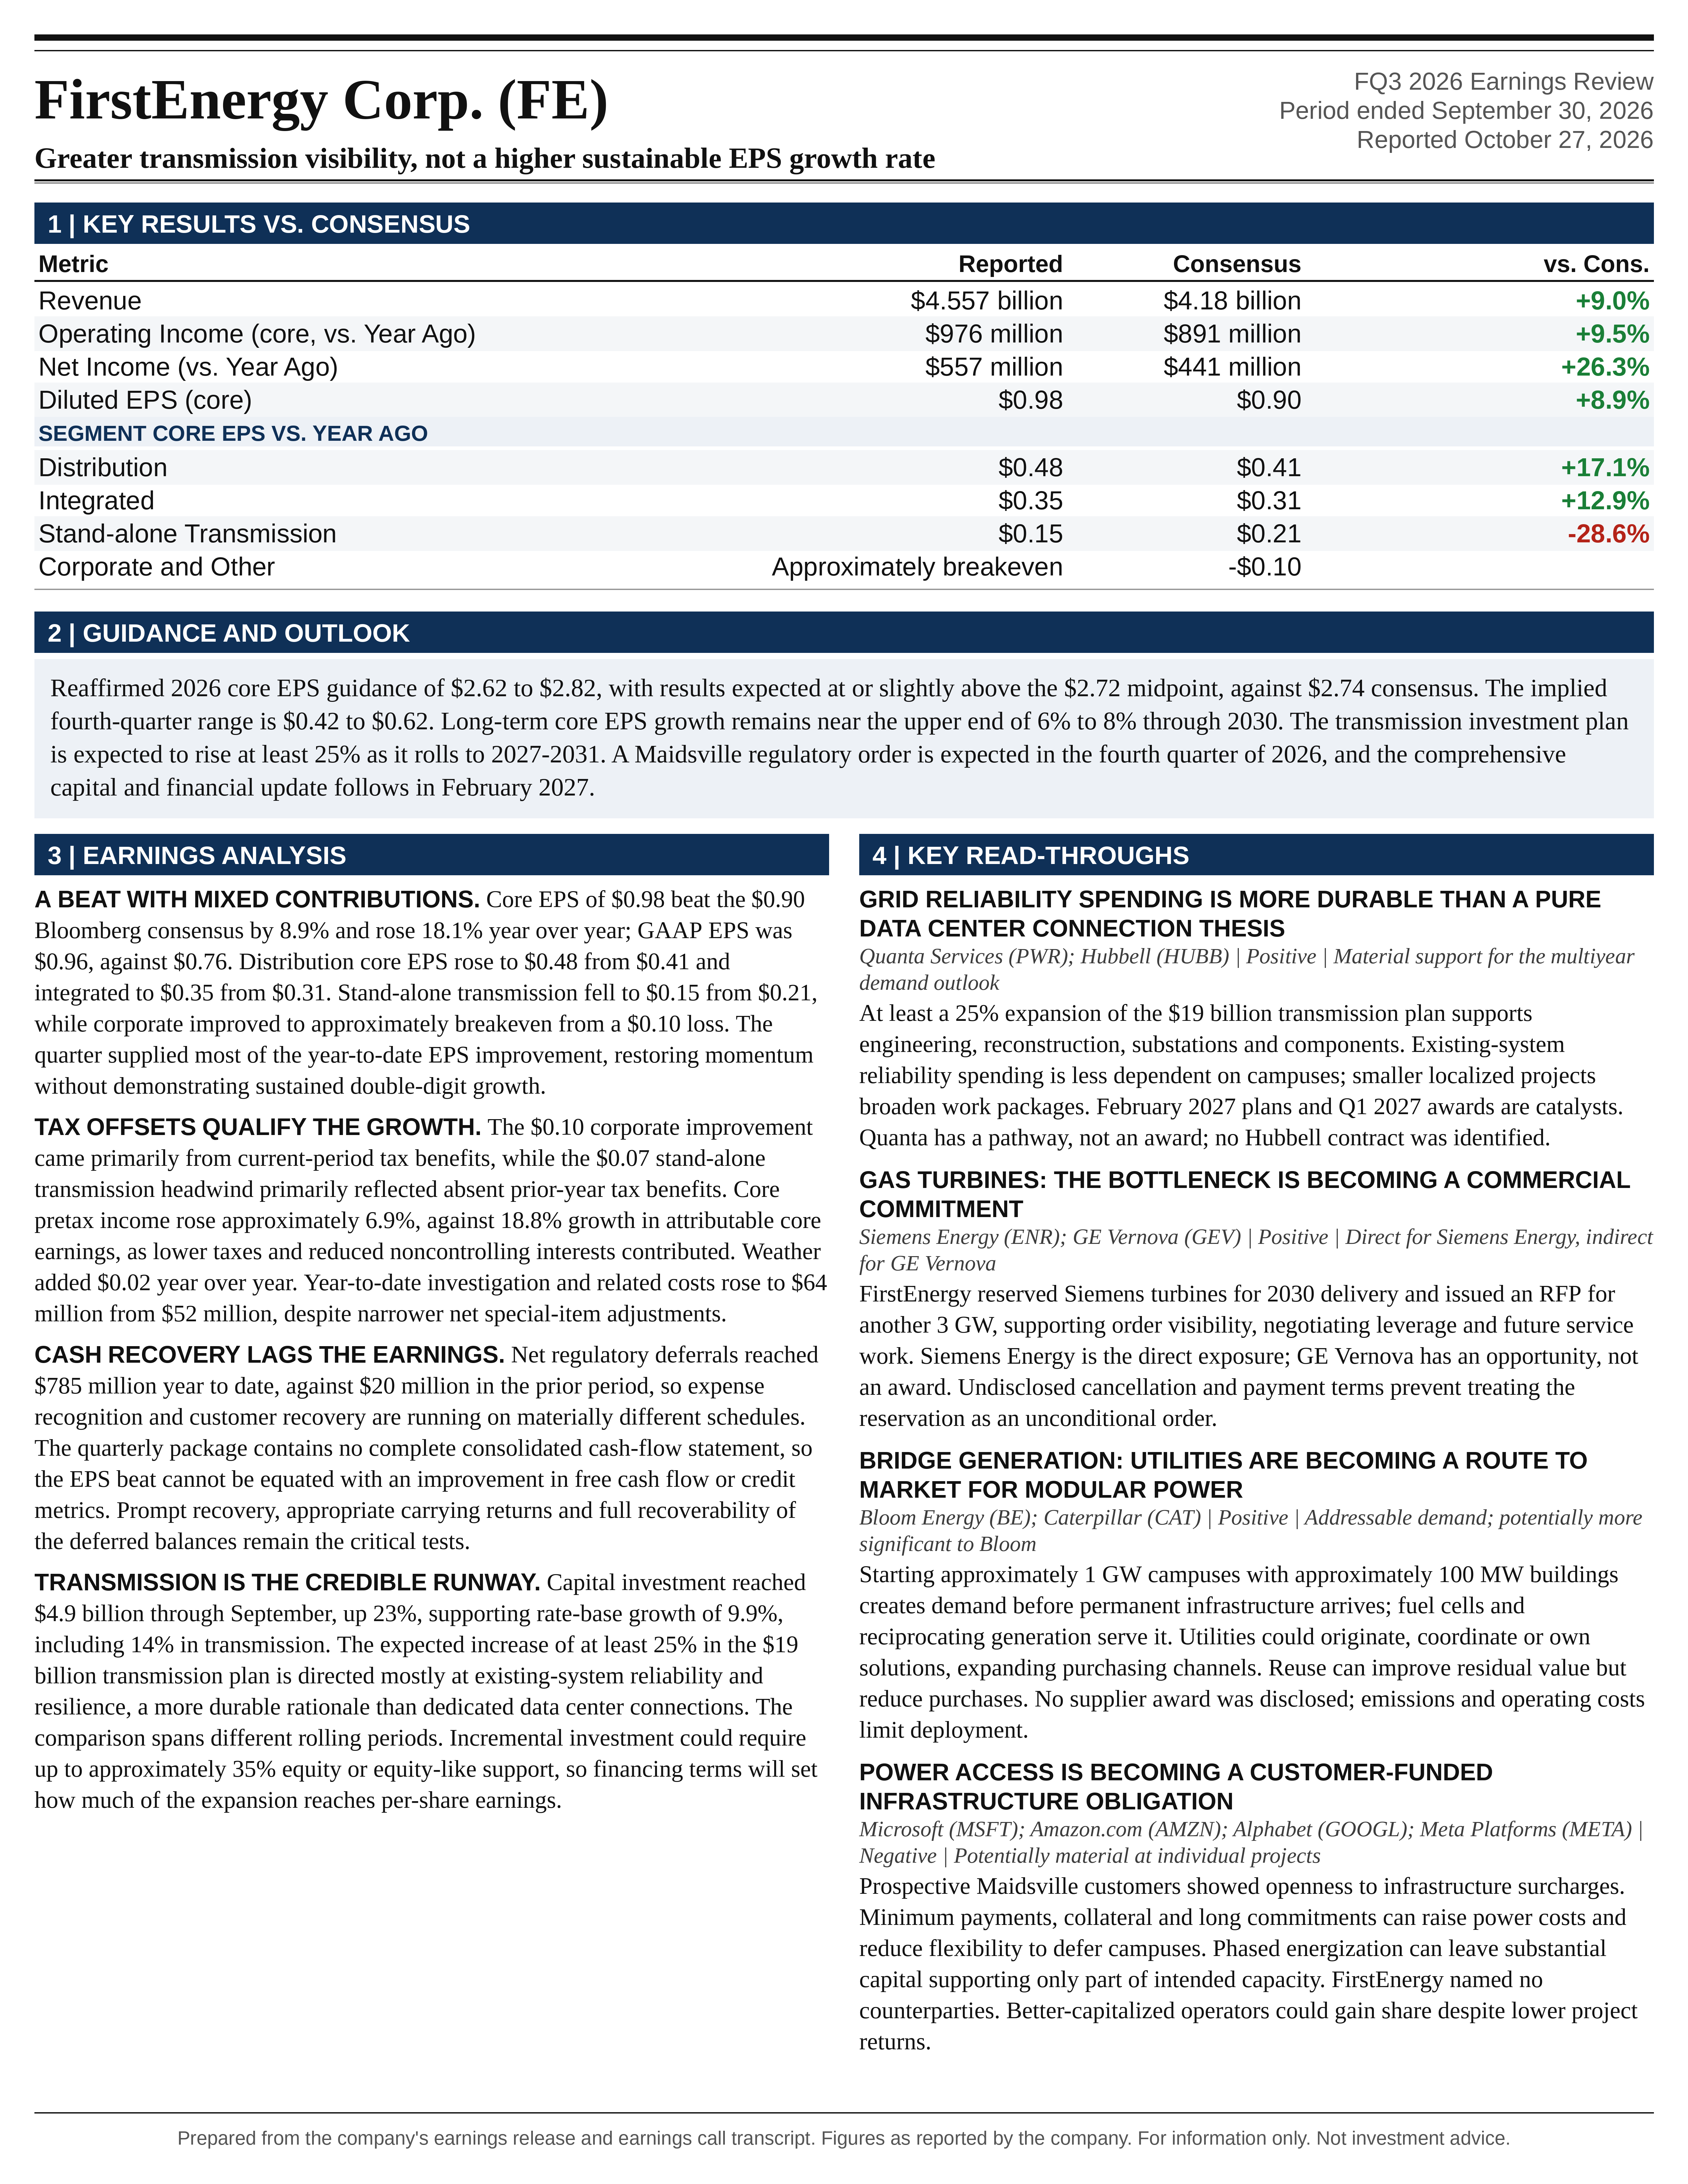
FirstEnergy Corp. (FE) FQ3 2026 earnings: Greater transmission visibility, not a higher sustainable EPS growth rate. Full earnings analysis, key read-throughs, and the one-page exhibit from Atlas Peak Research.
FirstEnergy Corp. (FE)
Sector: Utilities · FQ3 2026 · Period end September 30, 2026 · Reported October 27, 2026
FirstEnergy’s Q3 2026 earnings call supports a HOLD assessment on the incremental evidence, with a constructive view of the underlying regulated investment opportunity.
Download the one-page report (PDF)
View one-page exhibit
Download analysis (.md)
Download read-throughs (.md)
Post to X
One-Page Exhibit
Earnings Analysis
EXECUTIVE CALL SUMMARY: FirstEnergy Corp. (10/28/26)
FirstEnergy’s Q3 2026 earnings call supports a HOLD assessment on the incremental evidence, with a constructive view of the underlying regulated investment opportunity. The quarter strengthened confidence in execution and materially expanded the visibility of future transmission investment, but it did not establish a higher sustainable EPS growth rate. Core EPS of $0.98 exceeded Bloomberg consensus of $0.90 by 8.9% and increased 18.1% from $0.83. Management nevertheless retained its $2.62 to $2.82 full-year guidance and its long-term expectation of growth near the upper end of 6% to 8% through 2030. The principal investment development was therefore the potential expansion of the capital program, rather than an immediate upgrade to earnings guidance.
The most consequential announcement was an expected increase of at least 25% in the existing $19 billion transmission investment plan when it rolls forward from 2026-2030 to 2027-2031. This implies a new transmission program of at least $23.75 billion. Importantly, management attributed most of the prospective increase to reliability, resilience and reinforcement of the existing system, rather than exclusively to direct data center connections. That distinction increases the potential durability of the investment opportunity, although regional load forecasts still influence system-planning requirements. It also makes transmission the more established component of the growth thesis relative to West Virginia generation.
The quarter’s earnings quality was positive but more nuanced than the headline growth suggests. The official earnings presentation attributes $0.07 of the $0.15 EPS increase to revenue-related drivers, $0.04 to operating expenses and $0.04 to financing and other items. Within that reconciliation, a $0.10 corporate improvement was primarily associated with current-period tax benefits, while a $0.07 financing and other headwind in stand-alone transmission primarily reflected the absence of prior-year tax benefits. Weather contributed $0.02 to the year-over-year comparison. These offsets make it inappropriate either to characterize the quarter as predominantly tax-driven or to extrapolate its 18.1% EPS growth as a sustainable operating trajectory.
The data center opportunity became more substantive, but the headline requires careful interpretation. Contracted demand increased to 7.88 GW, while the comparable 2031 contracted-demand forecast increased 40.9% from the Q2 presentation. However, the company defines contracted demand as a contract to construct facilities and/or an electric service agreement, not necessarily a fully secured long-term minimum-purchase commitment. West Virginia’s approximately 6 GW opportunity remains overwhelmingly pipeline rather than contracted demand. Maidsville’s regulatory decision, customer agreement, construction contract and gas arrangements remain decisive prerequisites to underwriting incremental earnings.
The investment case consequently rests on converting a larger investment opportunity into attributable, cash-supported EPS growth without disproportionate dilution or regulatory exposure. The most important near-term catalysts are the expected Q4 2026 Maidsville order, the associated financing and contractual disclosures, and the comprehensive 2027-2031 capital and financial update in February 2027. A higher capital budget alone would not justify a higher valuation. A credible increase in EPS growth after minority interests, financing costs and equity issuance would.
OBSERVATION: QUARTERLY PERFORMANCE AND HISTORICAL COMPARISON
FirstEnergy reported Q3 GAAP earnings attributable to shareholders of $557 million, compared with $441 million, and GAAP EPS of $0.96 versus $0.76. Core earnings increased to $568 million from $478 million, while core EPS increased to $0.98 from $0.83. The 18.8% increase in core earnings slightly exceeded EPS growth because average shares outstanding increased to 579 million from 577 million. Share-count dilution was modest in the reported quarter, although financing requirements for the expanded investment opportunity could make dilution more significant in future periods.
The issuer’s detailed financial schedules report revenue of $4.557 billion versus $4.148 billion, representing growth of 9.9%. These exact figures should take precedence over the Bloomberg notice’s rounded $4.6 billion revenue and 12% growth description. Against the notice’s $4.18 billion consensus estimate, the exact reported revenue represents a 9.0% beat, or $377 million. Revenue growth should not be interpreted as equivalent growth in shareholder earnings because regulated utility revenues include purchased-power, fuel and other recoverable costs.
Year-to-date core EPS increased 8.9% to $2.20 from $2.02. The quarterly trajectory was uneven: first-half core EPS increased only 2.5% to $1.22 from $1.19, while Q2 core EPS declined to $0.50 from $0.52. Q3 therefore generated $0.15 of the $0.18 year-to-date EPS improvement, or approximately 83%. This concentration is significant. The quarter restored stronger year-to-date earnings momentum, but it does not demonstrate that the entire business has shifted to a sustained double-digit growth rate.
The segment results were mixed. Distribution core EPS increased 17.1% to $0.48 from $0.41. Integrated core EPS increased 12.9% to $0.35 from $0.31. Stand-alone transmission core EPS declined 28.6% to $0.15 from $0.21, despite continued investment and rate-base growth. Corporate core EPS improved to approximately breakeven from a $0.10 loss. Distribution and integrated operations therefore generated stronger earnings, but tax-related comparisons materially affected both the stand-alone transmission and corporate contributions.
The distribution improvement comprised approximately $0.01 from rates and investments, $0.02 from customer demand, $0.03 from operating expenses and $0.01 from financing and other items. Integrated earnings improved by approximately $0.01 from rates and investments, $0.02 from customer demand and $0.01 from operating expenses. Stand-alone transmission gained approximately $0.01 from rates and investments, but that contribution was overwhelmed by the $0.07 financing and other headwind. The results support the effectiveness of investment recovery and operating execution, while demonstrating that reported segment EPS can diverge materially from rate-base growth in an individual quarter.
Capital deployment remained strong. FirstEnergy invested $4.9 billion through September, up 23% from the corresponding 2025 period. Against the $2.9 billion reported at midyear, this implies approximately $2.0 billion of Q3 investment. The year-to-date total represents approximately 82% of the previously communicated $6 billion 2026 investment plan. The Q3 presentation attributes elevated investment not only to planned reliability, resilience and new-business activity, but also to elevated storm activity. Accordingly, the increase should not be treated entirely as an acceleration of discretionary growth projects.
The capital program supported 9.9% year-over-year rate-base growth at FirstEnergy, including 14% growth in total transmission rate base. Integrated transmission grew 21%, while stand-alone transmission grew 11%. These figures are broadly consistent with Q2 transmission growth of 14%, including 22% in integrated transmission and 11% in stand-alone transmission. The investment engine remained strong, but the quarter did not show a new acceleration in transmission rate-base growth relative to the preceding update.
EARNINGS QUALITY, TAXES AND CASH CONVERSION
The earnings bridge is more informative than management’s broad description of strong execution and “a slightly lower effective tax rate.” The corporate $0.10 improvement, primarily from Q3 2026 tax benefits, was substantial relative to the $0.15 consolidated EPS increase. However, the absence of Q3 2025 tax benefits simultaneously depressed stand-alone transmission. Subtracting the full corporate improvement from current EPS while leaving the prior-year transmission benefit untouched would produce a misleading comparison. Conversely, treating the corporate benefit as a recurring quarterly contribution would overstate the demonstrated earnings base.
The detailed statements provide a useful additional perspective. Core operating income increased approximately 9.5% to $976 million from $891 million. Core pretax income before noncontrolling interests increased approximately 6.9% to $694 million from $649 million. Core earnings attributable to FirstEnergy increased 18.8%, reflecting not only pretax growth but also lower consolidated tax expense and a reduction in income attributable to noncontrolling interests. The latter declined to $58 million from $91 million. The minority-interest movement is consistent with the significance of the prior-year tax benefit in the partially owned transmission business. It should not be interpreted as a structural improvement in FirstEnergy’s ownership economics.
Weather also supported the quarter. The company estimated a $0.03 EPS benefit relative to normal conditions and a $0.02 benefit relative to Q3 2025. Removing only the stated benefit versus normal would produce approximately $0.95 of EPS, still above the reported $0.90 consensus. That calculation is not a fully normalized earnings estimate because it does not adjust tax items, expense timing or consensus assumptions. It nevertheless indicates that favorable weather alone does not explain the reported beat.
The narrowing GAAP-to-core reconciliation is encouraging but does not establish that legacy costs have disappeared. Net special-item adjustments declined to $0.02 per share from $0.07 in Q3 and to $0.04 from $0.17 year to date. However, year-to-date investigation and related costs increased to $64 million from $52 million, approximately 23%, and represented $0.11 per share of exclusions. Pension and other credits offset part of these expenses in the net reconciliation. FirstEnergy’s presentation explicitly states that special items are not necessarily nonrecurring. Continuing legal and advisory expenses therefore remain economically relevant even when excluded from core EPS.
Cash conversion requires particular attention. Net amortization and deferral of regulatory assets moved from an $89 million expense in Q3 2025 to a $103 million credit in Q3 2026. Year to date, net regulatory deferrals were $785 million, compared with $20 million in the prior period. These movements can reflect legitimate regulatory matching of recoverable costs and should not automatically be characterized as discretionary earnings adjustments. They do, however, demonstrate that expense recognition and customer recovery are occurring on materially different schedules.
The quarterly earnings package does not provide a complete consolidated cash-flow statement or enough detail to determine the ultimate cash conversion of these deferrals. It would therefore be inappropriate to equate the EPS beat with a corresponding improvement in free cash flow or credit metrics. The key analytical issue is whether deferred balances are recovered promptly, earn appropriate carrying returns and remain fully recoverable. This becomes more important as the company simultaneously increases capital deployment and considers additional generation construction.
IMPLICATION: GUIDANCE WAS REAFFIRMED, NOT RESET
Management retained 2026 core EPS guidance of $2.62 to $2.82, with results expected “at or slightly above the midpoint.” The range is unchanged from the February 2026 annual-results release and the July 2026 Q2 release. The midpoint remains $2.72, slightly below the $2.74 Bloomberg consensus provided with the earnings notice. The language supports confidence in achieving the existing outlook; it does not constitute a numerical guidance increase.
With $2.20 already earned through September, the full-year range implies Q4 core EPS of $0.42 to $0.62. The midpoint implies $0.52, while the $2.74 consensus implies $0.54. For comparison, 2025 full-year core EPS of $2.55 less first-9-month EPS of $2.02 implies approximately $0.53 in Q4 2025. Repeating that result would produce approximately $2.73 for 2026, consistent with management’s midpoint-plus commentary.
This arithmetic is central to interpreting the quarter. The $0.08 Q3 consensus beat does not translate automatically into an $0.08 increase in the full-year earnings expectation. The retained midpoint implies a roughly flat to slightly lower Q4 year-over-year result, and the stated qualitative expectation is consistent with only modest growth around that level. Potential explanations include weather normalization, expense timing, tax timing and prudence, but management did not provide a sufficiently detailed Q4 bridge to assign the difference to specific drivers.
The 2026 midpoint represents 6.7% growth over actual 2025 core EPS of $2.55. This is a more relevant realized-performance comparison than the approximately 9% growth previously cited against the original 2025 guidance midpoint. The distinction is not adverse in itself because 2025 finished above the original expectation, but it prevents an overstated characterization of current-year growth.
The long-term outlook also remained unchanged: core EPS CAGR near the upper end of 6% to 8% through 2030. Management stated that incremental opportunities could increase earnings growth over time, but it did not introduce a higher numerical range, a 2027 EPS target or an updated 2031 EPS target. The existing forecast remains the appropriate base case until the expanded capital program is accompanied by a complete financing and earnings bridge.
The Q3 presentation describes the existing $36 billion program as supporting 10.4% rate-base CAGR, compared with the rounded 10% description in earlier releases and the Q2 presentation. The Q3 materials label this as the existing base plan rather than a newly announced capital program. The greater precision should not be treated as a separate formal earnings-guidance increase.
DATA CENTER DEMAND: STRONGER CONTRACT CONVERSION, LIMITED NEAR-TERM REVENUE EVIDENCE
Contracted data center demand increased to 7.88 GW from 6.36 GW in the Q2 presentation, a 23.9% increase. This is meaningful progress, although the July presentation had already indicated an expectation of approximately 1.5 GW of additional contracts within the following 2 weeks. The increase of approximately 1.52 GW is therefore broadly consistent with previously anticipated conversion, rather than wholly unexpected new demand.
The most useful comparison is the common 2031 horizon, which avoids changes in the terminal forecast year. Contracted demand expected by 2031 increased from 4.775 GW to 6.730 GW, or 40.9%. Total contracted-plus-pipeline demand for 2031 increased much less, from 12.285 GW to 13.120 GW, or 6.8%, while uncontracted pipeline demand declined by 1.120 GW. Contracted demand consequently increased from approximately 38.9% to 51.3% of the 2031 total. The principal improvement was therefore the maturity and timing of the opportunity, not simply a larger aggregate speculative pipeline.
The headline long-dated total increased to 26.95 GW, including 19.07 GW of pipeline demand. However, the Q3 presentation extends the terminal horizon to 2036 from 2035 in Q2. Comparing the approximately 27 GW headline directly with the prior approximately 24.8 GW total without this qualification would overstate the precision of the sequential growth comparison. The common 2031 data provide a cleaner measure of progress.
The near-term picture is more modest. The 2026 contracted-demand forecast increased from 2.115 GW to 2.190 GW, an increase of only 75 MW. The 7.88 GW headline therefore should not be interpreted as current energized demand or immediate revenue-producing capacity. Much of the commercial opportunity remains scheduled for later years, which is consistent with the absence of a major near-term earnings-guidance revision.
The contractual definition is equally important. FirstEnergy includes customers with a contract to construct facilities and/or an electric service agreement. Such agreements establish more commitment than a load inquiry, but the disclosure does not demonstrate that every MW is protected by minimum demand charges, take-or-pay obligations, parent guarantees or termination payments sufficient to recover all dedicated investment. The appropriate investment distinction is between documented customer commitment and fully underwritten economic protection.
State-level data also qualify the broad growth narrative. At the common 2031 horizon, Pennsylvania contracted demand increased by 1.240 GW and Maryland contracted demand increased by 565 MW. West Virginia total demand increased from 800 MW to 1,780 MW, but contracted demand remained 175 MW. Ohio total demand declined from 4,935 MW to 3,935 MW, while New Jersey total demand declined from 1,510 MW to 1,010 MW. These movements show that the pipeline is being revised and reallocated rather than uniformly increasing.
The analyst question about contraction in Maryland and New Jersey should not be read as evidence of falling contracted demand in both states. The presentation shows higher Maryland contracted demand and unchanged New Jersey contracted demand. The declines concern portions of the broader pipeline or total-demand forecast. This distinction matters because pipeline attrition and cancellation of binding service obligations have different implications for investment recoverability.
West Virginia remains the most important unconverted opportunity. Its long-dated total is 6.045 GW, comprising only 175 MW contracted and 5.870 GW in the pipeline. Contracted demand therefore represents approximately 2.9% of the state’s disclosed total. The rapid increase in development interest supports the strategic rationale for additional generation, but it does not yet support treating the full 6 GW as secured utilization.
CURRENT LOAD GROWTH SUPPORTS THE THESIS, BUT IS NOT YET TRANSFORMATIONAL
Total weather-adjusted wires sales increased 1.2% in Q3, with industrial sales up 3.3%, commercial sales up 1.1% and residential sales down 0.6%. Actual sales increased 2.2%, reflecting the additional benefit of weather. On a trailing-12-month basis, weather-adjusted sales increased approximately 1.0%, including 2.1% industrial growth. The data support a genuine improvement in demand, but not yet the magnitude implied by the long-dated data center pipeline.
Management identified metals, oil and gas, chemicals and data centers as contributors. This breadth is constructive because the current demand improvement is not entirely dependent on a single customer category. However, industrial strength retains exposure to manufacturing activity and commodity-related investment cycles. It should not automatically be classified as a permanent structural increase.
The central investment effect of large-load growth is likely to be investment opportunity and system utilization rather than unrestricted volumetric operating leverage. Revenue mechanisms differ by jurisdiction, and higher volumes can support affordability or offset future rate requirements rather than flow entirely to shareholders. The more durable earnings pathway is additional approved rate base, efficient capital recovery and stronger utilization of existing infrastructure.
TRANSMISSION: THE MOST CREDIBLE SOURCE OF INCREMENTAL VALUE
The anticipated increase of at least 25% in the $19 billion transmission plan implies a minimum new total of $23.75 billion and a gross increase of $4.75 billion. Relative to the existing $36 billion enterprise investment program, the magnitude is material. However, the periods differ: the current program covers 2026-2030, while the new plan will cover 2027-2031. Part of the increase will reflect the addition of 2031 and removal of 2026. It would be incorrect to describe the entire $4.75 billion as an increase in spending over an unchanged period.
Management’s explanation of the investment mix was particularly important. Taylor stated, “Most of the increase you'll see is from the work that we need to do on our existing system to stabilize, provide better reliability, provide better resiliency to the system.” This supports a broader infrastructure-renewal thesis rather than a narrow bet on dedicated data center connections. Aging assets, changing power flows, operating flexibility and regional reliability needs can create investable projects even when individual customer schedules move.
The distinction does not eliminate demand risk. Regional reliability studies incorporate assumptions about load and generation, and lower-than-expected growth could alter the timing or scale of some reinforcements. Nevertheless, a program dominated by existing-system requirements generally has a more diversified rationale than a portfolio concentrated in dedicated facilities for a small number of prospective customers.
FirstEnergy’s rule of thumb is approximately $250 million of transmission network upgrades per 1 GW of contracted demand. Applying that relationship to the full 7.88 GW produces approximately $1.97 billion of associated network investment, not a wholly incremental addition to the existing plan. Applying it to the approximately 3.8 GW increase since year-end suggests roughly $950 million of associated upgrades across the relevant development horizon. These are gross planning estimates, not project awards or immediate rate base.
The presentation explicitly states that upgrades associated with contracted demand signed since February 2026 are not included in the existing 2026-2030 investment plan. That provides a tangible source of incremental spending. However, the associated customer schedules extend beyond 2030 in some cases, so the entire implied amount should not be inserted into the current window. The approximately 4 GW in active negotiations would imply another approximately $1 billion under the same rule of thumb if contracted and developed, but that remains contingent.
Ownership materially affects the translation into shareholder value. Taylor indicated that external partners represent approximately 30% of the combined transmission business and that this share should remain broadly stable. On a simplified proportional basis, the $4.75 billion gross increase would correspond to approximately $3.33 billion attributable to FirstEnergy. This is a scale illustration, not an official funding forecast, because actual ownership and project mix will determine the retained economics.
The aggregate 30% external ownership should not be confused with ownership of FirstEnergy Transmission itself. The presentation reports FirstEnergy’s FET ownership, including the relevant class interests, at approximately 55.5% as of September. The combined transmission portfolio includes businesses with different ownership structures. Applying either the FET ownership percentage or the aggregate transmission percentage indiscriminately to all projects would misstate attributable growth.
Competitive transmission remains an additional opportunity. FirstEnergy has received more than $5 billion of awarded investments through PJM competitive processes since 2022, including joint ventures. Management expects the current window to emphasize smaller, lower-voltage, near-term reliability projects, with awards expected in Q1 2027. Larger regional opportunities may reappear in subsequent windows. The historical awards demonstrate execution and bidding capability, but they should not be added again to the capital plan as wholly new upside without determining what is already included.
The unanswered question is the timing of incremental earnings. Carly Davenport specifically asked about the composition and front-end versus back-end loading of the expanded program. Management addressed the composition but did not quantify annual spending or in-service timing. That omission matters because equivalent cumulative capital programs can generate very different near-term EPS outcomes depending on construction schedules, formula-rate treatment and financing lead times.
WEST VIRGINIA GENERATION: GREATER OPPORTUNITY, STILL CONDITIONAL ECONOMICS
Maidsville is the most advanced generation opportunity. FirstEnergy’s project materials describe a 1,200 MW combined-cycle natural gas plant with an approximately $2.5 billion investment, located adjacent to the existing Fort Martin site. Earlier company materials contemplated site work as early as 2027 and commercial operation in late 2031. The current call confirmed a Siemens turbine reservation with delivery in 2030, but turbine delivery is not the same as commercial operation.
The turbine reservation is a meaningful schedule-protection measure in a constrained equipment market. It reduces the risk of losing a manufacturing slot, but it does not resolve the full execution chain. Management identified the West Virginia certificate of public convenience and necessity, gas supply arrangements and engineering, procurement and construction agreement as remaining gates. The customer agreement also remained under negotiation. No final project return, fully committed construction budget or complete risk-allocation structure was disclosed.
The company expects a regulatory decision in Q4 2026, narrowing the earlier second-half timing expectation without establishing an acceleration. Management plans to update the 2026-2030 financial plan following the order, separately from the broader February 2027 refresh. The Q3 presentation indicates incremental West Virginia rate-base growth beginning in 2029 and continuing thereafter. This suggests potential financial recognition before commercial operation, but the mechanism and cash consequences depend on the order and financing structure.
The distinction between construction-period earnings and operating cash flow is critical. A project can contribute accounting earnings through construction treatment or regulatory recovery before it generates electricity. Whether that contribution is supported by cash collections, capitalized financing allowances or deferred recovery materially affects its quality. The forthcoming order must establish the treatment of construction costs, carrying returns, customer surcharges and any limits on recoverability.
Taylor’s final financing clarification was conditional: “assuming we get the surcharge, it's about a 35% equity requirement.” On the existing approximately $2.5 billion project estimate, 35% would imply approximately $875 million of equity or equity-like support. That is a sensitivity, not a finalized issuance commitment. The surcharge is part of the funding architecture rather than an incidental customer-pricing feature. A less favorable recovery mechanism could increase external financing requirements or reduce the economic attractiveness of the project.
The customer negotiations appear commercially constructive, but the call did not disclose the terms necessary to establish risk transfer. Critical provisions include minimum payments, contract duration, load-ramp commitments, fuel-cost treatment, capacity and ancillary-service obligations, construction-delay liability, collateral and termination protection. A creditworthy customer can still leave the utility exposed if its commitment is shorter than the asset life or if contractual exceptions permit material reductions in demand.
The alternative generation-company structure remains unresolved. Tierney stated, “The Genco is absolutely still on the table.” A regulated structure could provide more predictable recovery and allowed returns, subject to prudence review and customer-protection requirements. A separately contracted generation structure could provide different pricing opportunities but may introduce greater counterparty, dispatch, refinancing and residual-value risk. Management did not answer the question of comparative returns quantitatively. It therefore remains premature to assign merchant-style upside while assuming utility-style protection.
ADDITIONAL GENERATION AND THE TIMING INCONSISTENCY
The initial RFP for another 3 GW of combined-cycle turbines is a substantial strategic development, but it is an equipment procurement process rather than an approved construction program. The associated load discussions, project locations, ownership structures, budgets and commercial terms were not finalized. This capacity is additional to Maidsville, but it should not be treated as committed investment or embedded earnings.
The draft transcript contains inconsistent timing responses. In the exchange with Nicholas Campanella, management indicated that the additional capacity would be beyond the 2031-2032 period referenced in the question. In the later exchange with Andrew Weisel, management indicated likely timing in 2031-2032 and beyond. The defensible interpretation is that the development program could extend across and beyond that period, with no firm fleet-wide commercial-operation schedule established.
This inconsistency has a direct modeling consequence. Full operating earnings from the additional 3 GW should not be assumed within the existing 2030 EPS horizon. Potential earlier financial effects would depend on construction spending, regulatory treatment, customer funding or bridge assets. The additional generation opportunity therefore strengthens the longer-duration growth runway more clearly than it supports an immediate increase in the existing growth target.
The call also established that gas availability cannot be reduced to regional resource abundance. Final gas supply arrangements remain a gating item. Reliable plant operation requires appropriate lateral infrastructure, transportation rights, pressure and deliverability, particularly during stressed conditions. Permitting, construction execution, environmental obligations and gas infrastructure schedules remain distinct from turbine availability.
BRIDGE POWER: COMMERCIAL FLEXIBILITY WITHOUT ESTABLISHED RETURNS
Management is evaluating reciprocating engines, fuel cells, batteries and other temporary behind-the-meter arrangements to accelerate customer access to power. The example of starting a roughly 1 GW campus with a roughly 100 MW building illustrates a staged energization strategy. This could improve customer retention and allow development to proceed before permanent transmission and combined-cycle infrastructure are ready.
These technologies are not economically or technically interchangeable. Batteries can provide backup, short-duration support and power-management services, but they do not independently create continuous energy supply. Engines and fuel cells require dependable fuel arrangements, appropriate emissions treatment and maintenance support. A bridge solution must therefore be evaluated as a complete power-delivery package, not simply by installed MW or equipment procurement speed.
Management described bridge assets as reusable rather than disposable and indicated that ownership could reside with FirstEnergy, customers or third parties. Reuse could improve residual value, but redeployment or continued operation would still require suitable sites, contracts, fuel, interconnection and operating permits. No committed investment amount, return framework or utilization forecast was disclosed. Bridge power should therefore remain commercial optionality rather than a quantified earnings contributor.
FINANCING, DILUTION AND CREDIT QUALITY
The existing $36 billion investment plan is supported by up to $2 billion of equity or equity-like securities through 2030. Management expects additional investments to be funded with up to approximately 35% equity or equity-like support. The difference is material: the incremental growth opportunity appears more externally equity-intensive than a superficial comparison with the existing program might suggest.
Applying 35% to the $4.75 billion minimum gross transmission-plan increase produces approximately $1.66 billion of equity-equivalent funding. Applying the same percentage after a simplified 30% partner adjustment produces approximately $1.16 billion. These are alternative illustrations of the importance of the funding denominator, not competing company forecasts. The February plan must clarify ownership, partner contributions, retained cash flow and the precise capital base to which the 35% assumption applies.
Taylor reiterated an expectation of common equity issuance around 1% of market capitalization annually for the foreseeable future. If issued near the prevailing share price, that would broadly correspond to approximately 1% annual share-count growth before other changes. The statement does not mean total equity-equivalent funding is limited to that amount. Preferred securities, hybrids, convertible instruments or further minority investments could supply additional support, each with different implications for common-shareholder economics.
Equity-like financing is not economically free. Preferred securities impose distributions senior to common dividends. Hybrids can reduce immediate common-share dilution while increasing fixed charges. Convertibles can defer rather than eliminate dilution. Minority investments reduce the share of future asset earnings retained by FirstEnergy. The relevant measure is therefore common EPS and cash flow after the full financing structure, not the amount of common equity issued in isolation.
The completed $2.6 billion subsidiary debt program at an average 4.7% coupon is evidence of continued market access. However, interest expense increased to $345 million in Q3 from $312 million and to $1.008 billion year to date from $899 million. Larger capital requirements are already increasing financing costs. The growth program must earn sufficiently prompt returns to absorb that burden.
Approximately 50% of future long-term debt financing needs are supported by formula-rate mechanisms that recover interest costs. This provides meaningful protection but does not eliminate refinancing risk, recovery timing differences, regulatory scrutiny or holding-company exposure. Separately, approximately 75% of the existing investment plan is associated with formula-rate recovery. Those percentages describe different denominators and should not be treated as interchangeable.
The presentation retains a target of approximately 14% funds from operations to debt and a commitment to a BBB/Baa2 credit profile. These are objectives, not proof that every rating or metric is already achieved. As of the presentation, Moody’s rated the parent Baa3 with a positive outlook, while S&P’s issuer rating was BBB+. Maintaining credit quality during a potentially larger construction cycle will require cash recovery, financing discipline and appropriate customer support, particularly if regulatory deferrals continue to rise.
REGULATORY EXECUTION AND AFFORDABILITY
West Virginia provided the clearest completed regulatory progress. The commission approved the $76 million inflation and investment adjustment as filed. The prior-quarter presentation specified 2 annual revenue steps of $38 million, effective August 1, 2026 and June 1, 2027. Q3 therefore included only part of the initial step, with further annualization in Q4 and an additional step in 2027. The stay-out through April 2028 provides planning visibility but also increases the importance of cost control and the operation of available adjustment mechanisms.
New Jersey is more complex than a simple delay of earnings until 2028. JCP&L requested a $253 million annual base-rate increase, reflecting approximately $1 billion of rate-base growth since the prior increase. The Q3 presentation expects rates to become effective in Q2 2027, while customer bill impacts are delayed until 2028. The company’s customer materials describe offsets equal to the rate increases during 2027. The financial analysis must distinguish rate effectiveness, revenue recognition, bill credits and cash collection rather than assuming the entire earnings benefit is deferred.
The proposed structure attempts to reconcile investment recovery with affordability. Management expects rates to remain approximately 18% below the state investor-owned utility average even after the proposed increase. That relative position is constructive, but it does not guarantee approval. Absolute bill levels, supply-price changes and the cumulative effect of multiple charges remain politically important even when distribution rates compare favorably with peers.
Reliability improvements strengthen the regulatory argument. Management cited an 11% improvement in Pennsylvania and a 40% improvement in New Jersey since 2024, including further New Jersey progress in 2026. These results support the case that capital deployment is producing customer benefits. However, the call did not provide a complete definition of the reliability measures, weather adjustments or exclusions. The percentages should be interpreted as management-reported operating progress rather than directly translated into allowed returns.
New Jersey’s broader utility review remains unresolved. Management expressed a preference for mechanisms such as multiyear rate plans and performance-based regulation and anticipated greater clarity in late 2026 or early 2027. Such frameworks can reduce regulatory lag, but their value depends on cost benchmarks, productivity assumptions, performance incentives and penalty design. Regulatory modernization is not automatically earnings-accretive.
Maryland’s $53 million rate request follows approximately $200 million of rate-base growth since the prior increase. Hearings are scheduled for January 2027, with an order expected in early April and new rates targeted for April 2027. Together with the West Virginia steps and the New Jersey proceeding, this creates a visible sequence of potential earnings-supporting decisions. The requested revenue increases are not equivalent to net-income increments because they recover depreciation, financing, operating costs and taxes as well as equity returns.
The presentation also identifies important proceedings beyond those emphasized verbally. Ohio’s 3-year rate plan has a staff report due in November 2026 and hearings beginning in March 2027. Federal and PJM proceedings concerning large-load integration, transmission rate design and resource adequacy remain active. According to the company’s regulatory calendar, FERC accepted elements of PJM’s large-load definition and registry in October while rejecting the core proposed interim resource-adequacy framework. This reinforces that the rules governing large-load service and associated cost allocation are still evolving.
RETURNS, VALUATION AND THE LIMITS OF CAPITAL-LED GROWTH
The reported trailing-12-month consolidated ROE of 9.5% is within management’s 9.5% to 10% target, but it is at the lower end and below the 9.8% reported for 2025. The comparison is affected by the expanding rate-base denominator and differing regulatory averaging conventions. It nevertheless shows that the company is not currently demonstrating broad earnings growth from an expanding return spread. The more credible driver remains growth in invested capital earning approximately targeted returns.
A simple sensitivity illustrates the transmission opportunity without assuming that capital spending translates immediately into EPS. At a hypothetical 50% regulatory equity ratio and 9.5% earned ROE, $1 billion of fully earning, FirstEnergy-attributable rate base would generate approximately $47.5 million of annual equity earnings, or roughly $0.08 per share on 579 million shares. This is before incremental parent financing costs, new share issuance and other adjustments. Construction timing, depreciation, tax-related rate-base deductions and ownership can materially change the realized outcome.
The implication is that several billion dollars of attributable rate-base additions could be meaningful, but the gross investment increase cannot be multiplied by an ROE and treated as immediate EPS accretion. The company must establish how much becomes earning rate base, when recovery begins, which entity owns it and how the equity contribution is financed. An investment can be EPS-accretive while creating little economic value if the return merely matches the marginal cost of capital.
The valuation opportunity is consequently strongest if the expanded program produces a longer period of high-quality growth with controlled financing needs. It is weaker if the main result is a larger balance sheet, more construction-period earnings and more equity issuance while per-share growth remains unchanged. Generation could add a valuable new growth avenue, but it could also increase the risk profile enough to offset some of the earnings benefit through a lower valuation multiple.
The supplied Bloomberg notice shows 11 buy recommendations, 6 holds and 0 sells. This indicates broadly favorable analyst positioning, although it does not establish what is reflected in the share price. The call cannot by itself substantiate a claim that the market is overlooking the data center opportunity. The more differentiated question is whether the market is correctly valuing attributable transmission economics and the conditional funding requirements of West Virginia generation.
No absolute price target is supported here because a verified contemporaneous trading price, peer valuation framework and complete updated financing model are not established by the earnings materials. The event-level conclusion is narrower: the call improves confidence in the growth runway, but the evidence does not yet justify capitalizing all announced opportunities at full value.
BASE, BULL AND BEAR CASES
The base case carries an illustrative 55% probability. Core EPS begins at the $2.72 2026 guidance midpoint and grows 8% annually through 2030, producing approximately $3.70. Transmission investment expands broadly as indicated, rate outcomes remain constructive, and Maidsville proceeds under acceptable terms. Financing requirements and timing absorb part of the incremental investment benefit, leaving growth near the upper end of the existing range rather than materially above it. The additional 3 GW primarily supports the period beyond 2030.
The bull case carries an illustrative 25% probability. Core EPS grows 11% annually from the same starting point, reaching approximately $4.13 in 2030. This requires more than a larger capital announcement. It assumes favorable transmission recovery and spending timing, effective customer funding, a clean Maidsville order, disciplined construction execution and limited common-share dilution. The additional 3 GW remains primarily a longer-term contributor; the higher growth rate must be supported largely by transmission and the financial treatment of investments under construction. At an unchanged terminal multiple, 2030 earnings would be approximately 11.6% above the base case.
The bear case carries an illustrative 20% probability. Core EPS grows 4% annually, reaching approximately $3.18 in 2030. Potential causes include slower load conversion, less favorable recovery of system investments, generation delays, weaker customer funding, persistent regulatory deferrals or more expensive financing. A less favorable surcharge or generation structure could increase funding requirements before associated earnings materialize. A higher perceived risk profile could also pressure the valuation multiple independently of the earnings shortfall.
These probabilities are analytical judgments rather than company guidance or statistically estimated outcomes. The probability-weighted 2030 EPS is approximately $3.70, close to the base case. That result captures the present balance of evidence: substantial upside opportunity exists, but execution, financing and regulatory risks prevent the gross opportunity from translating into a clearly higher expected earnings outcome today.
CATALYSTS AND EVIDENCE THAT WOULD CHANGE THE ASSESSMENT
The expected Q4 2026 Maidsville decision is the nearest major catalyst. Approval alone would be insufficient. The consequential terms are construction-cost recovery, surcharge treatment, allowed returns, customer obligations, prudence standards and the allocation of cancellation or underutilization risk. A favorable order accompanied by a binding customer agreement and credible EPC and gas arrangements would materially improve the quality of the generation opportunity.
The February 2027 financial update is the principal test of the broader equity thesis. It should establish the 2027-2031 capital total, annual transmission spending, attributable ownership, rate-base timing, equity-equivalent funding and EPS growth. A meaningful increase in per-share growth with credible credit metrics would support a more positive recommendation. A larger capital program with unchanged EPS growth and substantially higher funding needs would be less compelling.
Additional milestones include the early-2027 update on the 3 GW RFP, Q1 2027 PJM awards, Maryland’s January hearings and April outcome, New Jersey’s expected Q2 2027 rate effectiveness, the June 2027 West Virginia rate step and Ohio’s 2027 rate-plan proceedings. Progress should be assessed through signed commitments and regulatory orders rather than repeated descriptions of customer interest.
The positive thesis would weaken if contracted demand failed to progress toward actual energization, if new load agreements lacked adequate investment-recovery protections, or if generation commitments materially preceded regulatory and commercial certainty. Sustained deterioration in earned returns, cash conversion or credit metrics would also challenge the proposition that a larger capital program creates value for common shareholders.
RECOMMENDATION
HOLD is the appropriate incremental assessment following the call, with a constructive bias toward the regulated transmission opportunity and a conditional assessment of generation upside. FirstEnergy delivered a genuine earnings beat, maintained strong capital execution and demonstrated improved contract conversion. The most valuable new information was the scale and reliability-oriented composition of the prospective transmission expansion.
The evidence required for a stronger recommendation is now specific: a favorable Maidsville order with enforceable customer protections, a transparent funding structure and a February plan showing that incremental investment increases sustainable EPS after financing and minority interests. Until then, the company presents a credible upper-end 6% to 8% growth case with substantial longer-term optionality, rather than an established double-digit earnings-growth platform.
SOURCE BASIS
The principal sources are the October 28, 2026 initial draft earnings-call transcript; FirstEnergy’s October 27, 2026 earnings release and Strategic & Financial Highlights; the July 28, 2026 Q2 release and presentation; the February 17, 2026 annual-results release; FirstEnergy’s Maidsville project materials; JCP&L’s rate-proposal materials; and the accompanying Bloomberg earnings notice. Direct management quotations are from the current-quarter draft transcript. Exact issuer financial schedules take precedence over rounded notice figures, and unresolved timing or contractual questions remain identified as such.
COMPANY EMPLOYEES ON THE CALL
• Brian X. Tierney, Chairman, President and Chief Executive Officer. • Jon Taylor, Senior Vice President and Chief Financial Officer. • Karen Sagot, Vice President of Investor Relations.
RESEARCH ANALYSTS ON THE CALL
• Nicholas Campanella, Barclays. • Jeremy Tonet, J.P. Morgan. • Michael Sullivan, Wolfe Research. • Carly Davenport, Goldman Sachs. • Andrew Weisel, Scotiabank.
Key Read-Throughs
KEY READ-THROUGHS FROM FIRSTENERGY’S Q3 2026 EARNINGS CALL
FirstEnergy’s call strengthens the case for sustained investment in electricity infrastructure, but the most important cross-sector implication is the divergence between infrastructure spending, power availability and shareholder earnings. Transmission investment can accelerate before new generation becomes operational, benefiting equipment suppliers and construction providers while preserving the scarcity value of existing generation. Conversely, large electricity customers increasingly face infrastructure-funding obligations, phased energization and higher delivered-power costs. The strongest positive read-throughs concern grid modernization, gas turbines and commercially available bridge generation. The clearest negatives concern hyperscaler project economics and utility cash-recovery constraints. These are directional fundamental conclusions, not evidence that the affected equities are undervalued or that undisclosed contracts have been awarded.
ELECTRICAL EQUIPMENT AND INFRASTRUCTURE SERVICES
GRID RELIABILITY SPENDING IS MORE DURABLE THAN A PURE DATA CENTER CONNECTION THESIS (READ-THROUGH 1)
Affected companies: Quanta Services (PWR: US); Hubbell (HUBB: US).
Directional impact and magnitude: Positive. Material support for the multiyear industry demand outlook, with unquantified company-specific revenue upside. The call provides stronger evidence for sustained utility spending than for an immediate earnings upgrade at either supplier.
Call evidence: FirstEnergy expects “at least a 25% increase” in its existing $19 billion transmission investment plan. More importantly, Jon Taylor stated, “Most of the increase you'll see is from the work that we need to do on our existing system to stabilize, provide better reliability, provide better resiliency to the system.” Management also indicated that the current PJM competitive window emphasizes lower-voltage, more localized projects.
Transmission mechanism: The minimum implied transmission program rises to $23.75 billion. Existing-system reinforcement creates demand for engineering, line reconstruction, substation work, switching, protection, connectors and other utility equipment. Quanta participates through construction and integrated infrastructure services; Hubbell participates through utility electrical components and grid equipment. Spending justified by asset condition and reliability is less dependent on the completion of a particular hyperscaler campus than dedicated customer-connection infrastructure.
The more differentiated implication is that an emphasis on smaller, localized projects is not necessarily negative for suppliers. It can broaden the number of executable work packages and reduce dependence on a handful of large interstate corridors. Smaller projects are not automatically easier to permit or construct, but the opportunity does not require every major regional transmission proposal to advance simultaneously.
Quanta has an additional verified commercial connection through its strategic agreements with American Electric Power, covering high-voltage transmission execution and transformer and breaker manufacturing. Those agreements support AEP’s regulated and competitive transmission businesses, including Transource, which partners with FirstEnergy. This establishes a credible commercial pathway, but not an award of FirstEnergy’s incremental spending to Quanta. No specific FirstEnergy contract for Hubbell was identified in the call.
Timing and actionability: The February 2027 capital-plan update and Q1 2027 PJM awards are potential order-expectation catalysts. Revenue conversion should extend across 2027-2031. The $4.75 billion minimum increase compares different rolling periods, so it is not entirely incremental spending within an unchanged window. Favorable implications would weaken if the expanded plan were heavily back-end loaded, regulatory approvals slipped or labor and equipment constraints prevented backlog conversion.
GAS TURBINES: THE BOTTLENECK IS BECOMING A COMMERCIAL COMMITMENT, NOT JUST A DEMAND FORECAST (READ-THROUGH 2)
Affected companies: Siemens Energy (ENR: Germany); GE Vernova (GEV: US).
Directional impact and magnitude: Direct positive for Siemens Energy; indirect positive for GE Vernova. The disclosed reservation is more important as confirmation of sustained equipment scarcity and customer commitment than as a standalone earnings event for either diversified manufacturer.
Call evidence: Brian Tierney stated, “we have reserved the turbines with Siemens for delivery in 2030.” FirstEnergy also issued an initial RFP for an additional 3 GW of combined-cycle turbines. Management explicitly linked the prospective 2031-2032-and-beyond generation schedule to equipment backlogs.
Transmission mechanism: Utilities are securing manufacturing slots years before commercial operation, shifting procurement decisions earlier in the project-development cycle. This supports order visibility and negotiating leverage for turbine manufacturers, while successful installations create future service opportunities. The relevant listed Siemens exposure is Siemens Energy, rather than Siemens AG.
The additional 3 GW RFP creates a further addressable opportunity for major turbine suppliers, including GE Vernova. However, FirstEnergy did not identify a selected supplier for that capacity. The Siemens reservation also should not be equated with disclosure of a fully unconditional equipment order: price, cancellation provisions, deposits and revenue-recognition milestones were not provided.
The negative counterpart is borne by power developers and customers. Equipment availability constrains commissioning schedules and increases the value of securing slots before all commercial and regulatory conditions are resolved. Developers may therefore assume commitments earlier while remaining exposed to permitting, customer and construction outcomes.
Timing and actionability: Maidsville approval and conversion of remaining contracts could provide a near-term confirmation catalyst. The additional procurement update is expected in early 2027. Equipment revenue and subsequent service economics extend later in the decade and beyond. The strongest conclusion is sustained demand visibility, not a quantified margin increase or an immediate revenue acceleration. Reservation cancellations, manufacturing expansion or weaker customer conversion would reduce scarcity-related pricing leverage.
BRIDGE GENERATION: UTILITIES ARE BECOMING A ROUTE TO MARKET FOR MODULAR POWER (READ-THROUGH 3)
Affected companies: Bloom Energy (BE: US); Caterpillar (CAT: US).
Directional impact and magnitude: Positive for addressable demand. Potentially more significant to Bloom’s concentrated business exposure than to Caterpillar’s consolidated earnings. No FirstEnergy supplier award or revenue amount was disclosed.
Call evidence: Management described customers seeking to begin approximately 1 GW campuses with approximately 100 MW buildings and said it was considering reciprocating engines, fuel cells, batteries and other technologies that could deliver power faster than combined-cycle generation. Tierney added, “we don't view those bridge solutions as being disposable.”
Transmission mechanism: The commercial problem is no longer simply backup power. It is supplying enough dependable electricity to begin operating a campus before permanent grid and generation infrastructure arrives. Bloom’s stationary fuel-cell systems and Caterpillar’s reciprocating generation equipment address that problem through modular deployment. FirstEnergy’s willingness to participate also demonstrates that onsite generation can complement utility development rather than necessarily displace the utility relationship.
The potentially non-consensus benefit is channel expansion. Utilities could help originate, coordinate or own bridge solutions, while customers or third parties could also supply the capital. That creates more possible purchasing structures than a model in which each hyperscaler independently procures generation. The equipment requirement can arise before the permanent power plant or transmission project enters service.
The reuse argument requires restraint. Redeployable or reusable assets can improve project economics, but reuse can also reduce the number of new equipment purchases required for subsequent campuses. Residual value, refurbishment, transportation and continued onsite operation must be assessed individually. Batteries are complementary equipment rather than a standalone source of continuous energy.
Timing and actionability: Bridge arrangements could generate commercial announcements before the 2030 turbine-delivery milestone, making this a potentially nearer-duration opportunity than the permanent generation program. Named contracts, fuel arrangements and permitting are the actionable catalysts. The call supports the product categories, not a conclusion that Bloom or Caterpillar has won the work. Higher operating costs, emissions constraints or inadequate gas infrastructure could limit deployment.
MERCHANT POWER AND NUCLEAR GENERATION
NEW GAS ANNOUNCEMENTS DO NOT REMOVE THE NEAR-TERM VALUE OF EXISTING DELIVERABLE POWER (READ-THROUGH 4)
Affected companies: Constellation Energy (CEG: US); Talen Energy (TLN: US).
Directional impact and magnitude: Positive for the value of existing PJM generation and long-term contracting opportunities. Potentially material at the asset level, but the earnings effect depends on uncontracted output, hedging, plant availability and applicable market rules. Incremental supply creates a longer-term counterweight rather than an immediate offset.
Call evidence: Maidsville turbines are scheduled for delivery in 2030. The additional 3 GW was discussed in terms of 2031-2032 and beyond, with inconsistent timing answers in the draft transcript. FirstEnergy is pursuing bridge power precisely because customers want electricity before permanent combined-cycle solutions can be delivered.
Transmission mechanism: A planned generating unit does not supply electricity or dependable capacity until it is completed and qualified to operate. Long development schedules preserve the commercial advantage of existing generation that can support near-term customer requirements. Constellation and Talen can benefit through contracting of available output, plant uprates, life extensions and reduced dependence on short-duration merchant sales where economically attractive.
Talen’s existing agreement with Amazon provides a verified example of the contracting mechanism: the announced arrangement covers up to 1,920 MW from Susquehanna, with delivery ramping through 2032 and a contractual term extending through 2042. FirstEnergy’s timetable reinforces the strategic rationale for such arrangements. It does not reprice output already committed under those contracts or establish that either generator will supply FirstEnergy’s prospective customers.
The most important distinction is between scarce generation and deliverable power. Transmission access, interconnection arrangements and customer location still determine whether an existing plant can monetize demand. Electricity scarcity also does not translate mechanically into uncapped capacity prices because procurement design, regulatory intervention and hedging affect realized economics.
Timing and actionability: Near-term catalysts are new customer agreements, uprate announcements, revised contracting disclosures and resource-adequacy developments. The fundamental scarcity support is strongest before substantial new capacity arrives. Beyond 2031, completed generation and transmission could moderate scarcity rents. However, FirstEnergy also described demand continuing beyond 2030-2031, so the announced projects are not sufficient evidence of eventual regional oversupply.
CLOUD COMPUTING AND DATA CENTER DEVELOPMENT
POWER ACCESS IS BECOMING A CUSTOMER-FUNDED INFRASTRUCTURE OBLIGATION (READ-THROUGH 5)
Affected companies: Microsoft (MSFT: US); Amazon.com (AMZN: US); Alphabet (GOOGL: US); Meta Platforms (META: US).
Directional impact and magnitude: Negative for the economics and deployment timing of power-constrained campuses; positive for the relative competitiveness of operators with secured power and sufficient capital to fund infrastructure. Potentially material at individual projects, but no consolidated earnings reduction can be quantified from this call.
Call evidence: Taylor said prospective Maidsville customers showed “an openness to fund some of the investment through a surcharge type of mechanism.” Management emphasized allocating project and commercial risk to large-load offtakers while protecting existing customers. The discussion of beginning a roughly 1 GW campus with a roughly 100 MW building also demonstrates phased rather than immediate full-scale energization.
Transmission mechanism: Electricity procurement is increasingly linked to funding the assets required to supply it. Depending on final terms, customers may face infrastructure surcharges, minimum-payment obligations, collateral requirements or commitments that outlast their initial deployment schedule. Such arrangements can increase the present value of power costs and reduce flexibility to relocate workloads or defer a campus.
The scale is economically relevant even for well-capitalized customers. A 1 GW campus operating at a 90% load factor consumes approximately 7.9 million MWh annually. An illustrative $10/MWh increase in delivered-power cost would therefore add approximately $79 million of annual expense. This is a sensitivity, not a forecast of FirstEnergy’s pricing. Construction contributions and minimum payments could create additional obligations not captured in the energy-price calculation.
The more subtle effect is on capital productivity. Staged energization can protect a project from complete delay, but it also means that a large land, construction and equipment commitment may initially support only a fraction of the intended campus capacity. Coordinating server procurement with actual energization becomes increasingly important. The call does not demonstrate idle equipment at any named company.
FirstEnergy did not identify its negotiating counterparties. The companies listed are affected through their large-scale data center development models, not a claimed FirstEnergy customer relationship. The best-capitalized operators could gain share against weaker developers because they can fund deposits, infrastructure and long-term power commitments. That competitive benefit can coexist with lower project-level returns.
Timing and actionability: The near-term catalysts are signed power agreements, disclosed infrastructure contributions and changes in campus commissioning schedules. The longer-duration shift is a transfer of infrastructure and utilization risk toward large customers. This is a reason to scrutinize the conversion of AI capital spending into operating capacity, not evidence that demand for AI services is weakening.
REGULATED UTILITIES
REGIONAL TRANSMISSION PARTNERS HAVE REAL EXPOSURE, BUT GROSS CAPITAL GROWTH OVERSTATES SHAREHOLDER ECONOMICS (READ-THROUGH 6)
Affected companies: American Electric Power (AEP: US); Dominion Energy (D: US).
Directional impact and magnitude: Positive for the duration and breadth of transmission investment opportunities. Moderate incremental confirmation of the fundamental thesis, with no support for applying FirstEnergy’s 25% spending increase directly to either peer’s capital plan or EPS.
Call evidence: FirstEnergy cited more than $5 billion of awarded competitive transmission investments since 2022, including joint ventures, and expects further PJM awards in Q1 2027. Tierney stated that competitive windows should continue “for the foreseeable future.” Taylor also said approximately 30% of the combined transmission business belongs to external partners, while additional investments could require up to approximately 35% equity or equity-like funding.
Transmission mechanism: AEP and Dominion have verified regional development relationships with FirstEnergy through Valley Link. AEP’s Transource also participates with FirstEnergy in Grid Growth Ventures in central Ohio. Consequently, FirstEnergy’s observations about regional reinforcement are relevant to existing partner businesses rather than merely to utilities operating nearby. Repeated planning windows create opportunities to extend investment programs beyond currently awarded projects.
The geographical implication is that transmission investment can benefit utilities even when the associated data center is outside their retail service territory. Regional power flows require infrastructure across multiple jurisdictions. This creates a broader opportunity than a simple comparison of each utility’s contracted local data center MW.
The negative read-through is financing intensity. A utility earns only its retained share of project returns and must finance its contribution before or alongside customer recovery. Minority ownership, equity issuance and holding-company costs can materially reduce the translation from gross capital growth to EPS. FirstEnergy’s 35% assumption is not a financing forecast for AEP or Dominion, but it demonstrates why larger utility capital plans require a complete funding analysis.
Timing and actionability: Q1 2027 PJM selections and subsequent company-specific capital updates are the relevant catalysts. The larger benefit extends across the later 2020s and early 2030s. The strongest positive signal would be additional attributable projects accompanied by credible earnings and cash-recovery schedules. A larger gross project list without improved per-share economics would be less valuable.
NEW JERSEY AFFORDABILITY POLICY CAN DELAY CASH RECOVERY EVEN WHEN INVESTMENT IS NECESSARY (READ-THROUGH 7)
Affected companies: Public Service Enterprise Group (PEG: US); Exelon (EXC: US).
Directional impact and magnitude: Negative for the certainty and timing of utility cash recovery. Moderate jurisdiction-specific risk, not evidence of a current earnings impairment or an imposed reduction in allowed returns at either company.
Call evidence: FirstEnergy’s JCP&L requested a $253 million rate increase but proposed delaying customer bill impacts until 2028. The accompanying presentation distinguishes expected rate effectiveness in Q2 2027 from the later bill impact. Management also discussed an ongoing New Jersey review involving affordability, multiyear rate plans and performance-based regulation.
Transmission mechanism: Regulators can acknowledge that investment is necessary while constraining the timing or structure of customer payments. Depending on the mechanism, bill offsets, deferred recovery and extended amortization can preserve accounting earnings while weakening near-term cash conversion or increasing financing needs. PSEG is exposed through PSE&G; Exelon is exposed through Atlantic City Electric. The governor’s statewide affordability initiative makes the issue relevant beyond FirstEnergy.
The important cross-portfolio point is that wholesale power scarcity can benefit merchant generators while creating political pressure on the distribution utilities that deliver the electricity. Customers experience the total bill, even when the utility does not profit from the energy-supply component. Higher wholesale prices can therefore indirectly constrain the utility’s ability to recover unrelated reliability investment promptly.
The direct precedent is the separation of rate effectiveness and customer bill impact, not a proven shareholder loss. JCP&L’s proposed offsets cannot automatically be assumed to require an equivalent funding burden at PSE&G or Atlantic City Electric. The ultimate effect depends on the source of credits, carrying-cost treatment and approved recovery arrangements.
Timing and actionability: Management expected greater clarity on the New Jersey review in late 2026 or early 2027. Regulatory orders and peer disclosures are more actionable than broad political statements. The negative implication would diminish if adopted multiyear frameworks improve recovery predictability and fully compensate financing costs. It would strengthen if bill restraint produces growing unrecovered balances or restrictions on investment recovery.
NATURAL GAS PRODUCERS AND REGIONAL GAS INFRASTRUCTURE
WEST VIRGINIA POWER DEVELOPMENT SUPPORTS IN-BASIN GAS MONETIZATION, NOT AN IMMEDIATE HENRY HUB DEMAND SHOCK (READ-THROUGH 8)
Affected company: EQT Corporation (EQT: US).
Directional impact and magnitude: Positive for longer-duration Appalachian gas marketing and contracting opportunities. Potentially meaningful for regional demand and contract economics, but limited evidence of incremental 2027-2028 gas consumption from FirstEnergy’s permanent generation projects.
Call evidence: FirstEnergy is advancing Maidsville and seeking an additional 3 GW of combined-cycle turbines. Management identified finalizing gas supply as a remaining Maidsville gate. The company’s project materials identify Maidsville as approximately 1.2 GW, bringing the combined prospective generation opportunity to approximately 4.2 GW.
Transmission mechanism: New generation near Appalachian production can create an additional local outlet for gas, potentially reducing dependence on transporting every incremental molecule to distant markets. Long-term generator contracts may also permit pricing structures that share in power-market value rather than relying exclusively on regional gas benchmarks. EQT’s regional production and commercial platform make it a relevant exposure.
A separate, verified transaction demonstrates the mechanism without establishing a FirstEnergy relationship. In August 2026, Competitive Power Ventures announced a 10-year power-netback gas agreement with EQT for the proposed 2.1 GW CPV Shay project in West Virginia, covering anticipated consumption exceeding 100 Bcf annually. That agreement shows that long-term power-linked gas contracting is already commercially achievable in the same state. EQT was not identified as Maidsville’s supplier.
The potential physical scale is significant but conditional. If all 4.2 GW were built, operation at 60% to 85% capacity factors with heat rates of 6.5 to 7.0 MMBtu/MWh would imply approximately 0.38 to 0.58 Bcf/d of gross gas consumption. These are illustrative engineering sensitivities, not company forecasts. Net regional demand would also depend on displacement of other generation, dispatch economics and the timing of actual customer load.
The non-consensus distinction is geographical and temporal. This development is more directly supportive of long-term in-basin contracting than of an immediate nationwide gas-price increase. Turbine delivery and commercial-operation schedules place most permanent-plant demand near or beyond the start of the next decade. Firm transportation, laterals and permitting remain essential, so abundant regional gas does not by itself establish deliverability.
Timing and actionability: A named supply agreement or gas-infrastructure commitment could be a nearer-term commercial catalyst. Physical consumption is a longer-duration benefit. The call does not support assigning a specific pipeline award to any midstream company or counting the full prospective burn in near-term gas balances.
SOURCE SCOPE
The read-throughs rely on the supplied call, its accompanying company materials and verified public company disclosures. Historical-memory retrieval was incomplete and was not used to establish company relationships or financial claims.
Report record
- Sector
- Utilities
- Industry
- Electric Utilities
- Fiscal period end
- September 30, 2026
- Report date
- October 27, 2026
- Analysis
- 6591 words
- Read-throughs
- 3100 words
- Content fingerprint (PDF)
894fedb5e321- Content fingerprint (analysis)
e387a1f410aa- Content fingerprint (read-throughs)
3fd63ba3ab7c
Prepared from the company's earnings release and earnings call transcript. Figures as reported by the company. For information only. Not investment advice.
More from FirstEnergy Corp.
No other reports yet.
More in Utilities
Improved growth durability, limited immediate consensus upside
Earnings Resilient Near Term; the Financing Model Is Unresolved
Follow @AtlasPeakRes on X for new earnings reports as they publish.