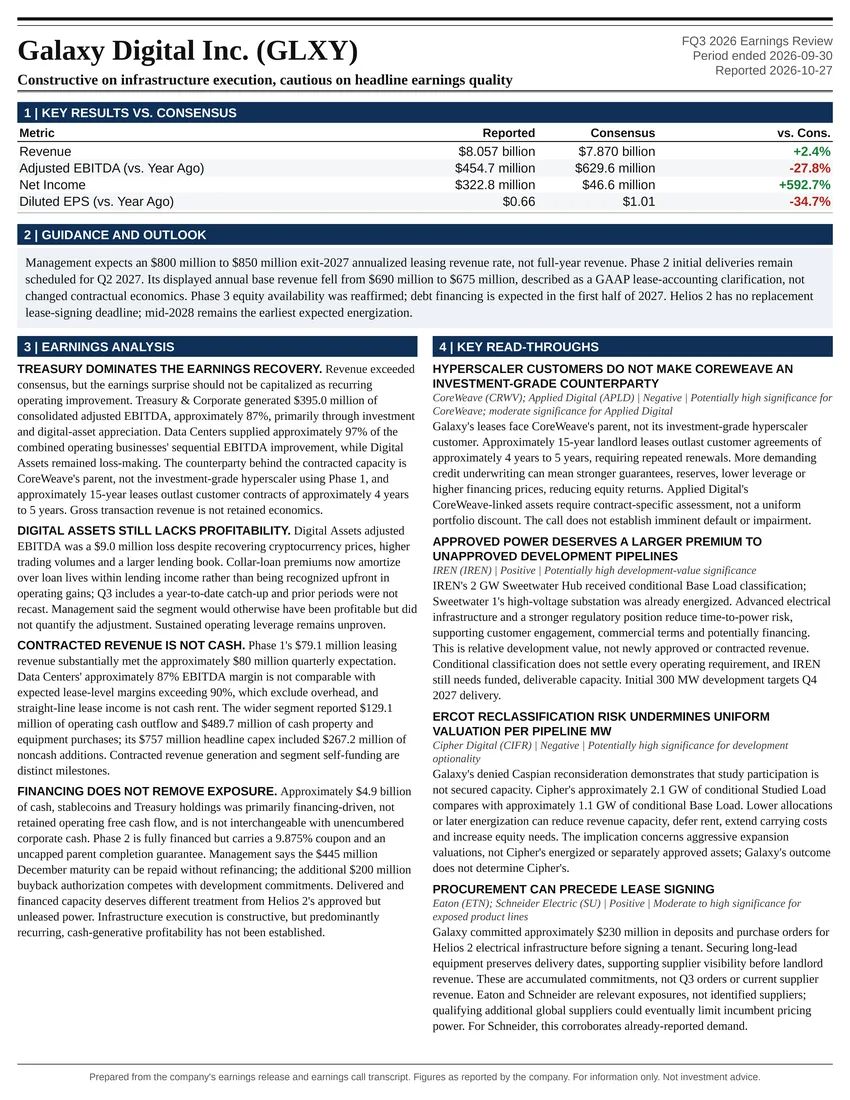
Constructive on infrastructure execution, cautious on headline earnings quality
Earnings Reports
Robinhood Markets, Inc. FQ3 2026 Earnings Report
Robinhood Markets, Inc. (HOOD) FQ3 2026 earnings: The quarter strengthened the strategic platform thesis more than the near-term earnings-upgrade thesis.. Full earnings analysis, key read-throughs, and the one-page exhibit from Atlas Peak Research.
Robinhood Markets, Inc. (HOOD)
Sector: Financials · FQ3 2026 · Period end September 30, 2026 · Reported October 27, 2026
Neutral/hold is the appropriate investment stance at the $90.34 after-hours reference price in the Bloomberg earnings notice.
Download the one-page report (PDF)
View one-page exhibit
Download analysis (.md)
Download read-throughs (.md)
Post to X
One-Page Exhibit
Earnings Analysis
EXECUTIVE CALL SUMMARY: Robinhood Markets, Inc. (10/27/26)
Neutral/hold is the appropriate investment stance at the $90.34 after-hours reference price in the Bloomberg earnings notice. Q3 demonstrated continued franchise expansion and substantial profitability, but the earnings call did not establish that revenue monetization, customer engagement, and forward earnings growth are improving sufficiently to justify a larger valuation premium. The central distinction is between strong product adoption and less consistent financial conversion. Trading volumes reached records, but several realized revenue yields declined. New businesses materially supported revenue growth, but conventional crypto trading revenue weakened. Expense guidance declined modestly, but still implies a substantial Q4 spending increase. October deposits were strong, but a large philanthropic contribution materially influenced the headline.
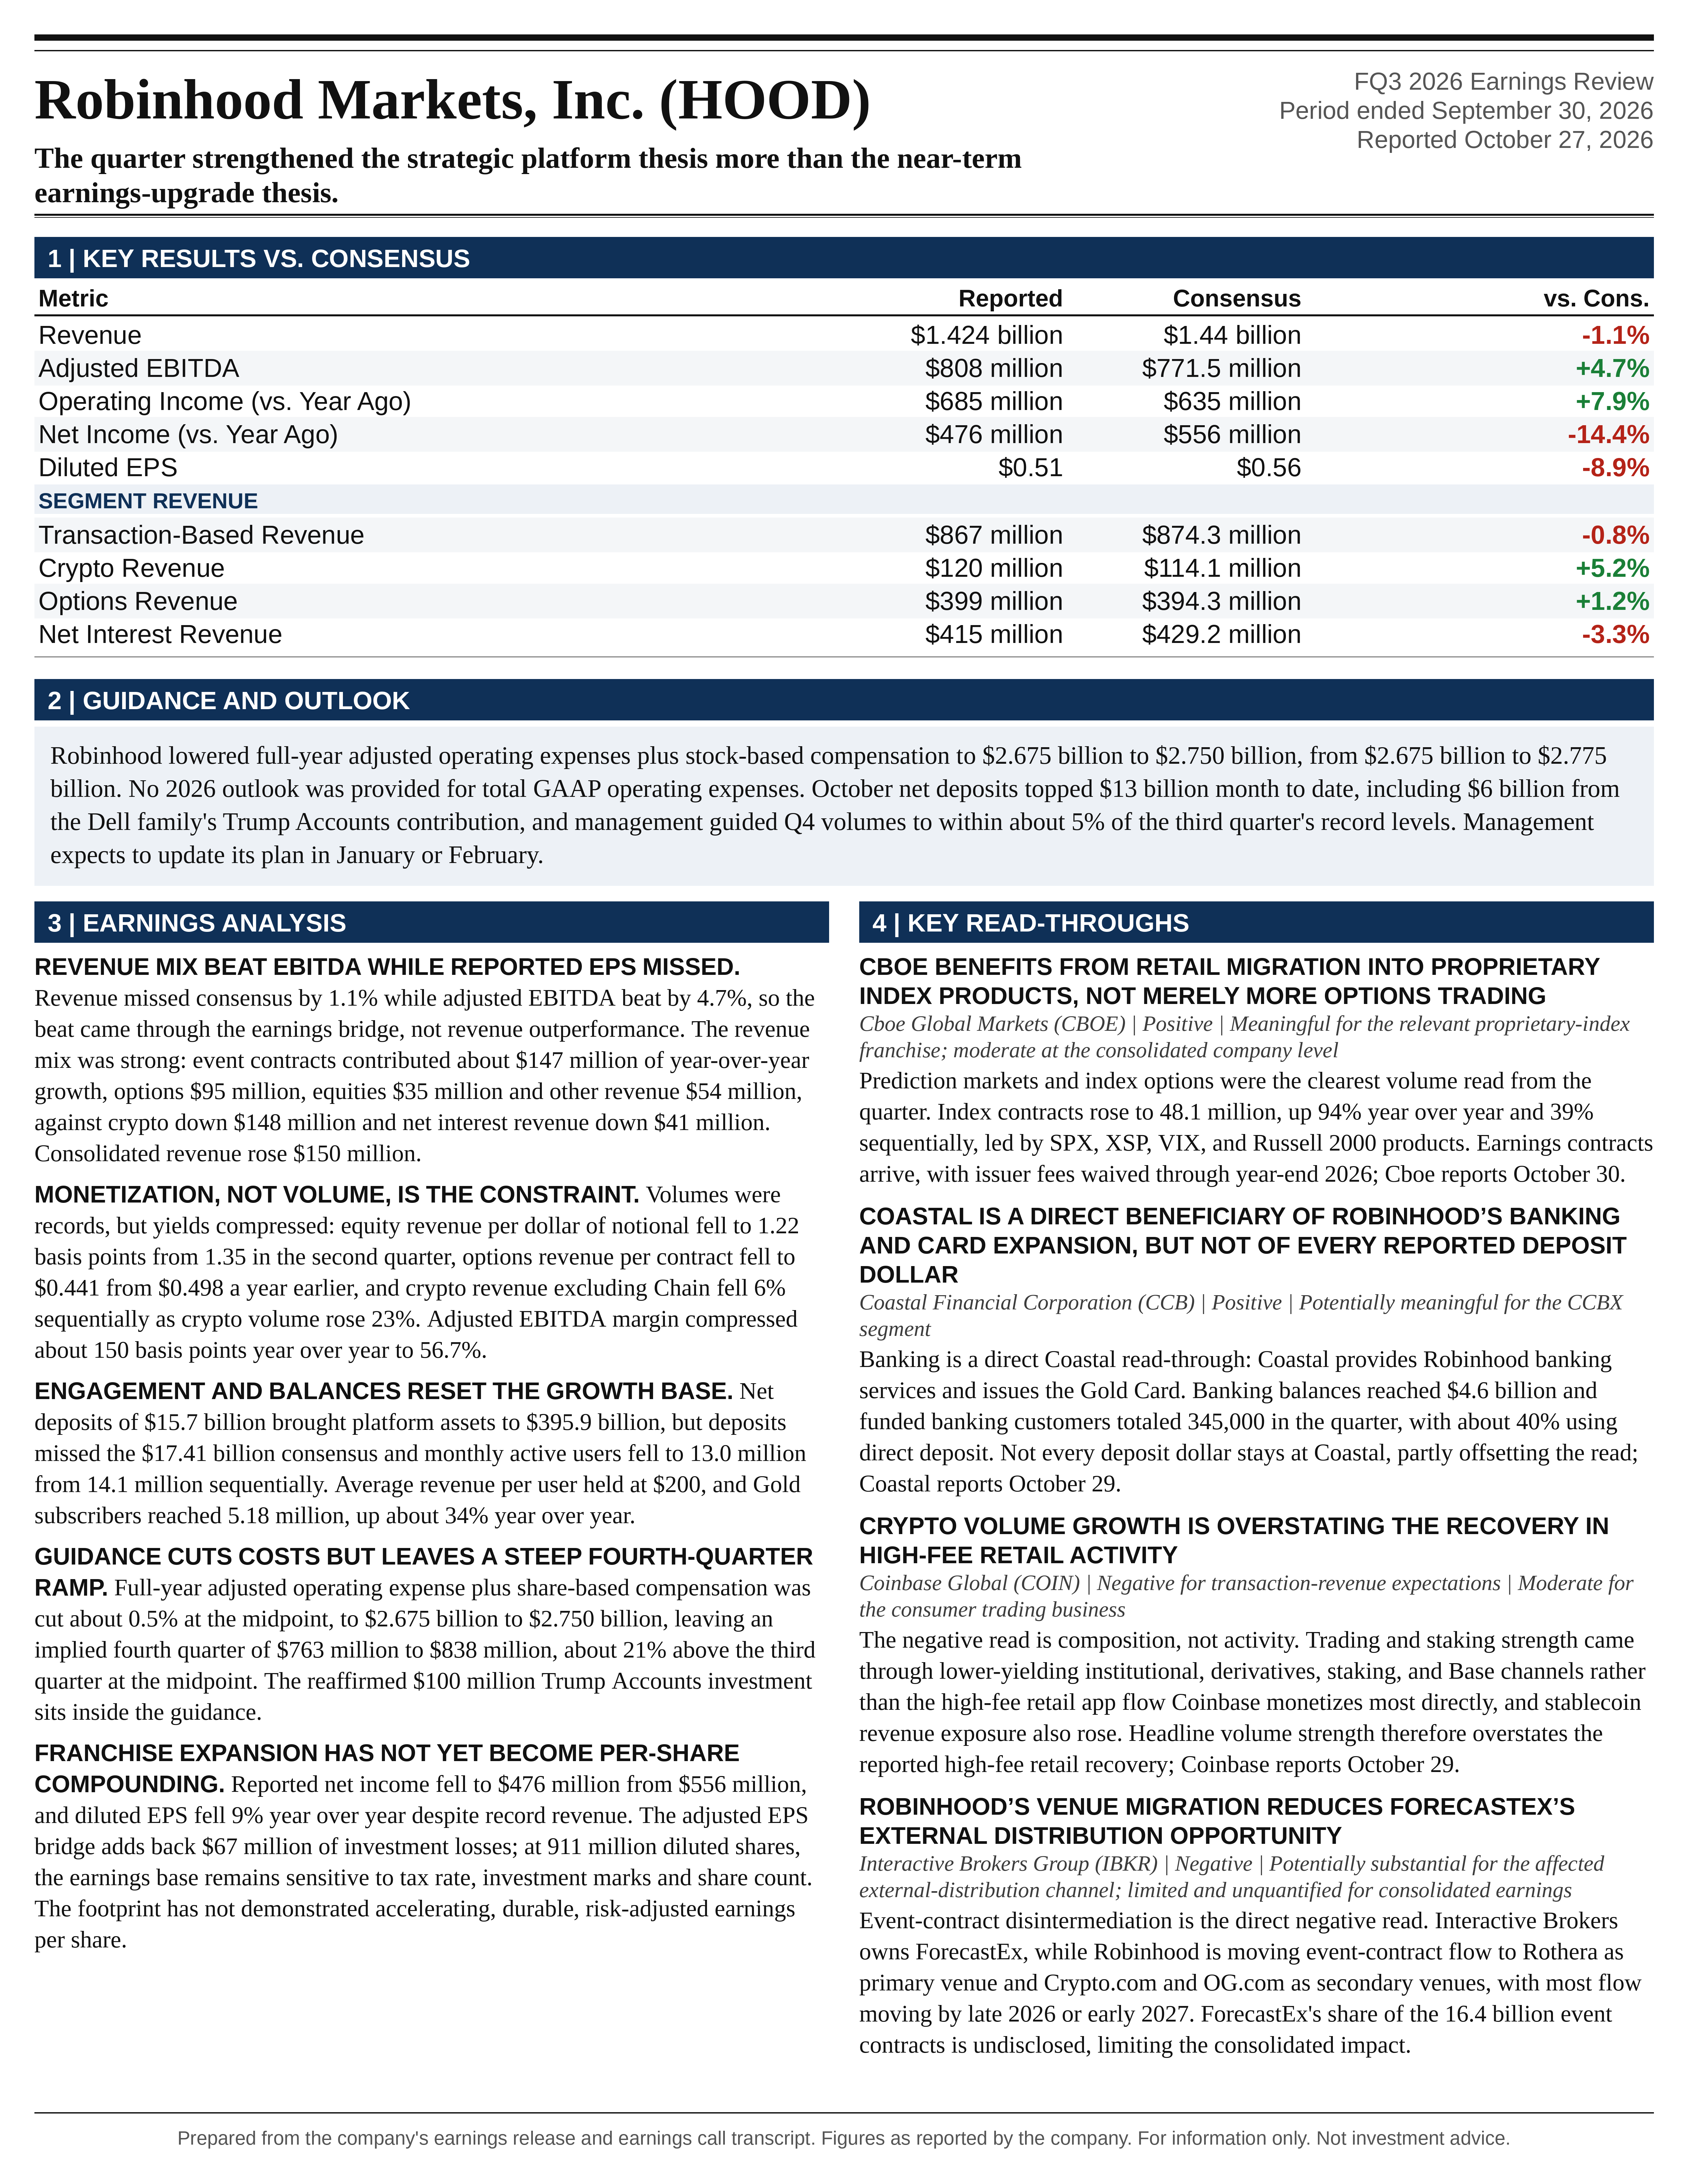
Revenue reached $1.424 billion, up 12% year over year and 9% sequentially, while adjusted EBITDA reached $808 million. Relative to the supplied Bloomberg consensus, revenue missed by approximately 1.1%, adjusted EBITDA exceeded expectations by 4.7%, and reported EPS of $0.51 missed the $0.56 estimate by 8.9%. The newly introduced adjusted EPS measure was $0.60, down from a retrospectively calculated $0.62 in Q3 2025 but up from $0.50 in Q2 2026. The sequential improvement in adjusted earnings is meaningful and prevents the quarter from being characterized simply as deteriorating profitability. However, a record revenue quarter with declining year-over-year adjusted EPS is not evidence of accelerating per-share compounding.
Several details in the official earnings presentation materially sharpen the interpretation of management’s remarks. Crypto revenue of $120 million included $26 million from Robinhood Chain. Excluding Chain, crypto transaction revenue declined 6% sequentially to $94 million despite a 23% increase in reported crypto trading volume. Other revenue included $47 million of Trump Account service revenue, accounting for most of that category’s year-over-year increase. Provision for credit losses increased 173% to $71 million and remains outside the expense measure management guides. Monthly active users declined to 13.0 million from 14.1 million sequentially and 13.8 million a year earlier. These are important qualifications to the description of the core business as “firing on all cylinders.”
The strongest positive evidence is the breadth of customer monetization opportunities and the ability to launch products without proportionate increases in corporate overhead. Options revenue increased 31%, equities revenue increased 41%, event-contract revenue increased from $26 million to $173 million, Gold subscribers reached 5.18 million, and banking balances increased to $4.6 billion at quarter-end. Rothera crossed $100 million of quarterly annualized revenue in its 1st full operating quarter. Robinhood is increasingly controlling distribution, trading infrastructure, financing, and customer relationships across multiple products.
The principal investment question is whether these advantages can produce sustained growth in earnings attributable to common shareholders after credit losses, customer incentives, investment spending, taxes, and dilution. The quarter strengthened the strategic platform thesis more than the near-term earnings-upgrade thesis. A constructive long-term view remains supportable, but the current evidence favors valuation discipline rather than treating every new product, account, or dollar of trading volume as equivalent economic growth.
The official earnings release and event materials date the call to 10/27/26; the preliminary transcript is dated 10/28/26. Published financial statements and presentation disclosures resolve several transcription issues, including Gold subscribers of 5.18 million rather than the inconsistent spoken references, annualized ARPU of $200 rather than the corrupted figure in the final analyst question, and the exchange name Rothera.
FINANCIAL PERFORMANCE AND CONSENSUS RECONCILIATION
Revenue of $1.424 billion was approximately $16 million below the $1.44 billion Bloomberg consensus. Transaction-based revenue of $867 million missed the $874.3 million estimate by $7.3 million, or 0.8%. Net interest revenue of $415 million missed the $429.2 million estimate by $14.2 million, or 3.3%. Other revenue of $142 million exceeded the $139.8 million estimate by $2.2 million. Net interest income was therefore a larger source of disappointment than the transaction-revenue category in aggregate. The consensus category estimates do not sum precisely to the rounded consolidated consensus, so they should not be forced into an exact consolidated surprise bridge.
Within transaction revenue, options generated $399 million against $394.3 million expected, a 1.2% beat. Crypto generated $120 million against $114.1 million, a 5.2% beat. Equities generated $121 million against $131.4 million, a 7.9% miss. This mix is important: the equity-revenue miss occurred despite record equity trading volume, while the crypto-revenue beat incorporated a new infrastructure revenue stream rather than a recovery in conventional trading monetization.
Net deposits of $15.7 billion missed the $17.41 billion estimate by $1.71 billion, or 9.8%. ARPU of $200 was effectively in line with the $200.68 estimate. The combination suggests that monetization per funded customer was broadly anticipated, while asset gathering was weaker than expected during the quarter. The subsequent October rebound is relevant, but its composition requires separate evaluation.
Adjusted EBITDA exceeded consensus by $36.5 million. That is a meaningful profitability beat, particularly against a revenue shortfall. It indicates better expense and earnings-bridge performance than embedded in the consensus EBITDA estimate. It does not, however, establish that all operating costs were below expectations, because adjusted EBITDA and management’s adjusted expense measure have different adjustment boundaries.
Historically, consolidated revenue increased from $1.274 billion in Q3 2025 and $1.308 billion in Q2 2026. The year-over-year revenue bridge illustrates both diversification and dependence on new sources of growth. Event-contract revenue increased approximately $147 million, options increased $95 million, equities increased $35 million, and other revenue increased $54 million. These gains were substantially offset by a $148 million decline in crypto revenue and a $41 million decline in net interest revenue. Event contracts alone contributed an increase almost equal to the entire $150 million consolidated revenue increase, although substantial growth elsewhere was offset by weakness in other categories.
The quarter’s diversification should not be dismissed as merely replacing lost crypto revenue. Revenue excluding the entire crypto category increased approximately 29.6% year over year. Nevertheless, removing the specifically disclosed $26 million Chain contribution and $47 million Trump Account service contribution reduces consolidated revenue growth to approximately 6.0%. This is an analytical comparison, not an organic-growth measure: it does not remove all acquisitions, Rothera-related effects, or other new products. It demonstrates that these 2 identifiable initiatives supplied nearly 49% of the consolidated year-over-year revenue increase.
EARNINGS QUALITY, TAXES, AND THE NEW ADJUSTED EPS MEASURE
Adjusted EBITDA increased 8.9% year over year, below revenue growth of 11.8%. The exact adjusted EBITDA margin was approximately 56.7%, versus 58.2% a year earlier, a decline of approximately 150 basis points. Sequentially, the margin was essentially stable against 56.7% in Q2. The business therefore showed strong sequential operating execution but modest negative operating leverage on a year-over-year adjusted EBITDA basis.
GAAP operating income increased from $635 million to $685 million, or 7.9%, while operating margin declined from approximately 49.8% to 48.1%. Net income fell from $556 million to $476 million, and net income attributable to Robinhood shareholders fell to $468 million after $8 million attributable to non-controlling interests. The distinction matters when reconciling consolidated earnings to EPS.
Taxes explain much of the year-over-year decline in net income. Pretax income declined only 1.4%, from $634 million to $625 million, while the tax provision increased from $78 million to $149 million. The effective tax rate consequently increased from approximately 12.3% to 23.8%. The $71 million increase in tax expense accounts for most of the $80 million decline in consolidated net income. The GAAP earnings decline should therefore not be interpreted as a comparable deterioration in operating franchise profitability. Conversely, a return to the unusually low prior-year tax rate should not be embedded in valuation without supporting guidance.
Investment marks also materially distorted the sequential comparison. Q2 included $129 million of gains, primarily associated with the deconsolidation of Robinhood Ventures Fund I. Q3 included $67 million of losses, primarily related to Ventures investment marks. Comparing reported EPS of $0.62 in Q2 with $0.51 in Q3 without normalizing these effects understates the improvement in underlying earnings.
The new adjusted EPS reconciliation is more informative than simply adding $0.07 of investment losses back to reported EPS. Starting with $468 million of income attributable to Robinhood, the company added $2 million of CFO-transition stock compensation, $67 million of investment losses, $9 million of intangible amortization, and a $4 million tax adjustment to reach $550 million of adjusted net income. With 911 million diluted weighted-average shares, adjusted EPS was $0.60. The retrospectively calculated comparable figures were $454 million and $0.50 in Q2 2026, and $565 million and $0.62 in Q3 2025.
Management’s statement that “we're still including normal-course SBC in our adjusted EPS” is an important positive feature. Ordinary equity compensation remains an economic cost in the new measure, and credit-loss provisions are not removed. However, adjusted EPS is broader than a measure excluding only non-operating investment marks because it also excludes intangible amortization and specified compensation and restructuring items. It should supplement, rather than replace, GAAP earnings and capital-allocation analysis.
The comparison between $0.60 adjusted EPS and the supplied $0.56 consensus should not be presented as a clean earnings beat. The consensus notice does not establish that analysts used the newly introduced adjustment methodology. Reported EPS missed the stated estimate; underlying adjusted earnings improved sequentially. Both statements can be true.
Management’s “Rule of 80” characterization also requires a defined measurement period. The earnings presentation reports a trailing-12-month growth-plus-adjusted-EBITDA-margin score of 77%, down from 94% in Q2 and 131% a year earlier. The current quarter’s approximately 12% revenue growth plus 57% adjusted EBITDA margin produces approximately 69%. The business remains unusually profitable, but the composite measure is declining as revenue growth normalizes. It is not evidence of accelerating growth and is not directly comparable with recurring-revenue software economics.
EXPENSE GUIDANCE AND THE Q4 SPENDING STEP-UP
The formal full-year adjusted operating expense and stock-based compensation outlook declined to $2.675 billion to $2.750 billion from $2.675 billion to $2.775 billion at the July 29 earnings release. The lower bound was unchanged, the upper bound declined $25 million, and the midpoint declined $12.5 million, or approximately 0.5%. Management rounded the midpoint reduction to $13 million.
This followed a more substantial reduction at Q2, when the range declined from $2.700 billion to $2.825 billion to $2.675 billion to $2.775 billion, despite adding Rothera and WonderFi costs to the forecast perimeter. The sequence supports the view that management is finding efficiencies and redeploying savings. The Q3 revision itself was modest and should not be characterized as a major reduction in the forward cost structure.
The more consequential disclosure is the remaining-quarter spending requirement. Year-to-date adjusted operating expenses and SBC were $1.912 billion. Subtracting that amount from full-year guidance implies $763 million to $838 million in Q4, consistent with the presentation’s rounded range of approximately $765 million to $840 million. The exact midpoint is approximately 21% above Q3’s $664 million and 34% above Q4 2025’s $597 million.
The lower annual expense ceiling therefore coexists with a meaningful sequential expense increase. At unchanged revenue, that increase would pressure profitability unless offset by changes in SBC, credit costs, other earnings adjustments, or revenue mix. The precise EBITDA impact cannot be calculated from the expense guide alone because SBC is included in the guided expense measure but excluded from adjusted EBITDA.
Management identified additional Trump Account work, expansion of Gold and Platinum credit cards, and selected 2027 initiatives pulled forward into Q4 as spending drivers. The approximately $100 million full-year Trump Account investment expectation was reaffirmed. Crucially, management did not endorse the analyst’s suggestion that this spending should be treated as non-recurring. The response was that the company is being asked to do more and expects continued investment. Automatically removing $100 million from the 2027 cost base would therefore be unsupported.
No formal 2027 expense, revenue, EPS, or margin guidance was provided. Management expects to complete planning and communicate the plan in January or February. References to greater efficiency in existing businesses are a resource-allocation philosophy, not a quantified commitment to low total expense growth. Savings are explicitly being reinvested.
The exclusion of credit-loss provisions from expense guidance is economically important. Q3 GAAP operating expenses were $739 million, versus $664 million for adjusted expenses including ordinary SBC. The difference principally comprised $71 million of credit-loss provisions, $2 million of CFO-transition SBC, and $2 million of specified interest expense. A lower adjusted expense ceiling does not cap the company’s credit losses or its total GAAP operating costs.
Underlying expense discipline is nevertheless visible. Technology and development expense increased 7% year over year, marketing increased 2%, and general and administrative expense declined 12%. Operations expense increased 139%, reflecting the growing servicing and operational footprint. Annualized revenue per employee reached approximately $1.89 million, up 7%, with quarter-end headcount of 3,042. This supports operating efficiency, although transaction-driven revenue per employee also reflects market activity and should not be interpreted solely as a technology-productivity measure.
Q4 TRADING GUIDANCE AND WHAT IT DOES NOT ESTABLISH
The October commentary indicates resilience, not an unequivocal acceleration. Prepared remarks described equities, options, and crypto average daily volumes as approximately 5% lighter than Q3. During Q&A, the CFO clarified that the categories were within approximately 5% of Q3’s record levels. The appropriate interpretation is broadly stable to somewhat softer activity, rather than a precise 5% decline across every asset class.
Event-contract average daily volume was approximately 10% above Q3. That is a favorable near-term indicator, supported by sports activity and the November midterm elections. It is not equivalent to 10% sequential revenue growth because realized fees depend on contract mix, Gold discounts, exchange economics, and the distribution of contract prices.
Management also reported tighter spreads and potentially slightly lighter take rates. Thus, stable trading activity may not produce stable transaction revenue. The combination of a higher expense run rate, flat-to-softer traditional trading activity, and fee pressure makes Q4 earnings more demanding than the headline expense-guidance reduction suggests.
No numerical Q4 revenue or EPS forecast was supplied. October observations cover only part of the quarter and cannot establish the full-quarter result, particularly for crypto, event contracts, and Chain fees. The call supported continued customer activity, but not a broad-based upward revision to near-term earnings expectations.
CORE TRADING: VOLUME GROWTH IS OUTRUNNING MONETIZATION
Equity notional volume increased 53% year over year to $992 billion, while equity revenue increased 41% to $121 million. Sequentially, volume increased approximately 4%, but revenue declined approximately 6%. Recognized revenue per dollar of equity notional consequently declined to approximately 1.22 basis points from 1.35 basis points in Q2 and 1.33 basis points a year earlier.
Management attributed equity monetization variability to single-stock versus ETF mix and market spreads. That explanation is economically plausible and is supported directionally by the increasing importance of ETFs in customer assets. ETFs represented approximately 31% of equities under custody, versus 28% a year earlier. However, asset mix is not identical to trading mix, so it does not by itself quantify the revenue-yield decline.
Options volume increased 48% year over year to 905 million contracts, while revenue increased 31% to $399 million. Recognized revenue per contract was approximately $0.441, essentially unchanged sequentially but below approximately $0.498 a year earlier. Options therefore showed much better sequential monetization stability than equities, although the year-over-year volume-to-revenue conversion remained weaker.
These calculations measure recognized revenue divided by disclosed activity, not pure customer pricing. Customer-match incentives are allocated as contra revenue across categories, and product mix, execution spreads, and exchange economics also affect the ratios. Nonetheless, they demonstrate that market-share gains are not translating proportionately into revenue growth.
Crypto requires an especially careful separation. The presentation identifies $88 million of Robinhood App revenue and $6 million of Bitstamp revenue, producing $94 million of crypto transaction revenue excluding Chain. Both the combined figure and Robinhood App revenue declined approximately 6% sequentially. Meanwhile, Robinhood App volume increased from $18.3 billion to $20.6 billion, and Bitstamp volume increased from $22.1 billion to $29.2 billion.
The Robinhood App’s recognized revenue yield declined from approximately 51.4 basis points to 42.7 basis points. The combined trading yield excluding Chain declined from approximately 24.8 basis points to 18.9 basis points. Institutional mix contributes to the blended decline: Bitstamp produced $6 million of revenue on $29.2 billion of volume, dramatically lower monetization per dollar than the retail app.
Management identified Robinhood Earn stablecoin activity as the principal driver of weaker crypto take rates and stated that monetization excluding stablecoins remained broadly similar to Q2. That claim supports a mix explanation rather than necessarily a deterioration in pricing on comparable trades. However, the stablecoin-adjusted revenue and volume series were not disclosed, preventing independent reconstruction of that assertion.
The investment conclusion is that the $120 million crypto headline overstates the improvement in conventional crypto trading. Chain provided $26 million of new revenue, more than the entire $20 million sequential increase in the category. This is a successful diversification outcome, but not evidence that the legacy crypto revenue engine has recovered.
NET INTEREST REVENUE: BALANCE GROWTH VERSUS SECURITIES-LENDING ECONOMICS
Net interest revenue declined 9% year over year to $415 million despite record interest-earning assets. The quarter-end asset base was $76.7 billion, up approximately 19% year over year and 7% sequentially. Margin balances reached $22.1 billion, cash sweep balances were $32.3 billion, cash and deposits were $20.4 billion, and credit-card-related balances were approximately $1.84 billion.
Margin interest revenue was a clear strength, increasing 59% year over year to $244 million and 13% sequentially. Credit-card net interest revenue increased 194% year over year to $50 million. These gains demonstrate that balance growth and product expansion are generating meaningful income.
The offsets were substantial. Interest on segregated cash, securities, and deposits declined from $103 million to $55 million year over year. Cash sweep revenue declined from $64 million to $45 million. The reported net securities-lending line moved from positive $87 million to negative $19 million. These accounting-line changes explain why record balances did not produce record net interest revenue.
The negative securities-lending line should not be confused with a negative total economic contribution from securities lending. The presentation reports total securities-lending revenue, including associated cash-collateral interest partly used to fund margin balances, of $108 million, versus $109 million in Q2 and $173 million a year earlier. The overall franchise was therefore approximately stable sequentially but down 38% year over year. Management attributed the year-over-year decline principally to reduced demand for hard-to-borrow securities. Associated collateral income is distributed across other interest-revenue categories, making isolated interpretation of the negative line misleading.
The distinction between asset yield and total net interest yield is similarly important. The presentation shows the yield on identified interest-earning asset categories increasing from 2.33% to 2.41% sequentially. After including net securities lending, credit-facility expense, and other items, total net interest revenue divided by average interest-earning assets declined from 2.34% to 2.26%. Better asset-category yields did not translate into a higher all-in net interest yield.
Management quantified rate sensitivity at approximately a 1.5% change in total revenue for a 25-basis-point rate move, using approximately $40 billion of rate-sensitive assets. The underlying arithmetic implies approximately $100 million of annual pretax revenue sensitivity, or $25 million quarterly. Against the current revenue run rate, that is closer to approximately 1.7% to 1.8%, but the disclosure is reasonably interpreted as an approximate sensitivity.
At an illustrative 24% tax rate and 911 million diluted shares, the $100 million annual sensitivity equates to approximately $0.08 of annual EPS, before changes in balances, deposit pricing, trading activity, or credit performance. The call’s sensitivity is a static calculation, not a forecast that rate increases necessarily improve total earnings. Higher rates can also pressure asset valuations, borrowing demand, and borrower credit quality.
NET DEPOSITS, CUSTOMER GROWTH, AND ENGAGEMENT
Q3 net deposits declined 23% year over year and 28% sequentially to $15.7 billion. The quarterly annualized growth rate was 17%, below the stated 20% annual objective, while trailing-12-month deposits of $71.0 billion represented approximately 21% growth against the prior-year asset base. Quarterly and trailing measures therefore tell different stories: the longer-term asset-gathering franchise remained healthy, but the latest quarter slowed.
The exact platform-asset bridge was constructive. Assets increased from $368.7 billion to $395.9 billion, comprising $15.7 billion of net deposits and $11.5 billion of market gains. The increase was not simply market appreciation. However, asset growth should not be confused with revenue growth because the incremental balances include products with materially different monetization and servicing economics.
October deposits exceeded $13 billion, including approximately $6 billion from the Dell family contribution to Trump Accounts. Excluding only that identified contribution, deposits exceeded approximately $7 billion, still a strong result compared with Q3’s monthly average of approximately $5.2 billion. The October rebound therefore had substance beyond the donation, but approximately 46% of the headline amount at the stated threshold came from that contribution.
The annual-target comparison also changes after adjustment. Beginning-of-year platform assets were $322.1 billion, implying approximately $64.4 billion of deposits to meet a 20% calendar-year growth objective. The roughly $68 billion year-to-date figure exceeded that threshold. Removing the identified $6 billion Dell contribution produces approximately $62 billion, which does not establish that the target had already been met excluding the gift. Because management used “over” rather than exact totals, this is an approximate comparison rather than an exact reconstruction.
Even the ex-Dell figure should not be labeled organic deposits. The company’s definition includes dividends, interest, staking rewards, promotional assets, and specified institutional contributions. TradePMR flows entered the reported deposit perimeter in March 2026, WonderFi in June, and Trump Account contributions in July. These changes broaden the economic franchise but complicate historical comparability.
Customer acquisition was more modest than the asset-growth headlines. Funded customers increased approximately 340,000 sequentially to 28.7 million. The presentation shows approximately 0.6 million new customers, 0.1 million resurrected customers, and 0.4 million churned customers, subject to rounding. The much larger Q2 increase also included approximately 0.3 million acquired customers. Sequential comparisons should therefore distinguish product-led customer acquisition from acquisition-related additions.
Monthly active users declined to 13.0 million. A simple ratio to funded customers fell to approximately 45%, from approximately 50% sequentially and 51% a year earlier. This is not a cohort retention measure, and differences in product usage and acquisition perimeter affect interpretation. Nevertheless, declining active users alongside rising trading volumes implies that aggregate activity is becoming more concentrated among active customers.
Management’s statement that “we don't goal on it” is understandable for a business increasingly serving passive investors and banking customers. Customers can generate value without frequent trading or application use. However, the response did not resolve whether engagement breadth is narrowing among the traditional brokerage population. Deposit growth, active-user breadth, retention, and revenue concentration should be assessed together rather than allowing any single favorable KPI to substitute for the others.
GOLD, BANKING, AND THE CROSS-SELL OPPORTUNITY
Gold subscribers increased to 5.18 million from 4.84 million sequentially and 3.88 million a year earlier. Overall adoption reached approximately 18%, while approximately 40% of newly funded customers adopted Gold. The difference indicates substantial remaining penetration potential, but the new-customer attach rate should not be applied mechanically to the entire installed base. New cohorts may have different product needs, promotions, or acquisition channels.
Management described Gold as “a loyalty product.” The presentation supports that positioning: average Gold customers held approximately 4.0x the assets of the average customer in the specified comparison population, had approximately 3.0x retirement adoption, and showed stronger deposit growth. These are useful indicators of customer value, although the relationship is partly self-selection. Wealthier and more engaged customers may be more likely to subscribe, so the entire difference cannot be attributed causally to Gold.
Gold subscription revenue reached approximately $62 million quarterly, or $248 million annualized, compared with approximately $54 million in Q2. Subscription fees alone were only approximately 4.4% of consolidated revenue. The greater strategic value is potential improvement in customer retention, asset gathering, financing balances, and multi-product economics.
The benefits have costs. Higher cash yields, retirement matches, card rewards, discounted trading, and other services can transfer value back to customers. The relevant measure is incremental customer lifetime contribution after these benefits, not subscriber growth or subscription revenue in isolation.
Banking balances increased from approximately $3.1 billion to $4.6 billion during Q3, while funded banking customers increased from approximately 245,000 to 345,000. That implies approximately $13,300 of deposits per banking customer at quarter-end. The release’s “nearly $5 billion” and “over 350 thousand” descriptions reflect rounding or later observations. Approximately 40% of banking customers had adopted direct deposit, a potentially important indicator of primary financial-account behavior.
Tenev’s statement that banking became the largest withdrawal destination for brokerage customers is strategically significant. Money moving from brokerage into Robinhood Banking remains within the broader customer relationship rather than leaving for an external bank. However, internal movement does not constitute incremental consolidated net deposits. It may also shift revenue between trading, sweep, and banking economics rather than increase total monetization immediately.
The new text-based payment functionality reduces recipient friction by allowing receipt through Apple Pay or Google Pay without requiring a Robinhood banking account. Its most credible near-term value is engagement and acquisition, not direct payment revenue. The call disclosed no fee model, payment volume, customer acquisition cost, conversion rate, or fraud-loss experience.
Banking’s independent onboarding is the key acquisition catalyst. At present, access largely depends on an existing brokerage relationship. General availability and standalone onboarding would allow banking-led customer acquisition and subsequent cross-selling into brokerage. No firm launch date or quantified acquisition target was provided.
Management compared banking rollout with a software-product launch rather than a credit-card underwriting rollout. The distinction is reasonable regarding credit exposure, but banking and payments still require robust fraud controls, dispute resolution, sanctions screening, liquidity management, and partner-bank oversight. Robinhood is not itself a bank; the presentation identifies Coastal Community Bank as the banking-services provider.
CREDIT CARDS: FAST GROWTH WITH A MORE CAPITAL-INTENSIVE EARNINGS PROFILE
Gold Card customers increased 30% sequentially to approximately 1.3 million, and annualized payment volume exceeded $19 billion. Credit-card-related balances increased approximately 26% to $1.84 billion. Net credit-card interest revenue increased 25% sequentially to $50 million.
The reported credit-card interest yield was approximately 11.82% on average balances, net of specified financing-partner interest costs. This is not the customer APR and is not a risk-adjusted return on equity. Credit losses, rewards, servicing, acquisition expenses, capital requirements, and other operating costs must still be considered.
The $71 million consolidated credit-loss provision increased from $56 million in Q2 and $26 million a year earlier. The company attributed the increase primarily to credit-card loan growth. That does not establish deteriorating borrower performance: expected-loss accounting can require provisions as a new loan book expands. However, without vintage-level delinquency, charge-off, loss-coverage, and underwriting disclosures, growth-related provisioning cannot be cleanly separated from worsening credit assumptions.
It would also be incorrect to subtract the entire $71 million consolidated provision from the $50 million card net-interest line and declare the card business unprofitable. The provision covers a broader receivable population, while card economics also include interchange net of rewards and other effects. The appropriate conclusion is that the credit business is growing rapidly but its fully allocated risk-adjusted profitability is not established by the call.
The balance-sheet implications are material. Of the approximately $1.84 billion credit-card balance, approximately $1.645 billion was held through the on-balance-sheet Credit Card Funding Trust and approximately $196 million was funded under the Coastal Bank program. Robinhood is therefore not merely collecting distribution fees on a wholly external lending book. Financing capacity, funding costs, and credit performance increasingly matter to the investment case.
PREDICTION MARKETS AND ROTHERA
Event-contract revenue reached $173 million, up from $156 million sequentially and approximately $26 million a year earlier. Contract volume increased to 16.4 billion from 13.6 billion sequentially. Recognized revenue per reported contract declined from approximately 1.15 cents to 1.05 cents, or approximately 8%. This is a blended accounting measure rather than a pure customer fee, but it confirms that revenue grew more slowly than activity.
Management attributed the pricing changes to a dynamic model intended to improve economics for customers trading contracts away from the center of the probability distribution, together with Gold discounts. Ownership of exchange infrastructure can provide room to reduce customer prices while retaining more economics across the value chain. That is a credible structural advantage.
The claim that pricing changes did not impair take rate should nevertheless be interpreted at the relevant product and ownership level. Aggregate event-contract revenue per reported contract declined. Product mix, exchange integration, Gold adoption, and the definition of the volume denominator can all affect that comparison. Stable economics on comparable transactions and lower blended recognized revenue per contract are not necessarily contradictory.
Rothera’s achievement of more than $100 million of annualized revenue in its 1st full quarter is important evidence that Robinhood’s distribution can rapidly support exchange infrastructure. However, the “14 cylinders” framework is not equivalent to 14 independently additive recurring-revenue businesses. The list includes channels and product categories that can overlap, such as Legend and the underlying trading products. The threshold is also defined by a business having crossed a quarterly annualized revenue level, not necessarily by every business maintaining that level indefinitely.
Rothera’s independent operating structure and its focus on serving futures commission merchants could support institutional adoption. Nevertheless, Robinhood’s ownership means neutrality is not absolute from the perspective of competing distributors. Governance, execution quality, liquidity access, fee treatment, and protection of commercially sensitive information will matter to external FCMs.
The non-sports mix increased from approximately 15% to 30%. Tenev emphasized that the company is less interested in “all sports all the time” and sees differentiation in financial contracts. This is strategically sensible: earnings, economic, crypto, and commodity contracts can align with the existing brokerage customer base and may provide information or hedging utility. The disclosed mix denominator was not sufficiently specified to convert the percentages confidently into revenue or contract counts.
Earnings contracts introduce additional execution requirements. Settlement must clearly distinguish GAAP from adjusted results, define treatment of revisions, identify authoritative data sources, and address disputed outcomes. These requirements are especially important for company-specific KPIs that may lack standardized accounting definitions. The products were not yet available at the time of the presentation and remained subject to approvals.
The Crypto.com and OG.com arrangement expands distribution economics beyond transaction fees. Management disclosed an initial 1% ownership interest and potential ownership of up to 10%, depending on future collaboration, without an initial cash outlay. The potential upside is meaningful, but the contingent interest is not current ownership and cannot be assigned a reliable valuation without the detailed terms.
“No cash outlay” does not mean no economic consideration. Customer flow, distribution access, exclusivity, or commercial commitments can be valuable. Management’s assertion that non-interoperable contracts avoid equities-style routing conflicts also does not eliminate all incentive conflicts. Decisions about which venue’s contracts to list and promote still affect customer choice, liquidity, and shareholder economics.
The planned concentration of most flow on Rothera and Crypto.com/OG.com by late 2026 or early 2027 could improve retained economics but increases dependency on a narrower infrastructure set. Regulatory restrictions, exchange outages, liquidity fragmentation, or adverse outcomes in sports-contract litigation remain material risks. The issuer’s release explicitly acknowledges that legal or regulatory developments could prevent continued offering of certain event contracts.
ROBINHOOD CHAIN AND TOKENIZATION
Chain’s initial commercial traction was substantial. The release disclosed more than $80 billion of decentralized-exchange volume during its 1st mainnet quarter and more than $50 million of gross chain fees. The call referenced more than $100 billion of volume to date, which appears to reflect a later observation rather than the same quarter-end measurement window.
The presentation identifies $26 million of net Chain revenue included in crypto transaction revenue. This reconciles reasonably with management’s approximately $25 million net description after sharing approximately 50% of gross economics with Arbitrum. The gross fee figure should not be treated as revenue fully retained by Robinhood, and Chain revenue should not be added again to consolidated crypto revenue.
The quarter included congestion-related fees, and management deliberately prioritized ecosystem growth over maximizing current fee yield. Tenev stated, “I don't really want to be in the business of like charging high fees for on-chain usage.” That is strategically appropriate for a developing network but weakens the case for capitalizing peak initial fee revenue as a stable recurring stream.
The CFO described normalized monetization as a few basis points of notional activity. As an illustration, a 2-basis-point net yield on $100 billion of quarterly volume would produce $20 million of quarterly revenue. This is a sensitivity, not guidance, and depends on whether the stated yield is net of revenue sharing and applies to a comparable volume population. Gas fees are not necessarily a fixed contractual percentage of notional value.
Developer engagement, stock-token value locked, sustainable liquidity, and repeated application usage are more informative long-term indicators than transaction volume alone. Low-cost blockchain activity can involve substantial turnover on a modest economic asset base. The call’s emphasis on stock-token value locked is therefore more useful than the claim of being a top-ranked chain without a standardized peer-comparison methodology.
Recent on-chain perpetual volume exceeding $1 billion daily is encouraging, but those volumes should not automatically be added to DEX volume or multiplied by a broker-style commission assumption. Some activity may overlap existing network measures, and third-party applications can retain a substantial portion of trading economics. Robinhood’s own derivatives products and its infrastructure fee business require separate models.
The Ondo integration supports the ambition to host tokenized assets beyond Robinhood’s own products. That can improve ecosystem breadth and network utility, while also introducing competition with proprietary tokens. The Ripple discussion established strategic compatibility but did not disclose quantifiable cost savings, transaction economics, or revenue commitments. No material earnings contribution from that partnership is yet supportable.
Tokenization remains contingent on legal rights and regulatory durability, not only technology. Token holders’ claims, redemption rights, corporate-action treatment, transfer restrictions, custody arrangements, and insolvency protections determine the quality of the exposure. Management explicitly acknowledged that additional regulatory certainty would be needed for substantial assets to move onto the technology. U.S. private-company access also remains constrained by accreditation and offering requirements.
TRUMP ACCOUNTS: A LARGE DISTRIBUTION OPPORTUNITY, NOT 70 MILLION RETAIL CUSTOMERS
The program is strategically distinctive because it can place Robinhood infrastructure within a national savings ecosystem rather than require the company to acquire every relationship through conventional retail marketing. Automatic enrollment covered nearly 70 million eligible children, and the Dell commitment of $250 for 25 million children represents $6.25 billion. The approximately $6 billion October contribution is a funded-flow observation, not necessarily the exact amount of the overall pledge.
The 70 million accounts must not be added to Robinhood’s funded-customer count. The presentation explicitly excludes Trump Accounts from that metric while including eligible assets and contributions in platform assets and net deposits. This creates a material denominator distinction: assets and service revenue can grow without the corresponding accounts appearing in funded customers.
The current financial contribution is more tangible than the call alone might suggest. Trump Account service revenue was $47 million in Q3, approximately 3.3% of consolidated revenue. Excluding that amount, other revenue was approximately $95 million versus $88 million a year earlier, or approximately 8% growth rather than the reported 61%. The program accounted for approximately 87% of the category’s year-over-year revenue increase.
The earnings quality of that service revenue depends on the underlying contract. The call did not separate implementation fees, recurring administration fees, asset-based fees, or milestone payments. Annualizing the $47 million quarter into a durable $188 million revenue stream would therefore be premature.
The long-term opportunity depends on employer contributions, additional donors, sustained balances, servicing economics, and eventual conversion into broader financial relationships. A $250 funded balance offers limited asset-based revenue on its own. At an illustrative 10-basis-point annual fee, $6.25 billion of assets would generate only $6.25 million annually. Actual program economics may differ materially, but the sensitivity demonstrates why account count and funded assets cannot substitute for disclosed fee terms.
The approximately $100 million 2026 investment should be evaluated against both current contractual revenue and long-duration customer value. The available information does not establish a standalone program margin or customer acquisition cost. Political continuity, government procurement terms, data permissions, portability, and the respective responsibilities of Robinhood and BNY are important determinants of durability.
AGENTIC TRADING, PERPETUALS, WEALTH MANAGEMENT, AND INTERNATIONAL EXPANSION
Agentic trading had approximately $250 million of assets at the time of the call. The release disclosed approximately 200,000 opened accounts and more than $1.6 billion of notional activity to date. This compares favorably with the approximately 100,000 accounts and more than $100 million of assets described around Q2. Nevertheless, agentic assets represented only approximately 0.06% of total platform assets. The product is strategically promising but not yet a material earnings driver.
Native agent interfaces, external-tool connectivity, and Legend integration can reduce workflow friction and increase engagement. The economic opportunity depends on sustained balances, repeat usage, retained revenue, and customer outcomes, rather than merely more automated trades. Increased trading frequency can also generate greater support, compliance, inference, execution, and loss-management costs.
AI-assisted trading expands operational and conduct risk. Incorrect interpretation, unintended orders, permission errors, prompt manipulation, and correlated automated behavior can create liabilities that differ from conventional manual execution. Controls over authorization, order limits, leverage, auditability, and interruption become important as the product moves from education toward autonomous trading.
Perpetual futures and 24/7 equities extend the platform’s addressable activity but also its operational obligations. Frequent settlement is not equivalent to elimination of leverage, liquidation, liquidity, or counterparty risk. Extended equity trading introduces potential mismatches between continuous customer activity and underlying market liquidity, corporate actions, and conventional clearing processes. The presentation identified U.S. perpetuals as rolling out, while 24/7 equity trading and earnings contracts were not yet available.
Robinhood Strategies reached approximately $2.1 billion of assets and 350,000 funded customers, up 133% in assets year over year and 11% sequentially. Average assets were approximately $6,000 per customer. This is evidence of a developing passive-investing franchise, but the current asset base limits its near-term fee contribution. The more substantial strategic opportunity is retaining customers as they accumulate wealth and addressing concentrated or tax-sensitive positions.
Retirement assets provide stronger evidence of durable wallet-share gains. Retirement AUC increased 51% to $36.6 billion, with approximately 2.28 million retirement accounts. Retirement balances are generally less dependent on active trading frequency, although the economics must incorporate matching incentives and other customer benefits.
International expansion remains an option rather than a quantified earnings forecast. Dubai authorization supports a planned regional rollout in 2027, while Singapore, the UK, the EU, and Canada provide additional distribution. More than 1 million international funded customers includes acquisition-related contributions, so it should not be interpreted entirely as organic adoption.
The ambition for more than 50% of the business eventually to be international and more than 50% institutional describes overlapping dimensions, not additive revenue categories. Institutional and international growth can expand scale while reducing blended monetization, as demonstrated by Bitstamp’s low revenue yield relative to the retail app. Geographic diversification also does not necessarily reduce exposure to global risk appetite, crypto activity, or leveraged trading.
CUSTOMER INCENTIVES, CASH GENERATION, AND CAPITAL ALLOCATION
Customer acquisition economics extend beyond the marketing expense line. Q3 included $60 million of contra revenue associated with customer matches and related incentives, compared with $63 million in Q2. The company had approximately $768 million of unamortized transfer and contribution matches remaining, with a weighted-average amortization period of approximately 4 years.
These incentives are economically relevant even when marketing expense appears tightly controlled. They reduce recognized revenue over time and can create differences between customer acquisition cash spending and current-period earnings. The existing amortization obligation is not eliminated merely by reducing future promotions. Conversely, the balance should not be treated as a new incremental expense beyond the amounts already reflected in reported revenue.
Operating cash flow was $1.225 billion in Q3, compared with an outflow of $1.576 billion a year earlier. Subtracting $21 million of property, software, and capitalized development spending would produce a simple cash-flow-minus-capex figure of approximately $1.204 billion. That is not a reliable measure of distributable owner earnings for this business because customer balances, segregated assets, securities financing, and lending flows materially affect operating cash flow.
Credit-card funding also consumes capital outside that simple calculation. Purchases of credit-card receivables exceeded collections by approximately $435 million during the quarter. The associated financing and credit-risk requirements must be incorporated when assessing cash available for shareholder returns.
Corporate liquidity remained substantial. The presentation identified approximately $6 billion of corporate cash, investments, and stablecoin, plus available credit facilities. However, liquidity growth partly reflects financing. The company raised $2.2 billion of 0% coupon convertible notes in June, and total long-term borrowings were approximately $2.66 billion at quarter-end. A 0% coupon does not eliminate issuance costs, potential dilution, or the economic cost of capped-call protection.
Q3 repurchases were only $25 million, versus $80 million of reported SBC. That comparison does not by itself establish net dilution because the timing, price, award mix, and share-count methodology differ. Diluted weighted-average shares declined from 918 million a year earlier to 911 million. Nevertheless, future per-share returns require continued attention to equity issuance and convertible dilution rather than reliance on aggregate earnings growth.
Management’s stated objective to “maximize earnings per share and free cash flow per share for shareholders over time” is appropriate. The expanding lending, exchange, and private-investment businesses make that discipline more important because higher reported assets or revenues can require greater capital commitment and introduce minority-interest or investment-mark complexity.
VALUATION AND PROBABILITY-WEIGHTED INVESTMENT IMPLICATIONS
At the Bloomberg notice’s $90.34 after-hours price, the stock traded at approximately 37.6x annualized Q3 adjusted EPS of $2.40 and 44.3x annualized reported EPS of $2.04. These are current-quarter run-rate multiples, not forward consensus multiples. Annualizing Q3 does not incorporate the guided Q4 expense increase, seasonality, changing tax effects, or future product contributions.
A premium valuation can be justified by sustained market-share gains, strong profitability, broad distribution, and successful expansion into new financial products. The difficulty is that the quarter’s adjusted EPS declined year over year, the current expense plan implies a meaningful near-term spending increase, and several growth businesses remain inadequately disclosed on a risk-adjusted basis. The stock requires a credible reacceleration in per-share earnings, not simply continued product launches.
A 50% probability base case assumes approximately $6.7 billion of 2027 revenue and a 36.7% adjusted net margin attributable to shareholders, with approximately 911 million diluted shares. This produces approximately $2.70 of adjusted EPS. At 32x earnings, the illustrative value is approximately $86, slightly below the reference price. The assumptions allow for continued asset gathering and product growth, offset by higher spending and credit costs.
A 25% probability bull case assumes approximately $7.5 billion of revenue, a 38.9% adjusted net margin, and approximately $3.20 of adjusted EPS. At 38x earnings, illustrative value is approximately $122, or approximately 35% upside. This outcome requires strong conversion of banking and Gold adoption into deposits, sustained prediction-market growth after favorable seasonal events, successful exchange integration, and durable Chain economics without significant credit or regulatory setbacks.
A 25% probability bear case assumes approximately $5.4 billion of revenue, a 30.4% adjusted net margin, and approximately $1.80 of adjusted EPS. At 25x earnings, illustrative value is $45, or approximately 50% downside. This scenario does not require disappearance of the franchise. A combination of softer trading activity, lower monetization, restricted event contracts, weaker credit performance, and a relatively inflexible expanded cost base would be sufficient.
These are explicit analytical scenarios, not management guidance or verified consensus forecasts. The probability-weighted value is approximately $85, approximately 6% below the reference price. The result supports holding a limited strategic position rather than adding aggressively. A high-conviction short is also difficult to justify because the company continues to gain distribution, possesses substantial liquidity, and has demonstrated an ability to develop meaningful new revenue sources rapidly.
For portfolio construction, HOOD should be treated primarily as exposure to retail risk appetite, growth-equity activity, crypto trading, and emerging consumer-credit risk, rather than as a defensive financial-services compounder. Banking and retirement broaden the franchise but do not yet neutralize those exposures. Existing positions in crypto platforms, high-beta fintech, AI-related equities, or consumer lenders could increase correlated downside.
Absent portfolio-specific constraints, a 0.5% to 1.0% NAV ceiling is more appropriate than a core-sized allocation at the reference valuation. A 20% price-loss review threshold corresponds to approximately $72 and approximately 10 to 20 basis points of portfolio loss at those position sizes, before gaps or slippage. Fundamental exit triggers should override that price framework: material regulatory impairment of prediction markets, persistent deterioration in credit performance, sustained deposit weakness excluding exceptional contributions, or failure of adjusted EPS growth to recover despite continued revenue expansion.
CATALYSTS AND THE EVIDENCE REQUIRED FOR A MORE CONSTRUCTIVE VIEW
The most immediate catalyst is Q4 conversion of October activity into recognized revenue and earnings. Critical observations are whether ex-Chain crypto revenue stabilizes, whether event-contract monetization holds as volume expands, whether Chain fees normalize without losing economically valuable activity, and whether spending remains within the implied Q4 range.
Late 2026 and early 2027 exchange-flow migration could improve prediction-market economics, but successful execution must be demonstrated through retained revenue, liquidity, customer pricing, and earnings attributable to Robinhood’s ownership. The November election period is a favorable activity catalyst but should not become a permanent revenue assumption.
The January or February 2027 planning update is especially important. It should clarify whether Q4 spending is predominantly launch timing or a higher ongoing cost base, whether Trump Account investment remains elevated, and whether credit losses are being adequately incorporated into profitability expectations. Banking general availability and independent onboarding could provide a more durable acquisition catalyst, but timing and unit economics remain unquantified.
The strongest evidence for upgrading the investment stance would be simultaneous improvement in deposits excluding exceptional funding, customer engagement breadth, comparable-product monetization, and adjusted EPS growth. Evidence that new revenue streams require persistently greater subsidies, capital, or credit provisions would weaken the case even if customer and asset counts continued to rise.
The quarter ultimately demonstrated that Robinhood can continue expanding its economic footprint despite a severe decline in crypto revenue and weaker securities-lending conditions. It did not yet demonstrate that the broader footprint is producing accelerating, durable, risk-adjusted earnings per share. The strategic opportunity remains substantial; the valuation requires more consistent financial conversion.
COMPANY EMPLOYEES ON THE CALL
• Vladimir Tenev, Chairman of the Board, President and Chief Executive Officer. • Shiv Verma, Chief Financial Officer. • Chris Koegel, Vice President of Corporate Finance and Investor Relations. • Matt Billings, Vice President, Brokerage and President, as identified in the preliminary participant roster. The payment demonstration describes its participant as Matt from Investor Relations, leaving that speaker attribution unresolved. • Unidentified company speaker, title not established in the preliminary transcript.
RESEARCH ANALYSTS ON THE CALL
• Adam Frisch, Evercore ISI. Rendered as Adam Fresh in the preliminary transcript. • Alex Markgraff, KeyBanc Capital Markets. • Andrew Harte, BTIG. Rendered as Andrew Hardy in the preliminary transcript. • Benjamin Budish, Barclays. • Brian Bedell, Deutsche Bank. • Dan Dolev, Mizuho. • David Smith, Truist Securities. • Devin Ryan, Citizens. • Edward Engel, Compass Point Research. • James Yaro, Goldman Sachs. • Ken Worthington, JPMorgan. • Michael Cyprys, Morgan Stanley. Rendered as Michael Cyprus in the preliminary transcript. • Patrick Moley, Piper Sandler. • Steven Chubak, Wolfe Research. • Ramsey El-Assal, Cantor Fitzgerald. Introduced as Ramsey Asal in the preliminary transcript. • John Todaro, Needham & Company. Identified only as John at Needham in the supplied draft and by full name in the separately published transcript.
Key Read-Throughs
KEY READ-THROUGHS FROM ROBINHOOD MARKETS’ Q3 2026 EARNINGS CALL
Robinhood’s results point to a redistribution of financial-services economics rather than a uniform acceleration in retail financial activity. Distribution, proprietary products, and ownership of trading infrastructure are becoming more valuable, while trading volume is becoming a less reliable indicator of revenue growth. The strongest positive implications concern established infrastructure partners with identifiable contractual exposure, particularly Cboe and Coastal Financial. The clearest negative implications concern crypto transaction monetization and prediction-market venues facing displacement from Robinhood’s distribution network. Importantly, Robinhood’s market-share gains, exceptional philanthropic deposits, and newly consolidated revenue streams should not be extrapolated indiscriminately across peers. The most actionable distinctions are between activity and monetization, contractual exposure and thematic association, and prospective competitive pressure versus demonstrated earnings impairment.
CRYPTOCURRENCY EXCHANGES
CRYPTO VOLUME GROWTH IS OVERSTATING THE RECOVERY IN HIGH-FEE RETAIL ACTIVITY (READ-THROUGH 1)
Affected company: Coinbase Global (COIN: United States). Direction: negative for transaction-revenue expectations. Magnitude: moderate for the consumer trading business; potentially meaningful for consolidated earnings if comparable mix pressure appears at Coinbase, but no quantified earnings miss is established.
The key evidence is obscured by Robinhood’s headline crypto revenue growth. Reported crypto revenue increased 20% sequentially to $120 million, but the earnings presentation identifies $26 million of new Robinhood Chain revenue within that figure. Excluding Chain, crypto transaction revenue declined 6% to $94 million despite a 23% increase in trading volume. Within the Robinhood App, revenue declined from $94 million to $88 million while volume increased from $18.3 billion to $20.6 billion. Recognized revenue per dollar of app trading therefore declined from approximately 51.4 basis points to 42.7 basis points.
The CFO identified Robinhood Earn’s stablecoin activity as the main explanation: “because it's a stablecoin, we monetize it's less than the normal platform.” He also stated that monetization excluding stablecoins remained broadly comparable with Q2. This points principally to mix dilution rather than necessarily a reduction in prices on identical transactions. Bitstamp reinforces the distinction: its volume increased approximately 32% sequentially to $29.2 billion, while transaction revenue remained approximately $6 million.
The transmission mechanism to Coinbase is the changing composition of crypto activity. Stablecoin transfers, institutional execution, and sophisticated trading can produce substantial reported volume without the economics of higher-fee consumer purchases. Consequently, industry-volume improvements should not automatically translate into proportional upgrades to Coinbase’s consumer transaction revenue. A greater share of activity in low-fee products can weaken revenue conversion even while customer engagement improves.
The near-term catalyst is Coinbase’s scheduled October 29 earnings release, particularly consumer revenue, trading mix, and transaction revenue per dollar of volume. Robinhood’s figures support caution toward a volume-led revenue-upside thesis; they do not establish that Coinbase experienced the same percentage decline in monetization.
The longer-duration implication is that crypto platforms increasingly need custody, subscriptions, stablecoin economics, derivatives, and infrastructure revenue to offset pressure on conventional trading yields. Coinbase has its own businesses in these areas, which are important counterweights. The high-conviction negative read-through is therefore to the profitability implied by headline trading growth, not to every component of Coinbase’s business.
DERIVATIVES EXCHANGES AND BROKERAGE INFRASTRUCTURE
CBOE BENEFITS FROM RETAIL MIGRATION INTO PROPRIETARY INDEX PRODUCTS, NOT MERELY MORE OPTIONS TRADING (READ-THROUGH 2)
Affected company: Cboe Global Markets (CBOE: United States). Direction: positive. Magnitude: meaningful for the relevant proprietary-index franchise and moderate at the consolidated company level; the new earnings-contract initiative has limited immediate revenue significance.
Robinhood’s presentation reports 48.1 million index-options contracts in Q3, up approximately 94% year over year and 39% sequentially. This substantially exceeded the 48% year-over-year growth in total options contracts. The relevant signal is therefore not simply an increase in retail options participation, but a shift toward index products.
Cboe’s established Robinhood distribution relationship includes SPX, XSP, VIX, and RUT options. Higher customer participation in these proprietary products transmits through exchange transaction fees and related product economics. This is more direct than assuming that stronger retail trading automatically benefits every exchange or market maker equally. Robinhood’s aggregate index-options disclosure includes products beyond Cboe’s suite, so the entire 48.1 million contracts cannot be attributed to Cboe.
A particularly important cross-company distinction is that Robinhood’s weaker brokerage monetization does not necessarily imply equivalent pressure on Cboe. Robinhood reported options revenue growth below contract growth and attributed variability partly to product mix and spreads. Cboe’s proprietary exchange economics are not identical to the broker’s payment-for-order-flow and customer-fee economics. A shift into index options can therefore be favorable for Cboe even when Robinhood’s revenue per aggregate options contract is lower.
The call also supported the forthcoming launch of company-specific earnings contracts. Management stated that the products were “coming very soon,” subject to remaining approvals. The identified Cboe partnership covers securities-market KPI contracts and should not be conflated with all CFTC-regulated sports and event contracts offered elsewhere on Robinhood.
The near-term catalyst is Cboe’s October 30 earnings release, particularly proprietary-product revenue and revenue per contract. Much of overall exchange volume is already observable through monthly disclosures, so the incremental information is the strength of this distribution channel and the evolving product mix, rather than an entirely undiscovered quarterly volume surprise.
The longer-duration positive is a broader retail distribution base for proprietary derivatives and a potential extension of Cboe’s listing, trading, and clearing infrastructure into company-specific contracts. However, Cboe and Robinhood announced plans to waive fees on the new KPI contracts through year-end 2026. Their launch is therefore principally a product-adoption and strategic catalyst, not a justification for a substantial immediate earnings upgrade.
ROBINHOOD’S VENUE MIGRATION REDUCES FORECASTEX’S EXTERNAL DISTRIBUTION OPPORTUNITY (READ-THROUGH 3)
Affected company: Interactive Brokers Group (IBKR: United States), through ForecastEx. Direction: negative for ForecastEx’s growth opportunity. Magnitude: potentially substantial for the affected external-distribution channel, but limited and unquantified for Interactive Brokers’ consolidated earnings.
The most direct competitive statement on the call was the CFO’s expectation that Rothera would become the primary exchange and Crypto.com/OG.com the main secondary venue, adding that Robinhood would be “getting off most of our competitors.” Management expects the vast majority of flow to pass through those preferred venues by late 2026 or early 2027.
Robinhood’s product disclosures identify ForecastEx as an existing event-contract venue. ForecastEx is part of the Interactive Brokers group. The transmission mechanism is therefore an identifiable distribution relationship: migration of eligible Robinhood contracts away from ForecastEx reduces the exchange’s opportunity to earn transaction and clearing economics from Robinhood customers.
The concern extends beyond lost transactions. Prediction-market liquidity depends on repeat participation, market-maker engagement, and product availability. Losing access to a large distributor can weaken the ability to establish liquidity in new contracts. Robinhood’s 16.4 billion quarterly event contracts demonstrate the scale of the distribution platform, although the portion historically attributable to ForecastEx was not disclosed and should not be estimated from the aggregate figure.
The equity arrangements strengthen Robinhood’s incentive to concentrate flow. Its initial ownership interests in Crypto.com and OG.com, with additional contingent ownership available, mean external venues increasingly compete against infrastructure that offers Robinhood both customer utility and ownership economics. A venue providing only execution access faces a more demanding commercial proposition.
The near-term catalyst is actual product migration during Q4 2026 and early 2027, rather than a retrospective change to Interactive Brokers’ already-reported Q3. Interactive Brokers reported its quarter on October 15, with customer accounts up 35% and net interest income up 19%. Those results demonstrate that the broader franchise remains strong.
The longer-duration implication is a constraint on ForecastEx’s independent distribution ambitions, not a high-conviction bearish conclusion on Interactive Brokers as a whole. Robinhood said “most,” not all, competing venues, and contract availability can preserve selected relationships. Without venue-specific flow and revenue disclosure, a material consolidated EPS reduction would be unsupported.
MIAX HAS REAL ROTHERA EXPOSURE, BUT THE ACCOUNTING AND CONTRACT TERMS LIMIT THE SIMPLE BULL CASE (READ-THROUGH 4)
Affected company: Miami International Holdings (MIAX: United States). Direction: positive for retained-investment economics, with significant limitations on immediate earnings recognition and unrestricted upside. Magnitude: modest at the group level on currently disclosed evidence.
Robinhood stated that Rothera exceeded $100 million of annualized revenue in its 1st full operating quarter. The presentation provides a more precise figure: $28 million of Rothera revenue was included within Q3 event-contract revenue. This establishes operating traction rather than merely a speculative prediction-market business plan.
MIAX retained a 10% interest when it sold 90% of MIAXdx, subsequently renamed Rothera, to the Robinhood-Susquehanna venture. Robinhood’s successful distribution and planned flow concentration therefore improve the operating prospects of an asset in which MIAX retains an economic interest.
The critical qualification is accounting. MIAX’s June 30 filing carries the retained interest at $10 million within investments accounted for at cost, adjusted for impairment and qualifying observable price changes. It is not a straightforward equity-method earnings contribution. Neither 10% of Rothera revenue nor 10% of an assumed Rothera profit should automatically be added to MIAX’s quarterly operating forecasts.
The contractual upside is also more constrained than a perpetual, unrestricted 10% ownership assumption suggests. For 3 years after the January 2026 closing, MIAX can sell its entire retained interest to the buyer at a predetermined valuation. The buyer can acquire 50% of MIAX’s retained interest at a separately predetermined valuation. Exercise of that purchase right could reduce MIAX’s ownership from 10% to 5%. The valuation amounts were not disclosed in the filing passages describing these rights.
The near-term implication is improved evidence supporting the retained asset, not an automatic earnings or book-value increase. Relevant catalysts are subsequent MIAX disclosure of the investment, an observable transaction, a distribution, or exercise of the contractual rights.
The longer-duration positive is participation in a rapidly scaling exchange without MIAX bearing full operating ownership. The high-conviction distinction is between genuine economic exposure and an overstated prediction-market earnings proxy. Robinhood’s success supports the former; it does not establish the latter.
BANKING-AS-A-SERVICE AND FINANCIAL INFRASTRUCTURE
COASTAL IS A DIRECT BENEFICIARY OF ROBINHOOD’S BANKING AND CARD EXPANSION, BUT NOT OF EVERY REPORTED DEPOSIT DOLLAR (READ-THROUGH 5)
Affected company: Coastal Financial Corporation (CCB: United States). Direction: positive for partner-program activity and fee opportunities. Magnitude: potentially meaningful for the CCBX segment and more relevant proportionately than for a large diversified bank; the net earnings contribution remains undisclosed.
Robinhood’s quarter-end banking balances increased from approximately $3.1 billion to $4.6 billion, while funded banking customers increased from approximately 245,000 to 345,000. Gold Card customers increased 30% sequentially to approximately 1.3 million, and annualized payment volume exceeded $19 billion. Management also stated that Robinhood Banking had become the largest withdrawal destination for its brokerage customers, before general availability.
The supplier relationship is explicit. Coastal Community Bank provides Robinhood Banking services and issues the Gold Card. More active accounts, deposits, card spending, and servicing activity therefore expand an existing bank-partner program rather than create a merely thematic opportunity.
Coastal’s prior disclosures demonstrate the relevant accounting channels. Its Q2 BaaS program fee income was $12 million. It also reported fee-earning off-balance-sheet card activity and income associated with deposits swept to other banks. Robinhood’s customer and spending growth can therefore support program, servicing, origination, and sweep-related economics without requiring every customer asset to remain on Coastal’s balance sheet.
This distinction prevents an important modeling error. Robinhood’s $4.6 billion banking balance cannot simply be treated as an equal increase in Coastal’s retained deposits or multiplied by Coastal’s net interest margin. Similarly, Robinhood disclosed approximately $1.645 billion of credit-card receivables held through its own funding trust and approximately $196 million funded under the Coastal program. The bank’s economic exposure depends on funding, sale, servicing, and contractual risk arrangements.
The near-term catalyst is Coastal’s scheduled October 29 earnings release, specifically CCBX program fees, swept deposits, retained funding balances, and credit-enhancement exposures. The longer-duration catalyst is Robinhood Banking’s independent onboarding and general availability, which would broaden acquisition beyond existing brokerage customers.
The principal counterweight is Coastal’s own demonstrated counterparty risk. Its Q2 results included a $68.8 million credit expense associated with a single non-public partner, including an impaired credit-enhancement asset and amounts not expected to be fully collected under indemnification arrangements. That disclosure should not be attributed to publicly traded Robinhood. It does demonstrate that contractual protection is only as strong as the obligor and enforceability.
The positive read-through is consequently to the operating scale of a verified partnership. It is not evidence that Coastal’s broader credit issues have been resolved, nor that Robinhood’s increased credit-loss provision transfers dollar for dollar to Coastal.
TRUMP ACCOUNT FUNDING VALIDATES BNY’S NATIONAL INFRASTRUCTURE ROLE, NOT A LARGE IMMEDIATE ASSET-BASED FEE WINDFALL (READ-THROUGH 6)
Affected company: The Bank of New York Mellon Corporation (BK: United States). Direction: positive. Magnitude: small for near-term consolidated earnings, with potentially more meaningful long-duration servicing and infrastructure value.
The call disclosed automatic enrollment for nearly 70 million eligible children, funding of $250 for 25 million children through the Dell commitment, and approximately $6 billion of related October deposits. Management also described plans to connect employers and donors more directly to the program and emphasized continued work “in partnership with BNY and the US government.”
The relationship is established rather than prospective. Treasury designated BNY as financial agent in April, while Robinhood serves as brokerage and initial trustee in the initial-account structure. BNY’s announcement describes its responsibility as managing the program’s national infrastructure. The new information from Robinhood is therefore implementation and funded scale, not the original contract award.
The transmission mechanism is institutional administration and financial infrastructure: account operations, cash movement, recordkeeping, reporting, and related servicing. Repeated employer and donor contributions would make the program more economically relevant than a single initial funding event, particularly if account activity and accumulated balances persist over many years.
However, the account count is not equivalent to 70 million conventional wealth-management clients, and the initial balances are small. For perspective, the $6.25 billion Dell commitment is only approximately 0.01% of the $59.3 trillion of custody and administration assets BNY disclosed at year-end 2025. A conventional asset-based custody-fee model alone would not make this a major group earnings driver.
Robinhood’s own $47 million of Q3 Trump Account service revenue cannot be assigned to BNY or used to infer BNY’s fee rate. The parties have different responsibilities, and the call did not disclose BNY’s contractual economics.
The near-term catalyst is the Q4 funding and servicing ramp. The longer-duration opportunity is embedding BNY within a national investment-account infrastructure that could accumulate assets and recurring activity over decades. The positive conclusion is strongest for strategic relevance and operational scale; a substantial immediate EPS upgrade would require fee and margin disclosure not provided on this call.
CONSUMER PAYMENTS AND DIGITAL WALLETS
ROBINHOOD IS COMPETING FOR PRIMARY FINANCIAL RELATIONSHIPS, NOT JUST P2P TRANSFERS (READ-THROUGH 7)
Affected companies: PayPal Holdings (PYPL: United States), through Venmo, and Block (XYZ: United States), through Cash App. Direction: negative for longer-term customer-acquisition and cross-selling economics. Magnitude: low near term; potentially moderate for the relevant consumer-wallet businesses if Robinhood’s banking adoption broadens.
The most relevant evidence is the combination of banking adoption, Gold penetration, and the new payment interface. Robinhood Banking reached approximately $4.6 billion of quarter-end balances, Gold reached 5.18 million subscribers, and approximately 40% of banking customers had adopted direct deposit. During the demonstration, Tenev emphasized that recipients could “accept money with Apple Pay or Google Pay without even having a Robinhood banking account.”
The transmission mechanism is competition for the customer’s primary financial relationship. Venmo and Cash App seek to monetize engagement through debit spending, direct deposit, stored balances, credit, investing, and merchant payments. Robinhood is assembling a competing combination around an existing brokerage customer base. Its claim that banking is now the largest destination for brokerage withdrawals suggests that cash previously leaving the platform can remain within its ecosystem.
Recipient interoperability matters because it reduces the need to recreate a fully closed P2P network before offering useful payments. The immediate economic threat is not necessarily a direct fee reduction on person-to-person transfers, which are frequently free. It is a weaker acquisition advantage for incumbent wallets and greater competition for the higher-value products attached to payments activity.
The negative implication is more direct for Cash App’s broader financial-services positioning and for Venmo’s monetization ambitions than for PayPal’s consolidated merchant-processing business. It does not establish that existing users are leaving either platform or that Robinhood’s new payment feature will achieve comparable scale.
Counterevidence is important. PayPal had already reported Q3 on October 27, and its results showed Venmo transaction volume growing at a mid-teens rate and Venmo debit-card monthly active accounts increasing approximately 55% to 6.7 million. Robinhood’s announcement therefore cannot credibly be presented as an explanation for current Venmo deterioration. The demonstrated signal is a strengthening competitive entrant, not observed incumbent customer losses.
The near-term milestone is Robinhood’s broader payment rollout over the following weeks; the more consequential milestone is standalone banking onboarding. The longer-duration risk, extending through 2027 and beyond, is higher acquisition and retention spending, greater rewards competition, and slower expansion of wallet monetization as several platforms pursue the same direct-deposit and spending relationships. The call supports that competitive-pressure conclusion, but not an immediate earnings reduction for PayPal or Block.
Report record
- Sector
- Financials
- Industry
- Capital Markets
- Fiscal period end
- September 30, 2026
- Report date
- October 27, 2026
- Analysis
- 7872 words
- Read-throughs
- 2824 words
- Content fingerprint (PDF)
5fce996146ba- Content fingerprint (analysis)
96f62ed8de89- Content fingerprint (read-throughs)
8f720920ff7f
Prepared from the company's earnings release and earnings call transcript. Figures as reported by the company. For information only. Not investment advice.
More from Robinhood Markets, Inc.
No other reports yet.
All Robinhood Markets, Inc. reports
More in Financials
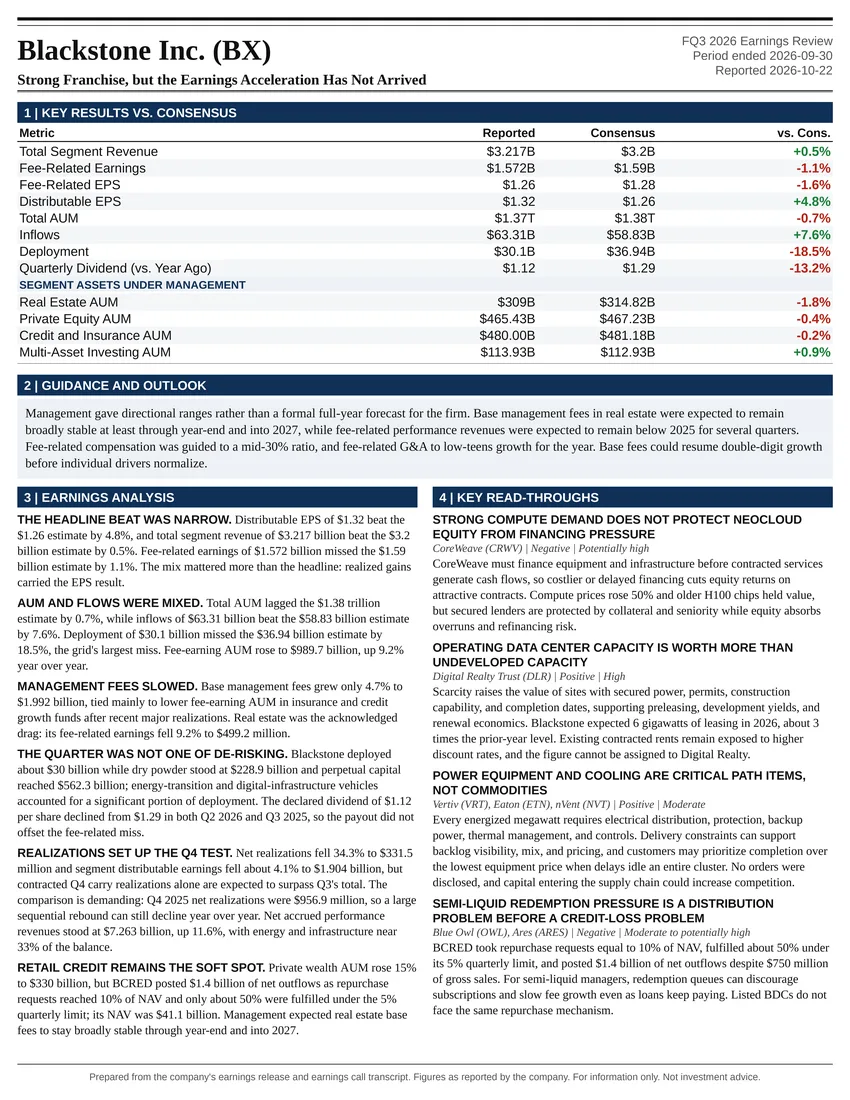
Strong Franchise, but the Earnings Acceleration Has Not Arrived
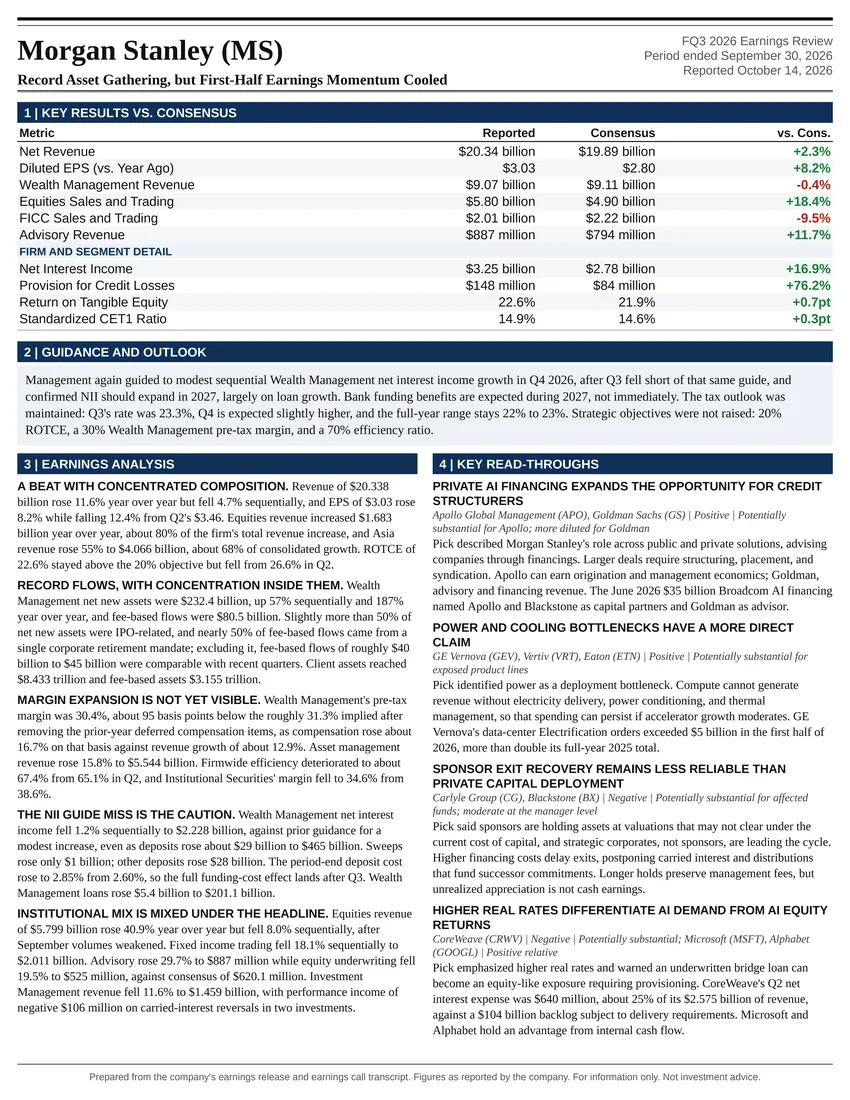
Record Asset Gathering, but First-Half Earnings Momentum Cooled
Follow @AtlasPeakRes on X for new earnings reports as they publish.