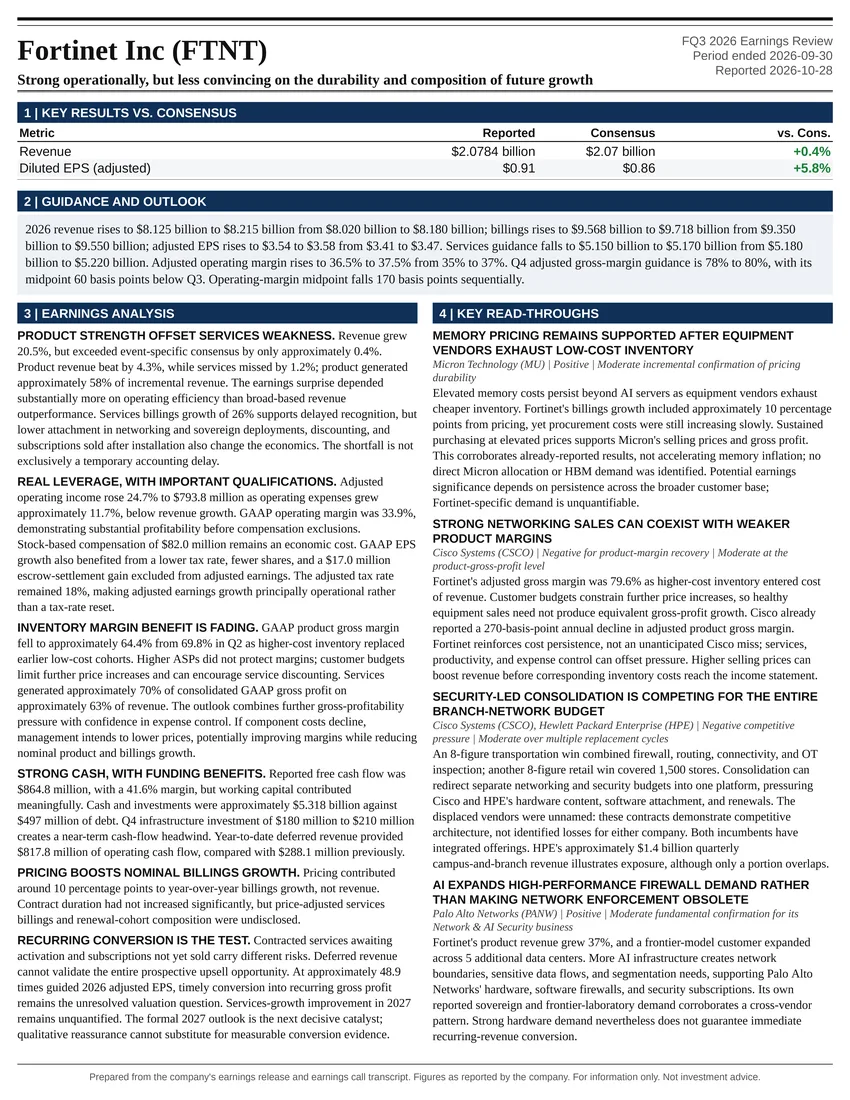
Strong operationally, but less convincing on the durability and composition of future growth
Earnings Reports
KLA Corporation FQ1 2027 Earnings Report
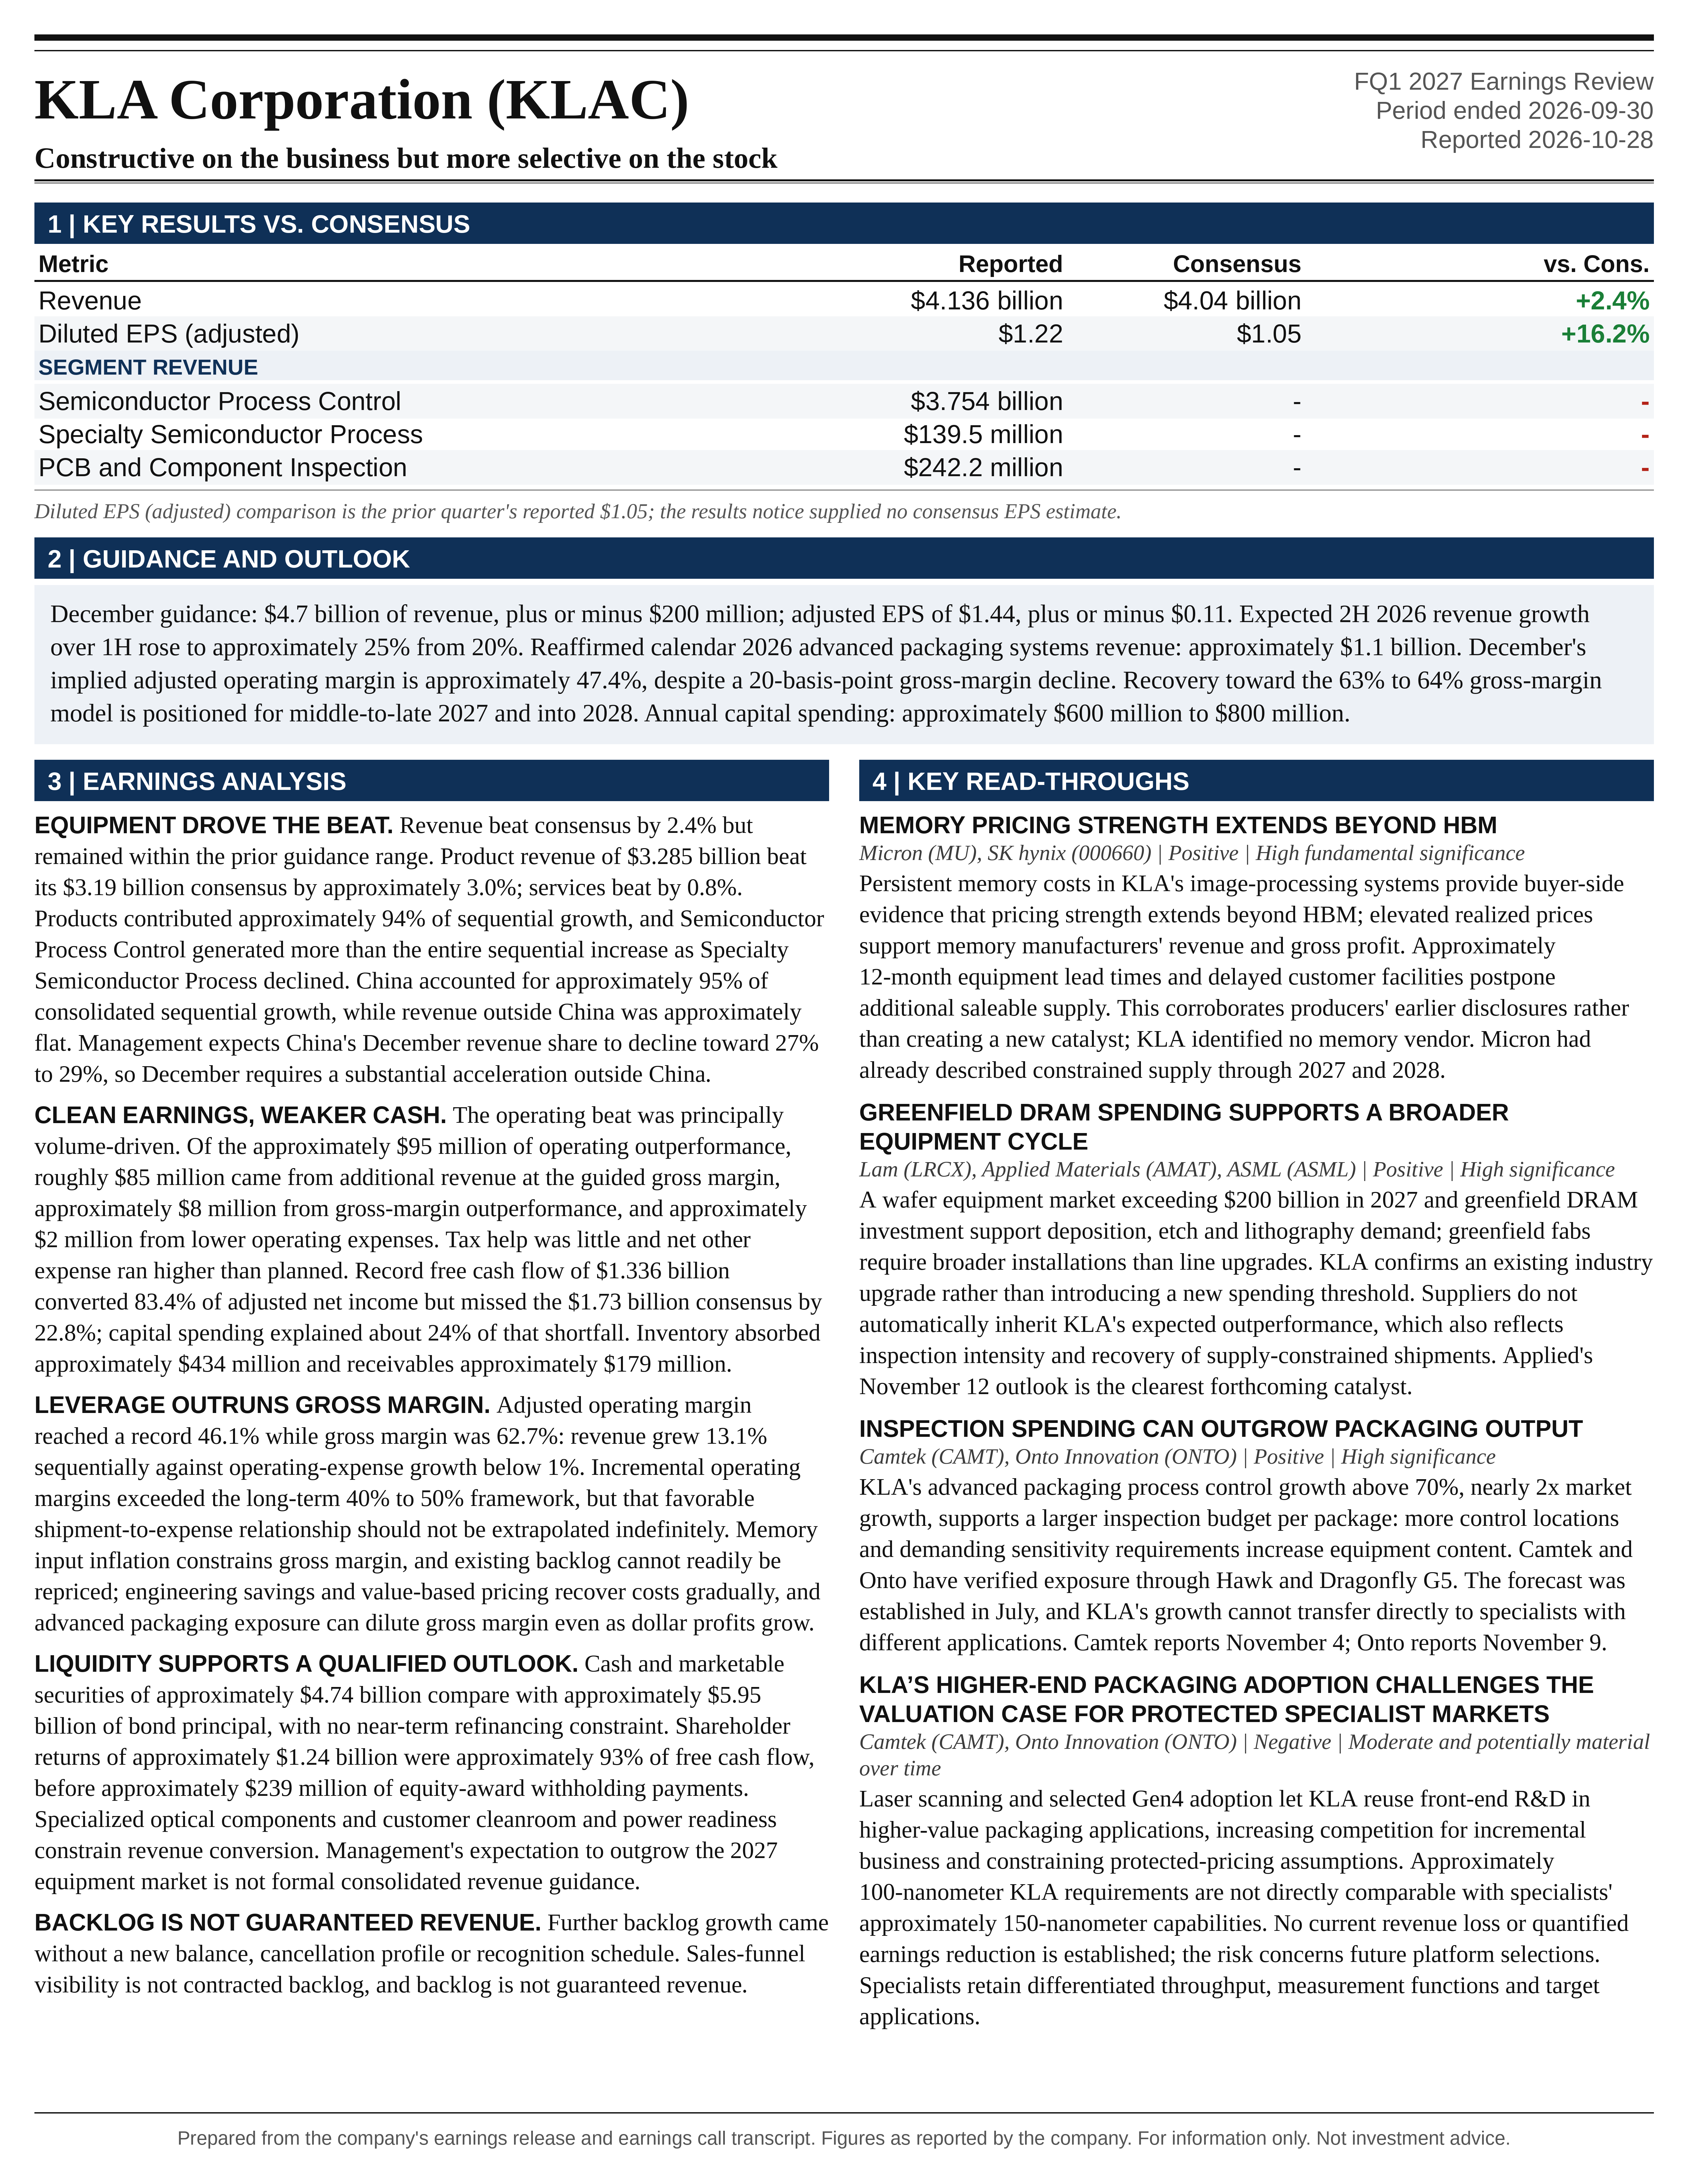
KLA Corporation (KLAC) FQ1 2027 earnings: Constructive on the business but more selective on the stock. Full earnings analysis, key read-throughs, and the one-page exhibit from Atlas Peak Research.
KLA Corporation (KLAC)
Sector: Information Technology · FQ1 2027 · Period end September 30, 2026 · Reported October 28, 2026
KLA’s fiscal Q1 2027 earnings call materially strengthened the case for sustained revenue and earnings growth through calendar 2027.
Download the one-page report (PDF)
View one-page exhibit
Download analysis (.md)
Download read-throughs (.md)
Post to X
One-Page Exhibit
Earnings Analysis
EXECUTIVE CALL SUMMARY: KLA Corporation (10/28/26)
KLA’s fiscal Q1 2027 earnings call materially strengthened the case for sustained revenue and earnings growth through calendar 2027. The most important developments were the increase in expected 2H 2026 revenue growth over 1H to approximately 25% from 20%, an initial expectation that the 2027 wafer equipment market will exceed $200 billion, and management’s explicit expectation that KLA can outgrow that market. September revenue reached $4.136 billion, adjusted operating margin reached a record 46.1%, and December guidance implies another 13.6% sequential revenue increase with an adjusted operating margin of approximately 47.4%. The earnings trajectory is increasingly supported by actual shipment capacity rather than demand commentary alone.
The investment conclusion is constructive on the business but more selective on the stock. Existing exposure is supported by improving earnings visibility, strengthening process control intensity, and unusually strong operating leverage. At the supplied $158.77 share price, however, a substantial growth premium remains embedded. The shares trade at approximately 27.6x annualized December guided EPS, while trailing free cash flow represents only approximately 1.9% of market capitalization. Maintaining an existing position or establishing limited initial exposure is more attractive than immediately adopting a maximum-sized position. Incremental purchases become more compelling around $145 to $150, provided the demand and shipment outlook remains intact.
Several qualifications materially affect the interpretation of the results. September’s sequential revenue increase was heavily concentrated in China: reported regional percentages imply that China accounted for approximately 95% of the consolidated sequential revenue increase, while revenue outside China was approximately flat. December guidance therefore requires a substantial acceleration outside China. Free cash flow was a quarterly record but approximately 23% below the Bloomberg consensus supplied with the earnings notice. Gross margin remains constrained by memory input costs despite rising shipment volumes, with meaningful recovery increasingly positioned for 2H 2027 and potentially 2028. Finally, a Q&A statement suggesting that memory could represent approximately 60% of the business in 2027 lacks a sufficiently clear denominator to support a definitive revenue model.
The central positive development is the convergence of a larger equipment market, increasing inspection intensity, and improving KLA supply availability. The central investment risk is that a premium valuation is being supported by a multiyear capacity expansion whose revenue recognition depends on customer cleanroom readiness, power availability, specialized optical components, and the durability of AI-related capital spending. The call supports higher earnings expectations more convincingly than it supports an unrestricted valuation multiple expansion.
REPORTING BASIS AND COMPARABILITY
The September quarter is fiscal Q1 2027, while the December outlook is fiscal Q2 2027. Management explicitly stated that full-year references on the call refer to calendar years. Financial results and guidance are discussed on a non-GAAP basis unless otherwise specified.
KLA completed a 10-for-1 stock split effective June 11, 2026. The October and July earnings releases retrospectively adjust historical EPS and share counts. Consequently, September adjusted EPS of $1.22 is directly comparable with June EPS of $1.05 and September 2025 EPS of $0.88. Older investor-day EPS targets require normalization: the March 2026 target of $84 corresponds to $8.40 on the current share basis.
The supplied Bloomberg earnings notice identifies September revenue consensus as $4.04 billion. That is the appropriate benchmark for the reported quarter. The repeated transcript header instead shows “Current Quarter” sales of $4.518 billion and EPS of $1.354 without an explicit period or snapshot timestamp. Those figures should not be treated as September expectations, because doing so would incorrectly characterize a revenue beat as a miss. If they represent December expectations, the December guidance midpoints exceed them by 4.0% for revenue and 6.4% for EPS. Those comparisons remain conditional on period alignment. The supplied notice does not provide a matched September adjusted EPS consensus.
QUARTERLY PERFORMANCE AND QUALITY OF THE BEAT
September revenue of $4.136 billion increased 13.1% sequentially and 28.9% year over year. Revenue exceeded the prior $4.0 billion guidance midpoint by $136 million, or 3.4%, and the supplied $4.04 billion Bloomberg consensus by approximately $96 million, or 2.4%. The result remained within the prior $3.8 billion to $4.2 billion guidance range. The distinction matters: execution was strong, but the reported quarter was an above-midpoint outcome rather than a result exceeding management’s entire revenue range.
Adjusted EPS of $1.22 exceeded the prior $1.16 midpoint by 5.2%, while GAAP EPS of $1.18 exceeded the prior $1.14 midpoint by 3.5%. Adjusted EPS increased 16.2% sequentially and 38.6% year over year. Adjusted net income increased 15.7% sequentially and 37.4% year over year to $1.603 billion. The slightly stronger EPS growth reflects a modest reduction in diluted shares, not a predominantly financial-engineered earnings outcome. Diluted weighted-average shares declined approximately 1.0% year over year and 0.3% sequentially.
The revenue surprise was predominantly equipment-driven. Product revenue reached $3.285 billion, increasing 33.3% year over year and exceeding the supplied $3.19 billion consensus by approximately 3.0%. Service revenue reached $850.5 million, increasing 14.2% and exceeding the $843.6 million estimate by 0.8%. Products contributed approximately 89% of the year-over-year revenue increase and 94% of the sequential increase. The acceleration therefore reflects a stronger capital-equipment shipment cycle, with services providing a growing but proportionately smaller stabilizing contribution.
The operating-profit bridge indicates that the beat was principally volume-driven. The prior guidance assumptions of $4.0 billion revenue, 62.5% gross margin, and $690 million operating expenses implied approximately $1.810 billion of adjusted operating profit. Actual adjusted operating profit was approximately $1.905 billion. Of the approximately $95 million outperformance, roughly $85 million can be attributed to additional revenue at the guided gross margin, approximately $8 million to gross-margin outperformance, and approximately $2 million to lower operating expenses. This is a relatively clean operating beat.
Tax contributed little to the upside versus guidance. The adjusted effective tax rate was approximately 14.1%, modestly below the 14.5% planning assumption, contributing approximately $0.005 per share relative to that assumption. Conversely, adjusted net other expense of approximately $38 million was higher than the $25 million planning assumption. The reported earnings improvement was therefore not dependent on an unusually favorable below-the-line outcome.
Sequential earnings comparisons are particularly credible because the June adjusted tax rate was approximately 12.4%. September earnings increased despite the normalization of that rate toward the long-term planning assumption. Operating improvement was stronger than the net-income growth rate alone suggests.
The GAAP-to-adjusted reconciliation remains relevant. September adjusted earnings exclude approximately $43 million of acquisition-related charges, together with specified tax adjustments, including approximately $20 million of Pillar Two undertaxed profits rule taxes. KLA expects the latter taxes to be temporary and to reverse following adoption of applicable safe-harbor provisions. That expectation should not be treated as equivalent to an already realized cash recovery. Importantly, stock-based compensation remains included in the presented adjusted operating results.
REVENUE COMPOSITION: STRONG CORE PROCESS CONTROL, LESS UNIFORM BREADTH
Semiconductor Process Control revenue, including associated services, reached $3.754 billion, increasing 15.3% sequentially and 29.5% year over year. This segment accounted for approximately 91% of consolidated revenue and more than the entire consolidated sequential revenue increase because Specialty Semiconductor Process revenue declined. The quarter’s acceleration was therefore concentrated in KLA’s core franchise rather than evenly distributed across all businesses.
Wafer inspection systems revenue increased 19% sequentially and 37% year over year, representing approximately 51% of consolidated revenue. This is a meaningful improvement from the June quarter, when wafer inspection growth was 2% sequentially and 1% year over year. Patterning systems, including metrology and reticle inspection, increased 18% sequentially and 29% year over year and represented approximately 21% of revenue. The improvement in wafer inspection is particularly consistent with management’s explanation that specialized component availability had previously constrained shipments.
Specialty Semiconductor Process revenue of $139.5 million declined 12.7% sequentially but increased 16.5% year over year. PCB and Component Inspection revenue of $242.2 million was approximately flat sequentially and increased 27.8% year over year. These businesses are participating in the broader electronics investment cycle, but their current contribution should not be overstated. Management expects sequential growth to resume in Specialty Semiconductor Process during December.
The distinction between reportable segments and product categories is important. The reportable segment figures include associated services, whereas the systems-only product disclosures exclude those services. Consequently, the 43% year-over-year growth cited for PCB and component inspection systems is not inconsistent with the approximately 28% growth of the broader reportable segment.
THE GEOGRAPHIC BRIDGE IS A MATERIAL QUALIFICATION
The shareholder letter reports September regional revenue of 34% China, 25% Taiwan, 15% North America, 12% Korea, 5% Rest of Asia, 5% Europe, and 4% Japan. China’s share increased from 26% in June.
Applying those rounded regional percentages to reported revenue implies approximately $1.41 billion of China revenue in September versus approximately $951 million in June. The approximately $455 million increase represents roughly 95% of the company’s $478 million sequential revenue increase. Revenue outside China increased only approximately 0.9%. These calculations are approximate because the regional percentages are rounded, but the concentration is too large to dismiss as rounding noise.
This does not invalidate management’s leading-edge demand commentary. Geography is not a direct measure of technology node, end application, or ultimate customer demand. It does demonstrate that the September financial acceleration was not yet a geographically broad-based realization of the expected global leading-edge expansion. The December quarter is the more important test of that proposition.
Management expects China’s December revenue share to decline toward 27% to 29%. At the $4.7 billion consolidated revenue midpoint, that implies approximately $1.27 billion to $1.36 billion of China revenue, below September’s implied level. Revenue outside China would therefore need to increase approximately 22% to 26% sequentially. At a 28% China mix, the implied non-China increase is approximately 24%.
The December guide is consequently more demanding than a simple continuation of September’s growth rate. It requires the shipment acceleration to shift geographically while consolidated revenue continues increasing. That is a favorable signal if achieved, but it makes customer acceptance schedules and regional installation readiness especially important near-term indicators.
GUIDANCE REVISION: MORE THAN A COMPLETED-QUARTER BEAT
December revenue guidance is $4.7 billion, plus or minus $200 million. The midpoint implies 13.6% sequential growth, with the range implying approximately 8.8% to 18.5% growth. Adjusted EPS guidance is $1.44, plus or minus $0.11, implying 18.0% sequential growth at the midpoint. GAAP EPS guidance is $1.41, plus or minus $0.11.
The most useful comparison with prior guidance is the calendar-half framework. In July, management expected 2H 2026 revenue to be approximately 20% above 1H. That expectation was reiterated at the September Goldman Sachs conference. The October call raised the expected increase to approximately 25%.
March and June revenue imply approximately $7.07 billion of 1H 2026 revenue. September actual revenue plus the December midpoint imply approximately $8.84 billion for 2H, or 24.9% growth over 1H. The resulting calendar 2026 revenue implication is approximately $15.91 billion. This is a mechanical implication of quarterly results and guidance, not an additional formal annual revenue forecast.
The previous 20% half-over-half framework implied approximately $8.49 billion of 2H revenue. The new quarterly combination is approximately $349 million higher. Approximately $136 million of that increase has already been delivered through September revenue above the prior midpoint. The remaining approximately $213 million represents a stronger December implication relative to the earlier framework.
That distinction is important. The improved 2H outlook is not merely the arithmetic incorporation of a completed-quarter beat. A majority of the increase represents a stronger remaining-quarter outlook. Because the earlier 20% framework was approximate and did not constitute standalone December guidance, the approximately $213 million figure should be viewed as an analytical bridge rather than a formal guidance revision.
The prior July operating-expense outlook contemplated increases of approximately $15 million to $20 million sequentially over the following quarters. December’s $710 million guide is approximately $22 million above September actual expenses, broadly consistent with that investment trajectory. The much stronger revenue outlook, rather than a reversal of investment plans, is driving the improved profitability implication.
WAFER EQUIPMENT OUTLOOK AND THE 2027 GROWTH FRAMEWORK
KLA raised its calendar 2026 wafer equipment market expectation, including advanced packaging, from the low-$150 billion range to the mid-$150 billion range. The previous low-$150 billion view remained in place at the September Goldman Sachs conference. The October update is therefore an incremental upward revision, although the qualitative ranges do not support an exact percentage increase.
The more consequential statement was the expectation that the market will exceed $200 billion in calendar 2027. Using $155 billion as an illustrative interpretation of the 2026 midpoint implies growth above approximately 29%. The analyst questions characterized the opportunity as roughly 30% or low-to-mid-30% growth. Those descriptions are reasonable directional interpretations, but management did not provide a bounded 2027 industry range.
Wallace’s clearest company-specific statement was: “So we think we can outgrow next year, Tim.”
That statement meaningfully strengthens the relative-growth proposition. It does not, however, constitute formal consolidated revenue guidance, an EPS forecast, or a quantified market-share commitment. KLA’s consolidated revenue includes services and businesses outside the equipment market denominator. Services growing near 15% would dilute a systems growth rate above approximately 30%, so consolidated growth need not mechanically equal the expected systems outperformance.
Management expects sequential revenue growth for the next several quarters, with a more linear progression than the pronounced 2H 2026 acceleration. That implies a stronger 2H 2027 than 1H under the current outlook, but not another 25% half-over-half increase. Annual growth can remain very strong with moderate sequential increases because December establishes a much higher starting revenue level.
A key distinction is the source of potential outperformance. Part reflects structural increases in process control intensity. Part reflects the recovery of shipments previously constrained by supply. An improvement in KLA’s share of equipment spending during 2027 would therefore not necessarily represent competitive displacement alone. It could also reflect deferred revenue conversion and a more favorable mix of investment projects.
The prior-year assumption error is also informative. Management acknowledged that approximately 12 months earlier it had expected relatively flat 2026 conditions, with stronger growth occurring in 2027. Demand accelerated earlier than anticipated, leaving supply insufficient. This supports the explanation for current shipment catch-up, while also demonstrating that even unusually close customer relationships do not eliminate forecasting error.
DRAM AND HBM: A STRUCTURAL INTENSITY OPPORTUNITY WITH CYCLICAL AMPLIFICATION
The semiconductor-customer systems mix moved from approximately 79% foundry/logic and 21% memory in June to 72% and 28%, respectively, in September. December guidance shifts the mix further to approximately 60% foundry/logic and 40% memory. Within December memory revenue, DRAM is expected to represent approximately 84% and NAND 16%.
On the applicable semiconductor-customer systems denominator, that implies DRAM at approximately 33.6% and NAND at approximately 6.4%. These percentages cannot properly be multiplied by consolidated revenue or even total Semiconductor Process Control segment revenue because those broader revenue measures include services and other customer populations.
The DRAM opportunity combines greenfield fab construction, more complex device architectures, higher performance requirements, and greater economic value from yield improvement. Greenfield facilities require a fuller equipment installation than incremental brownfield conversions and provide opportunities to establish more advanced inspection practices from the outset. HBM adds packaging, interconnect, and stack-level reliability requirements that increase the importance of identifying defects before additional value is committed to the manufacturing flow.
Management stated: “In some products, we see intensity levels in DRAM that are similar to leading-edge logic.”
The qualifier “in some products” is essential. This does not establish that overall DRAM process control intensity has converged with leading-edge logic across the entire manufacturing flow. It does suggest that selected applications are becoming materially more inspection-intensive than historical memory investment patterns would imply.
Higgins described the customer economics directly: “yield is equivalent to printing money in some ways.”
That captures the current value proposition. When memory supply is constrained and customer profitability is high, improving yield produces immediately monetizable output without requiring an entirely new fab. Inspection spending can therefore earn a particularly attractive return. The same logic also identifies a cyclical risk: if memory prices and customer profitability normalize, the economic urgency of incremental inspection spending can weaken even if the technical need persists.
The structural case should therefore be separated from the cyclical accelerator. More complex DRAM and HBM architectures support a durable increase in process control requirements. Exceptionally strong memory profitability can temporarily amplify the amount and timing of spending. Both are positive today, but they have different durability.
The transcript’s statement that memory could represent approximately 60% of the business in 2027 is potentially important but insufficiently specified. It does not clearly identify whether the denominator is semiconductor-customer systems revenue, a narrower business subset, or another measure. The written December guidance establishes a 40% memory mix for that quarter but does not resolve the 2027 statement. If 60% refers to the same systems population, it would represent a substantial concentration shift and a materially different risk profile. It should not be silently incorporated into a consolidated forecast.
Similarly, the analyst’s reference to approximately $450 million of December DRAM business should not be used as a verified revenue level. An alternative preliminary transcript renders the question as an increase of approximately $450 million. The supplied wording is ambiguous, and neither version constitutes company guidance. The defensible conclusion is a sharp DRAM shipment acceleration, not a precise dollar reconstruction.
ADVANCED PACKAGING: STRONGER CAPTURE OF VALUE, NOT A NEW 2026 FORECAST INCREASE
Advanced packaging process control systems revenue remains expected to reach approximately $1.1 billion in calendar 2026, increasing more than 70% year over year. Management described that growth as nearly 2x the advanced packaging market growth rate.
The $1.1 billion expectation was already provided in July, when it represented an increase from the prior high-50% growth outlook. October reaffirmed that level. It should therefore be characterized as continued execution against an already raised forecast, not an additional advanced packaging forecast increase.
The more important new information concerns product requirements. Packaging is increasingly incorporating front-end-like processes, with hybrid bonding and advanced logic integration pushing sensitivity requirements from micron-scale inspection toward approximately 100 nanometers. Macro inspection remains the volume workhorse, but management described growing use of laser scanning and selected Gen4 systems.
The economic implication is that KLA can increasingly deploy existing higher-end technology into a broader manufacturing application set. That expands potential revenue per advanced package without requiring a completely separate R&D platform for every new application. The July call had already emphasized reuse of the existing portfolio; the October discussion reinforced that the transition is extending into more demanding sensitivity requirements.
This supports both additional inspection steps and a richer equipment mix. It does not establish a quantified increase in pricing, market share, or operating margin. The call provided no competitive win-rate data or customer-level penetration statistics.
Advanced packaging also creates a margin nuance. Management explicitly indicated that greater advanced packaging and non-core process-control exposure can dilute consolidated gross margin. Thus, strong growth in strategically attractive markets can coexist with flat or lower corporate gross margins. Dollar gross profit and operating profit can still increase rapidly because existing R&D and infrastructure are being leveraged.
At approximately 7% of the mechanically implied calendar 2026 revenue base, the $1.1 billion advanced packaging systems business is meaningful but not yet the dominant driver of consolidated revenue. Its strategic importance exceeds its current revenue weight because it extends KLA’s relevance beyond conventional front-end wafer manufacturing. That revenue must not be added separately to total systems revenue because it is already included within the reported business.
LEADING-EDGE LOGIC AND THE INSPECTION VALUE PROPOSITION
Management expects 2027 investment to include more 2-nanometer capacity, continued 3-nanometer spending, and emerging investment at 1.4 nanometers. That mix is more favorable for process control than a market dominated by established-node capacity additions.
The technical rationale extends beyond smaller dimensions. Large, high-value compute dies increase the economic cost of defects. Greater design diversity and faster product introductions increase the need for process characterization and yield learning. More stringent performance requirements can increase sampling intensity even where nominal wafer capacity does not grow proportionately.
In simplified manufacturing economics, larger die area increases exposure to random defects at a given defect density. Advanced packaging can also compound losses when a defective constituent die or interconnect compromises a more valuable completed assembly. These dynamics strengthen the return on early defect identification and process monitoring.
Wallace highlighted the increasing relevance of “e-beam inspection capability and the linkage we have to our optical” and added that “it’s not as much share as it is adoption.”
That distinction is useful. Growth may arise from customers adopting new inspection capabilities and expanding the process-control budget, rather than simply transferring an unchanged inspection budget from competitors to KLA. Optical throughput and targeted e-beam characterization can be complementary. A broader integrated portfolio potentially improves the value of the overall workflow.
The call did not quantify node-to-node revenue intensity, pricing, or inspection-step additions. Nor did it establish a specific revenue contribution from 1.4-nanometer production during 2027. The appropriate conclusion is a favorable directional technology mix, with the scale and timing of monetization still dependent on customer qualification and capacity deployment.
GROSS MARGIN AND OPERATING LEVERAGE
September adjusted gross margin was 62.7%, modestly above the 62.5% guidance midpoint and approximately 30 basis points above June. Adjusted operating margin increased approximately 240 basis points sequentially to 46.1%, reflecting much stronger leverage below gross profit.
Adjusted operating expenses were approximately $688 million, versus approximately $682 million in June. R&D was $395 million, down slightly sequentially and up approximately 9.6% year over year. Adjusted SG&A was approximately $293 million. Revenue increased 13.1% sequentially while total operating expenses increased less than 1%.
The resulting sequential incremental operating margin was approximately 64%, while the year-over-year incremental operating margin was approximately 56%. Both exceeded the long-term 40% to 50% framework. The operating-margin achievement is therefore substantial, but it also reflects a particularly favorable near-term relationship between shipment growth and expense growth that should not be extrapolated indefinitely.
December guidance implies approximately $2.938 billion of gross profit and $2.228 billion of adjusted operating profit after $710 million of operating expenses. The resulting operating margin is approximately 47.4%, roughly 130 basis points above September. That would exceed the upper end of the original 45% to 47% 2030 operating-margin target range on a quarterly basis.
The December midpoint implies approximately 57% incremental operating margin and approximately 61% incremental gross margin relative to September. This illustrates why the 20-basis-point guided decline in gross margin does not prevent meaningful operating-margin expansion. Revenue is growing much faster than operating expenses.
Management’s 40% to 50% incremental operating-margin framework should not be confused with an absolute operating-margin ceiling. Management indicated that strong growth environments can produce incremental margins at or above the upper end. Conversely, at an existing operating margin above 46%, a future incremental margin of only 40% would mathematically dilute the absolute margin. Continued expansion requires incremental profitability above the existing corporate margin.
The major gross-margin constraint remains memory used in image processing. This creates an important economic asymmetry: the same strong memory market that stimulates customer equipment demand raises KLA’s own system input costs.
Management stated that “it’s very difficult to go increase prices when you have a deal in place on existing business and existing backlog.”
The backlog therefore provides shipment visibility but not immediate pricing flexibility. Input inflation can affect existing orders before price increases can be embedded in new contracts or new product offerings. Pricing recovery is likely to be gradual rather than an immediate surcharge applied across the installed order book.
KLA is addressing the pressure through memory-efficiency engineering, broader product cost reduction, and value-based pricing on new capabilities. Wallace noted that “nobody really imagined the kind of increase in memory costs” when the systems were designed. That statement confirms that some current cost pressure reflects architecture choices made under different component-price assumptions.
Management expects improvement as 2027 progresses, with stronger consistency with the 63% to 64% gross-margin model around the middle to later part of 2027 and into 2028. Process Control margins could trend back toward the mid-60% range in 2H 2027 on a consistent mix. These are directional expectations, not a formal quarterly margin schedule.
The proper modeling approach is to separate volume leverage, product mix, component costs, pricing, and engineering savings. Assuming that every incremental revenue dollar will arrive at a structurally higher gross margin would overstate near-term earnings power.
SUPPLY, BACKLOG, AND CUSTOMER READINESS
Average product lead times are approximately 12 months and extending at the margin, with Gen4 and Gen5 systems potentially longer. KLA has worked with strategic suppliers for approximately 12 months to expand capacity, particularly in long-lead optical components.
The distinction between component availability and internal factory capacity is central. Management believes that staffing, shifts, applications support, and internal facility utilization can generally be expanded within the lead-time window imposed by specialized components. The external optical supply chain, rather than ordinary assembly capacity, determines the practical shipment ceiling.
Management emphasized that the critical optical components do not typically compete directly with other equipment suppliers’ requirements. That limits exposure to some industry-wide procurement competition, but it does not eliminate supplier concentration or manufacturing-yield risk. Specialized components can be difficult to substitute even when competing demand is limited.
The company continues to describe demand as exceeding supply. December guidance is nevertheless based on expected shipments rather than unconstrained demand. That makes the guide operationally grounded, while also limiting the ability to translate every incremental customer request into immediate revenue upside.
The backlog discussion is positive but less quantitative than the language may suggest. At the September conference, management referenced more than $12 billion of backlog disclosed with the annual filing. The October call emphasized further backlog growth and unprecedented sales-funnel visibility but did not provide a new backlog balance, cancellation profile, or detailed recognition schedule. A sales funnel is not equivalent to contracted backlog, and backlog is not equivalent to guaranteed revenue.
Customer readiness introduces another independent constraint. Wallace described customers requesting equipment that they subsequently could not accept because their facilities were delayed. Cleanroom construction, materials, power, and coordination across the equipment supply chain can all determine when an order becomes recognizable revenue.
Management’s statement that “our motto is we’re not going to be the constraint” describes an operating objective rather than proof that every customer project can proceed on schedule.
The suggestion that bottlenecks may prolong the investment cycle is plausible. Constrained additions can spread demand across more periods and reduce near-term overcapacity. The countervailing risk is that delays defer earnings, consume working capital, and create opportunities for capital budgets to change before delivery. A longer cycle is beneficial only if the underlying demand remains intact and orders ultimately convert at acceptable margins.
SERVICES: HIGH-QUALITY GROWTH, BUT NOT ENOUGH TO REMOVE CYCLICAL EXPOSURE
Service revenue increased 14.2% year over year to $850.5 million and approximately 3.7% sequentially. The business remains supported by installed-base growth, longer tool lives, higher utilization, and the rising value of system performance and availability.
The current shareholder letter expects calendar 2026 service growth near the upper end of the 13% to 15% model. That is firmer than the July call’s characterization of the current-year growth rate near the lower end. For 2027, management again indicated that performance toward the upper end of the model is reasonable.
The service business offers meaningful visibility. The investor-day materials indicate that more than 80% of service revenue comes from multiyear subscription-type contracts. Longer tool lives extend the duration of monetization, while more complex systems can support higher service value per tool.
There are nevertheless timing and mix limitations. New systems do not immediately produce a fully mature service revenue stream. Installed-base expansion, contractual arrangements, and system aging affect the conversion from equipment shipments to service revenue.
Moreover, services represented approximately 20.6% of September revenue, down from 22.4% in June and 23.2% a year earlier. The absolute service business is strengthening, but equipment is growing faster. KLA’s revenue mix is therefore becoming more sensitive to the equipment cycle during the current acceleration, even as recurring revenue expands.
FREE CASH FLOW: RECORD ABSOLUTE GENERATION, MATERIAL EXPECTATION SHORTFALL
Operating cash flow was $1.531 billion, increasing 31.8% year over year. Capital expenditures were $194.8 million, producing free cash flow of $1.336 billion. Free cash flow increased 25.4% year over year and 63.5% sequentially, representing a 32.3% revenue margin and 83.4% conversion of adjusted net income.
Those are strong absolute results. They nonetheless fell approximately $394 million, or 22.8%, below the supplied $1.73 billion Bloomberg consensus. Capital expenditure was approximately $93 million above the $101.4 million estimate, explaining only about 24% of that shortfall. The land purchase in India therefore cannot explain the entire cash-flow miss.
If the supplied free-cash-flow and capital-expenditure estimates are treated as mutually compatible, they imply expected operating cash flow of approximately $1.831 billion. Actual operating cash flow was approximately $300 million lower. Because consensus components can reflect different contributor sets, that bridge is approximate, but it clearly indicates that the shortfall extended beyond capital spending.
Inventory absorbed approximately $434 million of cash, while receivables absorbed approximately $179 million. The balance-sheet inventory position increased to $4.09 billion from $3.65 billion in June. These investments are consistent with a company preparing for higher shipment volumes and managing long-lead components, but their ultimate quality depends on timely delivery and customer acceptance.
The working-capital picture should not be described as uniformly negative. Other assets released approximately $177 million of cash, accounts payable contributed approximately $117 million, and other liabilities contributed approximately $222 million. Net disclosed asset and liability movements absorbed approximately $165 million, compared with approximately $128 million a year earlier. Large inventory investment was therefore partly financed by other balance-sheet movements.
Cash taxes were approximately $61 million, compared with a GAAP income-tax provision of approximately $275 million. That difference does not establish a permanent tax benefit because cash payments and expense recognition relate to different timing and tax positions. It does show that current operating cash generation benefited from relatively low tax cash payments.
The trailing cash-flow record is less buoyant than the latest-quarter headline. Trailing 12-month free cash flow was approximately $4.04 billion, only 4.1% above the prior comparable period. Investment in growth is a credible explanation for weaker conversion, but sustained earnings growth should ultimately be accompanied by stronger cumulative cash realization.
Capital expenditure represented 4.7% of September revenue, elevated by the India land purchase. Management expects annual spending of approximately $600 million to $800 million over the next several years. At an illustrative $21 billion revenue level, that would equal approximately 2.9% to 3.8% of revenue. The original 2% to 3% framework therefore should not be applied mechanically to every near-term year while facilities are being expanded.
BALANCE SHEET AND CAPITAL ALLOCATION
KLA ended September with approximately $4.74 billion of cash, cash equivalents, and marketable securities. Bond principal outstanding was approximately $5.95 billion, implying approximately $1.21 billion of net debt on that basis. The balance-sheet carrying amount of debt was lower, approximately $5.72 billion, because of issuance discounts, costs, and fair-value adjustments. Those measures should not be mixed.
The debt profile is favorable, with a weighted-average maturity of approximately 17.8 years and investment-grade ratings. Liquidity and near-term refinancing are not the principal constraints on the growth plan.
The company returned approximately $1.24 billion to shareholders, including $936 million of repurchases and $305 million of dividends. Those returns represented approximately 93% of quarterly free cash flow, consistent with the long-term objective of returning more than 90%.
A further cash consideration is the approximately $239 million of tax withholding payments associated with vested equity awards, classified within financing cash flow and excluded from company-defined free cash flow. Subtracting those payments from reported free cash flow leaves approximately $1.10 billion before dividends and repurchases. On that broader cash basis, shareholder returns exceeded internally generated cash by approximately $143 million during the quarter.
This does not indicate a liquidity problem, nor should award withholding be treated as a second deduction of current-period compensation expense. It does mean that reported free cash flow overstates the cash remaining after all equity-related cash settlements. The withholding amount may also be volatile and should not be assumed to recur at the same level every quarter.
Repurchases are supportive but not transformative at the current valuation. The guided diluted share count of 1.306 billion is approximately 0.4% below September’s weighted-average count. The near-term EPS contribution from share reduction is modest relative to the operating growth contribution. Capital allocation should therefore be evaluated principally on repurchase price and long-term earnings durability rather than on the existence of a large authorization.
CHINA, LEGACY NODES, AND THE DIVERSIFICATION QUESTION
Management expects China to represent approximately 27% to 29% of calendar 2026 revenue and to decline toward the low-20% range in 2027. China revenue could still grow modestly in absolute terms while its share declines because the rest of the business is expected to grow substantially faster.
An illustrative $21 billion calendar 2027 revenue case with a 22% China mix would imply approximately $4.62 billion of China revenue. Against an illustrative 2026 base of $15.91 billion with 28% China exposure, that represents only approximately 4% China growth but approximately 43% growth outside China. The declining geographic share is therefore primarily a denominator-growth thesis, not necessarily an absolute retreat from China.
A lower China share would reduce relative exposure to export-control and regional spending risks. It would not eliminate those risks, and stronger exposure to leading-edge logic, DRAM, and advanced packaging still concentrates the company around a common AI infrastructure capital-spending driver.
Management described some improvement in power, industrial, automotive, and other legacy-oriented markets, but explicitly expected their growth to lag the leading edge. Process control intensity is generally lower at established nodes unless design changes or reliability requirements create new inspection needs.
Legacy recovery is therefore a potential incremental contributor rather than the foundation of the 2027 growth thesis. The call did not provide the requested precise percentage of KLA’s systems business tied to mature and specialty applications. A fully quantified diversification claim is not supported.
THE 2030 MODEL: EARLIER INDUSTRY SCALE DOES NOT AUTOMATICALLY ACCELERATE EVERY TARGET
The March investor-day presentation established a 2030 revenue target of $26 billion, plus or minus $2.5 billion; gross margin of approximately 63.5%, plus or minus 50 basis points; operating margin of 45% to 47%; and split-adjusted EPS of approximately $8.40, plus or minus $0.80.
The written market assumption was $215 billion of wafer equipment spending, plus or minus $20 billion. The October call referred to approximately $220 billion, plus or minus $20 billion. That small difference in recollection should not be treated as a formal revision of the model.
The current expectation of more than $200 billion in 2027 approaches the industry scale previously associated with 2030. It does not imply that KLA will achieve $26 billion of revenue in 2027. The original model also required installed-base-driven service growth, expansion in adjacent businesses, and a larger share of equipment spending.
Management referenced KLA’s share of the overall equipment market increasing from approximately 7.5% in 2025 toward 9%. At a fixed $200 billion equipment market, that 1.5-percentage-point increase represents approximately $3 billion of additional equipment revenue opportunity. Achieving the larger market size without the anticipated share and intensity gains would therefore leave a material gap to the full target.
The service component also cannot be accelerated solely by a larger equipment market in a single year. It depends on cumulative installed-base development and the evolution of service revenue per system.
Wallace stated that “the assumptions in that model are going to be exceeded before 2030.” That supports the possibility of earlier attainment of important elements, not an assertion that every financial target has been brought forward to 2027.
The analyst’s reference to a possible $300 billion equipment market was not adopted as guidance. Management declined to provide a new 2030 market number. Likewise, no formal 2028 revenue or industry forecast was provided. Those possibilities belong in upside scenarios, not the central forecast.
VALUATION AND PROBABILITY-WEIGHTED INVESTMENT CASE
At $158.77 and the supplied approximately $207.44 billion market capitalization, valuation requires continued earnings growth rather than merely maintenance of current profitability. Annualizing December’s $1.44 EPS midpoint produces $5.76 and a 27.6x multiple. That annualization is a run-rate reference, not a full-year forecast.
The supplied “Current Year” EPS estimate of $5.509 implies 28.8x earnings, while the $18.23 billion sales estimate implies approximately 11.4x sales. Because the exact estimate period is not identified, those metrics are valuation references rather than fully aligned forward comparisons. Trailing free cash flow yields approximately 1.9%; annualizing September’s record quarterly free cash flow increases the yield only to approximately 2.6%.
An illustrative 12-month scenario framework supports positive but not overwhelming expected returns. The following cases are analytical assumptions rather than management guidance. They use calendar 2027 revenue and earnings, $100 million of annual net other expense, a 14.5% tax rate, and approximately 1.295 billion diluted shares. The valuation multiples incorporate different assumptions about durability and investor confidence.
The base case, assigned a 50% probability, assumes approximately $21 billion of revenue, representing 32% growth from the mechanically implied calendar 2026 base. Gross margin of approximately 63% and operating expenses of approximately $2.94 billion produce a 49% operating margin. Adjusted EPS is approximately $6.73. A 27x multiple produces a value of approximately $182 per share, or 14% upside from $158.77. This case requires successful non-China shipment acceleration, continued growth in memory and advanced packaging, and partial gross-margin recovery during 2027.
The bull case, assigned a 25% probability, assumes approximately $23 billion of revenue, or 45% growth, with gross margin of approximately 63.5% and operating margin of 50.5%. Adjusted EPS reaches approximately $7.60. A 31x multiple produces approximately $236 per share, or 48% upside. This outcome requires stronger-than-base industry spending, sustained process-control outperformance, smooth supply conversion, and a valuation premium supported by confidence in growth beyond 2027.
The bear case, assigned a 25% probability, assumes approximately $18.5 billion of revenue, or 16% growth, with gross margin of approximately 62% and operating margin of 45.5%. Adjusted EPS is approximately $5.49. A 22x multiple produces approximately $121 per share, or 24% downside. This case does not require an outright collapse in semiconductor spending. Delayed fabs, weaker shipment conversion, persistent input inflation, and a more normal valuation multiple would be sufficient. Revenue below the annualized December midpoint would imply some sequential weakening during 2027.
These scenarios produce a probability-weighted value of approximately $180, or 13% price upside before dividends. At $164, the preliminary post-market price cited in the Bloomberg notice, the same expected value implies approximately 10% upside. The notice’s reported trading volume of 4,582 shares is too small to establish a robust post-earnings equilibrium price.
The distribution supports maintaining exposure but argues against treating the call as an automatic invitation to maximize position size. The base-case return is meaningful but smaller than the modeled bear-case loss, while the probability-weighted outcome depends materially on the bull case.
Earnings sensitivities further clarify the debate. At $21 billion of annual revenue, a 100-basis-point operating-margin change affects annual EPS by approximately $0.14 under the stated assumptions. An additional $100 million of revenue at a 50% incremental operating margin contributes approximately $0.033 per share. Shipment timing across several hundred million dollars can therefore outweigh modest quarterly changes in tax or share count.
CATALYSTS, POSITION IMPLEMENTATION, AND THESIS INVALIDATION
The next major catalyst is the late-January 2027 earnings call. It should provide a more detailed 2027 industry and customer-segment outlook, evidence on December shipment execution, and an opportunity to clarify the memory mix statement. The most important operating confirmation would be delivery of the implied non-China acceleration alongside continued growth in total revenue.
During 1H 2027, the focus should be on sequential shipment progression, optical-component availability, inventory conversion, and whether customer facilities are accepting equipment on schedule. During 2H 2027, the key additional test is whether pricing and memory-efficiency engineering begin producing measurable gross-margin improvement.
A disciplined implementation would retain existing exposure or limit a new position near $158.77 to approximately 1% of portfolio NAV. Additions around $145 to $150 would offer a more attractive expected return if the fundamental outlook remains intact. A maximum position near 2% of NAV would be more appropriate after confirmation of the December geographic transition and the January outlook.
A 15% decline from the weighted entry price should trigger a mandatory exit or a documented reassessment supported by new evidence, rather than passive reliance on the long-term industry narrative. At a 2% position, that represents approximately 30 basis points of planned portfolio loss, although gaps can produce larger losses. A move toward the approximately $182 base-case value without corresponding earnings upgrades would support trimming. Prices approaching the bull-case value would require evidence materially stronger than the current central assumptions.
Fundamental invalidation would include repeated failures to convert backlog into shipments, a material reduction in the 2027 industry outlook, loss of KLA’s relative-growth advantage despite improving supply, or continued inventory accumulation without commensurate revenue conversion. Persistent gross margins below approximately 62% after the expected 2H 2027 recovery window would challenge the pricing and engineering mitigation thesis. These are analytical review thresholds, not management guidance.
Portfolio construction should recognize that KLA is not independent diversification from an existing concentration in AI accelerators, leading-edge foundries, HBM suppliers, and other semiconductor equipment companies. The revenue streams differ, but much of the marginal spending ultimately traces to the same infrastructure investment cycle. The service franchise and strong balance sheet improve resilience without eliminating that common factor. Portfolio-specific correlation and concentration cannot be quantified without the underlying holdings.
The decisive investment question is whether KLA can convert the current visibility into sustained revenue growth, improving gross margins, and stronger cumulative cash conversion before the market begins discounting a normalization of equipment spending. This quarter improved the probability of that outcome. It did not remove the execution, concentration, and valuation risks required to achieve it.
COMPANY EMPLOYEES ON THE CALL
• Richard “Rick” Wallace, President, Chief Executive Officer and Executive Director. • Bren Higgins, Executive Vice President and Chief Financial Officer. • Kevin Kessel, Vice President of Investor Relations and Market Analytics.
Several passages are labeled “Unidentified Speaker.” Those labels do not establish an additional company participant beyond the named executives.
RESEARCH ANALYSTS ON THE CALL
• Jim Schneider, Goldman Sachs. • Harlan Sur, JPMorgan. • C.J. Muse, Cantor Fitzgerald. • Timothy Arcuri, UBS. • Krish Sankar, TD Cowen. • Stacy Rasgon, Bernstein Research. • Joseph “Joe” Quatrochi, Wells Fargo. • Melissa Weathers, Deutsche Bank. • Christopher “Chris” Caso, Wolfe Research. • Shane Brett, Morgan Stanley. • Timm Schulze-Melander, Rothschild & Co Redburn, rendered phonetically in the supplied transcript.
Key Read-Throughs
KEY READ-THROUGHS FROM KLA CORPORATION’S Q1 2027 EARNINGS CALL
KLA’s October 28, 2026 call strengthens the evidence for a multiyear semiconductor investment cycle, but the most actionable implications concern the distribution and timing of profits rather than a uniform improvement across technology. Persistent memory inflation benefits memory manufacturers while raising costs for equipment and hardware producers. Greenfield DRAM investment and increasingly complex logic and packaging architectures support higher equipment spending per unit of production capacity. However, longer equipment lead times and delayed customer facilities mean that stronger equipment demand does not translate immediately into additional semiconductor output. Several peers had already disclosed similarly strong conditions before KLA reported, making this call corroborating evidence rather than an entirely new sector catalyst. The highest-conviction implications are concentrated in memory, semiconductor equipment, advanced packaging, and computing hardware. Magnitude assessments below refer to fundamental business exposure, not predicted share-price movements.
MEMORY MANUFACTURERS
MEMORY PRICING STRENGTH EXTENDS BEYOND HBM, WHILE CAPACITY CONSTRAINTS DELAY NORMALIZATION (READ-THROUGH 1)
Affected companies: Micron Technology (MU: United States) and SK hynix (000660: South Korea).
Directional impact and magnitude: Positive, with high fundamental significance for memory profitability and earnings durability. The incremental trading significance is moderate because both companies had already disclosed strong pricing and constrained supply.
KLA provides unusually useful evidence from the purchasing side of the memory market. Management attributed December’s approximately flat gross-margin outlook, despite substantial revenue growth, to “persistently high memory costs for our system image processing requirements.” In the final Q&A exchange, management explained that stronger demand required additional purchases at higher prices and acknowledged continued exposure to market pricing. Wallace also stated that KLA is engineering systems to use less memory because “nobody really imagined the kind of increase in memory costs.”
The transmission mechanism is broader than accelerator HBM demand. Memory costs are sufficiently elevated to affect the economics and architecture of sophisticated industrial inspection systems. That supports the conclusion that pricing pressure extends into computing applications outside the most visible AI accelerator supply chain. For Micron and SK hynix, elevated realized prices support revenue and gross profit across their DRAM portfolios, subject to product mix and contractual pricing. KLA did not identify its memory vendors, so this is an industry pricing implication, not evidence of a specific supply award.
The equipment boom does not immediately invalidate the pricing thesis. KLA’s average lead times are approximately 12 months, with certain systems taking longer, and management identified customer facilities that cannot yet accept equipment. Equipment delivery must still be followed by installation, qualification, wafer processing, and yield improvement before meaningful additional supply becomes available. Consequently, a wafer equipment market above $200 billion in 2027 is not equivalent to an immediate surge in saleable memory bits.
This reinforces, rather than precedes, the memory producers’ disclosures. Micron’s September 30 prepared remarks described constrained industry supply through 2027 and 2028 and emphasized that new fabs take several quarters after initial output to contribute meaningfully. SK hynix’s October 28 release likewise cited long construction lead times and leading-edge process difficulty. KLA adds independent buyer-side confirmation that the shortage is economically consequential.
Near-term catalysts are late-2026 contract-pricing updates and subsequent quarterly margin guidance. The longer-duration implication is greater confidence in elevated memory profitability through the capacity expansion period. The principal qualification is that pricing strength does not establish permanent scarcity: efficiency improvements, eventual capacity additions, and weaker end demand remain normalization mechanisms.
FRONT-END SEMICONDUCTOR EQUIPMENT
GREENFIELD DRAM SPENDING SUPPORTS A BROADER EQUIPMENT CYCLE, BUT KLA IS CONFIRMING AN EXISTING INDUSTRY UPGRADE (READ-THROUGH 2)
Affected companies: Lam Research (LRCX: United States), Applied Materials (AMAT: United States), and ASML Holding (ASML: Netherlands).
Directional impact and magnitude: Positive, with high significance for 2027 equipment demand. The incremental near-term catalyst is more meaningful for Applied Materials’ forthcoming outlook than for peers that have already reported comparable expectations.
KLA raised its calendar 2026 wafer equipment outlook to the mid-$150 billion range and expects spending to exceed $200 billion in 2027. Using approximately $155 billion as an illustrative 2026 base implies growth above approximately 29%. Management highlighted greenfield DRAM facilities, broader leading-edge investment, and increasing process control intensity. The December mix forecast assigns approximately 40% of applicable semiconductor-customer systems revenue to memory, of which approximately 84% is DRAM.
Greenfield investment creates a broader equipment requirement than a limited upgrade of an existing line. Lam benefits through deposition and etch equipment used in DRAM fabrication and advanced packaging. Applied Materials participates through materials engineering, deposition, epitaxy, planarization, and related process-control applications. ASML benefits from lithography requirements associated with additional leading-edge capacity and technology migration. Higher process complexity can increase equipment spending even when wafer-start growth is less dramatic.
The competitive implication is not that every supplier inherits KLA’s expected outperformance. KLA’s growth incorporates inspection intensity and the recovery of supply-constrained shipments. Lam, Applied, and ASML have different product, customer, and geographic mixes. Nevertheless, simultaneous increases in deposition, etch, lithography, and inspection requirements can expand several equipment categories together without requiring a zero-sum transfer of spending.
The novelty assessment is important. Lam had already forecast a 2027 equipment market above $200 billion on October 21, with DRAM leading percentage growth. ASML’s October 14 release had already stated that planned supply would not fully meet customer demand in either 2027 or 2028. KLA therefore increases confidence in the breadth of the investment plans; it does not introduce a previously undisclosed industry spending threshold.
The geographic evidence adds a near-term qualification. KLA’s accompanying materials show China at 34% of September revenue versus 26% in June. Applying those rounded percentages implies that China contributed approximately 95% of KLA’s sequential revenue increase. December guidance, combined with management’s expected 27% to 29% China mix, instead requires approximately 22% to 26% sequential growth outside China. September should therefore not be treated as proof that the entire non-China equipment expansion has already converted into shipments.
Applied Materials’ November 12 earnings call is the clearest forthcoming trading catalyst, particularly its 2027 demand, manufacturing capacity, and DRAM commentary. For Lam and ASML, subsequent shipment and capacity updates matter more than another repetition of strong demand. The longer-duration positive is broad equipment demand through 2027 and beyond; the principal negative is that customer readiness and component availability can defer revenue despite strong order visibility.
NODE TRANSITIONS FAVOR TECHNOLOGY INTENSITY OVER GENERIC WAFER-CAPACITY EXPOSURE (READ-THROUGH 3)
Affected companies: ASM International (ASM: Netherlands) and ASML Holding (ASML: Netherlands).
Directional impact and magnitude: Positive, with high significance for ASM’s advanced logic business and substantial significance for ASML’s leading-edge portfolio. Immediate incremental trading impact is limited by the strength of both companies’ recent disclosures.
KLA expects more investment at 2 nanometers, continued spending at 3 nanometers, and emerging activity at 1.4 nanometers. Management linked the opportunity to high-performance computing designs, large and valuable dies, greater design diversity, and more demanding performance requirements. Wallace also highlighted increasing adoption of linked optical and e-beam inspection capabilities as designs shrink.
The important transmission mechanism is increasing process content per wafer, not merely additional wafer capacity. ASM’s atomic layer deposition and epitaxy capabilities address increasingly demanding materials and three-dimensional device requirements. ASML supplies the lithography infrastructure needed for advanced patterning. A shift toward more complex nodes can therefore support these companies even if cleanroom constraints limit the pace of physical capacity additions.
ASM’s October 27 release provides particularly strong corroboration. The company reported an initial meaningful revenue contribution from 1.4-nanometer investment and disclosed a solid double-digit increase in its served available market at 1.4 nanometers relative to 2 nanometers, alongside higher expected market share. KLA’s observations reinforce the customer investment environment underlying that company-specific opportunity.
This is not evidence that every 1.4-nanometer program reaches high-volume production in 2027. Equipment revenue can precede commercial chip output, and different process steps enter customer programs at different times. Nor does KLA’s call justify assigning a new near-term High-NA EUV revenue contribution to ASML; that requires ASML-specific shipment and adoption evidence.
For ASM, the near-term significance is increased confidence in the already announced 2027 revenue outlook above €5.7 billion, rather than an additional forecast increase. For ASML, the relevant catalysts are delivery capacity, product mix, and productivity upgrades during the following quarters. The longer-duration implication favors suppliers whose revenue opportunity expands with device complexity rather than depending solely on aggregate wafer starts.
INSTALLED-BASE EXPANSION CREATES A SECOND EARNINGS STREAM, BUT SERVICES ARE NOT IDENTICAL ACROSS SUPPLIERS (READ-THROUGH 4)
Affected companies: Lam Research (LRCX: United States), Applied Materials (AMAT: United States), and ASML Holding (ASML: Netherlands).
Directional impact and magnitude: Positive, with moderate near-term impact and substantial cumulative significance for revenue durability beyond the equipment installation cycle.
KLA reported service revenue of approximately $850 million, up 14% year over year, and attributed growth to a larger installed base, longer tool lifecycles, higher complexity, and customers’ focus on performance and availability. Management expects service growth toward the upper end of its 13% to 15% long-term framework.
The broader mechanism is that each wave of equipment installations creates future demand for maintenance, replacement components, software, calibration, and productivity improvements. When fabs operate at high utilization and semiconductor output is valuable, customers have stronger incentives to minimize downtime and improve equipment performance. Service spending can therefore benefit from both a larger equipment population and greater spending per installed system.
The same mechanism is relevant to Lam’s Customer Support Business Group, Applied Global Services, and ASML’s Installed Base Management business. It is already visible in peer results: ASML reported €3.3 billion of Installed Base Management revenue in Q3, above guidance because of strong demand for productivity upgrades. Lam also reported substantial customer-support growth before KLA’s call.
The distinction between recurring maintenance and equipment upgrades matters. These businesses contain different combinations of contracts, parts, upgrades, and equipment-related revenue. KLA’s service growth rate cannot be transferred directly to them, and an upgrade-led increase in customer wafer output does not necessarily require a proportional increase in new systems.
The near-term catalysts are service and upgrade disclosures in forthcoming quarterly results, including Applied’s November 12 report. The more durable benefit emerges during 2027 to 2029 as newly installed equipment generates follow-on revenue. This improves through-cycle earnings resilience, but it does not make the equipment sector noncyclical: service demand still depends on utilization, customer budgets, and the composition of the installed base.
ADVANCED PACKAGING AND PROCESS CONTROL
INSPECTION SPENDING CAN OUTGROW PACKAGING OUTPUT BECAUSE THE NUMBER AND DIFFICULTY OF CONTROL STEPS ARE RISING (READ-THROUGH 5)
Affected companies: Camtek (CAMT: Israel) and Onto Innovation (ONTO: United States).
Directional impact and magnitude: Positive, with high significance for the companies’ advanced packaging businesses. Company-wide magnitude is greater for more concentrated packaging exposure and cannot be inferred from KLA’s growth rate alone.
KLA expects approximately $1.1 billion of advanced packaging process control systems revenue in calendar 2026, increasing more than 70%, or nearly 2x the advanced packaging market’s growth. Management described packaging processes becoming more similar to front-end manufacturing and highlighted sensitivity requirements moving from micron-scale inspection toward approximately 100 nanometers.
The transmission mechanism combines more inspection locations, more demanding measurement requirements, and potentially higher equipment value per manufacturing step. Fine-pitch interconnects, redistribution layers, wafer warpage, surface preparation, and bonding defects increase the number of failure modes that must be controlled. Spending can therefore grow faster than package units or packaging capacity.
Camtek’s Hawk portfolio explicitly targets chiplets, HBM, and hybrid bonding, while its product roadmap includes increasingly demanding inspection and bump metrology. Onto’s Dragonfly G5 addresses advanced packaging, hybrid bonding, redistribution layers, TSV reveal, and microbumps. Its published capabilities include approximately 150-nanometer sensitivity and subsurface inspection for bonded structures. These are verified product exposures, not an assumption that KLA awards business to either company.
The positive conclusion is that customers are increasing the process-control budget attached to advanced packaging. The unsupported conclusion would be that Camtek and Onto must match KLA’s greater-than-70% growth. Different application mixes, qualifications, product availability, and competitive positions determine each company’s capture.
The timing also requires discipline. KLA’s $1.1 billion forecast was already established in July and was reaffirmed in October. Onto had already reported record advanced packaging activity in August. The incremental information is the continued strength of demand and migration toward more demanding applications, not the discovery of a new market.
Camtek’s November 4 and Onto’s November 9 results are direct trading catalysts. Order conversion, next-generation tool adoption, and 2027 visibility are more important than simply repeating that AI packaging demand is strong. The longer-duration positive is a structurally larger inspection and metrology requirement per advanced package.
KLA’S HIGHER-END PACKAGING ADOPTION CHALLENGES THE VALUATION CASE FOR PROTECTED SPECIALIST MARKETS (READ-THROUGH 6)
Affected companies: Camtek (CAMT: Israel) and Onto Innovation (ONTO: United States).
Directional impact and magnitude: Negative for assumptions of protected pricing or uncontested share gains in higher-end packaging inspection. Competitive significance is moderate and potentially material over time; no current revenue loss or quantified earnings reduction is established.
The same commentary that validates packaging inspection demand also identifies a competitive risk. KLA stated that packaging demand is moving “more towards higher-end systems,” with greater use of laser scanning and, in selected cases, Gen4 inspection. Management emphasized that it can leverage R&D already completed for advanced front-end platforms.
The transmission mechanism is expansion of the competing product set. Applications previously served mainly by packaging-focused systems increasingly require capabilities that large front-end process-control suppliers already possess. Reusing existing technology can allow KLA to address those applications without duplicating the full development cost of a new standalone platform. Existing customer relationships and familiarity with KLA’s inspection workflows can also help adoption.
For Camtek and Onto, the economic risk is not necessarily an immediate loss of installed business. It is that incremental high-value applications become more contested, requiring continued R&D, stronger application support, and demonstrated cost-of-ownership advantages. That can limit the margin expansion or valuation premium justified solely by rapid market growth.
The counterevidence is important. Both specialists already offer advanced products, including approximately 150-nanometer inspection capabilities, and their systems differ in throughput, measurement functions, and target applications. KLA’s approximately 100-nanometer discussion is not an apples-to-apples competitive benchmark. The call does not prove that either company is losing share, and growing markets can support all participants.
The high-conviction negative is therefore narrower than a bearish revenue forecast: higher-sensitivity packaging inspection is becoming a more competitive market, not a protected extension of historical macro-inspection positions. Camtek’s November 4 and Onto’s November 9 calls provide near-term opportunities to assess qualifications, product differentiation, and pricing. The fundamental effect is more likely to emerge through 2027 and 2028 platform selections than through an immediate quarterly revenue decline.
HYBRID BONDING BENEFITS COMPLEMENTARY EQUIPMENT SUPPLIERS, BUT ADOPTION AND REVENUE TIMING REMAIN DISTINCT (READ-THROUGH 7)
Affected company: BE Semiconductor Industries (BESI: Netherlands).
Directional impact and magnitude: Positive, with high significance for the long-term hybrid-bonding opportunity. Near-term revenue upside is more limited because customer production schedules determine delivery timing.
KLA explicitly linked greater inspection sensitivity to “more hybrid bonding and logic devices.” Its discussion of packaging becoming more front-end-like supports the conclusion that advanced bonding architectures are moving into increasingly demanding production applications.
For Besi, the transmission mechanism is complementary rather than competitive. KLA inspects and characterizes process quality; Besi supplies assembly and bonding equipment. Greater adoption of hybrid bonding expands demand for both bonding tools and the inspection infrastructure needed to achieve acceptable yields. Better process control can improve the manufacturability and economics of bonding, supporting adoption of the complete production flow.
This is stronger evidence for the direction of the architecture transition than for the number of bonding systems that will be ordered in a particular quarter. Inspection intensity, bonding throughput, customer utilization, and equipment reuse all affect the relationship between packaging revenue and tool demand. KLA’s packaging revenue growth cannot be translated into an equivalent growth rate for Besi.
Besi’s October 22 results had already disclosed that year-to-date hybrid-bonding orders exceeded the full-year 2025 level by more than 2x. Its Q4 revenue outlook was nevertheless approximately flat, plus or minus 5%, because some customers requested deliveries aligned with 1H 2027 production plans. KLA’s examples of customers unable to accept equipment because facilities are delayed reinforce that timing distinction, without establishing that the unnamed customers are the same.
The near-term implication is supportive sentiment but limited justification for overriding Besi’s existing Q4 delivery assumptions. The more important fundamental catalyst is conversion of booked orders into 1H 2027 shipments and subsequent customer qualifications. KLA’s comments do not establish that all HBM configurations migrate immediately to hybrid bonding; current interconnect technologies and hybrid bonding can coexist for an extended period.
COMPUTING HARDWARE AND ENTERPRISE IT
MEMORY INFLATION REMAINS A COST AND WORKING-CAPITAL HEADWIND, BUT IT IS NOT AN AUTOMATIC HARDWARE EARNINGS SHORT (READ-THROUGH 8)
Affected companies: Dell Technologies (DELL: United States) and Lenovo Group (0992: Hong Kong).
Directional impact and magnitude: Negative at the input-cost and inventory-funding level, with moderate potential significance for hardware profitability. The net earnings effect depends on pricing, product mix, supply access, and customer demand.
KLA’s persistent memory cost pressure, additional purchases at higher prices, and engineering effort to reduce memory consumption indicate that relief is not immediate. Management also explained that existing customer contracts and backlog cannot readily be repriced. These observations identify the economic problem faced by hardware producers: procurement costs can rise before selling prices or product designs adjust.
Dell and Lenovo incorporate substantial memory content into servers and client devices. Higher component costs increase the cash required to procure a given hardware configuration. If selling prices adjust with a lag, gross profit is pressured. If prices adjust fully, customer purchasing power declines unless budgets increase. Reported revenue can then rise because of higher average selling prices without an equivalent increase in physical units.
The near-term risk is therefore not confined to gross-margin percentage. Inventory investment, quote validity, component allocation, and customer acceptance of higher prices determine whether strong orders convert into profitable cash generation. Consumer and budget-constrained client demand is generally less able to absorb price increases than high-return infrastructure workloads, although the call does not quantify that demand response.
The counterevidence prevents a blanket bearish conclusion. Dell’s September results commentary explicitly credited pricing discipline during component inflation and reported substantial profitability improvement. Lenovo’s August release likewise reported stronger profitability and described scale and supply-chain capabilities as advantages in managing shortages. KLA’s own difficulty repricing existing orders cannot be assumed to apply identically to either company’s commercial model.
The high-conviction negative is that expectations of rapid memory-cost normalization are less defensible, not that Dell or Lenovo must miss earnings. Their forthcoming late-2026 results should be assessed for pricing realization, physical shipment trends, gross profit, and inventory funding rather than revenue growth alone; exact future reporting dates are not required to establish that operating test.
The cross-portfolio implication is important. Memory manufacturers and hardware assemblers may both report strong revenue while retaining very different shares of the economic benefit. A portfolio containing both is not automatically diversified against memory inflation: the producers benefit directly from pricing, while the hardware companies must demonstrate successful pass-through and cash conversion.
Report record
- Sector
- Information Technology
- Industry
- Semiconductors & Semiconductor Equipment
- Fiscal period end
- September 30, 2026
- Report date
- October 28, 2026
- Analysis
- 7062 words
- Read-throughs
- 3156 words
- Content fingerprint (PDF)
29432e86c6fe- Content fingerprint (analysis)
e547f0ebdbca- Content fingerprint (read-throughs)
b411d1fc5ea9
Prepared from the company's earnings release and earnings call transcript. Figures as reported by the company. For information only. Not investment advice.
More from KLA Corporation
No other reports yet.
More in Information Technology
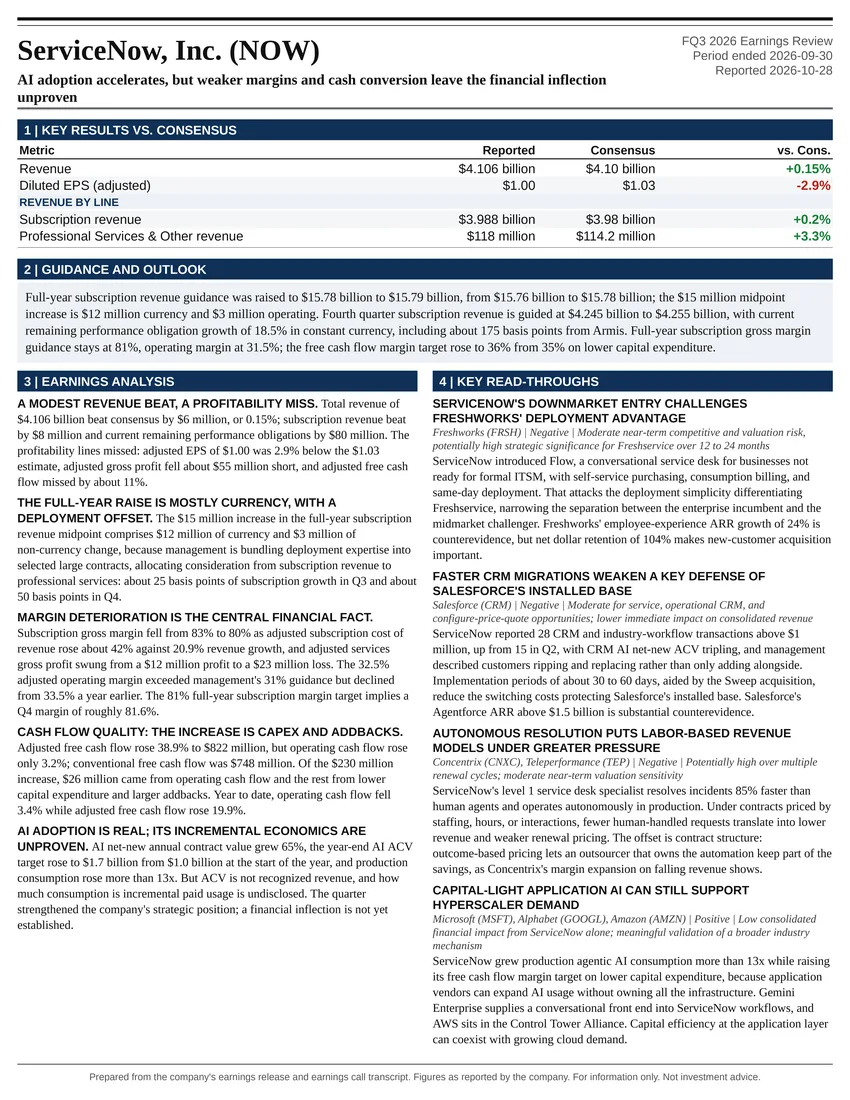
AI adoption accelerates, but weaker margins and cash conversion leave the financial inflection unproven
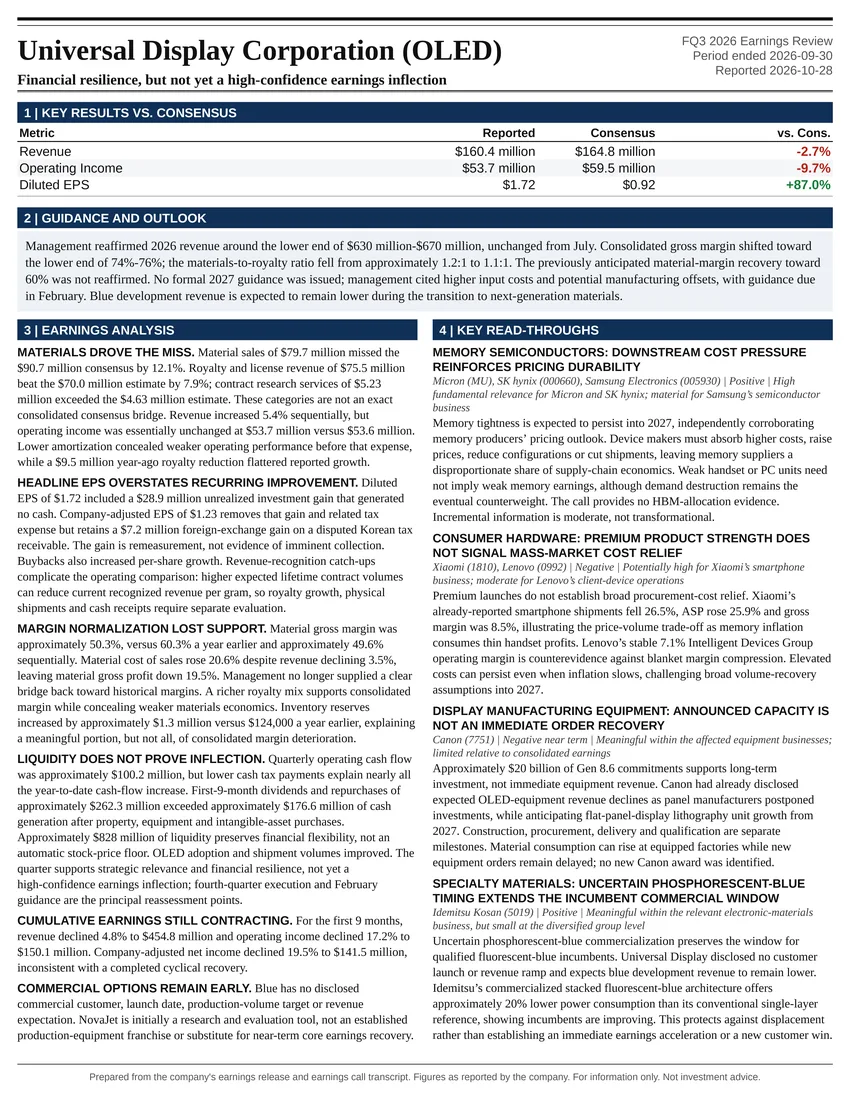
Financial resilience, but not yet a high-confidence earnings inflection
All Information Technology reports
KLA Corporation on the Atlas Peak ticker page
Follow @AtlasPeakRes on X for new earnings reports as they publish.