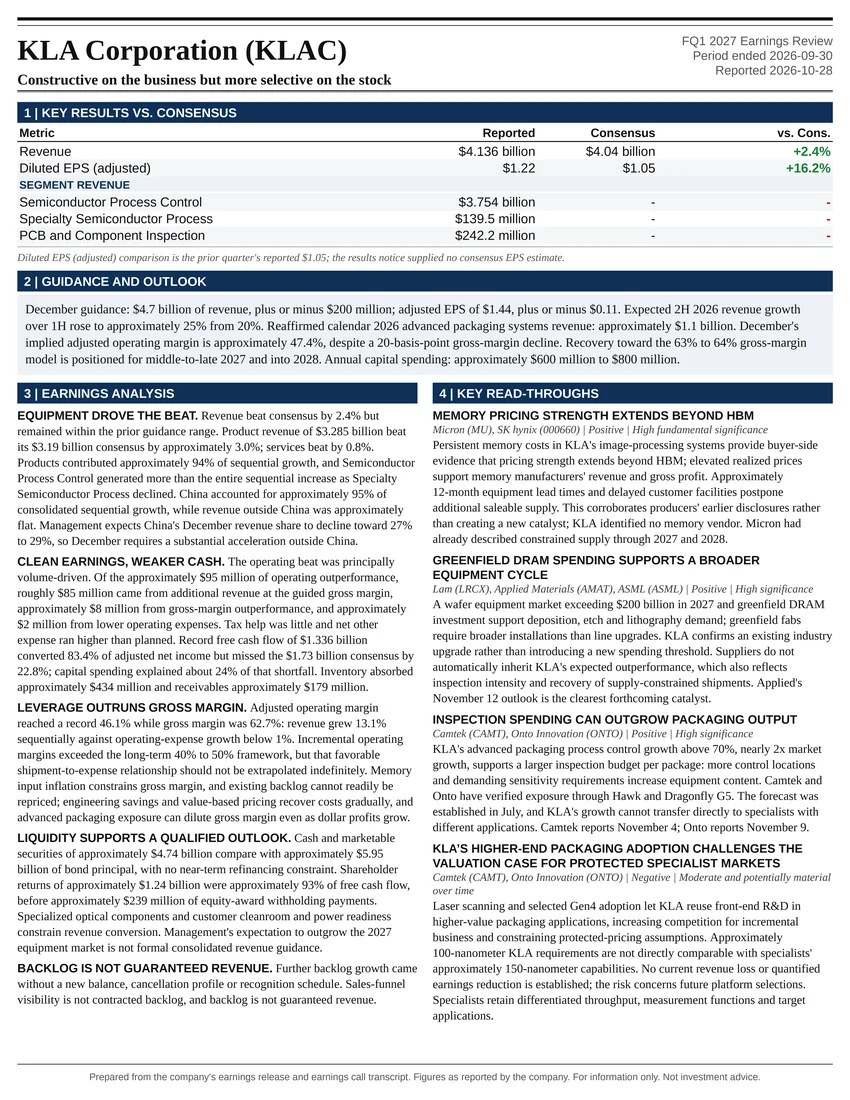
Constructive on the business but more selective on the stock
Earnings Reports
ServiceNow, Inc. FQ3 2026 Earnings Report
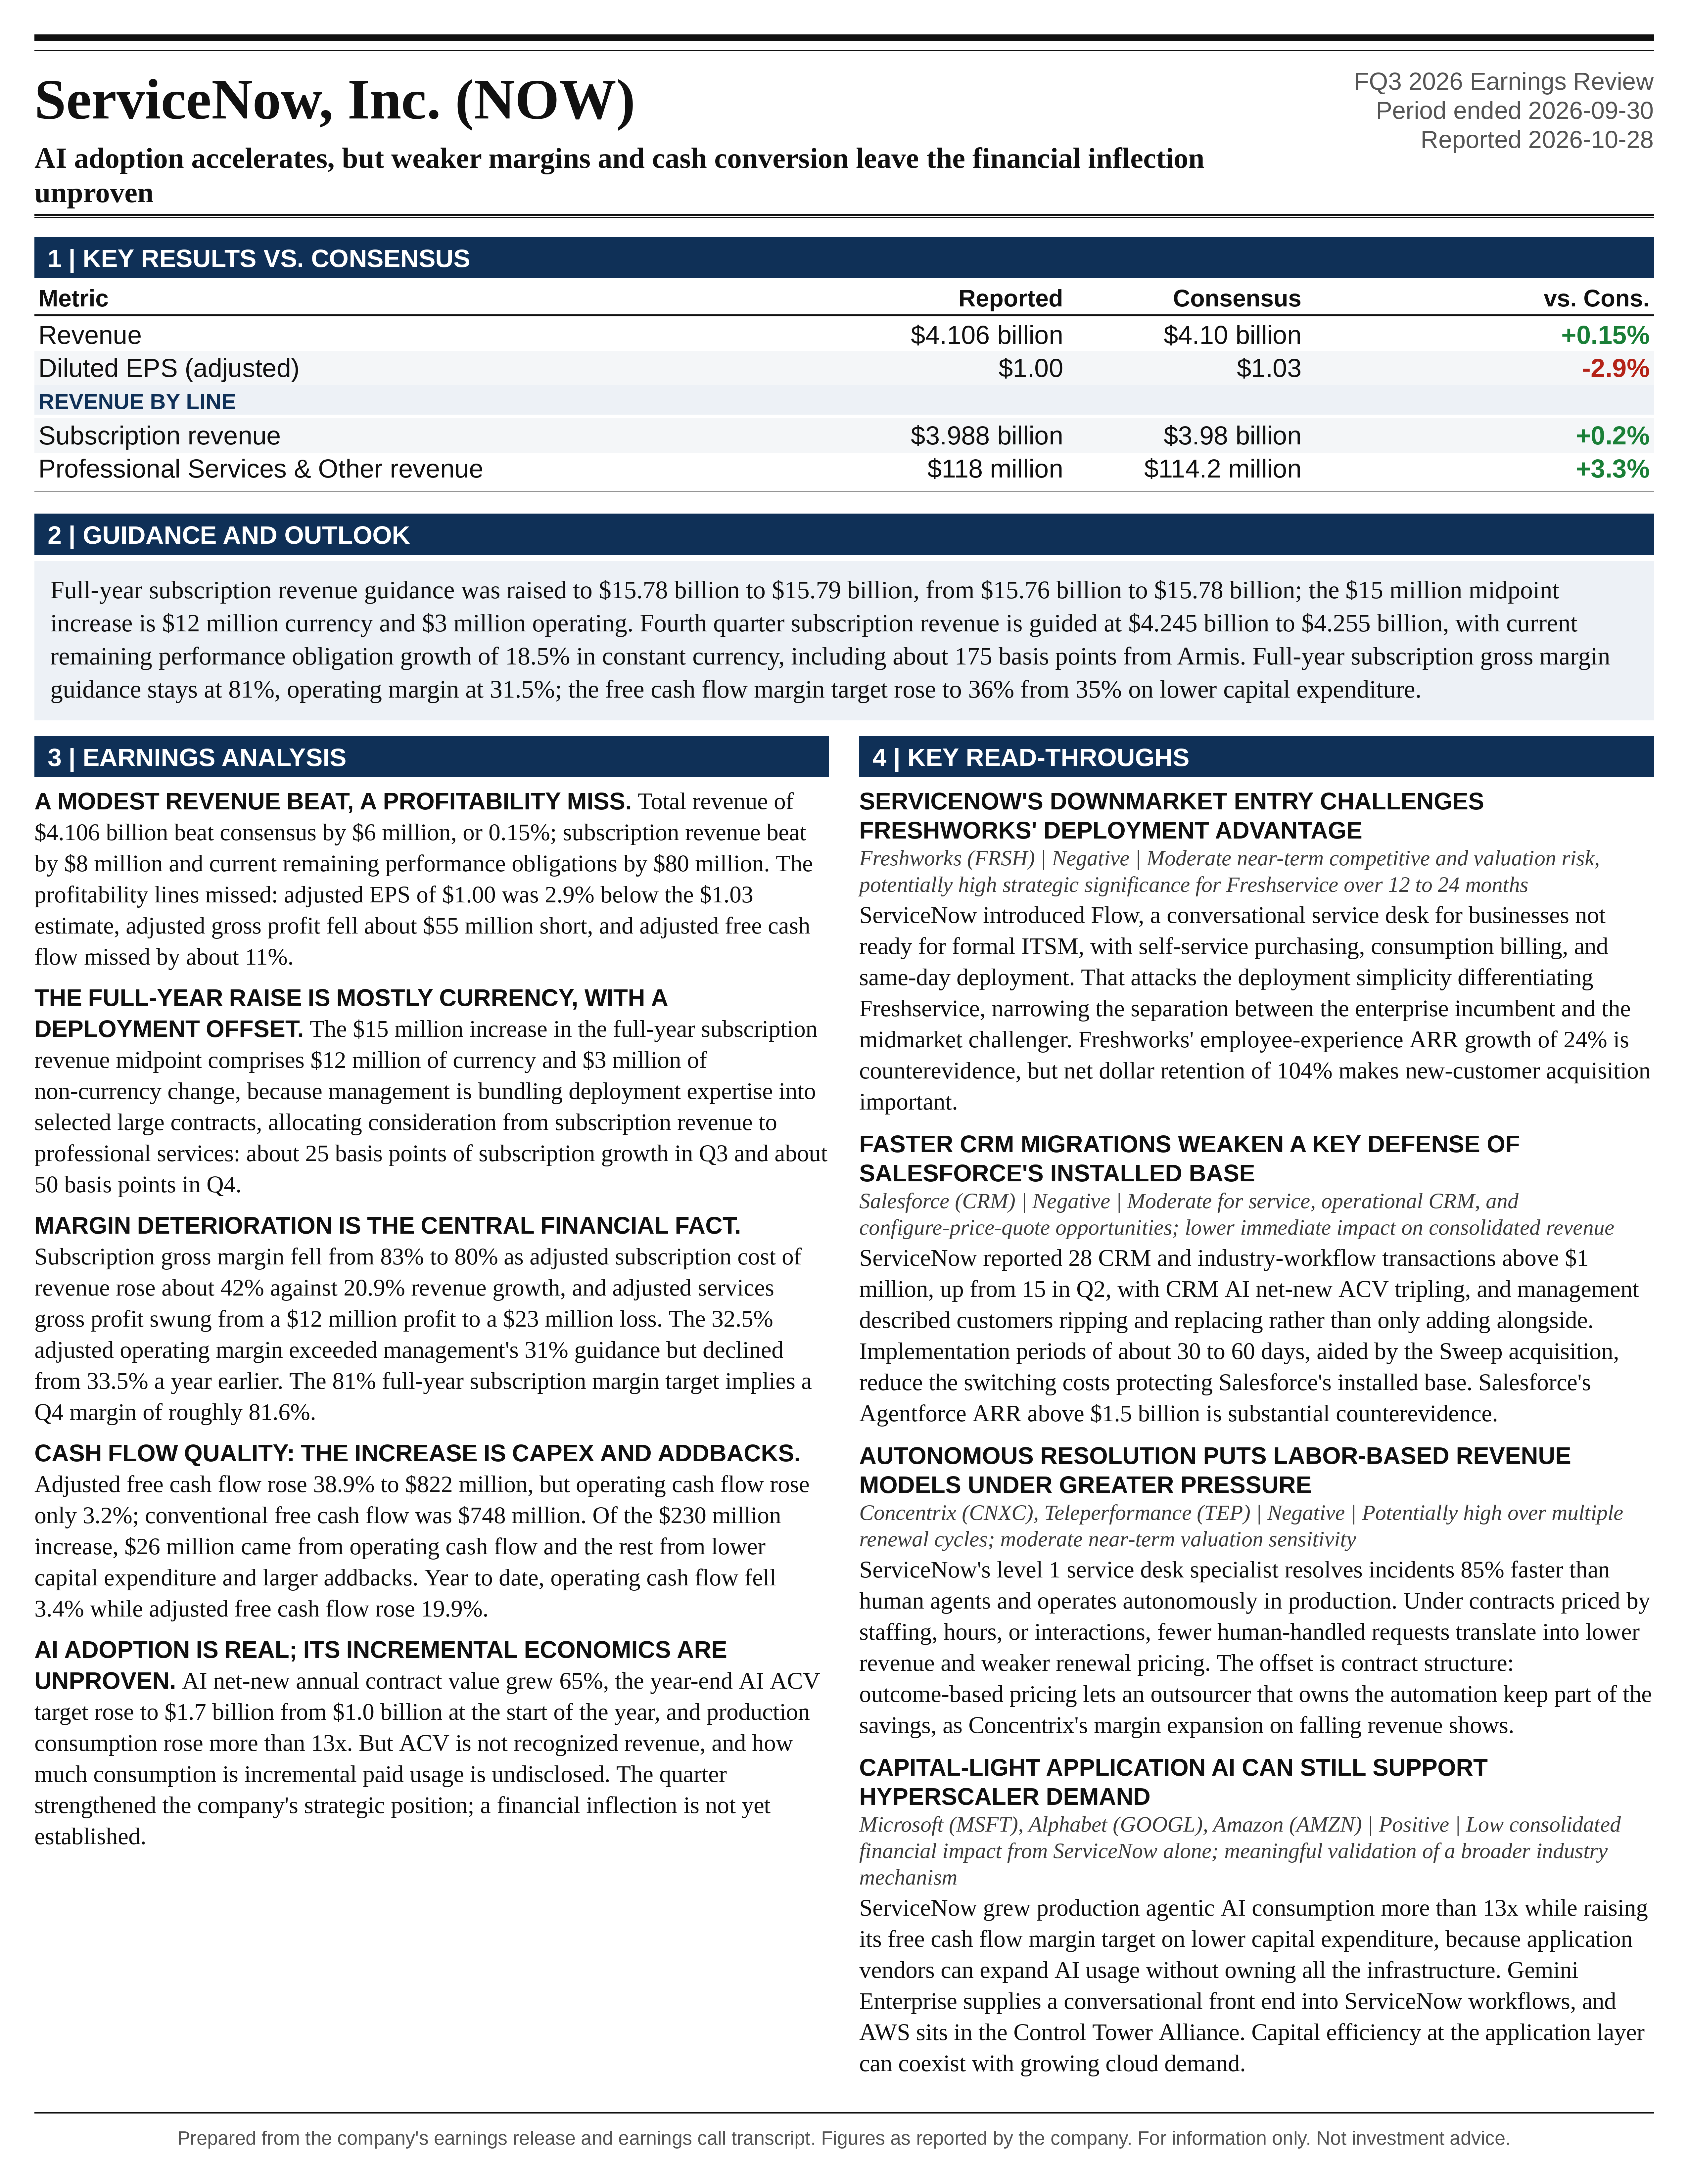
ServiceNow, Inc. (NOW) FQ3 2026 earnings: AI adoption accelerates, but weaker margins and cash conversion leave the financial inflection unproven. Full earnings analysis, key read-throughs, and the one-page exhibit from Atlas Peak Research.
ServiceNow, Inc. (NOW)
Sector: Information Technology · FQ3 2026 · Period end September 30, 2026 · Reported October 28, 2026
ServiceNow’s Q3 2026 earnings call supports a neutral investment stance at the supplied reference price of $150.13. The company demonstrated substantial AI adoption, strong enterprise retention, and continued expansion into large, multiproduct relationships.
Download the one-page report (PDF)
View one-page exhibit
Download analysis (.md)
Download read-throughs (.md)
Post to X
One-Page Exhibit
Earnings Analysis
EXECUTIVE CALL SUMMARY: ServiceNow (10/28/26)
ServiceNow’s Q3 2026 earnings call supports a neutral investment stance at the supplied reference price of $150.13. The company demonstrated substantial AI adoption, strong enterprise retention, and continued expansion into large, multiproduct relationships. However, the quarter did not establish that accelerating AI activity is producing accelerating consolidated growth or improving incremental economics. Subscription revenue modestly exceeded expectations, but adjusted EPS, gross margin, and free cash flow missed the Bloomberg consensus figures accompanying the earnings notice. The investment debate has shifted from whether ServiceNow can commercialize AI to whether incremental AI revenue can offset deployment subsidies, infrastructure costs, acquisition dilution, and potential pressure on traditional seat-based spending.
The most important guidance detail is that the $15 million increase in full-year subscription revenue was predominantly currency-driven. The investor presentation attributes $12 million to currency and only $3 million to the remaining guidance change. Meanwhile, Q4 constant-currency cRPO growth is expected to slow to 18.5%, including approximately 175 basis points from Armis. Mechanically excluding that disclosed acquisition contribution produces approximately 16.75% growth, before adjusting for renewal timing, revenue classification, and contractual exclusions. This is not a fully organic growth rate because other acquisitions remain within the business, but it establishes a more demanding starting point for the acceleration thesis than the consolidated headline suggests.
The strategic evidence is more favorable. AI net-new annual contract value grew 65% year-over-year, the year-end AI ACV target increased to $1.7 billion from $1.5 billion, and production consumption increased more than 13x year-over-year. Action Fabric creates a credible mechanism for monetizing enterprise actions initiated through external interfaces such as ChatGPT and Gemini Enterprise. ServiceNow therefore does not necessarily need to control the conversational interface to retain economic relevance. The unresolved issue is how much of the disclosed consumption represents incremental paid usage rather than consumption of previously contracted entitlements.
Profitability requires similar differentiation. The 32.5% adjusted operating margin exceeded management’s 31% guidance but declined from 33.5% a year earlier. Adjusted free cash flow increased 38.9%, yet operating cash flow increased only 3.2%. Most of the quarterly free cash flow improvement came from lower capital expenditure and larger acquisition-related cash addbacks. ServiceNow remains capable of generating substantial cash, but the evidence does not support treating all reported cash flow growth as underlying operating improvement.
The resulting investment conclusion is constructive on strategic positioning but cautious on near-term earnings revisions and valuation. A higher AI ACV target alone is insufficient to justify a larger position. A more compelling investment case would require evidence that paid consumption is accelerating total customer spending, acquisition-adjusted demand is stabilizing, and gross margins can recover without sustained implementation subsidies.
RESULTS QUALITY AND COMPARISON WITH EXPECTATIONS
ServiceNow reported Q3 subscription revenue of $3.988 billion, compared with $3.299 billion a year earlier, an increase of 20.9% on the underlying dollar figures and 20.5% in constant currency. Total revenue increased 20.5% to $4.106 billion from $3.407 billion. Professional services and other revenue increased to $118 million from $108 million. Subscription revenue represented approximately 97.1% of total revenue, maintaining the company’s predominantly recurring revenue profile.
Against the Bloomberg earnings notice, total revenue exceeded the approximately $4.10 billion estimate by only $6 million, or 0.15%. Subscription revenue exceeded the approximately $3.98 billion estimate by $8 million, or 0.2%. cRPO of $13.65 billion exceeded the $13.57 billion estimate by $80 million, or 0.6%. These were positive results, but the magnitude of the revenue outperformance was modest relative to management’s expansive characterization of the quarter.
The profitability comparisons were less favorable. Adjusted EPS of $1.00 missed the notice’s $1.03 estimate by 2.9%. Adjusted gross profit of $3.175 billion fell approximately $55 million below the $3.23 billion estimate. Reported adjusted gross margin of 77.5% missed the 78.8% estimate by approximately 130 basis points. Adjusted subscription gross margin of 80% missed the 81.1% estimate, while professional services adjusted gross margin of negative 20% was substantially below the positive 7.92% estimate. Adjusted free cash flow of $822 million missed the $923.3 million estimate by approximately 11.0%.
Management’s statement that results exceeded guidance across its principal growth and profitability measures is therefore compatible with a mixed consensus outcome. Guidance outperformance and consensus outperformance are different reference points. The operating margin beat was real, but it did not prevent an EPS miss, gross profit shortfall, or free cash flow miss.
The repeated transcript header contains a separate “current quarter” EPS estimate of $1.173 and sales estimate of $4.364 billion. Those figures are not consistent with the explicitly identified Q3 consensus in the earnings notice and should not be used to calculate Q3 surprises without confirming the forecast period and snapshot. The quarter-specific notice provides the more appropriate comparison. Historical per-share comparisons below use the current earnings release’s restated figures, which incorporate the 5-for-1 stock split effective December 17, 2025, and the revised exclusion of strategic investment gains and losses.
SEQUENTIAL PERFORMANCE AND THE UNDERLYING GROWTH TRAJECTORY
Subscription revenue increased 2.9% sequentially from $3.877 billion in Q2. Constant-currency subscription growth slowed from 23% in Q2 to 20.5% in Q3. This deceleration cannot be interpreted entirely as weaker demand because the Q2 call explicitly identified strong federal demand and an increased on-premises mix that pulled some revenue forward from Q3. Nevertheless, the current quarter does not provide evidence of broad-based revenue acceleration despite stronger AI activity.
Constant-currency cRPO growth eased from 21.5% in Q2 to 21% in Q3, while total RPO growth increased from 22% to 22.5%. In dollars, cRPO increased 3.4% sequentially from $13.20 billion to $13.65 billion, and total RPO increased from approximately $29.0 billion to $29.7 billion. Management attributed part of the RPO strength to longer average contract duration. Longer commitments improve revenue visibility and customer embeddedness, but they can also support total RPO growth without an equivalent acceleration in annual customer spending.
The adjusted operating margin recovered from 29.5% in Q2 to 32.5% in Q3. That sequential recovery is encouraging, but the more relevant year-over-year comparison remained negative. Management attributed the Q3 beat to revenue outperformance, efficiency gains, and spending timing. The timing component limits the extent to which the full beat should be extrapolated into future quarters.
Large-account penetration continued to improve. Customers generating more than $5 million in ACV increased from 658 in Q2 to 680 in Q3, approximately 23% above the prior-year level. Management also reported 31 additional customers crossing $20 million in ACV over the past year. These disclosures support continued enterprise expansion, although they do not isolate acquisition effects, price increases, or consumption-driven growth.
GUIDANCE REVISIONS: A SMALL OPERATING INCREASE BENEATH THE HEADLINE RAISE
Full-year subscription revenue guidance increased from $15.760 billion to $15.780 billion to $15.780 billion to $15.790 billion. The midpoint increased $15 million to $15.785 billion, a revision of approximately 0.1%. Expected full-year growth remained 22.5% reported and 21% in constant currency. The higher dollar forecast therefore did not represent an increase in the rounded constant-currency growth outlook.
The investor presentation provides a particularly important bridge. Q3 subscription revenue increased from the rounded prior guidance midpoint of $3.978 billion to $3.988 billion, comprising approximately $2 million of favorable currency and $8 million of operating performance. The full-year midpoint increase comprises $12 million of currency and $3 million of non-currency guidance change. Approximately 80% of the annual dollar increase was therefore currency-related.
On a comparable rounded basis, the $3 million full-year non-currency increase falls short of the $8 million already delivered in Q3. This mechanically implies approximately $5 million less non-currency revenue in the remaining-year outlook than previously contemplated, subject to rounding and unchanged business perimeter. Management attributed the partial pass-through to the decision to bundle deployment expertise into selected large contracts, with a portion of consideration allocated to professional services rather than subscription revenue. The evidence supports a small subscription revenue headwind from the deployment strategy, not a broad operating upgrade disguised by a conservative headline.
Q4 subscription revenue guidance is $4.245 billion to $4.255 billion, with a $4.250 billion midpoint. This represents approximately 6.6% sequential growth, 22.5% to 23% reported year-over-year growth, and 21.5% constant-currency growth. The midpoint is only approximately $10 million above the $4.24 billion subscription consensus in the earnings notice. The more precise company range should be preferred to the notice’s rounded $4.25 billion to $4.26 billion presentation.
The investor presentation discloses approximately 175 basis points of Armis contribution to Q4 constant-currency subscription growth and approximately 125 basis points to full-year growth. Mechanically excluding Armis produces approximately 19.75% growth for both periods. These calculations are acquisition-specific sensitivities rather than fully organic estimates. They demonstrate that part of the reported growth durability is purchased rather than generated solely by the pre-existing business.
Full-year adjusted subscription gross margin remained 81%, adjusted operating margin remained 31.5%, and adjusted free cash flow margin increased from 35% to 36%. Q4 adjusted operating margin is expected to be 32%, below Q3’s 32.5% but approximately 100 basis points above the prior-year quarter. Diluted share guidance remained approximately 1.04 billion for the year and 1.05 billion for Q4. No formal 2027 revenue or earnings guidance was provided. References to stronger growth in 2027 remain directional management expectations rather than quantified commitments.
CRPO: LEGITIMATE ACCOUNTING DISTORTIONS, BUT AN INCOMPLETE DEMAND BRIDGE
Q4 cRPO growth guidance of 18.5% in constant currency represents a 250-basis-point slowdown from Q3. Management identified several explanations: early renewals completed in Q3, a higher Q4 on-premises mix, deployment services allocations, and an increasing amount of backlog excluded because of termination-for-convenience provisions.
Early renewals contributed approximately half of the 100-basis-point Q3 cRPO beat. This indicates that roughly 50 basis points of Q3 outperformance reflected timing rather than an unambiguous increase in underlying demand. Management stated that these transactions would create a corresponding Q4 headwind, but did not quantify the Q4 impact. The Q3 contribution should not simply be transferred into Q4 because the relevant balances, revenue recognition, and measurement dates differ.
The higher on-premises mix is expected to reduce Q4 cRPO growth by approximately 25 basis points while contributing to revenue. This is a plausible explanation for stronger near-term revenue than backlog growth: revenue recognized upfront can leave less future contractual revenue in cRPO. However, the same characteristic makes near-term revenue less directly comparable with ratable cloud subscription growth. On-premises strength is commercially valuable, but it can create timing benefits that should not automatically be extrapolated.
The investor presentation clarifies that termination-for-convenience provisions primarily reflect inherited acquisition contract terms, with potential direct public-sector contracts also relevant prospectively. Approximately 50 basis points of year-over-year subscription backlog growth is expected to be excluded from cRPO at year-end. The presentation states that these contracts contribute to subscription revenue “if they remain in effect.” That condition matters. Excluded backlog may ultimately convert to revenue, but cancellable commitments do not provide the same contractual protection as non-cancellable RPO.
Gina Mastantuono characterized cRPO as “a very nuanced accounting metric.” That is accurate, but the appropriate response is to seek a more complete bridge, not to disregard the metric. After mechanically removing the disclosed 175-basis-point Armis contribution, Q4 cRPO growth is approximately 16.75%. The disclosed timing and classification effects plausibly improve that underlying picture, but the information does not support a precise, fully organic, timing-normalized growth rate. The 50-basis-point excluded-backlog measure also does not necessarily have an identical denominator to reported cRPO growth.
Total RPO of $29.7 billion provides substantial visibility, but only approximately 46% is current. The remaining $16.05 billion extends beyond the next 12 months. Longer contract duration is a favorable retention signal, yet it also increases the importance of distinguishing contract length from annual spending growth. The investment case would strengthen with disclosure of cRPO excluding acquisitions, renewal timing, deployment allocations, and cancellable backlog on a consistent basis.
AI COMMERCIALIZATION: STRONGER EVIDENCE, BUT MULTIPLE METRICS MUST REMAIN SEPARATE
The increase in the year-end AI ACV target to $1.7 billion was the clearest positive revision. The new target is 13.3% above the $1.5 billion target established in May and 70% above the $1.0 billion target at the start of 2026. AI ACV had exceeded $1.0 billion in Q2. Continued upward revisions therefore indicate that demand is exceeding the company’s initial commercialization assumptions.
ACV is not recognized annual revenue, and AI net-new ACV is not the same measure as total AI ACV. The analyst reference to $1.7 billion “in revenue” during Q&A should not be adopted as an accounting description. Similarly, 65% growth in Q3 AI net-new ACV does not imply 65% growth in recognized AI revenue or total AI contractual value. The $1.7 billion target is equivalent to approximately 10.8% of guided annual subscription revenue as a scale comparison, but it does not establish AI’s revenue share.
The breadth of AI demand improved. AI transactions above $1 million increased 4.5x year-over-year, and transactions including at least 5 AI products increased more than 8.5x. Control Tower net-new ACV increased more than 6x. CRM AI net-new ACV tripled both sequentially and year-over-year. Security and risk AI increased more than 4.5x, App Engine AI more than 4x, and asset management AI nearly tripled. These disclosures support a platform-wide opportunity rather than dependence on a single AI product.
However, product-level growth rates are not additive, and the underlying dollar bases were not disclosed. A large enterprise transaction can appear in several product categories. Rapid growth from newly introduced offerings can also coexist with modest aggregate growth because the starting revenue base is small. The most relevant unanswered question is how much incremental total customer spending is being created after changes in legacy products, seats, discounts, and bundled entitlements.
Production consumption increased more than 13x year-over-year, while Action Fabric assists increased 500% month-over-month. A 500% increase means activity reached approximately 6x the starting level, not 500x. The absence of absolute volumes, paying-customer counts, contracted allowance utilization, and realized pricing limits the ability to translate these growth rates into revenue forecasts.
These measures also differ from the Q2 disclosure that the number of customers with agentic AI in production had increased 9x over 9 months. Customer counts, consumption volumes, and ACV growth measure different stages of adoption. They should not be combined into a single acceleration series.
The commercial progression is nevertheless plausible: more production deployments create more completed workflows, which consume more assists and can eventually generate larger contract commitments or overage revenue. The critical distinction is that consuming an already purchased allowance does not necessarily create incremental revenue at that moment. Evidence of replenishment purchases, paid overages, higher renewal commitments, and cohort-level net revenue expansion would provide stronger support for the consumption thesis.
Management reiterated the aspiration for AI to represent 30% of ACV by 2030. That target signals a material business-model transition, but it was already discussed in Q2 and is not a new Q3 commitment. The current quarter increases confidence in adoption, while leaving the relationship between AI mix and consolidated growth insufficiently quantified.
DEPLOYMENT EXPERTISE: A RATIONAL INVESTMENT WITH REAL COSTS
The decision to include deployment resources in selected large contracts was the central operational issue in Q&A. Mastantuono explained that ServiceNow had made “the strategic decision to invest in their success by including delivery expertise with our platform solutions to accelerate AI deployments for select large deals.”
The investor presentation identifies the accounting treatment under ASC 606: consideration is allocated from subscription revenue to professional services revenue, and in some cases excluded from cRPO. The disclosed impact was approximately 25 basis points of subscription revenue growth in Q3 and approximately 50 basis points in Q4. At the relevant prior-year revenue bases, these effects are roughly $8 million in Q3 and $17 million to $18 million in Q4. They are meaningful to a narrow revenue beat, but small relative to the overall business.
The classification effect should not be confused with a reduction in total contractual consideration. Nevertheless, it is not economically costless. ServiceNow must provide engineering capacity, absorb delivery expense, and manage the associated sales and implementation process. The resulting services revenue may have a different recognition pattern and materially lower gross margin than the subscription revenue it replaces.
Management reported that supported customers progressed through AI adoption approximately 2x as quickly during the first 5 weeks, with materially higher assist consumption and product usage. These observations support the strategic rationale for investing ahead of monetization. They do not establish causal returns because the supported cohorts may differ in size, readiness, executive sponsorship, and implementation complexity. No fully loaded deployment cost, incremental gross profit, or payback period was disclosed.
The key modeling variable is incremental lifetime gross profit after delivery and inference costs, not adoption speed alone. Faster deployment is valuable if it brings forward genuinely incremental paid usage. Its value is smaller if it mainly accelerates the use of prepaid entitlements, requires continuing support, or substitutes for implementation spending that customers would otherwise have funded themselves.
Management stated, “we don't expect to include this delivery expertise over the long term.” That expectation is important but remains unproven. Short engagements at the individual customer level can still create a persistent company-level cost if new cohorts continually require assistance. AI implementation agents, repeatable deployment templates, and partner enablement could lower that burden, but evidence of declining delivery cost per deployment is needed.
The claim that services allocations return to subscription revenue at renewal also requires careful interpretation. If implementation services are not repeated and contract consideration is maintained, subsequent revenue classification can improve. That would support reported subscription growth and cRPO without necessarily representing incremental total customer spending. Accounting reclassification, faster revenue realization, and genuine consumption expansion should be evaluated separately.
GROSS MARGINS, OPERATING LEVERAGE, AND INTERNAL AI PRODUCTIVITY
Adjusted subscription gross profit increased to $3.198 billion from $2.744 billion, but subscription gross margin declined from 83% to 80%. Subscription revenue increased 20.9%, while adjusted subscription cost of revenue increased approximately 42%. This is a material deterioration in delivery economics, even after excluding purchased-intangible amortization and other non-GAAP adjustments.
The annual outlook reinforces that concern. The 81% adjusted subscription gross margin target is approximately 250 basis points below the prior-year level. The investor presentation attributes only approximately 25 basis points of annual dilution specifically to Armis. Armis therefore explains only a small portion of the expected annual contraction. On the Q2 call, management identified increased use of hyperscaler partnerships and accelerating AI adoption as factors affecting subscription gross margin. Other acquisition and product-mix effects may also matter, but a complete attribution was not provided.
The 81% annual target implies some recovery from Q3. Using year-to-date subscription revenue of $11.536 billion, adjusted subscription gross profit of $9.318 billion, and the annual revenue midpoint, Q4 subscription gross margin would need to be approximately 81.6% to achieve exactly 81% for the year. This is a mechanical estimate rather than separate management guidance, and reported margins are rounded. It nevertheless highlights gross margin recovery as a tangible Q4 execution requirement.
Professional services economics deteriorated more sharply. Adjusted services gross profit moved from positive $12 million to a $23 million loss, despite revenue increasing only $10 million. The approximately $35 million decline in services gross profit is larger than the estimated Q3 subscription allocation effect. The deployment initiative may contribute, but it does not by itself reconcile the entire deterioration. Additional delivery costs, staffing, acquisition mix, or other factors remain relevant.
At the consolidated level, adjusted gross margin fell from 81% to 77.5%. Adjusted operating expenses grew approximately 13.7%, slower than revenue, reducing the adjusted operating expense ratio by approximately 270 basis points. That operating leverage absorbed much of the gross margin decline, but not all of it. Adjusted operating income increased 17.4% to $1.338 billion, below revenue growth, and adjusted operating margin declined approximately 100 basis points on the company’s rounded presentation.
The internal AI productivity narrative provides a credible mechanism for controlling operating expenses. Management reported more than $1 billion of annualized value from internal AI use, more than 2x the level at the end of 2025. Quota-bearing headcount increased at a double-digit rate even as some operational roles declined. McDermott stated that “our ultimate headcount has actually slightly declined.”
The $1 billion figure should not be treated as an audited cash savings measure or added to operating profit. It may include avoided hiring, employee time savings, increased capacity, and other modeled benefits. The strongest financial corroboration is slower adjusted operating expense growth. The offsetting evidence is that stock-based compensation expense increased to $633 million from $492 million, approximately 28.7%, despite the restrained overall headcount narrative. Workforce productivity and compensation intensity can improve and deteriorate simultaneously.
EPS AND GAAP PROFITABILITY: FINANCING COSTS MATTER
Adjusted net income increased only 4.7% to $1.039 billion, compared with 17.4% growth in adjusted operating income. Adjusted diluted EPS increased from the restated $0.95 to $1.00, approximately 5.3%. The gap between operating profit growth and EPS growth is largely explained by financing and tax effects.
Interest income declined from $115 million to $69 million, while interest expense increased from $6 million to $81 million. Net interest moved from positive $109 million to negative $12 million, a $121 million deterioration. This absorbed approximately 61% of the $198 million increase in adjusted operating income. At the current adjusted tax rate and diluted share count, that year-over-year financing drag is equivalent to approximately $0.09 per share.
The adjusted tax rate also increased from 20% to 21%. After excluding strategic investment gains, adjusted pretax income increased from approximately $1.240 billion to $1.316 billion, only 6.1%. Higher taxes then reduced adjusted net income growth further. These figures explain the year-over-year divergence between operating income and EPS, but do not establish the exact cause of the consensus EPS miss because matched consensus assumptions for interest, taxes, and share count were not provided.
GAAP results were materially weaker. Operating income declined 32.7% to $385 million from $572 million, and net income declined 44.8% to $277 million from $502 million. GAAP diluted EPS declined from $0.48 to $0.27. The gap between GAAP and adjusted operating income reached $953 million, including $633 million of stock-based compensation, $198 million of purchased-intangible amortization, $87 million of severance, and $35 million of business-combination and related costs.
Management’s statement that acquisition dilution has been offset therefore applies principally to the adjusted operating framework and annual guidance. It does not mean that acquisitions have been neutral to GAAP earnings, interest expense, or cash available to shareholders. Acquisition accounting charges may be non-cash, but the underlying purchase consideration and financing costs remain economically relevant.
FREE CASH FLOW: STRONG ABSOLUTE GENERATION, MIXED UNDERLYING CONVERSION
Reported adjusted free cash flow increased to $822 million from $592 million. The reconciliation is important: operating cash flow of $839 million, less $91 million of capital expenditure, plus $74 million of acquisition-related cash addbacks. Conventional operating cash flow less capital expenditure was therefore $748 million, rather than $822 million.
The $230 million increase in adjusted free cash flow comprises only $26 million of additional operating cash flow, $144 million of lower capital expenditure, and $60 million of larger acquisition-related addbacks. Approximately 89% of the improvement came from the latter 2 categories. Lower capital expenditure is a genuine cash benefit, but it has different persistence and economic implications from stronger operating cash generation.
The year-to-date comparison is more revealing. Operating cash flow declined from $3.206 billion to $3.096 billion, approximately 3.4%. Capital expenditure declined from $630 million to $346 million. Acquisition-related cash addbacks increased from $28 million to $371 million. Consequently, adjusted free cash flow increased 19.9% to $3.121 billion, while conventional operating cash flow less capital expenditure increased only 6.8%, from $2.576 billion to $2.750 billion.
The higher 36% annual adjusted free cash flow margin target was explicitly attributed to lower capital expenditure. This is favorable relative to AI businesses requiring substantial owned infrastructure investment. However, capital-light deployment does not eliminate infrastructure costs if workloads are hosted by third parties. Some economics can migrate from capital expenditure to subscription cost of revenue, making gross margin and free cash flow essential joint indicators.
Using the supplied $16.215 billion full-year revenue estimate solely as a modeling denominator, a 36% margin implies approximately $5.84 billion of annual adjusted free cash flow. After $3.121 billion generated through Q3, approximately $2.72 billion would be required in Q4. Against the same estimate’s implied Q4 total revenue, that equates to a cash flow margin of approximately 62%. This is not company guidance, but it demonstrates a substantial year-end collections requirement. Seasonal cash generation can be highly uneven, so the calculation is an execution hurdle rather than evidence that the target is unattainable.
The company’s rounded guidance reconciliation also indicates approximately 37% operating cash flow margin, 3% capital expenditure, and 2% acquisition-related cash addbacks. Conventional free cash flow margin is therefore approximately 34% before those addbacks, compared with 36% under the company’s adjusted definition. The distinction should remain visible in valuation and capital allocation analysis.
The “Rule of 57” combines 21% constant-currency subscription growth with 36% adjusted free cash flow margin. It does not mean 36% free cash flow growth, despite an imprecise reference during Q&A. It is also not a measure of return on invested capital. Acquisition spending, stock-based compensation, contractual risk, and the durability of capital expenditure reductions remain outside that shorthand.
ACQUISITIONS, BALANCE SHEET, AND SHAREHOLDER ECONOMICS
The balance sheet remains manageable, but the acquisition strategy has materially changed its composition. Cash and marketable securities totaled approximately $6.961 billion at September 30, against $7.524 billion of debt, producing approximately $563 million of net debt before leases and strategic investments. At year-end 2025, the same comparison showed approximately $8.564 billion of net cash. The change is substantial even though current net leverage remains low relative to prospective cash generation.
Cash used for business combinations totaled $9.167 billion during the first 9 months, compared with $215 million in the prior-year period. Goodwill increased to $10.012 billion from $3.578 billion, and net intangible assets increased to $3.594 billion from $1.121 billion. The acquisition program has expanded the product portfolio, but its economic success ultimately depends on cross-selling, customer retention, gross profit generation, and returns relative to the purchase prices.
The investor presentation identifies Armis dilution of approximately 75 basis points to full-year and Q4 adjusted operating margin and approximately 200 basis points to annual adjusted free cash flow margin. Maintaining a 31.5% operating margin and increasing cash flow guidance despite that burden is a meaningful execution achievement. It does not resolve whether the acquisition creates an adequate return on the capital invested.
Shareholder cash economics also extend beyond headline free cash flow. Year-to-date repurchases totaled $2.225 billion, while taxes paid for net share settlement of equity awards totaled $456 million. Those award-related payments sit in financing cash flows rather than the company’s free cash flow measure. They are distinct from stock-based compensation expense and should not be double-counted, but they reduce cash remaining after equity compensation settlements.
Diluted shares declined modestly to 1.043 billion in Q3 from 1.048 billion a year earlier, while Q4 guidance is 1.05 billion. The buyback program has therefore helped contain dilution rather than producing a pronounced contraction in the share base. Per-share value creation remains more dependent on sustainable earnings and cash growth than on financial engineering.
ACTION FABRIC AND THE COMPETITIVE POSITION IN ENTERPRISE AI
Action Fabric provides the most credible strategic answer to the risk that AI assistants disintermediate traditional software interfaces. Amit Zavery explained, “But all of the work happens inside ServiceNow. It's just a call coming from ChatGPT.” The economic proposition is that an external agent can initiate work, but ServiceNow retains the governed execution, enterprise context, permissions, integrations, and workflow logic required to complete it.
This architecture can preserve monetization even if employees spend less time in ServiceNow’s own interface. Each governed action can consume assists, allowing revenue to follow work performed rather than screen time or human seats alone. The OpenAI and Google relationships therefore have potential distribution value beyond marketing validation.
However, an integration is not an exclusive channel, and an assist consumed is not necessarily incremental revenue. The call did not disclose external-agent transaction volumes, realized revenue per action, partner economics, or gross margins on those interactions. Open standards such as MCP and A2A can broaden access to ServiceNow while also making alternative execution services easier to connect. Interoperability strengthens the opportunity but does not establish permanent pricing power.
ServiceNow’s defensibility is strongest where workflows depend on deep operational context, complex permissions, audited processes, and integration with established enterprise systems. It is weaker where tasks are simple, easily recreated, or already governed by a competing system of record. The company’s claim to be the execution layer for the entire AI economy is an ambition, not a demonstrated market structure.
EmployeeWorks provides a separate route to monetization through a proprietary employee interface with reasoning, orchestration, and specialized agents. The product reached approximately $100 million in ACV in less than 3 quarters, according to management. That is encouraging, but the figure should not be treated as total Moveworks revenue or entirely incremental revenue to ServiceNow without a product and acquisition bridge.
The hybrid pricing model also remains strategically important. McDermott described the opportunity to “improve our revenue per user by a factor of 5x,” while Mastantuono stated that customers “are not asking at all for outcome pricing.” The 5x figure is an opportunity statement, not a disclosed customer cohort result. Subscription predictability can support enterprise budgeting, but realized monetization will depend on customers accepting larger consumption commitments as human labor requirements decline.
The call did not definitively resolve the cannibalization question. Higher assist usage and more use cases are favorable, but the decisive measure is total spending by comparable customer cohorts after seat reductions, legacy product changes, bundled credits, and discounts. No such aggregate bridge was disclosed.
CONTROL TOWER, SECURITY, AND THE LIMITS OF PLATFORM CONSOLIDATION
Control Tower’s strategic relevance is supported by the enterprise need to inventory agents, enforce access, monitor costs, and maintain auditability. Zavery distinguished the product from a generic orchestration layer: “It's not about orchestration really, it's really the visibility, the control and the safety.”
The combination of ServiceNow’s configuration management database, security operations workflows, Armis asset visibility, and Veza identity context creates a coherent product architecture. Asset discovery identifies what exists, identity governance defines access, and workflows can coordinate investigation and remediation. This can be particularly valuable where IT, operational technology, and non-human identities intersect.
The scope of enforcement remains important. A central control plane is effective only when connected systems honor its policies, identities are correctly mapped, and agents cannot operate through unmanaged routes. The official release describes NVIDIA OpenShell and BlueField enforcement capabilities and indicates that relevant layers will be able to read AI Passport permissions. These product-specific and forward-looking descriptions are more precise than treating every infrastructure-level kill-switch capability mentioned on the call as universally deployed today.
Platform consolidation can reduce fragmented tools and operational handoffs, but it can also concentrate operational risk. A failure in a central policy or remediation layer can have a broader impact than a failure in a narrow application. Independent efficacy evidence, reliability metrics, coverage of third-party agents, and clear accountability will become increasingly important as ServiceNow moves from coordinating work to authorizing autonomous actions.
Security and risk products appeared in 16 of the top 20 deals, supporting meaningful enterprise relevance. However, deals above $1 million declined from 24 in Q2 to 13 in Q3 even as security and risk AI net-new ACV increased more than 4.5x year-over-year. Deal counts are volatile and do not establish a downturn, but the comparison illustrates why rapid AI growth should not automatically be equated with uniform acceleration across the broader security business.
WORKFLOW EXPANSION, CRM, AND CUSTOMER EVIDENCE
The quarter showed broad multiproduct engagement. Technology workflows had 54 deals above $1 million, including 6 above $5 million. CRM and industry workflows had 28 deals above $1 million, up from 15 in Q2. Core business workflows had 24 such deals, while Creator workflows had 13. Asset management exceeded $1 billion in ACV. These figures support a diversified expansion engine, although the categories overlap within large transactions and should not be summed as unique deals.
CRM was among the more persuasive areas of incremental momentum. Management described replacement transactions rather than solely supplementary deployments, and the increase in large CRM and industry deals supports improved commercial traction. ServiceNow’s differentiation is strongest when customer service, field service, quoting, fulfillment, and post-sale operations must connect across multiple systems.
The evidence does not yet establish a broad displacement cycle across traditional sales CRM. Some customer examples emphasize service operations and workflow coordination rather than sales forecasting or account management. The Sweep acquisition may accelerate deployment, while Logik.ai strengthens configure-price-quote capabilities, but customer implementation claims of 30 to 60 days need to be evaluated against migration scope, integration complexity, and long-term maintenance requirements.
Flow expands the opportunity beyond enterprises ready to adopt formal ITSM. Its self-service, consumption-oriented model can lower deployment friction and create a new acquisition channel. The issuer release identifies Flow as an October launch, so it should be treated as a prospective Q4 and 2027 contributor rather than an explanation for Q3 financial performance. Its economics may also differ from the established enterprise model through smaller contract values, different retention patterns, and greater pricing sensitivity.
Customer examples demonstrate that AI can deliver measurable operational benefits. The call cited 85% faster incident resolution by the level 1 service desk specialist, 40% lower median time to resolution for an AIOps specialist, and nearly 100,000 annual hours saved at a logistics customer. Bundesliga reportedly achieved 89% first-contact resolution after consolidating 7 digital channels. These examples support product usefulness, but they are selected cases rather than representative portfolio statistics.
The distinction between achieved and targeted outcomes is also important. The consumer finance example targeted 85% accuracy, while the Nestlé discussion described potential coordination improvements and inconsistent deployment geographies across prepared remarks and Q&A. These should not be treated as audited, uniformly realized financial benefits. The strongest investment evidence would be repeatable deployment outcomes linked to paid expansion and customer retention.
FEDERAL DEMAND, RETENTION, AND SALES CAPACITY
The federal business remained a positive demand indicator. Deals above $1 million increased more than 30% year-over-year, and management expects federal net-new ACV growth to accelerate further in Q4. This supports the relevance of ServiceNow’s governance, security, and workflow capabilities in complex institutions.
Federal strength also increases accounting and timing complexity. On-premises deployment, procurement calendars, and cancellation provisions can alter the relationship among bookings, revenue, cRPO, and cash collections. The favorable federal narrative should therefore be assessed alongside those measurement effects rather than used to dismiss them.
The 98% renewal rate remained unchanged from Q2 and provides strong evidence of core platform durability. It does not establish a net revenue retention rate or prove that expansion is accelerating. High renewal rates can coexist with slower upselling, reduced seats, or changing product mix.
Sales capacity appears to be shifting toward revenue-producing roles rather than expanding uniformly. Double-digit growth in quota-bearing headcount, combined with lower operational staffing, could support both selling capacity and operating leverage. The risk is that an increasingly broad product portfolio requires more technical selling and implementation expertise than traditional workflow deployments. Productivity gains must therefore be assessed against sales attainment, deployment quality, and customer expansion, not headcount alone.
MANAGEMENT COMMUNICATION AND THE REMAINING EVIDENCE GAP
Management answered several important questions directly. The deployment allocation was quantified, the expected Q4 effect was disclosed, and the investor presentation identified acquisition contributions and termination-for-convenience exclusions. Those disclosures materially improve the ability to interpret the guidance.
Other responses remained predominantly strategic. The question about total customer spending after AI adoption did not produce a quantified cohort expansion rate. The question about monetization through external agents versus EmployeeWorks did not produce comparative revenue or margin data. The question about when AI would accelerate consolidated growth produced an expectation for 2027 rather than a financial bridge.
Statements that the security business could exceed the current size of ServiceNow, or that Action Fabric could become larger than the company in a short period, should be treated as expressions of ambition. No supporting market share, revenue, margin, or timing model was provided. The appropriate investment interpretation is substantial strategic optionality, not a near-term forecast.
VALUATION AND PROBABILITY-WEIGHTED INVESTMENT IMPLICATIONS
At the supplied $150.13 reference price and approximately $155.23 billion market capitalization, ServiceNow trades at approximately 9.6x the supplied $16.215 billion 2026 revenue estimate. Including approximately $563 million of net debt produces an enterprise-value-to-sales ratio of approximately 9.6x before other adjustments. The supplied $4.065 annual EPS estimate implies approximately 36.9x earnings if it is on a comparable adjusted diluted basis.
Applying the 36% adjusted free cash flow margin target to the supplied annual revenue estimate produces approximately $5.84 billion of cash flow, a 3.8% yield and approximately 26.6x equity value to adjusted free cash flow. This is not an inexpensive valuation for a business with slowing cRPO growth, declining gross margins, and only mid-single-digit adjusted EPS growth in the reported quarter. It can be justified if consumption creates durable acceleration, but that outcome is not yet established.
An illustrative 12-month framework highlights the sensitivity. These scenarios are analytical assumptions, not management guidance. They use the supplied 2026 total revenue estimate as the starting point, 1.05 billion diluted shares as a valuation denominator, and equity multiples of company-defined adjusted free cash flow.
The bull case, assigned a 25% probability, assumes 24% total revenue growth in 2027, a 37% adjusted free cash flow margin, and a 27x cash flow multiple. Revenue would reach approximately $20.11 billion and adjusted free cash flow approximately $7.44 billion, supporting a value near $191 per share, approximately 27% above the reference price. This outcome requires deployment assistance to produce substantial paid expansion, strong execution-layer monetization, and improving unit economics.
The base case, assigned a 50% probability, assumes 20% revenue growth, a 36% adjusted free cash flow margin, and a 22x multiple. Revenue would reach approximately $19.46 billion and adjusted free cash flow approximately $7.00 billion, supporting a value near $147 per share, approximately 2% below the reference price. AI would remain an important growth contributor, but primarily sustain the existing trajectory rather than generate a decisive acceleration.
The bear case, assigned a 25% probability, assumes 16% revenue growth, a 34% adjusted free cash flow margin, and a 17x multiple. Revenue would reach approximately $18.81 billion and adjusted free cash flow approximately $6.40 billion, supporting a value near $104 per share, approximately 31% below the reference price. This outcome could arise if AI spending replaces traditional products, implementation subsidies persist, acquisition-adjusted demand slows, and investors reduce the premium for long-duration growth.
The probability-weighted value is approximately $147, close to but below the supplied reference price. The framework is particularly sensitive to the valuation multiple and the quality of the cash flow measure. It deliberately uses the company’s adjusted definition for comparability; a valuation based on cash flow after acquisition-related payments and equity-compensation cash settlements would be more demanding.
The appropriate action at the reference price is to avoid adding a new long position solely on the AI target increase. A price around $125 to $130 would create a more attractive prospective return under unchanged fundamental assumptions, but lower price alone would not compensate for a deteriorating thesis. Alternatively, stronger evidence of acquisition-adjusted demand and paid consumption could justify purchasing at a higher price.
For a future position initiated after confirmation, an initial allocation of approximately 0.5% of NAV, with a maximum of 1.0% before stronger evidence, would reflect the still-unresolved transition risk. A 12% price-based risk limit would imply a planned portfolio loss of approximately 6 basis points at the initial size or 12 basis points at the maximum size, excluding gap risk. Fundamental deterioration should trigger reassessment before that price threshold.
CATALYSTS, FALSIFICATION CONDITIONS, AND PORTFOLIO EFFECTS
The immediate catalysts are Q4 execution against the approximately $4.25 billion subscription target, delivery of the $1.7 billion AI ACV objective, the expected availability of additional AI specialists, and achievement of the 36% annual adjusted free cash flow margin. Gross margin recovery and year-end collections are particularly important because they test whether the expanding product portfolio can translate into stronger financial outcomes.
The more consequential catalyst is the initial 2027 outlook and subsequent evidence supporting management’s acceleration claim. Favorable confirmation would include stable or improving acquisition-adjusted cRPO, a transparent bridge from production consumption to incremental paid revenue, higher spending by comparable AI customer cohorts, lower deployment cost per customer, and recovery in subscription gross margin.
The thesis would weaken if AI ACV continues to rise while total customer expansion slows, if consumption mainly draws down bundled allowances without replenishment, or if deployment support becomes a recurring commercial subsidy. Persistent subscription gross margin below approximately 80%, continued weakness in operating cash conversion, or failure to restore backlog momentum after identified timing effects diminish would warrant reducing exposure.
ServiceNow also adds meaningful enterprise software, AI adoption, growth-duration, and valuation-multiple exposure. Its operating fundamentals differ from semiconductor and hyperscaler businesses, but its stock can still share sensitivity to AI expectations and interest rates. The expansion into security and CRM diversifies product revenue while increasing overlap with other software holdings. Actual portfolio diversification cannot be established without the holdings and factor exposures.
The central conclusion is that Q3 strengthened ServiceNow’s claim to remain strategically important in an agentic enterprise, but did not establish a financial inflection. The quarter showed real adoption, credible distribution partnerships, and disciplined operating expense management. It also showed weaker gross economics, financing pressure, a predominantly currency-driven annual revenue increase, and slower forward backlog growth. The investment case now requires measurable conversion of AI activity into incremental, high-quality earnings and cash flow.
COMPANY EMPLOYEES ON THE CALL
• Darren Yip, Senior Vice President, Investor Relations and Market Insights. • Bill McDermott, Chairman and Chief Executive Officer. • Gina Mastantuono, President and Chief Financial Officer. • Amit Zavery, President, Chief Product Officer and Chief Operating Officer.
RESEARCH ANALYST PARTICIPANTS
• Brad Zelnick, Deutsche Bank. • Alex Zukin, Wolfe Research. • Morgan Stanley representative speaking for Adam Wood; the substitute speaker’s name is inconsistently transcribed and cannot be reliably established from the supplied transcript. • Samik Chatterjee, JPMorgan. • Peter Weed, Bernstein. • Arjun Bhatia, William Blair. • Samad Samana, Jefferies. • Kirk Materne, Evercore ISI. • Michael Turrin, Wells Fargo. • Matt Calitri, Needham & Company, speaking for Mike Cikos; identified only as Matt in the supplied transcript and named in the supplementary transcript.
Key Read-Throughs
KEY READ-THROUGHS FROM SERVICENOW’S Q3 2026 EARNINGS CALL
ServiceNow’s results indicate that enterprise AI is moving into production, but the economic benefits are being distributed unevenly. AI net-new annual contract value increased 65%, production consumption rose more than 13x, and management raised its year-end AI ACV target to $1.7 billion. However, subscription growth remained approximately 20%, subscription gross margin declined, and deployment support became sufficiently important to affect revenue guidance. The strongest cross-company implications are increased competitive pressure on service-management and CRM vendors, structural pressure on labor-based outsourcing, and greater demand for specialized implementation and security enforcement. The call supports selective exposure to enterprise AI infrastructure and deployment capabilities rather than an indiscriminate software-sector upgrade. Magnitude assessments below distinguish business-line exposure from consolidated financial materiality; they are not forecasts of share-price moves. Country labels indicate corporate domicile.
SERVICE MANAGEMENT AND ENTERPRISE APPLICATIONS
SERVICENOW’S DOWNMARKET ENTRY CHALLENGES FRESHWORKS’ DEPLOYMENT ADVANTAGE (READ-THROUGH 1)
Affected company: Freshworks (FRSH: United States). Direction: Negative. Magnitude: Moderate near-term competitive and valuation risk, potentially high strategic significance for Freshservice over 12 to 24 months; no demonstrated immediate revenue loss.
The most consequential disclosure for Freshworks was the introduction of Flow, rather than ServiceNow’s headline AI growth. Management described a conversational service desk for businesses that are not ready for formal ITSM, with self-service purchasing, consumption billing, and same-day deployment. McDermott stated, “A customer that signs up for Flow today can begin using Flow today.” This directly attacks the deployment simplicity and lower operational burden that differentiate Freshworks from traditional ServiceNow implementations.
The transmission mechanism is reduced separation between the enterprise incumbent and the midmarket challenger. Historically, customers unwilling to undertake a substantial ServiceNow project could favor Freshservice. A lightweight ServiceNow offering gives those customers another option without requiring adoption of the full enterprise platform. Competitive pressure can emerge through lower new-customer win rates, greater discounting, increased sales expenditure, or slower expansion into larger accounts. Freshworks need not lose existing customers for the economics to deteriorate: reduced pricing power and higher acquisition costs would be sufficient.
Freshworks’ existing momentum is important counterevidence. Its August 4 results showed employee-experience ARR growth of 24% and Freddy AI Copilot attachment above 71% in new enterprise deals. Those figures demonstrate an established product proposition, not an undefended incumbent. Nevertheless, consolidated net dollar retention was only 104%, making sustained new-customer acquisition and expansion important to the growth outlook. Flow creates a credible new competitive constraint on that expansion.
The immediate catalyst is Freshworks’ November 3 earnings release, particularly commentary on Freshservice competition, new-logo bookings, AI pricing, and customer acquisition efficiency. Flow was highlighted as an October launch in ServiceNow’s earnings materials, so it cannot reasonably be blamed for Freshworks’ quarter ending September 30. The actionable near-term implication concerns forward guidance and competitive positioning, not a mechanically inferred Q3 miss. The longer-duration issue is whether ServiceNow can remove implementation complexity without sacrificing functionality or attractive unit economics.
FASTER CRM MIGRATIONS WEAKEN A KEY DEFENSE OF SALESFORCE’S INSTALLED BASE (READ-THROUGH 2)
Affected company: Salesforce (CRM: United States). Direction: Negative competitive read-through, partially offset by validation of the broader enterprise-agent opportunity. Magnitude: Moderate for service, operational CRM, and configure-price-quote opportunities; lower immediate impact on consolidated Salesforce revenue.
ServiceNow reported 28 CRM and industry-workflow transactions above $1 million, compared with 15 in Q2. CRM AI net-new ACV tripled both sequentially and year-over-year. McDermott stated, “we’re seeing customers rip and replace not just add alongside.” Management also linked the Sweep acquisition and deployment resources to implementation periods of approximately 30 to 60 days for substantial customers, rather than lengthy migration programs.
The important transmission mechanism is a potential reduction in switching costs. Salesforce’s installed base benefits from accumulated customization, integrations, embedded processes, and the operational risk of migration. If ServiceNow can automate discovery, configuration, and deployment while connecting customer service to fulfillment and back-office workflows, more renewal decisions become genuinely contestable. The financial pressure would initially appear in competitive concessions, longer negotiations, reduced expansion, and higher selling costs before becoming visible as outright customer losses.
The highest-conviction exposure is operational CRM rather than all Salesforce applications equally. ServiceNow’s cited wins emphasize customer service, post-sale operations, workflow execution, and quoting. Jack Henry’s selection of ServiceNow CRM is evidence of a customer decision, but the call does not identify the displaced supplier. It would therefore be inappropriate to count that transaction as a confirmed Salesforce loss.
Salesforce’s own August results provide substantial counterevidence to a broad displacement thesis. It reported Agentforce ARR above $1.5 billion and 14% cRPO growth, alongside strong premium-product bookings. Its Agentforce ARR definition also expanded to include Slackbot and Headless 360, making direct comparisons with ServiceNow’s AI ACV inappropriate. Both companies can benefit from expanding AI budgets while competing more intensely for specific workflows.
The near-term catalyst is Salesforce’s next quarterly update, especially Service-related bookings, renewal economics, AI expansion, and evidence supporting its stated organic reacceleration. Over 12 to 36 months, the key issue is whether implementation automation reduces the protection afforded by complex installed systems. This is a credible competitive risk, not evidence that Salesforce’s entire customer base is becoming replaceable.
BUSINESS PROCESS OUTSOURCING AND TECHNOLOGY SERVICES
AUTONOMOUS RESOLUTION PUTS LABOR-BASED REVENUE MODELS UNDER GREATER PRESSURE (READ-THROUGH 3)
Affected companies: Concentrix (CNXC: United States) and Teleperformance, operating as TP (TEP: France). Direction: Negative for traditional labor-based delivery, with meaningful offsets from automation ownership and outcome-based contracts. Magnitude: Potentially high over multiple renewal cycles; moderate near-term valuation sensitivity, but no basis for a proportional earnings reduction.
ServiceNow reported that its level 1 service desk specialist resolves incidents 85% faster than human agents and is operating autonomously in production. Management also cited an Asian telecommunications deployment intended to handle 70,000 IT requests and 6,000 HR inquiries annually. Bundesliga reportedly reduced case volumes by approximately 50%, while a logistics customer achieved nearly 100,000 annual hours of savings.
These disclosures strengthen the case that AI can eliminate or compress billable work rather than merely improve an employee’s productivity. Under contracts priced by staffing, hours, or interactions, fewer human-handled requests can translate into lower revenue. During transition, staffing reductions and delivery-site costs may adjust more slowly than volumes, creating margin pressure. At renewal, customers can seek to retain a larger share of the productivity benefit through lower pricing.
The evidence does not justify equating an 85% reduction in resolution time with an 85% reduction in outsourced spending. The cited examples concern selected tasks and customer deployments. Complex interactions, regulated processes, exceptions, and customer preferences can preserve human involvement. Revenue exposure also depends on contract structure: an outsourcer paid for outcomes can improve margins if it owns the automation and retains part of the savings.
Existing peer disclosures show that this offset is already operating. Concentrix’s September 29 results showed revenue declining 1.2%, but adjusted operating margin increasing 30 basis points to 12.6% and strong quarterly cash generation. TP’s first-half results showed stable recurring EBITA margin despite a 1.7% like-for-like revenue decline, with AI-powered activities growing at a double-digit rate. TP also attributed substantial weakness to Trust & Safety and offshoring effects, so its revenue decline should not be reclassified as evidence of AI displacement.
The incremental ServiceNow signal is that customers increasingly have an automation route outside the traditional outsourcing relationship. That can weaken an outsourcer’s bargaining position even when it has competitive internal technology. TP’s November 5 revenue update is the nearest identified catalyst, with emphasis on traditional volumes, outcome-based activity, AI-related bookings, and retained productivity benefits. Concentrix has already reported its relevant quarter; ServiceNow’s call informs subsequent renewals and guidance rather than predicting those completed results. The longer-duration risk is reduced revenue per customer unless software, higher-value services, and automation-led contracts expand sufficiently to compensate.
DEPLOYMENT COMPLEXITY SUPPORTS ACCENTURE’S SPECIALIST WORK, NOT THE ENTIRE SERVICES MODEL (READ-THROUGH 4)
Affected company: Accenture (ACN: Ireland). Direction: Positive for specialized AI deployment and governance services; mixed for conventional implementation hours and labor-intensive operations. Magnitude: Moderate within relevant practices, modest at consolidated level without additional contract disclosures.
ServiceNow’s decision to include deployment expertise in selected large contracts is direct evidence that implementation remains a bottleneck to monetization. Mastantuono reported that supported customers progressed through AI adoption approximately 2x as quickly during the first 5 weeks, with materially higher assist consumption and product usage. Management consequently incorporated more deployment capacity into its forecast.
The transmission mechanism is demand for scarce expertise in process redesign, enterprise integration, permissions, data readiness, and production governance. These requirements extend beyond generating code. Accenture has an established economic route to this work through its jointly announced forward-deployed engineering program with ServiceNow, in which both companies’ engineers work inside mutual customers’ environments. ServiceNow’s call also identified Accenture as a substantial internal user governing nearly 900 ServiceNow-native AI assets, providing a reference deployment rather than merely a marketing relationship.
The non-consensus implication is that software vendors’ willingness to fund adoption can support implementation demand even when customers resist paying separately for extensive projects. ServiceNow benefits when earlier deployment accelerates consumption, creating an incentive to provide resources that unlock production. Accenture can participate where industry knowledge and integration requirements exceed the vendor’s own delivery capacity. No allocation of ServiceNow’s incremental deployment expenditure to Accenture was disclosed, so this is not an awarded-revenue estimate.
The offset is equally important. ServiceNow expects the additional delivery expertise to be temporary and is introducing AI implementation agents. Faster deployment can reduce billable hours per project and compress the value of routine configuration work. The favorable exposure is therefore to high-value engineering, governance, and transformation, not indiscriminately to larger implementation teams.
Accenture already reported fiscal Q4 on October 1, with 7% local-currency revenue growth and $22.2 billion of bookings. The ServiceNow call corroborates an implementation opportunity rather than forecasting those results. The next catalyst is conversion of specialist AI bookings into revenue, accompanied by evidence on delivery productivity and profitability. Over 12 to 24 months, the key variable is whether more deployments and higher-value work outweigh declining effort per implementation.
CYBERSECURITY AND IDENTITY
EXPOSURE-MANAGEMENT VENDORS FACE A STRONGER WORKFLOW-LED COMPETITOR (READ-THROUGH 5)
Affected companies: Tenable (TENB: United States) and Qualys (QLYS: United States). Direction: Negative competitive and pricing read-through. Magnitude: Moderate longer-duration strategic risk; low demonstrated near-term earnings impact.
ServiceNow reported security and risk products in 16 of its top 20 transactions and security-and-risk AI net-new ACV growth above 4.5x. Management described integrating Armis asset visibility, Veza identity context, and ServiceNow security workflows to discover exposures and remediate them within a common platform. The call explicitly framed this as an opportunity to consolidate fragmented security spending.
The precise competitive threat is not that ServiceNow necessarily replaces every vulnerability scanner. It is that the vendor controlling asset context, business-process ownership, prioritization, and remediation can influence where incremental security budgets are allocated. Tenable and Qualys compete for exposure-management and risk-reduction spending. A customer may retain an existing detection product while directing additional budget toward ServiceNow’s broader workflow platform, reducing the incumbent’s opportunity to sell higher-value platform modules.
This matters because the strategic value in exposure management increasingly lies beyond finding vulnerabilities. Prioritizing them using business context, assigning accountable owners, coordinating remediation, and demonstrating risk reduction can support larger contracts. ServiceNow is expanding into those adjacent functions from an established operational position. The potential financial channels are lower expansion rates, more competitive bundling, higher selling costs, and pressure on platform pricing.
The evidence supports increased competition, not observed share loss. Tenable’s October 28 release showed 9.5% revenue growth, a 27.1% adjusted operating margin, and a raised full-year outlook. Qualys also markets an integrated risk platform with autonomous remediation capabilities. Neither company should be characterized as a static scanning vendor without a response. ServiceNow’s own security and risk transactions above $1 million declined sequentially from 24 to 13, further limiting any claim of uniform competitive acceleration.
Qualys’ November 9 results provide a near-term catalyst around platform adoption, expansion, remediation products, and competitive pricing. Tenable has already reported the quarter, so the relevant trading question is how its future platform expansion assumptions withstand a stronger ServiceNow offering. The fundamental impact should emerge over enterprise procurement and renewal cycles, generally 12 to 36 months, rather than through an immediate displacement event.
OKTA REMAINS AN ENFORCEMENT PARTNER EVEN AS SERVICENOW EXPANDS INTO IDENTITY GOVERNANCE (READ-THROUGH 6)
Affected company: Okta (OKTA: United States). Direction: Positive ecosystem and strategic-positioning read-through. Magnitude: Modest near-term financial impact, potentially moderate longer-duration product opportunity.
ServiceNow’s expansion through Veza could superficially appear uniformly negative for independent identity vendors. The call supports a more differentiated conclusion. McDermott stated that Control Tower signals Okta and other platforms so they can cut off an agent’s access. Okta was also named as a founding member of the Control Tower Alliance.
The complementary roles are important. ServiceNow can determine that an agent’s actions violate enterprise policy, while Okta controls an authorization or token-enforcement point capable of preventing further access. The accompanying alliance announcement explicitly describes combining ServiceNow’s containment decision layer with Okta’s ability to block new token requests. This validates a role for an independent enforcement provider rather than requiring every identity function to move into ServiceNow.
The transmission mechanism is preservation and potential expansion of Okta’s relevance as enterprises introduce non-human identities, delegated permissions, and autonomous agents. ServiceNow can provide an additional distribution and integration route into enterprise AI programs. Deeper integration can also increase the importance of Okta’s identity controls within existing customer architectures.
The financial opportunity remains conditional on packaging and adoption. More agents do not automatically mean an equivalent number of additional paid seats, and the alliance does not disclose incremental contract value or revenue-sharing terms. Some functionality may be included in existing products. The high-conviction positive conclusion concerns strategic relevance and access to emerging demand, not an immediate earnings upgrade.
The near-term catalyst is evidence of paid AI-identity deployments and associated expansion in subsequent Okta updates. Over 12 to 24 months, the decisive issue is whether agent security becomes a separately monetized workload rather than an included feature. The cross-portfolio implication is that workflow governance and identity enforcement can be complementary profit pools even as vendors compete in adjacent governance products.
CLOUD INFRASTRUCTURE AND AI PLATFORMS
CAPITAL-LIGHT APPLICATION AI CAN STILL SUPPORT HYPERSCALER DEMAND (READ-THROUGH 7)
Affected companies: Microsoft (MSFT: United States), Alphabet (GOOGL: United States), and Amazon (AMZN: United States). Direction: Positive for enterprise AI platform relevance and workload demand. Magnitude: Low consolidated financial impact from ServiceNow alone, but meaningful validation of a broader industry mechanism; no quantified cloud-revenue upgrade.
ServiceNow reported more than 13x growth in production agentic AI consumption while raising its free cash flow margin target because of lower capital expenditure. Management emphasized that the company was not compute-constrained. The call also highlighted Gemini Enterprise as a conversational interface to ServiceNow workflows, Microsoft Azure AI Foundry as an integrated enforcement environment, and AWS as a Control Tower Alliance member. Microsoft separately identifies ServiceNow as an Azure and marketplace customer.
The important transmission mechanism is that application vendors can expand AI usage without owning all the underlying infrastructure. Lower capital expenditure at the application layer does not necessarily indicate lower demand for cloud compute, storage, networking, or model services. Some investment and operating responsibility can sit with infrastructure suppliers. ServiceNow’s earlier commentary linked its annual subscription margin outlook partly to greater use of hyperscaler partnerships, reinforcing the need to evaluate application cash flow and infrastructure demand separately.
For Alphabet, the Gemini Enterprise integration offers a second benefit beyond potential infrastructure consumption: a more useful employee interface that can initiate governed work in established enterprise systems. ServiceNow’s description is explicit: Gemini supplies the conversational front end, while ServiceNow executes workflows. Microsoft’s documented hosting and marketplace relationship provides an established commercial channel. AWS’s participation supports its role in the enterprise AI ecosystem, although alliance membership alone does not establish a new hosting commitment.
The strongest broader implication is that enterprise AI need not produce a single vendor controlling the model, interface, workflow, identity layer, and infrastructure. Different vendors can monetize different parts of the same transaction. This is favorable to cloud platforms that facilitate heterogeneous enterprise environments rather than requiring complete application replacement.
The limits are material. Assist growth is not a disclosed measure of GPU-hours or cloud expenditure; model efficiency, workload complexity, hosting allocation, and contractual pricing can all change the relationship. The call therefore provides no defensible basis for assigning a specific cloud revenue increase to any provider or translating usage into semiconductor shipment estimates.
The near-term catalysts are the hyperscalers’ late-October reporting and subsequent enterprise AI consumption disclosures. Microsoft and Alphabet’s same-evening results must be assessed on their own evidence, not treated as future releases predicted by ServiceNow. The longer-duration positive is continued migration of enterprise AI from experimentation into recurring production workloads. The most important cross-portfolio distinction is that improving capital efficiency for an application vendor can coexist with growing infrastructure demand and pressure on that vendor’s subscription gross margin.
Report record
- Sector
- Information Technology
- Industry
- Software
- Fiscal period end
- September 30, 2026
- Report date
- October 28, 2026
- Analysis
- 7046 words
- Read-throughs
- 2805 words
- Content fingerprint (PDF)
1ce51073b659- Content fingerprint (analysis)
170ba351d86d- Content fingerprint (read-throughs)
8729f418e280
Prepared from the company's earnings release and earnings call transcript. Figures as reported by the company. For information only. Not investment advice.
More from ServiceNow, Inc.
No other reports yet.
More in Information Technology
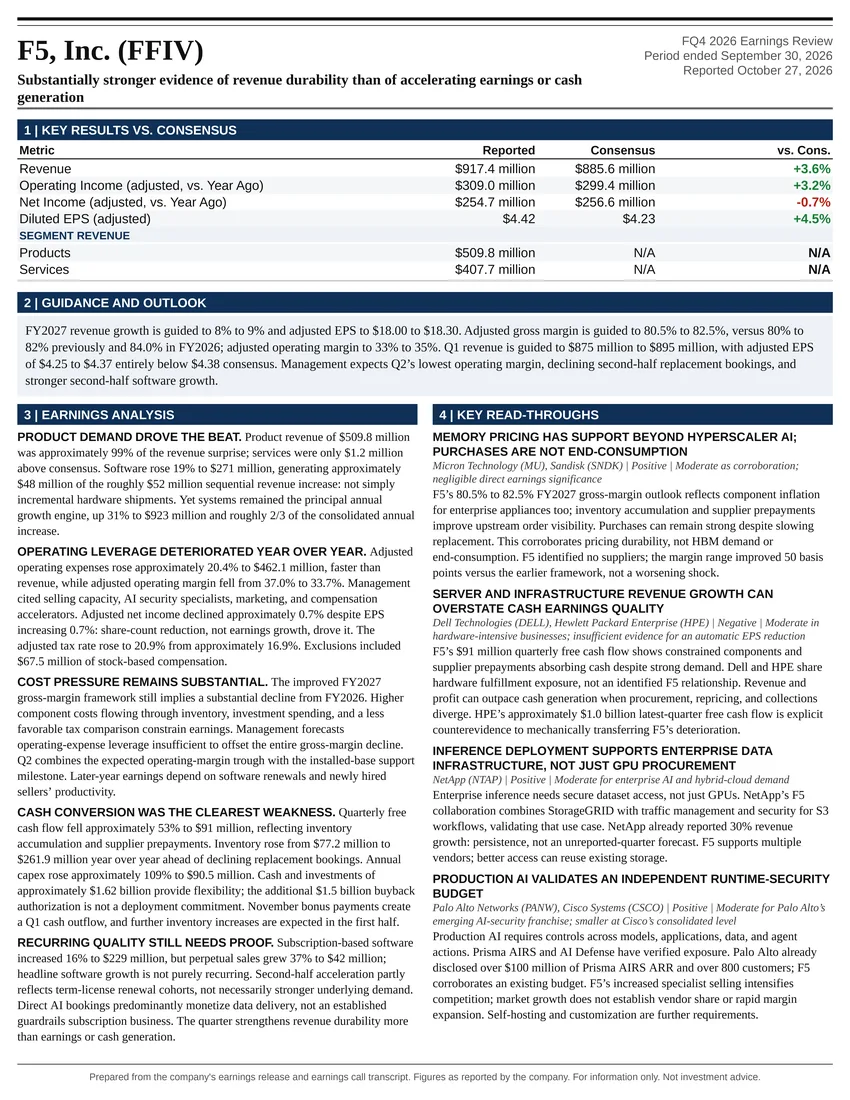
Substantially stronger evidence of revenue durability than of accelerating earnings or cash generation
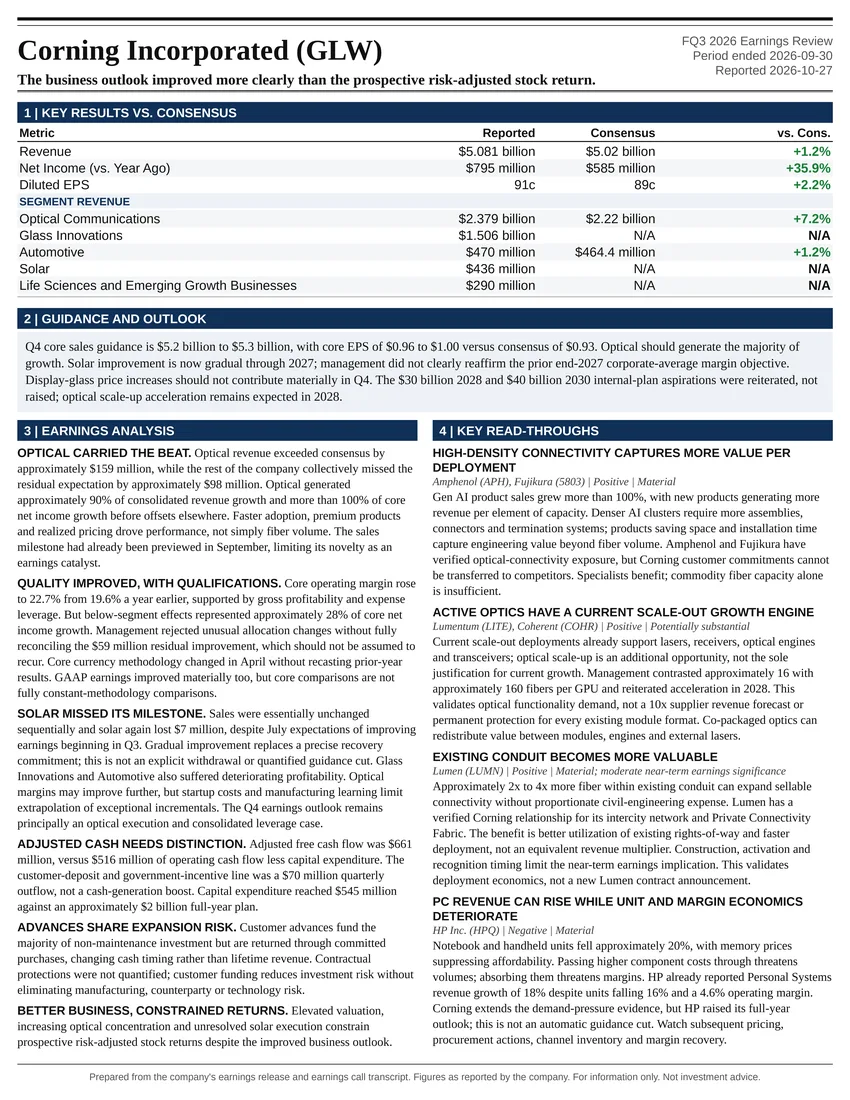
The business outlook improved more clearly than the prospective risk-adjusted stock return.
All Information Technology reports
Follow @AtlasPeakRes on X for new earnings reports as they publish.