Improving operating economics accompanied by greater capital intensity and execution exposure
Earnings Reports
Corning Incorporated FQ3 2026 Earnings Report
Corning Incorporated (GLW) FQ3 2026 earnings: The business outlook improved more clearly than the prospective risk-adjusted stock return.. Full earnings analysis, key read-throughs, and the one-page exhibit from Atlas Peak Research.
Corning Incorporated (GLW)
Sector: Information Technology · FQ3 2026 · Period end September 30, 2026 · Reported October 27, 2026
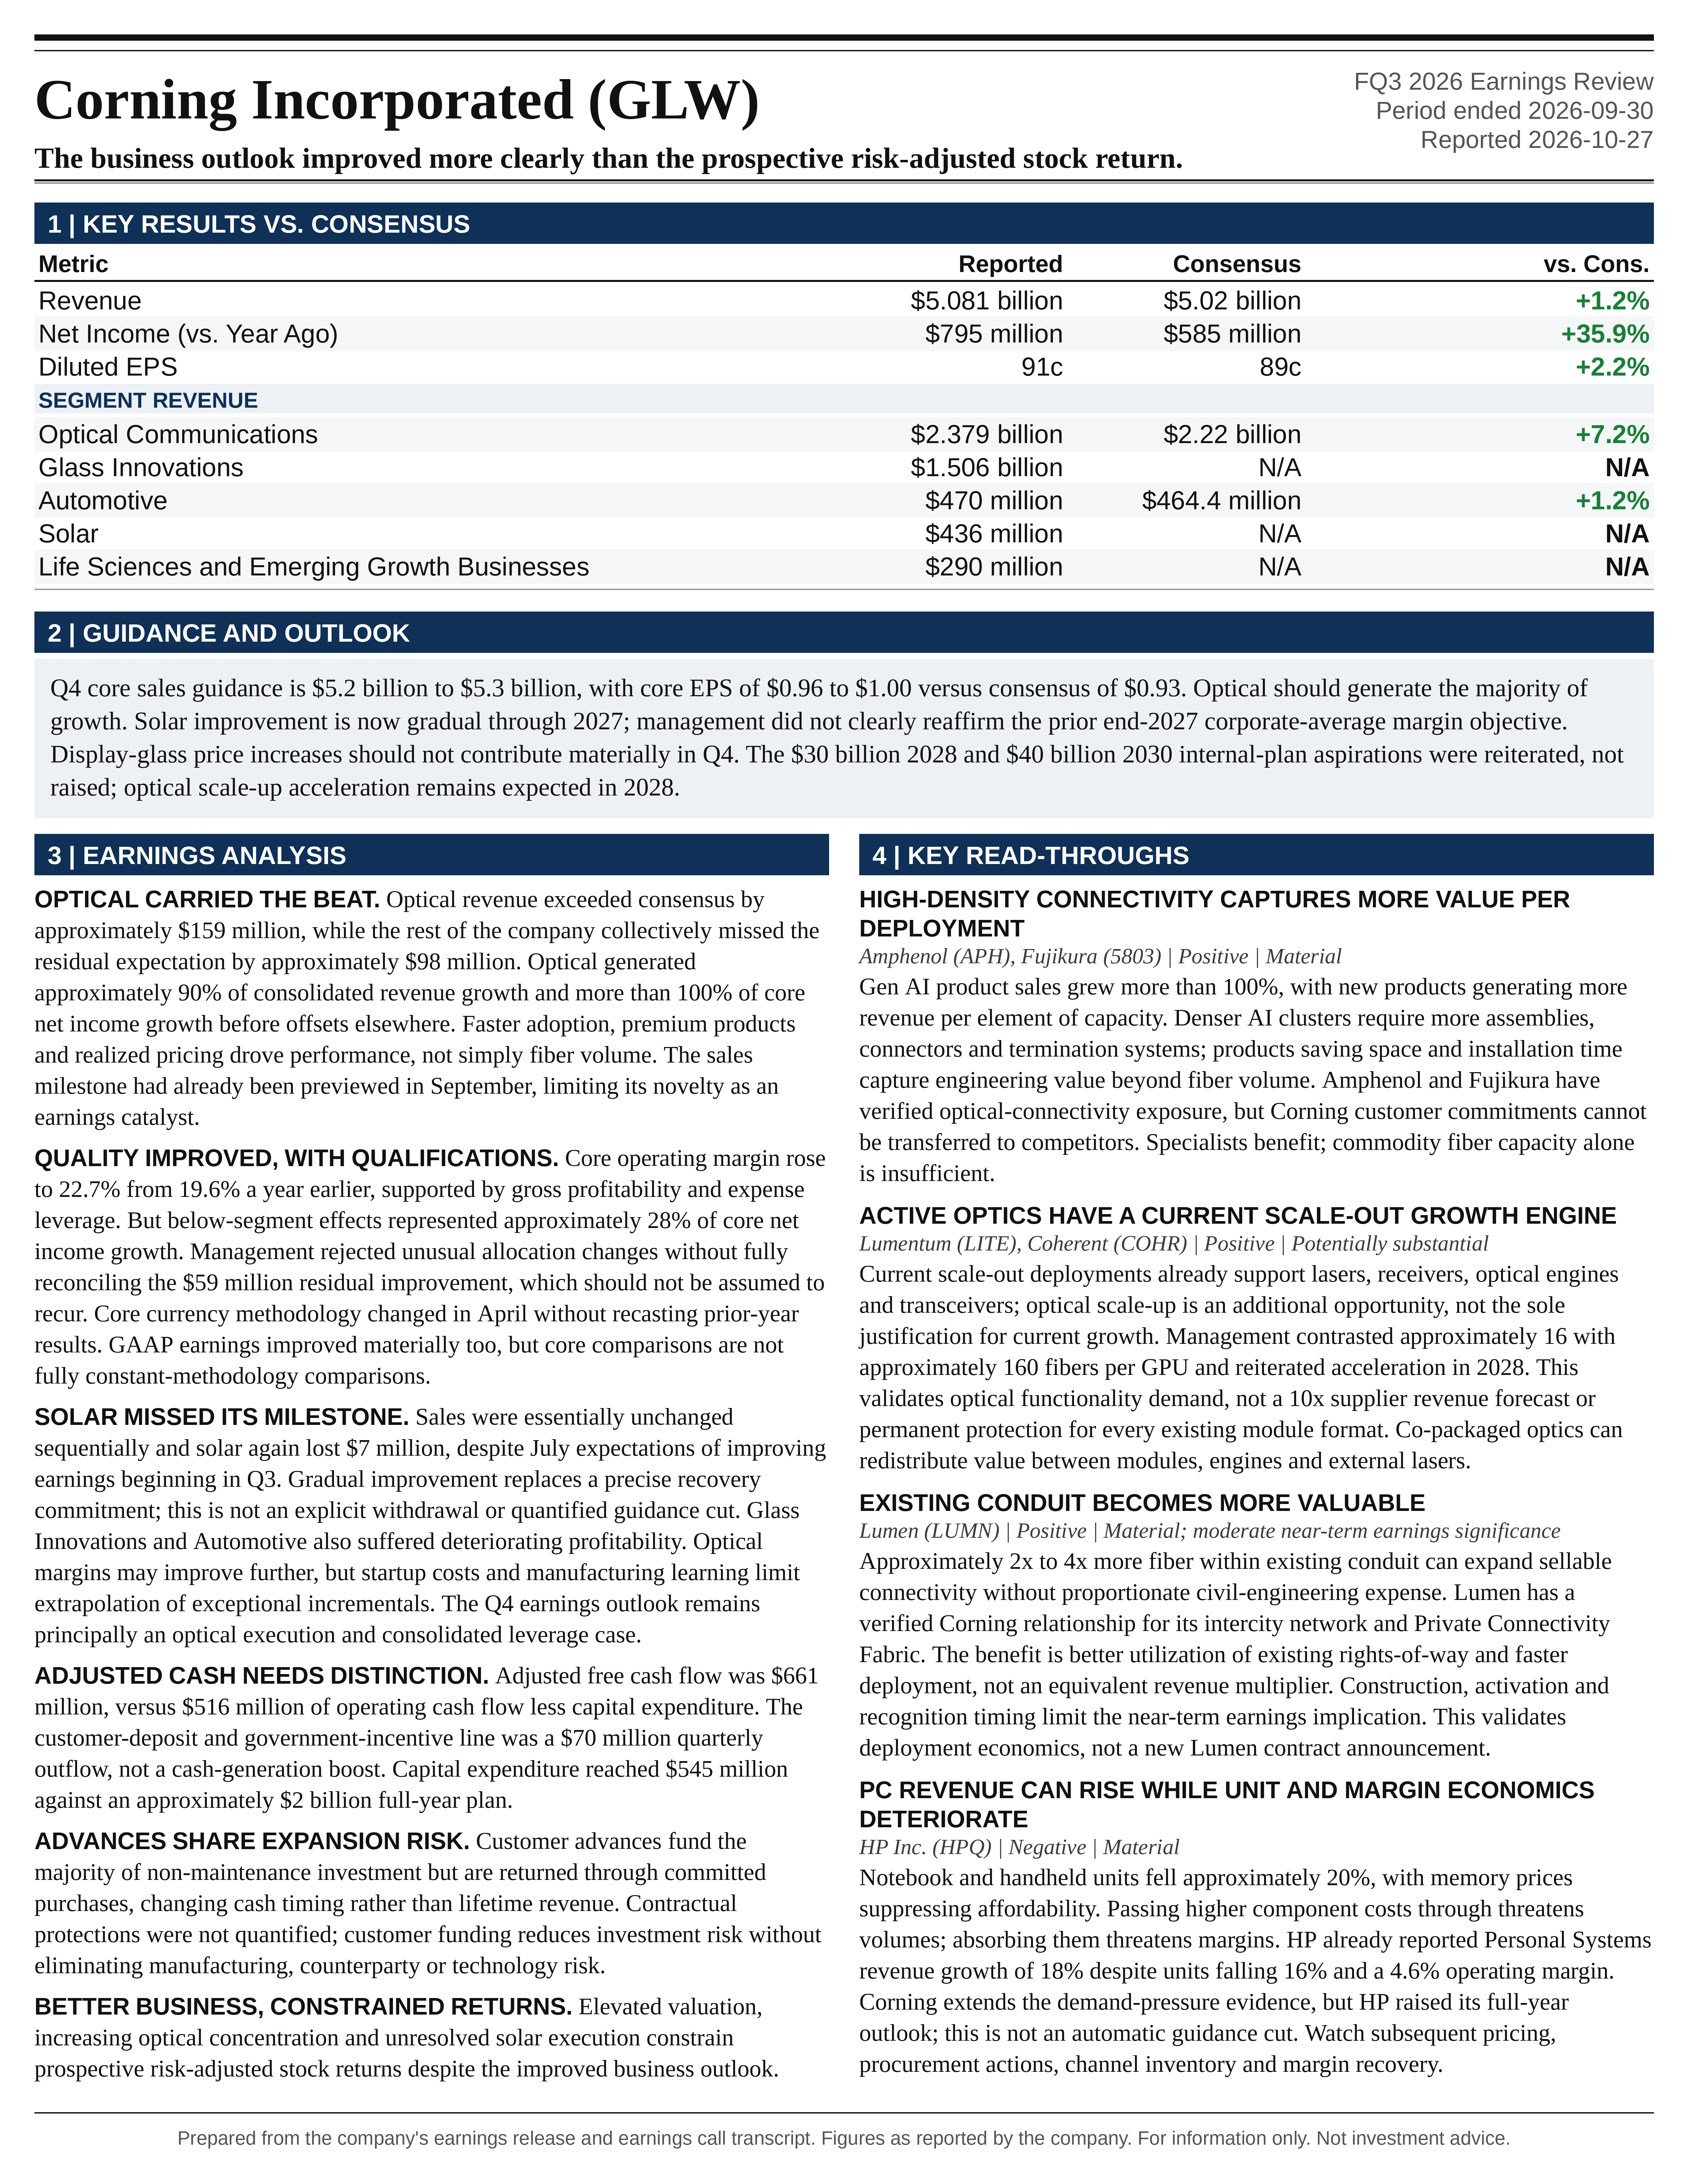
Corning’s Q3 2026 results strengthen the operating case for the company’s transformation into a higher-growth optical infrastructure supplier, but the investment conclusion is more restrained than the headline performance.
Download the one-page report (PDF)
View one-page exhibit
Download analysis (.md)
Download read-throughs (.md)
Post to X
One-Page Exhibit
Earnings Analysis
EXECUTIVE CALL SUMMARY: Corning Incorporated (10/27/26)
Corning’s Q3 2026 results strengthen the operating case for the company’s transformation into a higher-growth optical infrastructure supplier, but the investment conclusion is more restrained than the headline performance. Optical Communications delivered substantial revenue and profit outperformance, Q4 EPS guidance exceeded consensus, and customer-funded capacity expansion is improving the financing profile of the growth program. However, the quarter also exposed persistent solar execution problems, deteriorating profitability in Glass Innovations and Automotive, and increasing dependence on optical infrastructure for consolidated earnings growth. At the Bloomberg price of $123.04 observed at approximately 13:58 UTC on 10/27/26, the shares traded at approximately 36.5x mechanically implied 2026 core EPS and 31.4x annualized Q4 midpoint EPS. The appropriate conclusion is to maintain only limited existing exposure and avoid adding aggressively at that valuation. The business outlook improved more clearly than the prospective risk-adjusted stock return.
Core sales of $5.081 billion increased 18.9% year over year, while core EPS of $0.91 increased 35.8%. Against the supplied Bloomberg consensus, revenue exceeded expectations by $61 million, or 1.2%, and EPS exceeded expectations by $0.02, or 2.2%. These were respectable consolidated beats, but the underlying composition was considerably more polarized. Optical Communications revenue exceeded consensus by approximately $159 million, meaning the rest of the company collectively fell approximately $98 million short of the residual revenue expectation. Optical generated approximately 90% of consolidated year-over-year revenue growth and more than 100% of consolidated core net income growth before offsets elsewhere.
The most important positive development was the combination of rising optical content, strong incremental profitability, and customer commitments that help finance capacity. Management emphasized that current growth remains predominantly a scale-out phenomenon, while optical scale-up remains a potential acceleration beginning in 2028. The most important negative development was solar. July guidance had explicitly anticipated improving solar earnings beginning in Q3, yet sales were essentially unchanged sequentially and the segment again lost $7 million. Management’s current emphasis on gradual improvement through 2027 represents a less favorable near-term execution outlook, even though the eventual revenue opportunity remains intact.
The call largely validated rather than upgraded the long-term growth framework. The $20 billion exit-rate milestone was surpassed early, but that outcome had already been previewed at the September investor conference. The $30 billion 2028 and $40 billion 2030 objectives were reiterated, not raised. Importantly, Corning’s May disclosures distinguished these internal-plan objectives from lower “high-confidence” targets of $27 billion and $35 billion, respectively. Treating the $40 billion objective as assured revenue would overstate the evidence. Confidence is high that the current optical expansion is economically significant, but only medium that the full long-term earnings trajectory will be delivered without material timing, currency, manufacturing, or capital-allocation setbacks.
REPORTED PERFORMANCE AND THE TRUE DEGREE OF OUTPERFORMANCE
The detailed release shows Q3 core sales of $5.081 billion versus $4.272 billion in Q3 2025 and $4.738 billion in Q2 2026. Sequential revenue growth was 7.2%, while core EPS increased 16.7% from $0.78. Core net income increased to $795 million from $585 million a year earlier and $680 million in Q2. Earnings therefore grew substantially faster than sales on both comparisons. The close alignment between net income growth and EPS growth indicates that the improvement was predominantly earnings-driven rather than the result of a shrinking share count.
Against the original July guidance of $4.9 billion to $5.0 billion in sales and $0.85 to $0.89 in EPS, Q3 revenue exceeded the midpoint by $131 million, or 2.6%, and the upper end by $81 million, or 1.6%. EPS exceeded the midpoint by $0.04, or 4.6%, and the upper end by $0.02. However, the latest pre-release qualitative baseline was more demanding than the July midpoint. At the September 9 Citi conference, management indicated that Q3 sales were tracking at the high end of, or slightly above, the July range and that the $20 billion annualized run rate should be achieved in Q3. Accordingly, the results exceeded the original formal range, but part of that improvement had already been communicated.
The distinction matters for assessing the earnings catalyst. Achieving a $20.3 billion annualized sales rate was meaningful operational execution, but not an entirely new positive surprise on October 27. Similarly, management had already indicated in September that Q4 should be larger than Q3 and that high-teens growth should continue. The new information was principally the precise Q4 earnings range, the magnitude of optical outperformance, the absence of the expected solar recovery, and the detailed explanation of customer-funded expansion.
GAAP results also improved materially. Revenue increased 18.4% to $4.855 billion, net income attributable to Corning increased to $680 million from $430 million, and diluted EPS increased to $0.78 from $0.50. GAAP operating margin increased to 18.8% from 14.4%. The improvement was therefore not confined to management’s adjusted presentation. Nevertheless, core sales exceeded GAAP sales by $226 million, and core EPS exceeded GAAP EPS by $0.13, making the reconciliation important rather than incidental.
A significant comparability qualification is that Corning changed its core currency methodology effective April 1, 2026. Previously, management-determined constant-currency rates were applied to relevant exposures even when those exposures were not fully hedged. The new methodology applies contractual hedge rates only to the portion actually hedged, leaving unhedged exposure at GAAP exchange rates. Prior-year core results were not recast onto the new methodology. Corning states that applying the current methodology to the comparative 2025 periods would have produced higher reported year-over-year core growth. This does not invalidate the growth, but it means the reported core comparisons are not fully constant-methodology comparisons.
Q4 GUIDANCE AND THE IMPLIED 2026 FINISH
Q4 guidance calls for core sales of $5.2 billion to $5.3 billion and core EPS of $0.96 to $1.00. The revenue midpoint of $5.25 billion is approximately 1.0% above the supplied Bloomberg consensus of $5.2 billion. The EPS midpoint of $0.98 is approximately 5.4% above consensus of $0.93, and even the lower end exceeds consensus by approximately 3.2%. The guidance surprise is therefore more earnings-led than revenue-led.
Relative to Q3, midpoint guidance implies approximately 3.3% sequential sales growth and 7.7% sequential EPS growth. That combination suggests continued operating leverage, favorable mix, or other earnings benefits rather than a need for an exceptionally large sequential revenue acceleration. However, no quantified Q4 segment-margin, tax-rate, or share-count bridge was provided on the call. The higher EPS range should not be attributed entirely to optical margin expansion without those details.
Management expects Optical Communications to generate the majority of Q4 growth, with solar also contributing revenue as capacity becomes productive. The expected segment pattern is broadly similar to Q3. Display-glass price increases are not expected to contribute materially in Q4, and management described solar profitability improvement as gradual. Consequently, the near-term earnings case is not dependent on an immediate broad recovery across the portfolio. It is primarily an optical execution and consolidated leverage case.
Combining reported Q1 through Q3 core sales with Q4 guidance produces a mechanical 2026 revenue range of $19.364 billion to $19.464 billion. Summing quarterly core EPS produces approximately $3.35 to $3.39, subject to differences in quarterly and annual weighted-average shares. These are analytical implications of the disclosed quarterly figures, not a separately issued full-year guidance range.
The Q4 revenue range corresponds to an annualized exit rate of $20.8 billion to $21.2 billion. That should not be confused with recognized 2026 revenue. Likewise, annualizing midpoint Q4 EPS produces $3.92, but that is a quarterly earnings pace, not management’s 2027 EPS forecast.
MARGIN EXPANSION AND EARNINGS QUALITY
Core gross margin increased to 40.5% from 39.0% a year earlier and 39.6% in Q2. Core operating margin increased to 22.7% from 19.6% a year earlier and 20.9% in Q2. Core operating income increased $314 million to $1.152 billion on $809 million of additional revenue, implying a consolidated year-over-year incremental operating margin of approximately 38.8%. This is strong evidence that additional revenue is carrying attractive economics.
The operating-margin improvement came from both gross profitability and expense leverage. Core gross profit increased $395 million, while combined core selling, general and administrative expenses and research, development and engineering expenses increased only $81 million, to $907 million. Those operating expenses grew approximately 9.8%, versus revenue growth of 18.9%. Roughly half of the approximately 310-basis-point operating-margin expansion came from gross-margin improvement and half from lower operating expenses relative to revenue.
The quarter nevertheless requires a more nuanced interpretation than uniformly improving segment profitability. Aggregate segment net income increased from $741 million to $892 million, a gain of $151 million, whereas consolidated core net income increased $210 million. The arithmetic residual between segment earnings and consolidated core earnings improved by $59 million, from negative $156 million to negative $97 million. That residual improvement represents approximately 28% of consolidated core net income growth. It is not a clean measure of corporate overhead because it can include multiple reconciliation items, but it confirms that below-segment effects were meaningful.
The analyst question about corporate costs was therefore economically relevant. Management rejected the suggestion of unusual allocation changes and emphasized that variable compensation remained above normalized levels, should not accelerate in Q4, and would reset in the subsequent year. That response supports continued expense leverage but does not fully reconcile the $59 million residual improvement. The quarter should not be characterized as entirely segment-driven, nor should the full residual benefit be assumed to recur.
Core return on invested capital increased to 16.7%, versus 13.4% a year earlier and 14.9% in Q2. This is encouraging given the capital-spending ramp. However, Corning calculates this measure by annualizing quarterly after-tax core operating income, including core equity earnings, against equity plus long-term debt. It is not a completed-project return or a cash-based return across an entire investment cycle. The improvement demonstrates a stronger current earnings-to-capital relationship, but it does not independently establish the ultimate economics of newly commissioned capacity.
OPTICAL COMMUNICATIONS: THE CENTRAL DRIVER
Optical Communications revenue increased 44.0% to $2.379 billion, versus $1.652 billion a year earlier and $2.072 billion in Q2. Segment net income increased 80.3% to $532 million. Net income margin reached approximately 22.4%, compared with 17.9% a year earlier and 21.1% in Q2. The year-over-year incremental segment net income margin was approximately 32.6%. That figure is after-tax segment profitability and should not be confused with the approximately 40% or higher pretax incremental margins referenced in the analyst question.
Optical represented 46.8% of consolidated core sales, up from 38.7% a year earlier. Its $727 million revenue increase accounted for approximately 90% of consolidated revenue growth. Its $237 million net income increase exceeded the company’s entire $210 million increase in core net income. Excluding optical, consolidated revenue grew only approximately 3.1%. Excluding both optical and solar, revenue declined approximately 1.5%. Corning is therefore becoming a much more concentrated optical growth investment despite retaining a diversified segment structure.
The acceleration was particularly strong in Enterprise Networks. Enterprise revenue grew 84%, compared with 65% growth in Q2, while Gen AI product sales grew more than 100%. Management stated that the enterprise sales run rate had increased from $1.4 billion at Springboard’s launch to approximately $6 billion. The strategic significance is that Corning is increasing content and value capture within AI infrastructure rather than simply participating in accelerator unit growth.
Management attributed the outperformance to broader and faster adoption of its innovations, supported by incremental capacity. The call also identified realized pricing as a contributor. Management stated, “Our overall price is going up,” and explained that new products allow Corning to earn “more revenue per element of capacity.” This is an important distinction. Revenue growth reflects a combination of physical capacity, product mix, customer adoption, and monetization of engineering value. It should not be modeled as fiber production volume multiplied by a constant commodity selling price.
The absence of a new formal optical margin target is understandable but limits visibility. Management described a progression from mid-teens segment net income margins into the low 20s and suggested further improvement remained possible. However, additional capacity can create startup costs, underutilized assets, commissioning expenses, and manufacturing-learning effects before revenue catches up. The current incremental margins support attractive economics, but a straight-line extrapolation of exceptional incrementals would understate the cost of sustaining growth.
DEMAND DURABILITY, CUSTOMER FUNDING, AND CAPACITY ALLOCATION
The call provided evidence of immediate demand strength but less proof of ultimate AI investment returns. Management described customers requesting “more of our new products, faster and broader.” It also indicated that the primary customers underpinning the expansion are major hyperscalers. That customer mix is generally more supportive of financing capacity than a customer base dominated by smaller, externally financed infrastructure developers. Nevertheless, the largest customers can still change deployment schedules, architecture choices, and capital-allocation priorities.
Management’s reference to an AI-model developer’s filing and inference economics should be treated as qualitative support rather than proof of industry-wide profitability. The filing referenced in the draft was not independently verified. More fundamentally, attractive inference-token economics do not necessarily establish attractive returns after training expense, depreciation, utilization losses, research spending, financing costs, and continuing hardware replacement. Corning’s strongest evidence is its own orders, customer commitments, funding receipts, and realized profitability, not an inference about the complete economics of AI services.
The customer-funded expansion mechanism is a genuine strategic advantage. Management explained, “We then simply return the cash to our customers as they purchase the committed volume.” Customer advances reduce the initial cash burden of expansion and can improve alignment between capacity decisions and customer requirements. Management also said that, excluding maintenance spending, the majority of capital investment is funded by the long-term agreements.
However, “funded” does not mean permanently paid for by customers without an offsetting obligation. Advances are returned as customers purchase products, so part of future product cash generation is committed to satisfying those advances. The mechanism changes cash timing, financing requirements, and risk sharing. It does not create additional lifetime product revenue beyond the economics of the underlying contracts.
The call did not disclose sufficient detail to establish that every agreement is an unconditional take-or-pay obligation. Cancellation provisions, refund conditions, minimum purchase requirements, customer remedies for delayed delivery, and pricing concessions were not quantified. Accordingly, customer funding reduces investment risk but does not eliminate manufacturing, counterparty, contractual, or technology risk.
Capacity allocation increasingly favors long-standing customers able to contribute funding. Management said allocation would shift toward customers with “the resources to help us fund that capacity.” This is economically rational and can improve customer credit quality, but it may also increase concentration among a small group of large buyers. Those customers provide valuable commitments while retaining significant negotiating power.
CARRIER AND DATA CENTER INTERCONNECT
Carrier revenue grew 4%, materially slower than Enterprise Networks. The current carrier result therefore does not yet demonstrate a broad demand acceleration of the magnitude visible inside data centers. The more important development is the expanding role of data center interconnect, supported by long-term relationships with carriers including Verizon, AT&T, Zayo, and Lumen.
Management stated that DCI would “clearly exceed both the timing and the magnitude” of the previously communicated $1 billion opportunity by the end of the decade. That is favorable, but the direction had already been indicated at the September conference. The October call reinforced the view without providing a replacement revenue target, annual recognition schedule, or margin profile. Announced multiyear contract values should not be converted into near-term revenue without those details.
High-density products strengthen the DCI proposition because they can place approximately 2x to 4x more fiber into existing conduit, according to management. The relevant customer value includes avoiding civil works, improving infrastructure utilization, and enabling faster bandwidth expansion. This creates a basis for premium pricing that is broader than the cost of the fiber itself. Nevertheless, fiber density per conduit is an engineering benefit, not an automatic equivalent increase in Corning revenue or customer spending.
Fiber-to-the-home remains a supporting growth driver, but management clearly identified DCI as the larger carrier opportunity. The Starlink discussion was directionally complementary: satellite connectivity still requires terrestrial network interfaces, and management indicated Corning has some direct content exposure. No material revenue contribution was quantified. Satellite-related opportunities should therefore remain secondary to the disclosed enterprise and DCI drivers.
OPTICAL SCALE-UP AND PHOTONICS
The call’s most consequential long-term technical discussion concerned the potential increase in optical content per accelerator. Management contrasted approximately 16 fibers per GPU in current scale-out architectures with approximately 160 fibers per GPU in an illustrative fully optical scale-up architecture. The investment significance is a potential order-of-magnitude increase in physical connectivity requirements, not merely growth in accelerator shipments.
Management reiterated the timing clearly: “We continue to be quite convicted that this accelerates in 2028.” This is consistent with the May framework rather than an acceleration of the timetable. It also separates the current earnings engine from the future opportunity. Q3 growth was achieved primarily through scale-out and existing product adoption; large-scale optical scale-up remains an additional driver whose timing and economics are not yet visible in reported earnings.
The 16-to-160 comparison should not be translated into a 10x revenue forecast. Actual revenue depends on adoption penetration, architecture, fiber length, connector configuration, component integration, customer sourcing, and Corning’s share of the relevant bill of materials. Shorter optical paths can require more connections without proportionate growth in fiber length. Different accelerators and network topologies can also have materially different content requirements.
An illustrative adoption calculation demonstrates both the leverage and the uncertainty. If the 16-fiber and 160-fiber architectures were directly comparable, 10% adoption of the higher-content configuration would increase weighted-average fiber count to 1.9x the original level. At 25% adoption, the weighted-average count would reach 3.25x. These are architecture sensitivities, not revenue forecasts, because they assume unchanged content definitions, market share, and monetization.
Corning’s May investor-event announcement separately identified a planned $10 billion Photonics revenue stream by 2030. This is a material component of the long-term opportunity, equivalent to approximately 25% of the $40 billion internal corporate target. It should not be added on top of that corporate objective, nor should the optical scale-up content discussion be treated as entirely unmodeled upside. Part of the opportunity is already embedded in management’s ambitions.
The key monitoring variables are product qualification, design wins, deployment timing, optical architecture selection, manufacturing yields, customer integration schedules, and realized content per deployed accelerator. Confidence in the direction of optical penetration is stronger than confidence in the exact annual revenue conversion.
GLASS INNOVATIONS: CONTENT RESILIENCE, BUT WEAKER PROFITABILITY
Glass Innovations revenue declined 3.5% to $1.506 billion, while net income declined 9.6% to $328 million. Net income margin fell to approximately 21.8%, from 23.3% a year earlier and 24.2% in Q2. Sequentially, revenue increased approximately 2.9% while net income declined 7.3%. The profitability deterioration is therefore more important than the modest year-over-year revenue decline alone.
Management reported TV units down 4% and notebook and handheld units down approximately 20%, attributing weakness to memory pricing. Corning’s revenue performance was substantially more resilient than those unit statistics, supporting the “More Corning” content strategy. However, these end-market percentages are not a weighted index of the segment’s revenue exposure. Differences in screen area, product mix, customer inventory, pricing, and advanced-glass content prevent a precise market-share or content-gain calculation from those figures.
The Apple relationship provides an important example of customer integration and manufacturing commitment. Management expects cover glass for worldwide iPhone and Apple Watch sales to be produced at Harrodsburg, Kentucky, by the end of 2026. This supports strategic relevance and supply-chain visibility, but domestic production consolidation should not automatically be treated as incremental demand. The earnings benefit depends on content, pricing, manufacturing efficiency, and whether Corning is capturing additional economic value rather than simply changing production location.
Display-glass price increases should begin in Q4, but management explicitly cautioned against expecting a significant Q4 benefit. The increases are directed principally at 2027 and beyond, addressing a weaker yen and higher materials and energy costs. No percentage increase was disclosed. Consequently, a full offset to currency and inflation should not be assumed.
The currency discussion was especially relevant because the release shows a Japanese yen hedge rate of approximately ¥120 per dollar, while the long-term plan uses ¥150. Hedge coverage declined from 98% in Q2 to 94% in Q3. Management rejected the suggestion that this represented a planned quarterly reduction. Nevertheless, a high hedge percentage does not permanently remove currency risk: contracts roll, rates change, and a residual exposure remains. The 2027 earnings bridge will depend on the interaction between hedge realizations, replacement hedge rates, pricing, and costs.
SOLAR: A MISSED RECOVERY MILESTONE
Solar revenue increased 36.7% year over year to $436 million, but declined slightly from $438 million in Q2. The segment recorded a $7 million net loss, unchanged sequentially and down from $30 million of net income a year earlier. Net income margin deteriorated from approximately 9.4% to negative 1.6%. The segment generated additional revenue year over year without converting that growth into profit.
This outcome missed a specific prior operating expectation. The July release stated that management expected an improving earnings contribution from solar beginning in Q3 after an extended maintenance shutdown and equipment upgrade. At the September conference, management also described continued quarter-over-quarter improvement and expected profitability at or above the corporate average by the end of 2027. Q3 did not demonstrate the anticipated sequential recovery.
On the current call, management said the Q3 drag was similar to Q2 and that improvement should occur “slowly” through 2027. When asked directly whether the end-2027 corporate-average margin objective remained intact, the response did not clearly reaffirm the original timing and relative-margin commitment. Instead, management emphasized gradual productivity improvement and the benefit if solar could exceed 20% profitability. This is a reduction in the precision and confidence of the commitment, although it is not an explicit withdrawal or a formally quantified guidance cut.
The distinction between absolute profit improvement and corporate-average margins is important. Corning’s current corporate operating margin is 22.7%. A solar operating margin of 20% would generate significant earnings but would still be below the current corporate average. It would reduce the present drag without necessarily making solar margin-accretive to the rest of the company.
The eventual opportunity remains material. Current quarterly revenue annualizes to approximately $1.744 billion, so reaching more than $3 billion requires over 72% growth from the present pace. At $3 billion of annual sales, a 20% operating margin would represent approximately $600 million of annual operating income. This is an illustrative mature-state sensitivity, not guidance, and it should not be compared directly with current segment net income because the profit measures differ.
Management repeatedly emphasized that Section 232 trade action improves the pricing environment and demand for domestically produced solar products. The favorable policy assessment is a company assertion supported by its commercial positioning, but the call did not quantify realized selling-price changes, customer pass-through, policy duration, or the portion of future profitability dependent on incentives and trade protection. Policy support can improve achievable returns; it cannot by itself solve yield, throughput, downtime, or commissioning problems.
Solar should therefore be treated as an execution-sensitive earnings option rather than a dependable near-term source of margin expansion. The first convincing recovery signal would be sequential improvement in both output and profitability without another shift in the stated recovery timetable.
AUTOMOTIVE AND LIFE SCIENCES
Automotive revenue increased 3.5% to $470 million, modestly above the supplied consensus of $464.4 million. Net income declined to $67 million from $68 million a year earlier and $82 million in Q2. Net income margin fell to approximately 14.3%, versus 15.0% a year earlier and 17.4% sequentially. Recovery in North American Class 8 trucks offset a weaker light-vehicle market, but the revenue resilience did not translate into earnings resilience. This is another example of the consolidated result masking divergent segment economics.
Life Sciences and Emerging Growth Businesses revenue increased approximately 1% to $290 million, while the net loss widened to $28 million from $15 million a year earlier and $21 million in Q2. Management attributed the deterioration to investment in emerging growth programs. Those investments may support future products, but no quantified return timetable was supplied. The segment is currently consuming earnings capacity generated elsewhere rather than providing an independent profit-growth engine.
CASH FLOW: STRONG, BUT THE DEFINITIONS AND TIMING MATTER
The $661 million described on the call as free cash flow is formally adjusted free cash flow. The release reconciles this to $1.061 billion of GAAP operating cash flow, plus $145 million of realized gains on translated earnings contracts and other items, less $545 million of capital expenditure. Conventional operating cash flow less capital expenditure was therefore $516 million. The additional hedge-related cash is economically relevant, but the difference between the measures must be preserved.
The reported adjusted measure also does not deduct $43 million of hedge premiums paid in Q3, which appear in investing cash flow. Deducting those premiums would produce $618 million. For the first 9 months, adjusted free cash flow of $2.272 billion would become $2.127 billion after deducting $145 million of hedge premiums. These are analytical alternatives, not replacements for Corning’s disclosed measure.
Q3 adjusted free cash flow increased 23.6% from $535 million a year earlier, despite capital expenditure increasing 63.2% from $334 million to $545 million. GAAP operating cash flow increased 35.3%. Those comparisons support genuine improvement in cash-generating capacity even as investment accelerated. Adjusted free cash flow was approximately 83% of quarterly core net income.
Customer funding was especially important to the year-to-date comparison, but not in the same way to Q3. The cash-flow statement line is labeled “customer deposits and government incentives,” rather than solely customer deposits. It contributed $639 million during the first 9 months, compared with a $49 million outflow in the comparable 2025 period. That $688 million swing accounted for approximately 53% of the $1.287 billion increase in year-to-date adjusted free cash flow.
Removing that combined line from both periods produces an illustrative year-to-date adjusted free cash flow measure of $1.633 billion versus $1.034 billion, still an increase of approximately 58%. This is not fully normalized cash flow because other working-capital movements and adjustments remain. Nevertheless, it shows that the cash improvement was not exclusively an advance-payment phenomenon.
The quarterly picture is particularly important. The same customer-deposit and government-incentive line was a $70 million outflow in Q3, compared with a $92 million outflow a year earlier. The quarter’s $661 million of adjusted free cash flow was therefore not boosted by a net inflow on that line. Excluding it would produce $731 million versus $627 million, or approximately 16.6% growth. A blanket criticism that the quarter’s cash generation was simply customer deposits would be incorrect.
Working capital still warrants scrutiny. Inventories absorbed $571 million of cash during the first 9 months, versus $266 million a year earlier, while accounts payable and other current liabilities provided $659 million, versus $391 million. Inventory accumulation may be appropriate during capacity expansion, but sustained growth without subsequent conversion into shipments would weaken cash quality.
Year-to-date capital expenditure of $1.299 billion against the approximately $2 billion full-year plan implies about $701 million of Q4 spending. That would represent another sequential increase from Q3. Management’s expectation of growing free cash flow through the investment cycle is credible enough to monitor, but no quantified 2027 or 2028 cash-flow target was provided.
CAPITAL ALLOCATION AND FINANCING
Management continues to prioritize organic growth, a strong balance sheet, and returning excess cash through share repurchases. Average debt maturity exceeding 20 years reduces near-term refinancing pressure and is useful for a company investing through long product and manufacturing cycles. However, long debt tenor does not protect equity holders from poor capital returns, delayed product adoption, or customer renegotiations.
The $2 billion at-the-market equity program was described as a contingency tool rather than an intended financing action. Management stated, “We have no intention of doing anything at this time.” The facility should therefore not be modeled as imminent dilution. Equally, the stated preference for buybacks should not be treated as an announced repurchase commitment with a defined amount or timetable. The cash-flow statement shows no treasury-stock purchases during the first 9 months of 2026.
The appropriate capital-allocation test is whether incremental manufacturing investment offers attractive returns after accounting for customer funding obligations, startup costs, replacement capital, and technology risk. Customer advances can reduce the need for corporate financing, but they should not justify returning cash that is economically required to complete committed capacity or fulfill future customer obligations.
SPRINGBOARD: HIGHER CREDIBILITY, NOT CERTAINTY
The original $20 billion year-end 2026 run-rate objective has been surpassed, and Q4 guidance implies approximately $21 billion at the midpoint. From that higher starting point, reaching $40 billion by the end of 2030 would require approximately 17.5% annualized growth rather than approximately 18.9% from a $20 billion base. This provides some mathematical cushion.
The nearer-term $30 billion 2028 objective remains demanding. Moving from a $21 billion exit rate in 2026 to $30 billion in 2028 requires approximately 19.5% annualized growth. Reaching $40 billion from $30 billion over the following 2 years requires approximately 15.5%. Thus, successful execution through 2028 remains central to the overall framework.
The May distinction between internal-plan targets and high-confidence targets remains essential. The lower $27 billion 2028 and $35 billion 2030 objectives represent different planning outcomes, not guaranteed floors. No new probability distribution was provided on the current call. Moreover, achieving 19% revenue growth in Q3 does not independently validate a multiyear 19% compound growth rate. A quarterly growth comparison and a sustained compound trajectory are different claims.
The strongest supporting evidence is the combination of realized optical growth, rising margins, expanded customer agreements, and improving cash generation. The principal unresolved variables are the pace of optical scale-up, monetization of Photonics, manufacturing productivity, the longevity of favorable customer funding terms, solar execution, and currency-related profit protection.
VALUATION AND SCENARIO ANALYSIS
The Bloomberg reference price of $123.04 places a meaningful burden on future execution. Mechanically implied 2026 core EPS of approximately $3.37 corresponds to a 36.5x multiple. Annualized Q4 midpoint EPS of $3.92 corresponds to 31.4x. Neither calculation is a complete valuation, but both demonstrate that the shares already discount substantial growth beyond the current reporting period.
An illustrative 12-month valuation framework uses 2027 operating assumptions rather than applying a multiple directly to the distant $40 billion revenue objective. The scenarios assume approximately 875 million diluted shares, a 20% effective tax rate, $400 million of annual net nonoperating deductions, and $250 million of annual noncontrolling-interest deductions after tax. These are analytical assumptions, not management guidance. They exclude incremental ATM issuance and material buybacks. Probabilities are judgmental rather than statistically estimated.
The base case, assigned a 55% probability, assumes 2027 revenue of $23.5 billion and a 23.5% core operating margin. That produces approximately $5.52 billion of operating income and $4.40 of EPS under the stated assumptions. A 28x earnings multiple implies approximately $123 per share, essentially unchanged from the observed price. This case assumes continued strong scale-out and DCI demand, incremental optical capacity, gradual solar improvement, and no major deterioration in the remaining businesses. Revenue growth would be approximately 21% against the mechanically implied 2026 midpoint.
The bull case, assigned a 25% probability, assumes 2027 revenue of $25.5 billion and a 25.5% operating margin, producing approximately $6.50 billion of operating income and $5.29 of EPS. A 34x multiple implies approximately $180 per share, or 46% upside. This requires materially faster capacity monetization, sustained premium-product adoption, stronger solar productivity, and investor willingness to retain a high multiple as optical scale-up approaches. It does not require large-scale 2027 scale-up revenue, but it does require stronger execution than the base case.
The bear case, assigned a 20% probability, assumes 2027 revenue of $20.5 billion and a 20% operating margin, producing approximately $4.10 billion of operating income and $3.10 of EPS. A 22x multiple implies approximately $68 per share, or 45% downside. This scenario does not require an industry collapse. It assumes a substantial growth slowdown, deployment delays, less favorable product mix, continuing solar inefficiency, and some compression of the valuation premium. Revenue would still exceed the mechanically implied 2026 total, but average quarterly sales would fall below the guided Q4 2026 exit pace.
The probability-weighted value is approximately $126 per share, representing only about 2.7% price upside before dividends and transaction costs. That result is sensitive to the selected probabilities and valuation multiples, but it illustrates the central investment issue: strong operating growth can coexist with limited expected equity return when the starting valuation already anticipates much of the improvement.
The resulting recommendation is to avoid increasing exposure near $123 solely because of this quarter. Existing positions should remain sized as concentrated AI infrastructure exposure rather than as defensive diversified industrial exposure. A prospective entry around $105 to $110 would provide a more attractive cushion under the same scenario assumptions, provided the operating evidence remains intact. For such an entry, an initial position of approximately 0.5% of portfolio net asset value, capped at 1.0% before additional execution evidence, would be consistent with the remaining uncertainty. A 12% price-based loss limit would imply approximately 6 basis points of portfolio loss at the initial size and 12 basis points at the maximum size, excluding gap risk. At a $107.50 entry, that corresponds to approximately $94.60.
The position should be reduced or exited before that price limit if the fundamental thesis breaks. Relevant triggers include customer-funded capacity no longer converting into shipments, optical profitability deteriorating materially without a credible temporary ramp explanation, a meaningful deferral of the 2028 scale-up timetable, persistent solar losses despite additional capacity, or weakening cash generation after separating advance-payment timing. Conversely, sustained optical growth with stable or improving margins, measurable solar recovery, and durable cash conversion would justify revisiting the base-case earnings trajectory.
PORTFOLIO IMPACT AND NEAR-TERM CATALYSTS
Corning’s changing revenue mix increases its correlation with hyperscaler capital expenditure, accelerator deployment, data-center construction, and optical networking investment. Customer and product exposure differs from that of GPU, switching, and active-optical suppliers, but the underlying spending cycle overlaps. A portfolio already heavily exposed to AI infrastructure should not assume that Corning offers substantial economic diversification merely because it also owns glass, automotive, and solar businesses.
The nearest disclosed investor event is the UBS Global Technology and AI Conference on December 1. Potentially useful updates include a revised DCI opportunity, customer-funding detail, and solar productivity indicators. The next earnings report should test delivery of $5.2 billion to $5.3 billion in Q4 sales and $0.96 to $1.00 in EPS, alongside the implied increase in capital spending. During 2027, the principal catalysts are display-price realization, solar throughput and profitability, and continued optical capacity conversion. The larger technology catalyst remains optical scale-up acceleration beginning in 2028.
The quarter’s central conclusion is that Corning is successfully monetizing the present AI infrastructure buildout while establishing potentially valuable positions in the next architecture transition. The principal investment constraint is not a lack of growth opportunities. It is the combination of elevated valuation, increasing optical concentration, unresolved solar execution, and the risk that investors capitalize distant opportunities before their economics are demonstrated.
SOURCE BASIS AND LIMITATIONS
The analysis uses the supplied October 27, 2026 initial draft earnings-call transcript and Bloomberg earnings notice; Corning’s October 27 earnings release and accompanying financial reconciliations; the July 28 earnings release; the May 6 Springboard announcement; the September 9 Citi conference transcript; and a Bloomberg quote retrieved at 13:57:59 UTC on October 27. Historical segment comparisons use Corning’s recast reporting structure. The supplied draft contains apparent transcription and speaker-labeling errors, so uncertain Q&A quotations are attributed to management collectively. Scenario valuations, probabilities, normalized cash-flow illustrations, and portfolio parameters are analytical judgments rather than company guidance.
COMPANY EMPLOYEES ON THE CALL
• Christopher Keenan, Director, Investor Relations. • Edward A. Schlesinger, Executive Vice President and Chief Financial Officer. • Wendell P. Weeks, Chairman, Chief Executive Officer and President.
RESEARCH ANALYSTS ON THE CALL
• Josh Spector, UBS. • Asiya Merchant, Citi. • Meta Marshall, Morgan Stanley. • Mark Bateman, J.P. Morgan, participating on behalf of Joseph Cardoso. • Wamsi Mohan, Bank of America. • George Notter, Wolfe Research. • Matt Nicknam, Truist. • Martin Yang, Oppenheimer. • John Roberts, Mizuho.
Key Read-Throughs
KEY READ-THROUGHS FROM CORNING’S Q3 2026 EARNINGS CALL
Corning’s results point to an increasingly uneven technology investment cycle: AI connectivity demand is expanding through higher content, greater network density, and premium products, while rising component costs are suppressing consumer-device volumes. The strongest positive implications concern optical interconnect suppliers, active optical components, and operators monetizing existing fiber infrastructure. The strongest negative implications concern PC manufacturers and display producers facing simultaneous demand and procurement pressure. The critical distinction is between growth in infrastructure content and growth in underlying equipment units. Corning’s performance supports higher networking expenditure per accelerator, not an equivalent acceleration in GPU shipments or a universal earnings upgrade across technology. The following read-throughs have high conviction on the direction of the economic mechanism; magnitude assessments describe fundamental exposure, not predicted share-price moves.
OPTICAL CONNECTIVITY AND AI NETWORKING
HIGH-DENSITY CONNECTIVITY CAPTURES MORE VALUE PER DEPLOYMENT, FAVORING SPECIALISTS OVER COMMODITY FIBER EXPOSURE (READ-THROUGH 1)
Affected companies: Amphenol (APH: United States); Fujikura (5803: Japan).
Directional impact and magnitude: Positive. Material for the relevant optical-connectivity businesses and potentially meaningful at the consolidated level, but not a basis for transferring Corning’s growth or margins directly to either company.
Call evidence: Optical Communications revenue increased 44%, Enterprise Networks revenue increased 84%, and Gen AI product sales increased more than 100%. Management attributed the performance to faster and broader adoption of its innovations, explicitly noting that growth exceeded GPU unit growth. Management also stated, “Our overall price is going up,” and explained that new products generate “more revenue per element of capacity.”
The transmission mechanism is higher connectivity content and greater engineering value per installation. More densely connected AI clusters require additional fiber assemblies, connectors, termination systems, and increasingly demanding cable-management solutions. Products that reduce installation space, labor, and deployment time can capture value beyond their raw-material content. This supports revenue growth through both physical demand and product mix, rather than requiring accelerator shipments to grow at the same rate.
Amphenol is a particularly relevant listed exposure because the acquired CommScope Connectivity and Cable Solutions assets now sit within its earnings base. Its July earnings call identified IT datacom as 43% of group sales and described advanced optical interconnect as a major growth driver within the acquired business. Fujikura has directly applicable high-density technology, including its commercialized 4,000-fiber SWR/WTC cable for Japanese data centers. These are verified product exposures, not inferred awards from Corning’s customer agreements.
The incremental insight is that capacity measured in fiber volume can understate revenue opportunity when customers migrate toward higher-value connectivity systems. Conversely, owning commodity fiber capacity alone is insufficient. Corning emphasized integration, manufacturing capabilities, customer co-development, and long-term relationships as competitive advantages. That supports differentiation within the cable sector rather than a blanket positive view on all fiber producers.
Near-term catalyst: Amphenol’s forthcoming Q3 results and the November Japanese earnings cycle provide opportunities to test whether order conversion, optical mix, and capacity availability support stronger forward expectations. Amphenol had already guided for strong sequential IT datacom growth, so Corning’s results corroborate an established trend rather than establish an entirely new thesis.
Longer-duration implication: Through 2027 and beyond, increasing connectivity complexity can sustain growth above underlying equipment-unit growth. However, Corning’s customer commitments belong to Corning. They cannot be assigned to competitors, and fiber shortages can constrain downstream assembly suppliers as well as benefit upstream producers.
ACTIVE OPTICS HAVE A CURRENT SCALE-OUT GROWTH ENGINE, WITH SCALE-UP PROVIDING A LATER OPPORTUNITY (READ-THROUGH 2)
Affected companies: Lumentum Holdings (LITE: United States); Coherent (COHR: United States).
Directional impact and magnitude: Positive. Potentially substantial for datacenter optical components and systems; significant consolidated relevance for both companies. The immediate implication is stronger demand durability, not a mechanically calculable revenue beat.
Call evidence: Management emphasized that current optical growth is driven by scale-out. It contrasted approximately 16 fibers per GPU in current architectures with approximately 160 in an illustrative fully optical scale-up configuration, while reiterating, “We continue to be quite convicted that this accelerates in 2028.”
The transmission mechanism runs through optical endpoints, bandwidth, and component complexity. Expanding optical networks require the lasers, receivers, optical engines, and transceiver systems that transmit and recover signals. Lumentum and Coherent participate in these active optical layers, whereas Corning’s disclosed growth primarily validates the passive connectivity and physical-network expansion supporting them.
The most important implication is that current earnings growth does not require immediate mass adoption of optical scale-up. Existing scale-out deployments are already producing exceptional connectivity demand. That supports the runway for active optics used in today’s networks, while scale-up creates an additional market rather than the sole justification for current investment.
The 2028 timing should not be interpreted as the first possible revenue from in-rack optics. Lumentum’s August release already disclosed increasing demand for high-power co-packaged-optics lasers, an initial external-laser-source module order, and near-packaged-optics engagements. Corning’s statement concerns acceleration of adoption, not the absence of early commercial activity. This distinction prevents both premature revenue extrapolation and an erroneous conclusion that all emerging optical products remain commercially irrelevant until 2028.
Near-term catalyst: Coherent’s November 4 results and the upcoming Lumentum fiscal Q1 reporting cycle should clarify capacity conversion, optical product mix, and forward demand. Their prior disclosures already described strong AI-related demand, so the value of Corning’s call is independent ecosystem confirmation and evidence that demand remained strong through the September quarter.
Longer-duration implication: Optical penetration increases the addressable market, but it does not preserve every existing product architecture. Co-packaged optics can shift value between pluggable modules, optical engines, and external lasers. The high-conviction conclusion is increased demand for optical functionality, not permanent protection of every current module format. The 16-to-160 fiber comparison also cannot be converted into a 10x revenue forecast for either supplier.
SCALE-OUT NETWORKING DEMAND REMAINS STRONG WITHOUT REQUIRING AN EARLY SCALE-UP INFLECTION (READ-THROUGH 3)
Affected company: Arista Networks (ANET: United States).
Directional impact and magnitude: Positive, with moderate incremental importance to near-term expectations and substantial relevance to the longer-term AI networking opportunity.
Call evidence: Enterprise Networks revenue increased 84%, Gen AI product sales more than doubled, and management stated that current growth remains driven by scale-out. Customers continued to request “more of our new products, faster and broader.”
The transmission mechanism is demand for the network connecting accelerators and compute clusters. More extensive optical fabrics require switching capacity, network operating software, telemetry, congestion management, and deployment engineering. Arista participates through its datacenter networking systems and software, including its October 7 announcement of open Ethernet rack-scale architectures addressing scale-up and scale-out applications.
The actionable point is that the present networking investment cycle is not waiting for optical scale-up. Corning’s results support continued deployment of the larger fabrics that underpin Arista’s existing opportunity. The evidence is stronger for the persistence of networking expenditure than for a particular protocol or supplier’s share.
That limitation is essential. Corning sells connectivity used across different architectures. Its fiber growth does not establish Ethernet share gains over InfiniBand, prove Arista wins against competing systems, or imply an identical increase in switch ports. Fiber count, link speed, topology, and switching capacity do not move in fixed proportions.
Near-term catalyst: Arista reports Q3 results on November 3. Its August release already guided to approximately $3.3 billion of Q3 revenue following 37.7% Q2 revenue growth. Corning therefore supports the demand backdrop behind that outlook rather than independently establishing a beat. The more useful trading signal will be the subsequent-quarter outlook, delivery constraints, and evidence of customer acceptance and revenue conversion.
Longer-duration implication: Increasing network complexity can make system-level performance and software execution more valuable. The call supports a durable networking opportunity, but not an indiscriminate upgrade to every AI hardware supplier. Portfolio exposure to Arista, optical components, and connectivity assemblies remains correlated through the same hyperscaler deployment cycle.
TELECOMMUNICATIONS AND DATA CENTER INTERCONNECT
EXISTING CONDUIT BECOMES MORE VALUABLE AS HIGH-DENSITY FIBER EXPANDS ITS EARNING CAPACITY (READ-THROUGH 4)
Affected company: Lumen Technologies (LUMN: United States).
Directional impact and magnitude: Positive. Material to the strategic value and potential economics of Lumen’s intercity network; moderate near-term earnings significance because construction, activation, and revenue recognition take time.
Call evidence: Management said carrier customers want newer products because they can fit approximately 2x to 4x more fiber into existing conduit. It also stated that DCI would “clearly exceed both the timing and the magnitude” of Corning’s previously communicated $1 billion opportunity by the end of the decade.
The transmission mechanism is improved monetization of existing network infrastructure. Rights-of-way, conduit, permitting, and construction are costly and time-consuming to replicate. Installing more fiber within existing routes can expand sellable connectivity without proportionately increasing civil-engineering expenditure. The economic benefit therefore extends beyond lower cable cost to faster deployment and better utilization of embedded infrastructure.
Lumen has a verified relationship with Corning involving next-generation fiber for its intercity network and Private Connectivity Fabric. Its previously disclosed architecture uses existing conduit alongside new network construction. The read-through is consequently more direct than a generic positive view on telecom spending.
The non-obvious implication is that AI networking demand can increase the value of existing physical infrastructure even while conventional telecom services remain mature or declining. Carrier growth of only 4% at Corning also argues against interpreting the call as evidence of a broad telecom recovery. The attractive opportunity is concentrated in DCI and specific network assets.
Near-term catalyst: Lumen reports Q3 results on November 4. The relevant measures are contracted-project conversion, customer activation, construction milestones, cash funding, and the relationship between incremental investment and recognized revenue. Corning’s commentary validates deployment economics, but it is not a new Lumen contract announcement. The larger DCI opportunity had also been discussed before this call.
Longer-duration implication: Through 2027 to 2028, high-density deployment can improve the return on existing routes and support network-service growth. However, 2x to 4x more fiber per conduit does not mean 2x to 4x more revenue or profit. Utilization, pricing, customer concentration, and construction obligations remain decisive. Corning’s customer-funding discussion also reinforces that supplier cash receipts can correspond to earlier cash commitments elsewhere in the chain; financing risk is redistributed rather than eliminated.
PERSONAL COMPUTERS AND MEMORY
PC REVENUE CAN RISE WHILE THE UNDERLYING UNIT AND MARGIN ECONOMICS DETERIORATE (READ-THROUGH 5)
Affected company: HP Inc. (HPQ: United States).
Directional impact and magnitude: Negative. Material for Personal Systems volume and margin expectations, with meaningful consolidated earnings sensitivity. The call does not independently establish a miss against HP’s existing guidance.
Call evidence: Corning reported that notebook and handheld units declined approximately 20%, with those markets “significantly impacted by memory prices.” Glass Innovations sales declined only 3%, illustrating that a supplier benefiting from higher content can appear resilient while underlying device demand weakens substantially.
The transmission mechanism is a procurement-cost and demand-elasticity squeeze. Higher memory costs increase the bill of materials. Passing those costs through can raise device prices and reduce unit demand; absorbing them protects volumes at the expense of gross profit. Either outcome can weaken operating leverage in a relatively low-margin hardware business.
HP’s already-reported fiscal Q3 results demonstrate why revenue alone is an inadequate measure of health. Personal Systems revenue increased 18%, but total units declined 16%, and the segment operating margin was 4.6%. Corning’s September-quarter commentary extends the evidence of weak device volumes rather than predicting that already-reported HP quarter. The incremental concern is that persistent component inflation limits the pace of a subsequent margin recovery.
The distinction between consumer and enterprise spending also matters. Strong AI infrastructure expenditure does not imply a synchronized refresh cycle in end-user PCs. Memory suppliers and AI infrastructure vendors can capture a greater share of technology budgets while device affordability worsens.
Near-term catalyst: HP’s fiscal year-end results and initial fiscal 2027 outlook should establish whether pricing, mix, and procurement actions can offset the unit pressure. The most important indicators are Personal Systems margins, units, channel inventory, and memory-cost assumptions rather than nominal revenue growth.
Longer-duration implication: During 2027, recovery requires either more affordable memory, greater customer willingness to pay, or enough product differentiation to protect both price and volume. Counterevidence must be retained: HP raised its full-year outlook after fiscal Q3. Corning’s call strengthens the operating-risk assessment but does not justify treating previously recognized cost pressure as a new, automatic guidance cut.
MEMORY PRICING POWER IS BEING CONFIRMED DOWNSTREAM, BUT DEMAND DESTRUCTION IS A REAL LIMIT (READ-THROUGH 6)
Affected company: Micron Technology (MU: United States).
Directional impact and magnitude: Positive for near-term pricing durability, with moderate incremental significance to earnings expectations. Negative for the assumption that consumer memory demand can absorb indefinitely higher prices without adjustment.
Call evidence: Corning explicitly linked approximately 20% declines in notebook and handheld units to memory prices, while simultaneously reporting more than 100% growth in Gen AI connectivity products.
The transmission mechanism is a transfer of economic value toward a constrained input supplier. The fact that downstream manufacturers are reporting material demand effects from memory prices provides independent evidence that pricing pressure is commercially significant. For Micron, stronger realized prices can support revenue and gross profit even when some consumer-device categories contract.
The important distinction is between device units, memory bits, and memory revenue. A decline in notebook shipments does not necessarily produce an equal decline in aggregate memory demand because capacity per device and datacenter consumption can change. Conversely, strong pricing does not establish healthy consumer bit demand. Corning provides evidence of downstream affordability pressure, not a complete DRAM or NAND supply-demand balance.
Micron had already reported fiscal 2026 results before Corning’s call and expressed confidence in fiscal 2027, supported in part by strategic customer agreements. Corning therefore corroborates the pricing environment rather than creates a fresh forecast for a completed Micron quarter. It does not quantify an incremental Micron selling-price increase or distinguish the effects across DRAM, NAND, and high-bandwidth memory.
Near-term catalyst: Late-2026 and early-2027 pricing negotiations, shipment commentary, and fiscal 2027 guidance updates will show whether pricing strength continues to outweigh weaker consumer volumes. Corning’s evidence is more supportive of existing pricing assumptions than of raising unit-demand forecasts.
Longer-duration implication: The memory cycle can remain favorable while downstream hardware economics deteriorate, creating meaningful cross-portfolio divergence. However, persistent affordability pressure eventually encourages lower specifications, deferred replacements, and inventory adjustment. The high-conviction positioning implication is to distinguish upstream pricing exposure from downstream device-volume exposure, not to treat all technology demand as moving together.
DISPLAY PANELS AND CONSUMER ELECTRONICS
GLASS PRICE IMPLEMENTATION ADDS A 2027 COST HEADWIND TO WEAK DISPLAY END MARKETS (READ-THROUGH 7)
Affected company: BOE Technology Group (000725: China).
Directional impact and magnitude: Negative for display manufacturing economics before mitigation. Moderate potential earnings significance, but no defensible company-specific EPS reduction can be calculated from the disclosed information.
Call evidence: Corning reported TV units down 4% and notebook and handheld units down approximately 20%. Management said display-glass price increases would begin taking effect in Q4 but were “really geared around 2027 and beyond,” addressing a weaker yen and rising input costs.
The transmission mechanism is pressure on a key manufacturing input at a time when downstream demand limits pricing flexibility. BOE has a verified, long-standing display relationship with Corning, reinforced by the companies’ May 2026 strategic-collaboration announcement. Higher glass procurement costs can reduce panel margins unless offset by panel-price increases, supplier negotiations, currency movements, manufacturing efficiencies, or favorable product mix.
Corning’s September 11 announcement provides useful scope beyond the call: the adjustment was 15% or more for yen-denominated display-glass products, varying by product and generation size. That is not a 15% increase in BOE’s total manufacturing cost, nor necessarily a 15% increase in its renminbi procurement cost. BOE’s supplier mix, contract currency, hedging, and effective purchase-price changes were not disclosed.
The more actionable insight is timing. A relatively limited Q4 impact should not be interpreted as disappearance of the issue. Corning explicitly placed the intended economic effect in 2027. Forecasts assuming a clean display-margin recovery should therefore incorporate the possibility that substrate costs rise before panel selling prices fully adjust.
Near-term catalyst: Year-end procurement negotiations, panel pricing, and 2027 margin commentary are the relevant events. This is implementation confirmation of an announced increase, not a new price announcement on October 27. Corning’s end-market statistics also do not establish an equivalent decline in BOE shipments because panel area, product mix, and market share can offset weaker device units.
Longer-duration implication: Concentrated, technically demanding upstream materials can retain pricing leverage even when downstream manufacturing is competitive. The geographic signal is that substantial production and customer relationships in China do not insulate panel makers from supplier currency economics and globally negotiated input prices.
SOLAR MANUFACTURING
PROVEN US MODULE CAPACITY BECOMES MORE VALUABLE WHEN TRADE PROTECTION COINCIDES WITH SLOW DOMESTIC RAMPS (READ-THROUGH 8)
Affected company: First Solar (FSLR: United States).
Directional impact and magnitude: Positive, with moderate significance for future booking economics and competitive positioning, but limited direct support for an immediate quarterly earnings upgrade.
Call evidence: Corning reported solar revenue growth of 37%, but production ramped “at a slower pace than anticipated,” and the segment remained loss-making. Management said Section 232 action improved the pricing environment and demand for US-made solar products. It also described profitability improvement as gradual through 2027.
The transmission mechanism combines a higher effective competitive price for imports with slower-than-planned expansion of domestic alternatives. Trade protection increases the value of qualified US supply, while manufacturing delays limit how rapidly new domestic entrants can satisfy that demand. Existing productive capacity can therefore become more valuable than announced nameplate capacity.
First Solar is a relevant beneficiary because its thin-film technology does not depend on the crystalline-silicon polysilicon-to-wafer production chain that Corning is ramping. Corning’s operating difficulties therefore do not imply the same manufacturing problem at First Solar. First Solar also publicly supported the August Section 232 action, confirming that management viewed the policy as favorable to its competitive position.
The incremental insight is not simply that tariffs help domestic manufacturers. It is that favorable policy and strong demand do not guarantee usable supply or profitable production. Corning’s delayed recovery strengthens the distinction between established production capability and future capacity commitments. This favors proven execution rather than indiscriminate exposure to domestic solar announcements.
Near-term catalyst: First Solar reports Q3 results on October 29. The most relevant indicators are new bookings, realized contractual economics, cancellation behavior, domestic production execution, and customer discussions for future delivery periods. Its previously reported 45.1 GW contracted backlog means stronger market pricing should not be applied automatically to all existing contracted sales.
Longer-duration implication: The benefit is principally stronger demand for future delivery slots and potentially more resilient booking prices during 2027 and later periods. It is not an automatic repricing of the existing backlog. The counterweight is eventual competitive supply: successful Corning and other domestic ramps could reduce scarcity over time. The positive conclusion applies to current qualified capacity and future contracting economics, not to a permanent shortage or immunity from First Solar’s own execution risks.
SOURCE BASIS
Corning’s October 27, 2026 earnings call and accompanying results provide the principal evidence. Company disclosures used to verify exposures and distinguish new information from previously reported developments include Amphenol’s July earnings commentary; Fujikura’s high-density cable announcement; Arista’s August results and October product announcement; Lumentum’s and Coherent’s August results; Lumen’s customer relationship and investor-day disclosures; HP’s August results; Micron’s September results; Corning’s May BOE collaboration and September display-pricing announcement; and First Solar’s July results and August trade-policy statement. All read-throughs are limited to information available by October 27, 2026.
Report record
- Sector
- Information Technology
- Industry
- Electronic Equipment, Instruments & Components
- Fiscal period end
- September 30, 2026
- Report date
- October 27, 2026
- Analysis
- 5982 words
- Read-throughs
- 3214 words
- Content fingerprint (PDF)
20a25f0b4ab0- Content fingerprint (analysis)
e6e9e4a4cce9- Content fingerprint (read-throughs)
db0e02a65d6e
Prepared from the company's earnings release and earnings call transcript. Figures as reported by the company. For information only. Not investment advice.
More from Corning Incorporated
No other reports yet.
All Corning Incorporated reports
More in Information Technology
A substantive forward upgrade, not merely the incorporation of an already completed quarter
Strong operating quarter, but a licensing-heavy beat
All Information Technology reports
Follow @AtlasPeakRes on X for new earnings reports as they publish.