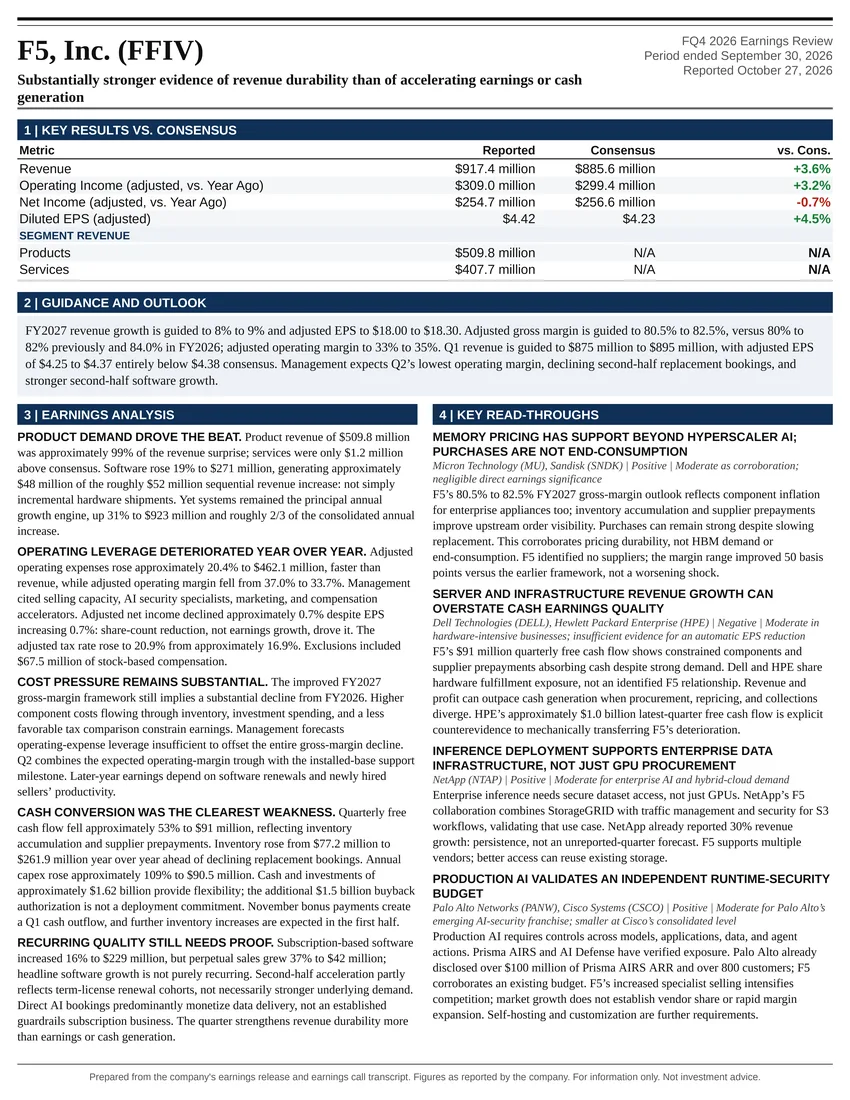
Substantially stronger evidence of revenue durability than of accelerating earnings or cash generation
Earnings Reports
Cadence Design Systems, Inc. FQ3 2026 Earnings Report
Cadence Design Systems, Inc. (CDNS) FQ3 2026 earnings: A substantive forward upgrade, not merely the incorporation of an already completed quarter. Full earnings analysis, key read-throughs, and the one-page exhibit from Atlas Peak Research.
Cadence Design Systems, Inc. (CDNS)
Sector: Information Technology · FQ3 2026 · Period end September 30, 2026 · Reported October 26, 2026
Cadence’s Q3 2026 results support higher earnings estimates and strengthen the evidence that AI is expanding demand for its underlying engineering software, rather than simply creating an incremental product category.
Download the one-page report (PDF)
View one-page exhibit
Download analysis (.md)
Download read-throughs (.md)
Post to X
One-Page Exhibit
Earnings Analysis
EXECUTIVE CALL SUMMARY: Cadence Design Systems Inc. (10/26/26)
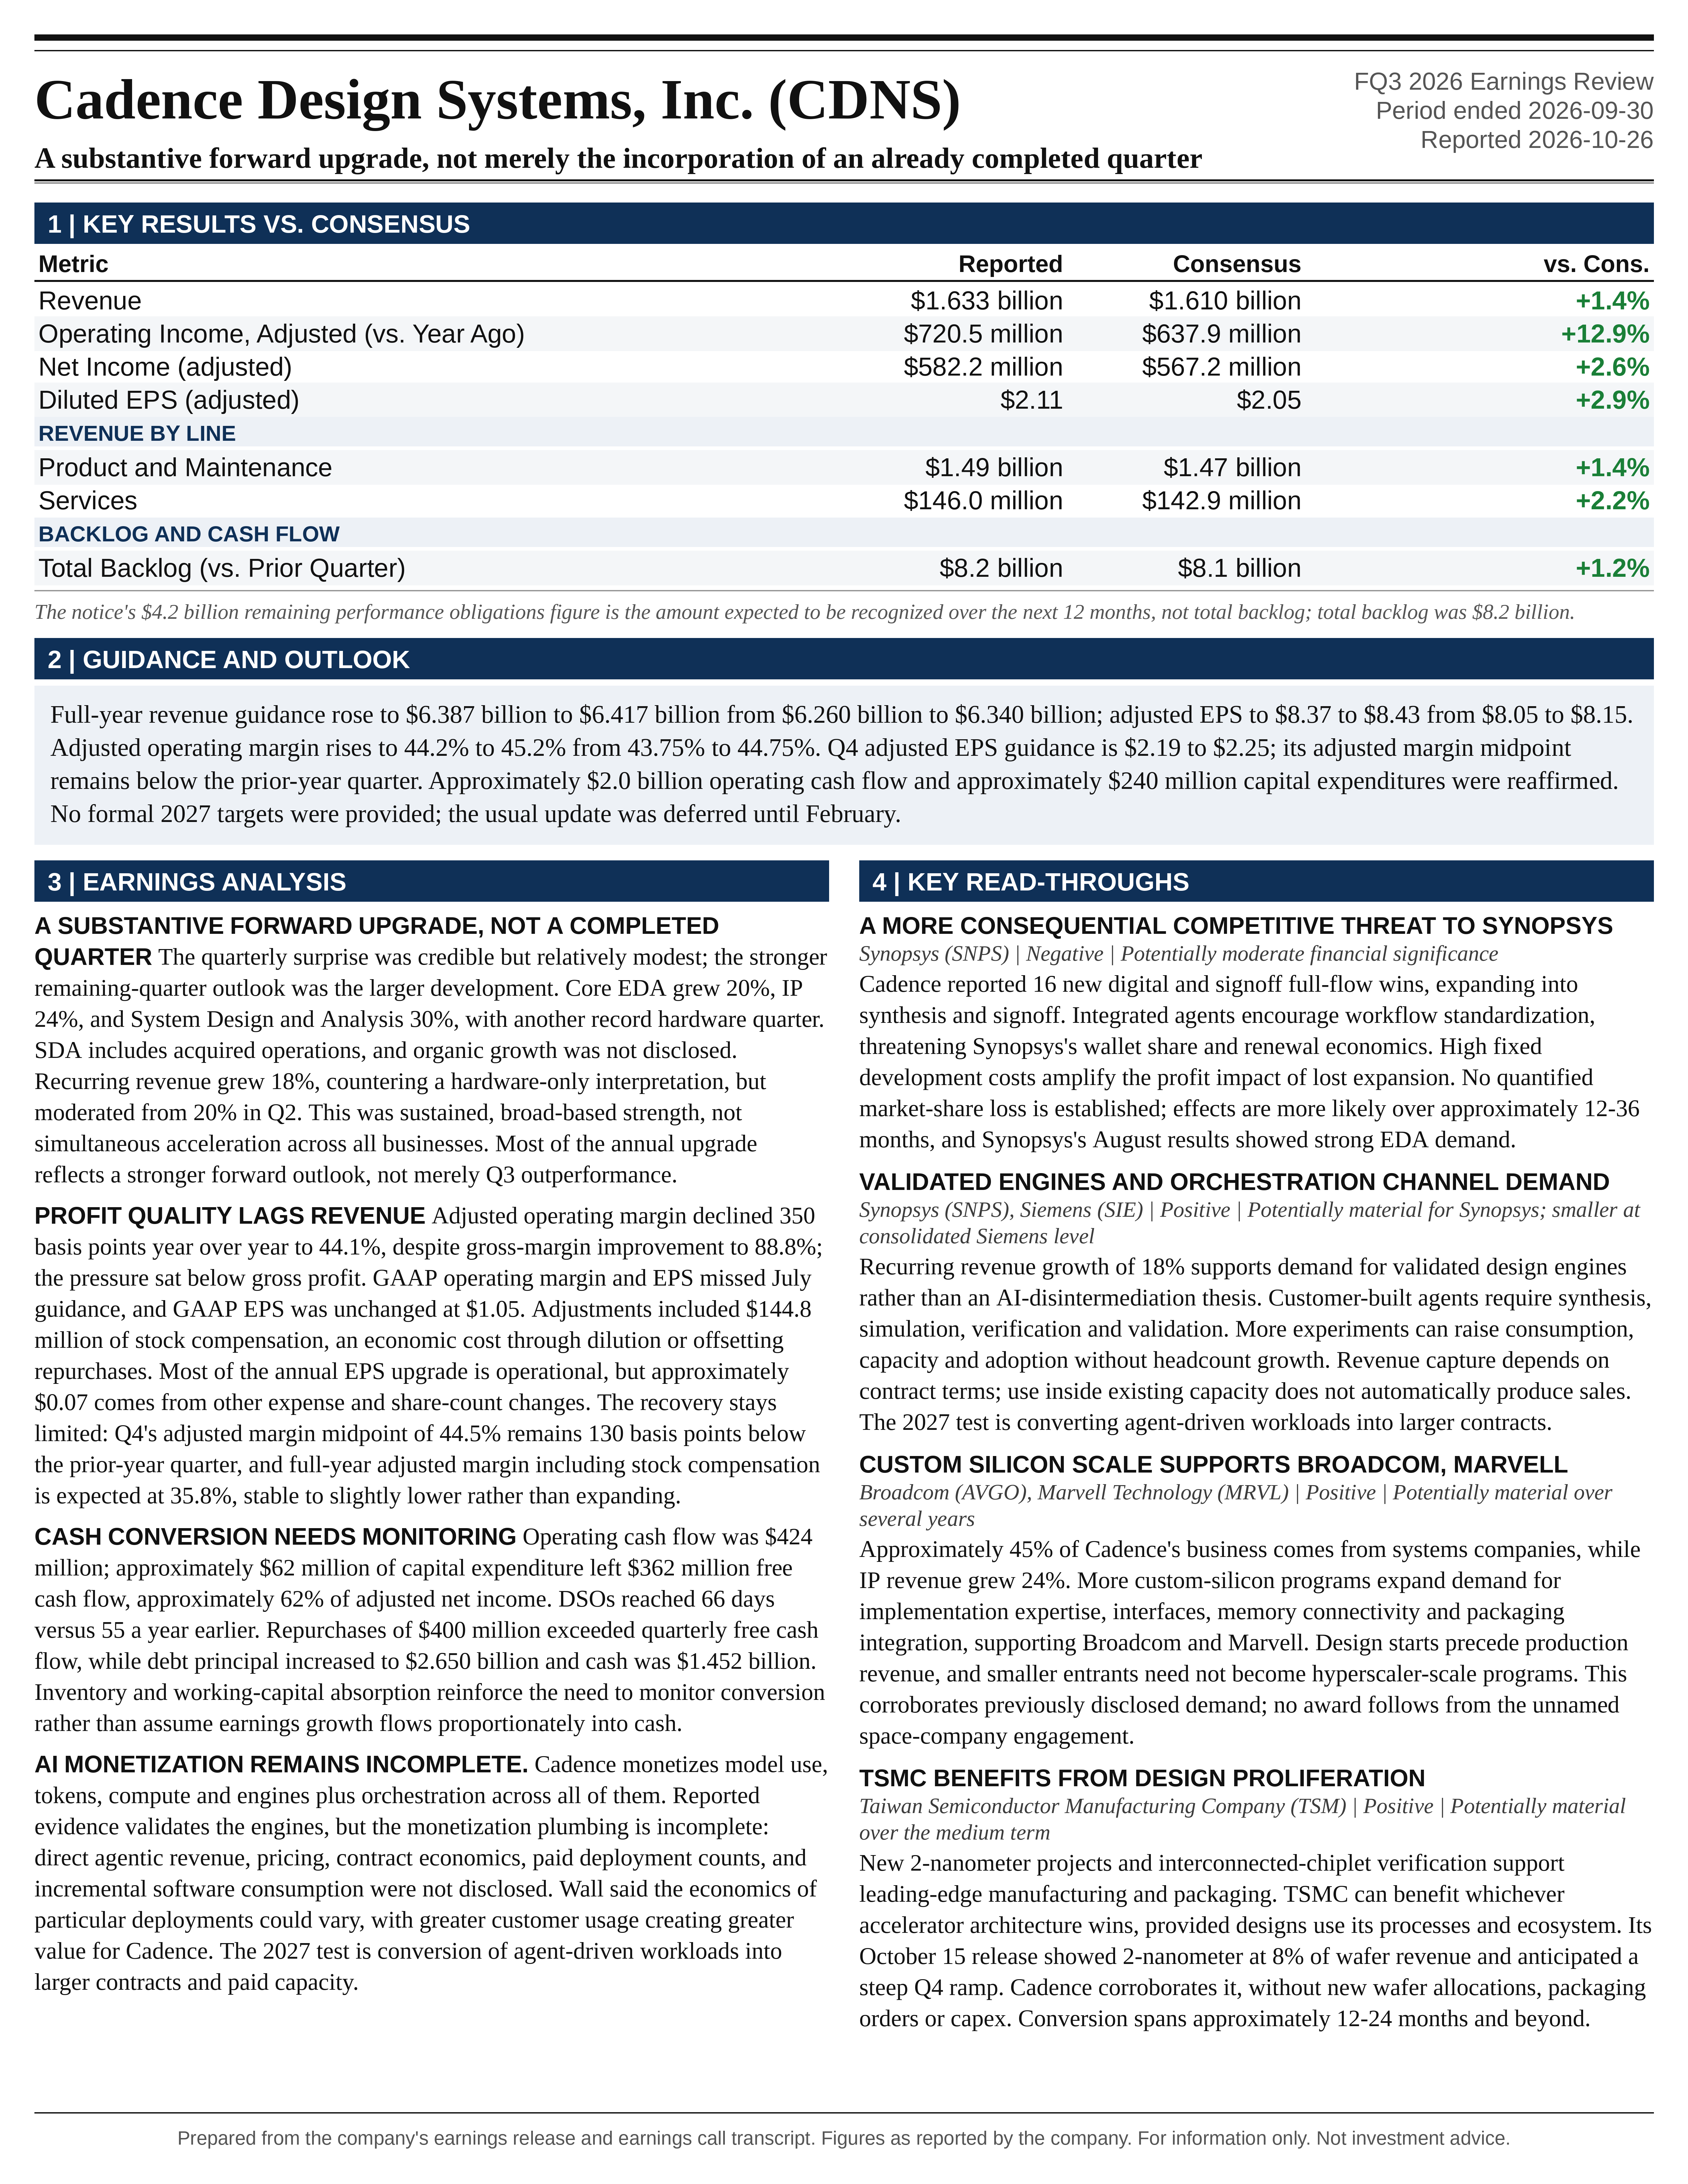
Cadence’s Q3 2026 results support higher earnings estimates and strengthen the evidence that AI is expanding demand for its underlying engineering software, rather than simply creating an incremental product category. The most important financial development was not the relatively modest quarterly revenue beat, but the substantial improvement in the implied Q4 outlook. Revenue of $1.633 billion increased 22%, recurring revenue grew 18%, and backlog reached $8.2 billion. The full-year revenue midpoint increased by $102 million, of which approximately $79 million represents an improvement in the remaining-quarter forecast after accounting for Q3 outperformance against prior guidance. This is a substantive forward upgrade, not merely the incorporation of an already completed quarter.
The strategic development was Maestro, Cadence’s portfolio of domain-specialized AI models, combined with model routing and feedback from its EDA and system-design engines. The investment significance lies primarily in Cadence’s ability to retain the customer interface, monetize engineering orchestration, and increase consumption of its existing tools while allowing customers to bear model-compute costs. This architecture offers a credible route to AI monetization without requiring Cadence to become a capital-intensive general-purpose model provider. However, direct agentic revenue, pricing, contract economics, paid deployment counts, and incremental software consumption were not disclosed. The quarter supports the direction of the AI thesis more strongly than its ultimate magnitude.
The financial outcome was less uniformly strong than management’s introductory characterization suggested. Non-GAAP operating margin declined 350 basis points year over year to 44.1%, adjusted EPS grew 9.3%, and GAAP EPS was unchanged at $1.05. GAAP operating margin and EPS missed the guidance issued in July. Adjusted gross margin improved, indicating that the operating-margin decline principally reflected higher operating expenses rather than deterioration in consolidated product-level profitability. The acquisition of Hexagon’s Design and Engineering business, restructuring, ongoing investment, and charitable-contribution timing complicate comparisons.
The investment stance is constructive on fundamentals but valuation-disciplined: hold an established position rather than automatically increase exposure following the release. At the 10/26/26 regular-session closing price of $322.17, Cadence traded at approximately 38.4x updated 2026 adjusted EPS and an approximately 2.0% prospective free-cash-flow yield using the guided diluted share base. Those metrics already require sustained growth and eventual operating leverage. The quarter reduces concerns about demand and AI-related disintermediation, but does not eliminate valuation risk, prove a new long-term growth ceiling, or establish that recent hardware strength is permanently recurring.
QUARTERLY PERFORMANCE AND THE QUALITY OF THE BEAT
Revenue of $1.633 billion exceeded the supplied Bloomberg consensus of $1.610 billion by approximately $23.3 million, or 1.4%. Adjusted EPS of $2.11 exceeded consensus of $2.05 by $0.06, or 2.9%. Adjusted net income of $582.2 million exceeded the $567.2 million consensus by approximately 2.6%. Non-GAAP operating margin of 44.1% was only 10 basis points above the 44.0% consensus. The quarter therefore delivered a credible but relatively modest earnings surprise; the subsequent guidance change was the larger incremental development.
Against management’s July guidance, revenue exceeded the $1.595 billion to $1.625 billion range by $8.3 million at the upper end. Adjusted EPS exceeded the $2.01 to $2.07 range by $0.04 at the upper end. However, the 44.1% adjusted operating margin was within the prior 43.5% to 44.5% range, only slightly above its midpoint. It was not an above-range margin result.
The GAAP comparison is materially different. GAAP operating margin of 26.2% was below the prior 27.5% to 28.5% range, missing the midpoint by 180 basis points. GAAP EPS of $1.05 was below the prior $1.11 to $1.17 range, missing the midpoint by approximately 7.9%. The preliminary transcript’s statement that all key metrics were well above guidance should therefore be interpreted narrowly. Revenue and adjusted EPS exceeded their ranges; adjusted margin modestly exceeded its midpoint; GAAP profitability missed.
Growth remained strong but did not accelerate uniformly relative to Q2. Revenue increased approximately 3.1% sequentially from $1.584 billion, while year-over-year growth moderated from 24% to 22%. Adjusted EPS remained $2.11, and adjusted operating margin declined from 45.5% to 44.1%. Core EDA growth improved from 18% to 20%, but IP growth moderated from more than 40% to 24%, and System Design and Analysis growth moderated from 37% to 30%. Recurring revenue growth also moderated from the 20% cited for Q2 to 18%. The appropriate interpretation is sustained, broad-based strength with improving core EDA growth, rather than simultaneous acceleration across all businesses.
The longer-term comparison is more favorable. The updated approximately 21% full-year revenue growth outlook compares with 14% growth in 2025 and 13% in 2024. However, the updated $8.40 adjusted EPS midpoint implies approximately 17.6% growth over 2025’s $7.14, below the approximately 20% EPS growth achieved in 2025. Revenue acceleration has not translated into faster EPS growth because of acquisition dilution, expense growth, financing costs, and the share base.
PROFITABILITY, OPERATING LEVERAGE, AND ADJUSTMENTS
Adjusted operating income increased approximately 12.9% to $720.5 million from $637.9 million. Against approximately $294.5 million of incremental revenue, this represents an approximately 28.1% incremental adjusted operating margin. That is substantially below both the current consolidated margin and the 54% to 55% incremental-margin framework discussed by management for the underlying business. The quarterly result should not be characterized as strong operating leverage simply because revenue and EPS exceeded expectations.
The gross-margin evidence is important. Non-GAAP gross margin increased to 88.8% from 88.0% a year earlier and 88.2% in Q2. With gross margin improving while operating margin declined, the pressure was concentrated below gross profit. Using reported revenue and rounded gross margins, adjusted operating expenses excluding cost of revenue increased approximately 35% year over year. Their share of revenue increased by roughly 430 basis points, more than offsetting the approximately 80-basis-point gross-margin improvement.
GAAP research and development expense increased approximately 27% to $537.5 million, while general and administrative expense increased approximately 45% to $113.0 million. Headcount reached 15,753, approximately 15% above the prior-year quarter. These figures are consistent with meaningful investment and an expanded acquired-business perimeter, although the disclosures do not isolate the cost of agentic development from other engineering spending.
Wall attributed part of the G&A increase to annual charitable contributions occurring in Q3 rather than Q4. This is a timing explanation, not a structural cost reduction. It can improve the sequential or year-over-year Q4 comparison, but does not create an equivalent full-year earnings benefit. The amount was not disclosed, preventing a precise normalization of Q3 profitability.
The difference between GAAP and non-GAAP operating margin was 17.9 percentage points. Major adjustments included $144.8 million of stock-based compensation, $79.9 million of acquired-intangible amortization, $25.0 million of acquisition and integration costs, and $42.2 million of restructuring expense. Acquired-intangible amortization increased sharply from $26.0 million a year earlier, while restructuring increased from $27.4 million.
These adjustments require different economic treatment. Acquired-intangible amortization is noncash in the current period, but reflects assets acquired with cash and equity. Stock-based compensation remains an economic cost through dilution or the repurchases required to offset it. Restructuring and integration expenses may be excluded from adjusted earnings but can still consume cash. The CFO commentary provides a useful supplementary measure: full-year adjusted operating margin after including stock-based compensation is expected to be 35.8%, compared with 36.0% in 2025. On that basis, profitability is approximately stable to slightly lower, rather than expanding.
GAAP operating income increased only approximately 0.8% to $428.7 million, and GAAP net income increased approximately 0.9% to $289.7 million. These results do not invalidate the adjusted earnings framework, but they limit the extent to which the quarter can be described as broad-based profit acceleration.
GUIDANCE REVISION AND THE FORWARD EARNINGS BRIDGE
Full-year revenue guidance increased to $6.387 billion to $6.417 billion from $6.260 billion to $6.340 billion. The midpoint increased by $102 million, or 1.6%, to $6.402 billion. The range narrowed from $80 million to $30 million, consistent with greater visibility after completing Q3. The new midpoint is approximately 1.3% above the supplied $6.320 billion consensus.
Adjusted EPS guidance increased to $8.37 to $8.43 from $8.05 to $8.15. The midpoint increased by $0.30, or 3.7%, to $8.40, approximately 3.1% above the $8.15 consensus. The disproportionate EPS increase relative to revenue reflects both improved operating profitability and favorable changes below operating income.
The precise prior adjusted operating-margin range was 43.75% to 44.75%, compared with the new 44.2% to 45.2%. The midpoint therefore increased by 45 basis points to 44.7%. The Bloomberg notice rounds the earlier range, which can obscure this exact comparison. Multiplying the respective revenue and margin midpoints implies that full-year adjusted operating income increased by approximately $73.9 million, from $2.788 billion to $2.862 billion. That is approximately 72.5% incremental operating profit on the $102 million revenue revision.
This revision-level incremental margin should not be confused with the full-year year-over-year incremental margin, which is approximately 45%. Wall’s response to the analyst question concentrated on the annual comparison and acquisition dilution rather than fully explaining the unusually high incremental margin embedded in the guidance revision. The release supports the arithmetic, but management did not provide a detailed attribution among product mix, expense timing, cost control, and other factors.
The CFO commentary allows an approximate EPS bridge. Expected annual non-GAAP other expense improved from a midpoint of $105 million to $96 million, while the diluted share-count midpoint declined from 276.5 million to 275.0 million. The normalized non-GAAP tax rate remained 16.5%. Holding assumptions consistently, the operating-profit increase contributes approximately $0.22 per share, the improvement in other expense contributes approximately $0.03, and the lower share base contributes approximately $0.05. Thus, most of the EPS increase is operational, but approximately $0.07 is attributable to other expense and share-count changes.
The GAAP EPS midpoint increased only from $4.81 to $4.87, approximately 1.2%, despite the $0.30 adjusted EPS increase. The expected GAAP tax rate also increased from approximately 26% to approximately 27%. The divergence reinforces the importance of distinguishing the improvement in adjusted operating expectations from the improvement in statutory earnings.
The revenue bridge indicates a meaningful remaining-quarter upgrade. Q3 exceeded the prior revenue midpoint by approximately $23.3 million. Subtracting that from the $102 million annual increase leaves approximately $78.7 million of additional expected Q4 revenue. The implied prior Q4 revenue midpoint was approximately $1.631 billion, compared with approximately $1.710 billion now, an approximately 4.8% increase.
An analogous EPS bridge indicates that approximately $0.07 of the $0.30 annual increase reflects Q3 performance relative to prior guidance, leaving approximately $0.23 for the remaining-quarter outlook. This is approximate because annual and quarterly EPS use different weighted-average share counts. Nonetheless, the conclusion is clear: most of the annual upgrade reflects a stronger forward outlook, not merely recognition of Q3 outperformance.
Q4 EXPECTATIONS AND THE LIMITS OF THE 2027 MESSAGE
Q4 revenue guidance of $1.695 billion to $1.725 billion implies approximately 18.8% year-over-year growth at the midpoint and approximately 4.7% sequential growth. Adjusted EPS guidance of $2.19 to $2.25 implies approximately 11.6% year-over-year growth and approximately 5.2% sequential growth. The $2.22 midpoint is approximately 9.9% above the supplied $2.02 consensus, making Q4 EPS the strongest quantified forward surprise in the materials.
The Q4 adjusted operating-margin midpoint is 44.5%, approximately 40 basis points above Q3 but 130 basis points below the prior-year quarter’s 45.8%. The guidance therefore does not assume an immediate restoration of historical quarterly profitability. It combines strong revenue growth with only a modest sequential margin recovery.
Q4 GAAP EPS guidance of $1.23 to $1.29 compares with $1.42 a year earlier. At the midpoint, GAAP EPS would decline approximately 11.3%, even as adjusted EPS grows approximately 11.6%. Acquisition accounting and other adjustments remain material to the earnings trajectory.
No formal 2027 revenue, EPS, operating-margin, or royalty target was provided. Devgan explicitly deferred the usual next-year update until February. The competitor growth, margin, and royalty figures embedded in an analyst’s question are not Cadence guidance and should not be imported into its forecast.
Management’s claim that revenue growth plus adjusted operating margin will exceed 65% is arithmetically reasonable. Approximately 21% growth plus 44.7% margin produces approximately 65.7%. However, this combines acquisition-inclusive growth with an earnings measure excluding stock compensation and other costs. It is a useful operating summary, not a substitute for organic growth, cash generation, or return on acquisition capital.
BACKLOG, RECURRING REVENUE, AND THE RPO REPORTING DISCREPANCY
The Bloomberg notice contains a material comparability problem. It reports remaining performance obligations of $4.2 billion, down 40%, against an $8.33 billion estimate. Cadence’s formal release identifies $8.2 billion of total backlog and $4.2 billion of revenue expected to be recognized from remaining performance obligations during the next 12 months. The $4.2 billion figure is a recognition-window measure, not the total backlog figure. Comparing it directly with a total-obligation estimate creates a false impression of a collapse in contracted demand. The supplied notice does not establish a valid like-for-like RPO miss.
Total backlog increased from $8.1 billion at Q2 to $8.2 billion, approximately 1.2% sequentially, and from $7.8 billion at the end of 2025, approximately 5.1%. A record backlog remains positive, particularly during a comparatively light renewal year. However, its growth is much slower than recognized revenue growth. That is not necessarily adverse because backlog depends on contract duration, renewals, deliveries, and revenue recognition, but it limits the usefulness of the record headline as a standalone growth indicator.
Wall emphasized that strength reflected “healthy underlying design activity, expanded customer engagements and strong add-on opportunities across our portfolio.” This is more informative than the absolute backlog level because it indicates that demand was not dependent solely on a favorable renewal schedule. Nevertheless, the analyst’s approximately 26% bookings-growth reference was not accompanied by a complete company-reported bookings reconciliation. Contract duration and deal composition remain necessary to assess the economic quality of bookings growth.
The CFO commentary shows recurring revenue at 79% of Q3 revenue, compared with 82% a year earlier and 78% in Q2. This equates to approximately $1.29 billion of recurring revenue using the rounded mix disclosure. Up-front revenue represented 21%, compared with 18% a year earlier. Faster growth in up-front business therefore contributed materially to consolidated growth, even though recurring revenue itself remained strong.
The distinction matters because 18% recurring growth is persuasive evidence against the proposition that the quarter was principally a hardware-only phenomenon. However, recurring revenue is not synonymous with organic revenue, agentic revenue, or revenue generated by a fixed customer cohort. The disclosed growth includes multiple software and contractual components, and no acquisition-adjusted recurring-growth figure was provided.
Management compared the current 18% recurring growth with 11% for 2025, while an analyst compared it with 20% in Q2. Both comparisons are relevant but answer different questions. The annual comparison supports a higher growth trajectory; the sequential comparison indicates moderation from a stronger recent quarter. Management cited China-related timing in the prior-year comparison but did not quantify the adjustment.
The expected contribution of beginning backlog to full-year revenue declined from approximately 65% to approximately 64%. Applying those rounded percentages to the respective annual revenue midpoints produces approximately $4.1 billion in both cases. This is consistent with the revenue upgrade coming primarily from business generated or recognized during the year rather than a larger beginning-backlog contribution, although rounding prevents a precise attribution.
MAESTRO AND THE ECONOMIC ARCHITECTURE OF AGENTIC DESIGN
Maestro represents an extension of Cadence’s existing agentic strategy rather than a pivot into training general-purpose foundation models from inception. The architecture combines domain-specialized post-training, task-dependent model routing, and feedback from EDA and SDA tools. Open-weight and frontier models remain components of the system rather than exclusive alternatives.
The technical rationale is credible. Chip and system design require outputs to satisfy engineering constraints, not merely resemble plausible code or explanations. Synthesis, simulation, timing analysis, formal verification, and physical-design tools can evaluate candidate outputs against specific objectives. These tools provide feedback that a standalone language model lacks. Cadence can potentially improve both the agent’s decisions and the specialized models by grounding the learning process in those evaluations.
The strategic objective was stated directly by Devgan: “We want to be the primary interface to our customers.” This is central to the investment thesis. If Cadence retains the workflow interface and controls access to the engineering engines, it can preserve pricing relevance even as the underlying language models become more capable or less expensive. Conversely, if customers or competing platforms control orchestration and procure Cadence only as an interchangeable backend, part of the incremental AI economics could accrue elsewhere.
Wall provided the clearest monetization explanation: “Cadence monetizes the underlying design engines and our agentic orchestration capabilities.” He also stated that the strategy remained centered on “delivering high-value engineering software rather than building a large general-purpose AI infrastructure business.” Customers can use their own model infrastructure and bear associated compute costs. This supports an attractive economic structure in which Cadence captures software value without necessarily absorbing the full inference-cost burden.
However, the mechanism connecting increased engineering activity to increased revenue is not automatic. Greater tool utilization only produces incremental revenue when licensing terms, capacity limits, consumption arrangements, or renewal negotiations allow Cadence to capture that usage. Customers may initially absorb higher utilization within existing contractual capacity. They may also negotiate discounts as usage scales. Wall’s statement that “greater customer usage should create greater value for Cadence” identifies the intended direction, but does not quantify conversion from workload growth to revenue growth.
The reported up to 5x improvement in token efficiency is not equivalent to a 5x reduction in total workflow cost. Engineering workloads include model inference, EDA engine execution, memory, storage, scheduling, and human review. More efficient token use can coexist with more intensive exploration and substantially greater tool-compute consumption. This could be favorable for Cadence’s revenue while producing a smaller reduction in the customer’s total cost than the token statistic alone implies.
The reported up to 30% improvement in quality also lacks a single disclosed definition applicable across all workloads. Power, performance, area, verification completeness, runtime, and engineering effort are different objectives with different tradeoffs. The results support the value of domain specialization, but do not establish universal superiority over every frontier model or competing workflow.
Cadence’s product announcement states that the initial Maestro models are available to selected early-access customers in Q4 2026. Therefore, Maestro itself should not be credited with generating the entirety of Q3’s recurring-revenue acceleration. The quarter’s results largely reflect existing design demand, underlying tool adoption, hardware, IP, acquisitions, and earlier agent deployments. Maestro is principally an incremental forward opportunity.
ADOPTION EVIDENCE AND BENCHMARK INTERPRETATION
More than 100 active customer engagements across the AI Super Agent portfolio provide evidence of broad interest. However, engagements are not necessarily unique customers, paid production deployments, or contracts with material recognized revenue. The Q2 prepared remarks separately identified more than 20 ChipStack engagements and more than 25 ViraStack engagements. Those earlier counts cannot be directly added or compared with the current portfolio-wide figure without consistent definitions.
MediaTek’s reported production deployment is among the more consequential examples because it moves beyond an isolated demonstration. Management reported 50% to 70% improvement in verification coverage and engineering-effort improvements of 1.4x to 2x, with deployment expanding across teams. This supports practical utility and the potential for account expansion. However, the disclosures do not establish the absolute coverage baseline, project-wide schedule reduction, or incremental Cadence spending.
The RTL-generation results, including average reductions of 24% in area and 18% in power, are technically meaningful but use pure foundation-model-generated code as the comparator. They do not establish equivalent improvement against expert-written RTL or a fully optimized incumbent engineering flow. Frequency targets, design complexity, physical implementation, verification requirements, and the extent of human intervention were not disclosed in sufficient detail to translate the result into a general semiconductor cost or performance advantage.
The 34x productivity result cited for an MCU team should be understood as a result across specified engineering tasks, not a 34x reduction in total chip-development time. Socionext’s up to 5x overall productivity figure was presented as an expectation associated with deployment, rather than a fully realized result across a completed production program. These are encouraging indicators, but realized and prospective outcomes should remain separate.
ViraStack’s 4x increase in engagement is potentially important because analog and custom design have historically depended heavily on specialized human judgment. Automating portions of this work could expand Cadence’s value proposition in an established area of strength. Nevertheless, the baseline engagement count, observation period, and revenue conversion were not disclosed.
Nokia’s reported 5x acceleration combines AuraStack, Cadence’s physics-based solvers, and the Millennium platform. It demonstrates the potential value of an integrated solution, but the contribution of the AI agent cannot be separated from accelerated compute, solver performance, and workflow redesign. The commercial implication may be a broader software-and-hardware relationship rather than a discrete agent subscription.
Overall, the deployment evidence is stronger than a purely conceptual AI narrative. It remains insufficient to quantify direct agentic revenue or a company-wide productivity multiplier. The strongest near-term conclusion is that agentic workflows are helping reinforce demand for Cadence’s existing engines and integrated product portfolio.
COMPETITIVE POSITION AND THE LIMITS OF THE AI MOAT
Cadence’s strongest potential competitive advantage is the combination of validated engineering engines, established customer workflows, domain knowledge, and integration across the design process. Specialized model weights alone are less likely to constitute a durable barrier because open models and post-training methods continue to improve.
Maestro’s flexibility is strategically useful. Customers can combine Cadence models with frontier or open-weight alternatives, deploy on premises or in the cloud, and further post-train on proprietary data. This reduces dependence on any single external model provider and addresses confidentiality requirements around highly sensitive design data.
However, customer-specific training does not imply unrestricted access to a pooled industry dataset. Confidentiality requirements can constrain how learning from individual customers is reused. The defensible advantage is therefore likely to depend heavily on Cadence’s own tools, legally usable data, evaluation infrastructure, and accumulated engineering expertise rather than an unconstrained cross-customer data network.
The call also contained a useful tension. Devgan argued that increasingly integrated agents would be difficult for customers to reproduce, while Wall acknowledged that customers would continue developing their own agents. These positions can coexist if Cadence remains the indispensable engineering backend, but they imply different monetization outcomes. Customer-built orchestration may support core-tool consumption while limiting Cadence’s share of the orchestration-layer economics.
Competition also remains possible through alternative EDA vendors offering their own integrated agents and engineering engines. Management’s assertion of uniqueness is a strategic claim, not independently demonstrated exclusivity. Full-flow wins and customer expansion are more persuasive competitive indicators than claims that other vendors or customers cannot reproduce particular capabilities.
CORE EDA: BROADER PARTICIPATION BEYOND DIGITAL IMPLEMENTATION
Core EDA revenue increased 20% and represented approximately 69% of total revenue. Management highlighted 16 new digital and signoff full-flow wins, greater synthesis and signoff adoption, verification growth at hyperscalers and memory companies, and competitive displacement by Spectre FX.
The most important competitive message was that expansion is broadening around Innovus rather than remaining concentrated in implementation. Devgan described stronger adoption of synthesis and signoff alongside implementation, including at very large customers. At advanced nodes, tighter coupling among these functions can improve engineering iteration and reduce the cost of transferring data between tools. Agentic orchestration may strengthen the preference for integrated workflows.
This creates a potentially attractive expansion mechanism. Success in an established implementation position can support adoption of adjacent tools, increasing revenue per design and customer switching costs. However, 16 full-flow wins do not establish 16 large new customers, a specific dollar value, or immediate revenue recognition. Existing contracts and gradual deployment can delay the financial impact.
Analog and mixed-signal exposure provides a complementary demand source. Management cited recovery in traditional end markets, growing physical-AI requirements, and greater analog content within complex AI systems. This broadens Cadence’s opportunity beyond leading-edge digital accelerators, although those markets remain exposed to semiconductor design budgets and industry conditions.
The Spectre FX displacement involving multiple 2-nanometer projects is strategically relevant because it suggests competitiveness in demanding production environments. It does not, by itself, establish a quantified market-share change. Management’s broader share-gain assertions remain directionally supported by wins but not independently measured in the call.
HARDWARE: STRUCTURAL DEMAND WITH DELIVERY AND CAPITAL RISKS
Hardware delivered another record quarter, supported by AI and high-performance-computing designs, customer expansion, new logos, and cloud-based access. Management’s explanation is economically coherent: larger designs and more complex system verification require greater emulation and prototyping capacity before committing to silicon.
Devgan emphasized that hardware is generally consumed according to design size. Chiplets, advanced packaging, and verification across interconnected components can expand the workload beyond an individual die. These trends support a durable need for hardware-assisted verification, including outside AI.
The cited claim that chip size could increase 48x over 5 years should not be translated into a comparable hardware-revenue forecast. It was management’s description of an external technology-roadmap presentation, not a Cadence revenue commitment. Hardware efficiency, architecture, software optimization, customer utilization, and the relevant definition of design size all affect monetization.
Wall stated that “there are no capacity or supply-chain constraints in terms of addressing that” when discussing backlog and inventory. Consequently, the inventory build was presented as preparation for customer orders rather than an inability to obtain supply. This is constructive for near-term execution, but transfers attention to deliveries, installations, acceptance, and cash conversion.
Inventory reached $448.8 million, approximately 48% above year-end 2025. Hardware can remain structurally attractive while being volatile quarterly. Installation timing and customer capacity additions can create unusually strong periods followed by digestion. Cloud access may broaden adoption and smooth some purchasing patterns, but the disclosures do not quantify the share of hardware economics becoming recurring.
The principal risk is not that verification requirements disappear. It is that customer capacity purchases, spending concentration, or delivery schedules normalize after an exceptionally strong period. Recurring software growth provides an important counterweight, but does not remove hardware-related volatility.
IP AND SYSTEM DESIGN: STRONG DEMAND, DIFFERENT ECONOMIC DRIVERS
IP revenue increased 24%, following growth above 40% in Q2. Management attributed demand to AI infrastructure, custom silicon, advanced nodes, chiplets, and interface and memory requirements. These drivers are strategically credible because system performance increasingly depends on data movement and integration rather than processing capability alone.
The opportunity includes greater IP content per design and an expanding population of customers developing custom chips. The unnamed space-technology customer illustrates potential entry through IP followed by design services and broader silicon engagement. However, the customer was not identified, the contract value was not disclosed, and the broader engagement remained prospective.
Tensilica’s record quarter and the Analog Devices development relationship broaden the opportunity beyond the largest AI accelerators. Embedded processing and audio applications can support a more diversified design base, although their economics and demand cycles differ from leading-edge infrastructure IP.
Royalty monetization was discussed but not quantified. Management confirmed an existing royalty presence and royalties within design IP, while presenting royalties as only part of the business-model opportunity. There was no Cadence commitment comparable to the competitor royalty figure raised in the analyst question. A material royalty stream would depend on contractual terms, customer product success, production timing, and unit volumes, not merely design wins.
System Design and Analysis revenue increased 30% and represented approximately 16% of total revenue. Allegro, advanced packaging, Millennium, digital twins, and the acquired MSC portfolio broaden the addressable engineering problem from chips into electronic and physical systems. The strategic logic is stronger where electrical, thermal, structural, and mechanical constraints interact, including advanced packaging, AI infrastructure, vehicles, and robotics.
However, SDA’s reported growth includes acquired operations. The quarter’s organic SDA growth and the exact acquisition contribution were not disclosed. Competitive wins and cross-selling are positive indicators, but the 30% headline should not be treated as entirely internally generated growth.
HEXAGON D&E: 2027 OPPORTUNITY VERSUS ALREADY KNOWN EXPECTATIONS
Cadence completed the Hexagon D&E acquisition on 02/23/26 for approximately €2.7 billion, including estimated transaction-related taxes, with consideration structured as 70% cash and 30% Cadence stock. At closing, Cadence expected $160 million of incremental 2026 revenue, approximately $0.28 of adjusted EPS dilution, and accretion in 2027.
On the current call, Wall stated that the business was performing slightly above the revenue expectation but was “not really contributing much in the way of operating profit at all this year.” This supports the explanation that acquired revenue is diluting consolidated margins. It also establishes a meaningful execution requirement: the acquired business must translate its revenue contribution into profit and cash generation.
Subtracting the original $160 million contribution from the new annual revenue midpoint leaves approximately $6.242 billion, or approximately 17.8% growth over 2025. This is not a fully organic growth calculation because it does not adjust for all acquisition, currency, or perimeter effects. It does show that the known D&E contribution explains only part of the approximately 21% consolidated growth.
Assuming approximately no operating-profit contribution, removing that revenue from the denominator would produce an adjusted margin of approximately 45.8% for the remainder of the business. This is an analytical illustration, not a disclosed segment result. It demonstrates how acquisition dilution can coexist with stronger profitability in the existing operations.
The expected improvement in 2027 is an important catalyst, but accretion in 2027 was already communicated at acquisition closing. The current call adds evidence of integration progress rather than introducing that expectation for the first time. The relevant incremental evidence will be the size of the profit contribution, cash conversion, customer retention, and returns relative to the purchase price.
CASH FLOW, WORKING CAPITAL, AND CAPITAL ALLOCATION
Q3 operating cash flow was $424 million, approximately 36% above the prior-year quarter but approximately 33% below Q2. Capital expenditures were approximately $62 million, producing $362 million of free cash flow, approximately 31% above the prior-year quarter. Operating cash flow represented approximately 73% of adjusted net income, while free cash flow represented approximately 62%.
The full-year operating-cash-flow forecast remained approximately $2.0 billion despite the revenue and adjusted EPS increases. Capital-expenditure guidance also remained approximately $240 million. This implies approximately $1.760 billion of free cash flow, approximately 10.9% above 2025’s $1.587 billion. Free-cash-flow growth therefore trails both revenue growth and adjusted EPS growth.
The implied free-cash-flow margin is approximately 27.5%, compared with approximately 30.0% in 2025. Capital expenditures are expected to increase approximately 69% from $142 million. The business remains strongly cash-generative, but the current year does not demonstrate expanding cash margins.
Through Q3, operating cash flow totaled approximately $1.414 billion and capital spending approximately $163 million. Achieving the annual outlook requires approximately $586 million of Q4 operating cash flow and approximately $77 million of capital expenditures, implying approximately $509 million of Q4 free cash flow. That is close to the prior-year Q4 free cash flow of $512 million. The remaining cash-flow requirement is not exceptionally aggressive relative to historical seasonality, but it also does not indicate a large cash-flow acceleration.
DSOs increased to 66 days from 65 in Q2 and 55 a year earlier. Inventory also increased substantially. The year-to-date cash-flow statement shows approximately $173 million absorbed by inventory and approximately $263 million absorbed by changes in accounts payable and accrued liabilities. These movements reinforce the need to monitor conversion rather than assume that adjusted earnings growth will flow proportionately into cash.
Cadence repurchased $400 million of shares during Q3, slightly more than quarterly free cash flow. Debt principal increased by $150 million sequentially to $2.650 billion, while cash increased only modestly to $1.452 billion. Net debt was approximately $1.198 billion. These movements do not establish that a specific borrowing financed a specific repurchase, but they show that quarterly capital returns were not fully covered by quarterly free cash flow.
The CFO commentary indicates another approximately $400 million of repurchases in Q4. Combined with approximately $800 million already repurchased through Q3, this would produce approximately $1.2 billion of annual buybacks, or approximately 68% of implied annual free cash flow. The additional $2.5 billion authorization provides flexibility, not a binding purchase commitment or evidence that the shares are undervalued.
Despite repurchases, Q3 diluted shares increased approximately 0.5% year over year to 275.3 million. Equity acquisition consideration and compensation-related issuance remain relevant offsets. The reduced annual share-count assumption improves EPS, but the current evidence is not consistent with assuming a large, uninterrupted net reduction in shares.
EXPORT CONTROLS, CUSTOMER MIX, AND PORTFOLIO EXPOSURE
China represented 16% of Q3 revenue, compared with 18% a year earlier and 15% in Q2. Applying the rounded geographic mix suggests approximately $261 million of China revenue, compared with approximately $241 million a year earlier. This implies growth of roughly 8%, versus approximately 25% outside China, subject to rounding. The consolidated result was therefore not dependent on outsized China growth.
Management’s guidance assumes that existing export-control regulations remain substantially similar through year-end. This is a material condition, not routine language. Restrictions can affect customer access, deliveries, licensing, support, and the timing of recognized revenue. The 2025 China-related timing effects also complicate recurring-growth comparisons.
Management stated that systems companies now represent approximately 45% of the business. This supports the argument that custom silicon is expanding Cadence’s customer universe beyond traditional semiconductor suppliers. However, customer-category diversification does not necessarily create economic diversification. Hyperscalers, infrastructure-chip vendors, foundries, packaging suppliers, and design-tool vendors can remain exposed to the same AI investment cycle.
Cadence is better characterized as exposure to engineering activity and design complexity than to immediate semiconductor shipments. Ratable software contracts and the importance of R&D offer resilience relative to more transaction-sensitive parts of the semiconductor chain. Nevertheless, design-budget reductions, program cancellations, customer consolidation, and hardware-capacity digestion can still affect results with a lag.
In a portfolio already concentrated in hyperscalers, AI semiconductors, semiconductor equipment, or other EDA vendors, Cadence adds substantial common exposure to AI investment expectations and premium-growth valuation. Analog, automotive, and physical-system opportunities provide some diversification, but do not eliminate that shared risk. A precise marginal-risk assessment requires actual holdings, factor exposures, and covariance estimates, which are not available in the source materials.
VALUATION, SCENARIOS, AND INVESTMENT IMPLICATIONS
The valuation reference is Bloomberg’s $322.17 regular-session close on 10/26/26, not an after-hours execution price. At that price, the shares traded at approximately 38.4x the new $8.40 adjusted EPS midpoint and approximately 66.2x the $4.87 GAAP EPS midpoint. Implied annual free cash flow of $1.760 billion divided by the approximately 275 million guided diluted shares produces approximately $6.40 per share, or a 2.0% yield.
The earnings upgrade alone increases value by approximately 3.7% at an unchanged adjusted earnings multiple. A materially larger sustained valuation increase would require greater confidence in 2027 earnings, a higher long-term growth trajectory, a lower perceived risk premium, or multiple expansion. The product announcements improve the strategic argument, but the absence of direct agentic revenue and consumption disclosures limits the precision of that valuation adjustment.
An illustrative base case, assigned a 55% probability, assumes 16% revenue growth in 2027, producing approximately $7.426 billion of revenue, a 45.5% adjusted operating margin, $96 million of net non-operating expense, a 16.5% tax rate, and 275 million diluted shares. These assumptions produce approximately $9.97 of adjusted EPS. A 35x multiple implies approximately $349 per share, or approximately 8% upside from the reference close. This case assumes continuing recurring growth, moderating hardware comparisons, and a modest improvement in acquisition economics without requiring extraordinary direct agentic revenue.
An illustrative bull case, assigned a 25% probability, assumes 22% revenue growth, a 47.0% adjusted operating margin, $90 million of net non-operating expense, a 16.5% tax rate, and 274 million diluted shares. This produces approximately $10.91 of adjusted EPS. A 40x multiple implies approximately $437 per share, or approximately 35% upside. The required evidence would include broad paid deployment of agents, increased underlying-tool consumption, sustained hardware strength, additional full-flow share gains, and a meaningful D&E profit contribution.
An illustrative bear case, assigned a 20% probability, assumes 8% revenue growth, a 43.0% adjusted operating margin, $110 million of net non-operating expense, a 16.5% tax rate, and 276 million diluted shares. This produces approximately $8.66 of adjusted EPS. A 28x multiple implies approximately $243 per share, or approximately 25% downside. Potential drivers include hardware digestion, weaker customer expansion, slower monetization of agentic activity, disappointing acquisition integration, or export-control disruption. A more severe regulatory or industry shock could produce outcomes below this case.
These are analytical scenarios, not company guidance or consensus forecasts. The probabilities and valuation multiples are judgmental, with moderate confidence at best. Their probability-weighted value is approximately $350, implying approximately 8.5% appreciation from the reference close over a roughly 12-month horizon. That is positive but not sufficiently compelling to justify aggressive incremental exposure given the downside and dependence on premium valuation.
The resulting action is to hold an existing core position and favor selective accumulation below approximately $300 rather than chase a release-driven rerating. At $300, the same probability-weighted value implies approximately 16.5% appreciation. An illustrative new position of 0.5% to 1.0% of portfolio NAV, with a maximum of 1.5% before stronger monetization evidence, would limit concentration risk. A 12% price-based loss threshold would correspond to approximately 6 to 12 basis points of NAV loss at the initial sizing, before gaps, slippage, or correlated losses; at the maximum size, approximately 18 basis points.
Fundamental exit or reduction criteria should include recurring growth persistently falling below approximately 15% without a credible comparison explanation, a material guidance reduction, continued deterioration in cash conversion, or failure of D&E to move toward accretion in 2027. A price advance toward approximately $350 to $370 without a corresponding increase in earnings expectations would warrant reassessment because much of the base-case value would have been realized. Conversely, sustained paid agent deployment and demonstrable consumption-led expansion could justify raising both earnings assumptions and valuation tolerance.
CATALYSTS AND THE EVIDENCE REQUIRED NEXT
The immediate operating catalyst is execution against the upgraded Q4 revenue and earnings outlook, together with delivery of the approximately $586 million operating-cash-flow requirement. Hardware shipment and installation execution, inventory conversion, and the expected $400 million repurchase are observable components of that outcome.
The next major financial catalyst is the February 2027 outlook. Its importance will be the degree to which strong recurring growth persists, whether adjusted margins improve despite continued AI investment, and whether D&E becomes an identifiable contributor to profit rather than principally revenue.
Maestro’s Q4 early-access rollout and subsequent production expansion provide strategic catalysts, but customer testimonials alone should not be treated as equivalent to financial proof. The highest-value incremental disclosures would be paid production-customer counts, direct agentic revenue or bookings, deployment expansion, incremental engine consumption, pricing structure, customer retention, and the cost allocation between Cadence and the customer.
The quarter’s central investment conclusion is that Cadence is participating in AI-related demand through several economically distinct channels: more complex designs, greater verification capacity, higher IP requirements, broader system simulation, and potentially more software consumption per engineer. The strongest evidence currently supports those underlying-tool and design-complexity channels. Direct agentic monetization remains promising but incompletely measured. That combination supports higher earnings estimates and continued strategic relevance, while arguing against treating every reported productivity improvement as immediate, incremental revenue.
SOURCE BASIS
Financial comparisons are based on Cadence’s 10/26/26 earnings release and CFO commentary, its 07/27/26 prepared remarks and financial tables, the supplied Q3 call transcript and Bloomberg notice, and Cadence’s Maestro and Hexagon D&E announcements. Formal financial disclosures control where they differ from preliminary transcript language or summary labels. Customer performance benchmarks are company-reported and were not independently validated. Scenario forecasts, probabilities, position limits, and valuation multiples are analytical assumptions rather than management commitments.
COMPANY PARTICIPANTS
• Anirudh Devgan, President and Chief Executive Officer. • John Wall, Senior Vice President and Chief Financial Officer. • Richard Gu, Vice President of Investor Relations.
RESEARCH ANALYST PARTICIPANTS
• Jason Celino, KeyBanc Capital Markets. • Jim Schneider, Goldman Sachs. • Vivek Arya, Bank of America Securities. • Siti Panigrahi, Mizuho. • Joe Quatrochi, Wells Fargo. • Charles Shi, Needham & Company. • Harlan Sur, J.P. Morgan. • Lee Simpson, Morgan Stanley. • Joe Vruwink, Baird. • Jay Vleeschhouwer, Griffin Securities. • Gary Mobley, StoneX. • Lachlan Brown, Rothschild. • Kelsey Chia, Citi.
Key Read-Throughs
KEY READ-THROUGHS FROM CADENCE DESIGN SYSTEMS’ Q3 2026 EARNINGS CALL
Cadence’s results provide strong evidence that AI is expanding semiconductor engineering activity, verification requirements, and demand for specialized design infrastructure. The most actionable implications are not uniformly bullish for every AI-related company. Cadence’s expansion from digital implementation into synthesis, signoff, and integrated workflows creates a negative competitive signal for Synopsys even as the overall EDA market strengthens. Further downstream, the call supports custom-silicon development, leading-edge foundry demand, and productivity gains at named chip-design customers. An important, less obvious supplier beneficiary is AMD’s high-end FPGA business, which supplies technology used in Cadence’s prototyping systems. NVIDIA also benefits from the expansion of GPU-accelerated engineering and customer-controlled AI deployments, although the disclosed activity is insufficient to establish a material near-term earnings contribution. The strongest conclusions concern the direction of these economic channels; undisclosed contract values, supplier content, and deployment economics prevent reliable company-specific EPS estimates. Countries below denote corporate domicile rather than the exchange on which a security trades.
EDA SOFTWARE: FULL-FLOW ADOPTION CREATES A MORE CONSEQUENTIAL COMPETITIVE THREAT TO SYNOPSYS (READ-THROUGH 1)
Affected company: Synopsys (SNPS: United States). Direction and magnitude: Negative for relative competitive positioning, with potentially moderate financial significance over multiple renewal cycles. The evidence does not establish an immediate consolidated revenue decline.
Cadence reported 16 new digital and signoff full-flow wins and specifically emphasized expansion beyond its established digital-implementation position. Devgan stated that “some very, very large customers are deploying our full digital flow.” He also argued that advanced-node design makes it increasingly difficult to separate signoff or synthesis from implementation, while agentic workflows create an additional requirement for tightly integrated vertical flows.
The transmission mechanism is competitive displacement and reduced incremental wallet share in categories where Synopsys has substantial exposure. Historically, a customer could use Cadence for implementation while retaining another vendor’s synthesis, timing analysis, or verification products. An integrated agent that repeatedly moves between those tools creates incentives to standardize more of the workflow with the vendor controlling implementation and orchestration. Cadence’s agent strategy can therefore increase the commercial value of an existing implementation relationship rather than requiring an entirely new customer acquisition.
This matters disproportionately because mature EDA software has substantial fixed development costs. A lost expansion opportunity or renewal discount can affect incremental profit more than the associated revenue percentage suggests. Even without outright displacement, Synopsys may need to invest more heavily in interoperability, agent functionality, and commercial concessions to defend its position. The risk is weaker growth relative to the available market, not necessarily declining absolute sales.
The near-term trading catalyst is greater scrutiny of Synopsys’s next guidance and commentary on digital design, full-flow adoption, and customer expansion. The fundamental effect is more likely to emerge over approximately 12-36 months as projects migrate and contracts renew. Synopsys’s own August results already showed strong EDA demand and improving Design IP performance, providing important counterevidence against interpreting Cadence’s wins as an immediate deterioration in Synopsys’s business. The high-conviction negative conclusion is intensifying competitive pressure; a quantified market-share loss is not established.
ENGINEERING SOFTWARE: AGENTS REINFORCE THE VALUE OF VALIDATED DESIGN ENGINES RATHER THAN ELIMINATE THEM (READ-THROUGH 2)
Affected companies: Synopsys (SNPS: United States) and Siemens (SIE: Germany). Direction and magnitude: Positive structural demand implications, potentially material for Synopsys and its Ansys operations; meaningful within Siemens’s engineering-software businesses but smaller at consolidated Siemens level.
Cadence’s recurring revenue grew 18%, separate from the principal up-front hardware contribution. Wall explained that agents can perform substantially more design exploration than individual engineers and repeatedly invoke the underlying tools. His commercial explanation was explicit: “Cadence monetizes the underlying design engines and our agentic orchestration capabilities.” Management also acknowledged that customers will continue building their own agents.
The important implication is that customer-developed AI does not necessarily disintermediate the engineering-software vendor. An agent can generate design candidates, scripts, or workflow decisions, but those outputs still require synthesis, simulation, verification, timing analysis, and physical validation. Ownership of the trusted engineering engine remains economically valuable even when the customer controls the user interface or orchestration layer.
That supports the broader investment case for Synopsys’s design and simulation portfolio and Siemens’s EDA and engineering-software offerings. The positive channel is greater consumption, capacity expansion, broader product adoption, and potentially improved renewal economics. It is not simply additional AI subscription revenue. Ansys exposure belongs to Synopsys following the completed acquisition, rather than to a separately listed Ansys security.
The distinction from generic seat-based software is significant. If agents reduce the number of engineers required for a task while increasing the number of experiments conducted, engineering-tool demand can grow even when engineering headcount does not. Revenue capture will nevertheless depend on licensing terms: higher utilization within an existing unlimited or underutilized contract does not automatically generate incremental sales.
The near-term implication is supportive sector sentiment and reduced credibility for a broad “AI replaces EDA” thesis. The longer-duration catalyst is evidence during 2027 that higher agent-driven workloads are converting into larger contracts and paid capacity. Synopsys had already reported strong EDA demand in August, so Cadence corroborates an established industry trend rather than revealing previously unknown Synopsys orders.
A related trading safeguard is important: the supplied Bloomberg notice’s $4.2 billion RPO figure should not be interpreted as a collapse in total contracted demand. Cadence’s formal release identifies $8.2 billion of total backlog and $4.2 billion expected to be recognized from remaining performance obligations during the next 12 months. The mismatched comparison does not support a bearish EDA-sector bookings conclusion.
SEMICONDUCTOR VERIFICATION SUPPLY CHAIN: AMD HAS A DIRECT, UNDERAPPRECIATED EXPOSURE THROUGH HIGH-END FPGAS (READ-THROUGH 3)
Affected company: Advanced Micro Devices (AMD: United States). Direction and magnitude: Positive for high-end adaptive-computing products; modest at consolidated AMD scale, but more direct than a generic read-through to AI accelerators.
Cadence reported another record hardware quarter, a strong Q4 pipeline, and inventory accumulation to support customer orders. Devgan explained that hardware is generally “sold or consumed based on design size.” Wall stated that there were “no capacity or supply-chain constraints” preventing Cadence from addressing the backlog.
The supplier relationship is verifiable: Cadence’s Protium X3 System Studio documentation identifies AMD’s Versal VP1902 FPGA as the underlying programmable device. More demand for FPGA-based prototyping capacity therefore supports demand for AMD’s high-end adaptive silicon. This provides AMD with exposure to the engineering infrastructure used to develop chips, including chips that may eventually compete with AMD’s own processors or accelerators.
The accounting sequence matters. AMD supplies components before Cadence completes and delivers the associated systems. Cadence’s inventory accumulation can therefore corroborate supplier shipments already made rather than imply entirely new AMD orders after this call. The appropriate positive conclusion is sustained demand and potential replenishment, not a mechanically timed increase in AMD’s next-quarter revenue.
The exposure must also be bounded correctly. Cadence’s record hardware result combines Palladium and Protium, which use different architectures. The entire hardware revenue increase cannot be attributed to AMD FPGA content. Cadence did not disclose the Protium mix, component quantities, procurement timing, or supplier pricing. Higher performance per FPGA can also offset part of the unit demand created by larger designs.
The near-term catalyst is AMD’s next Embedded/adaptive-computing update and evidence that prototyping demand is supporting revenue and product mix. The longer-duration driver is increasing verification intensity as chiplets, larger designs, and more complex system interactions require greater pre-silicon capacity. This is a positive verification-infrastructure exposure, not evidence of an improvement in AMD’s merchant-GPU competitive position.
CUSTOM SILICON: EXPANDING DESIGN PARTICIPATION SUPPORTS BROADCOM AND MARVELL, BUT DOES NOT IDENTIFY NEW AWARDS (READ-THROUGH 4)
Affected companies: Broadcom (AVGO: United States) and Marvell Technology (MRVL: United States). Direction and magnitude: Positive for custom-silicon and associated connectivity opportunities; potentially material over several years, with limited incremental near-term information from this call alone.
Cadence stated that approximately 45% of its business now comes from systems companies rather than traditional semiconductor suppliers. Devgan described expanding design activity among hyperscalers and additional participation from space, financial-services, automotive, and robotics companies. Cadence’s IP revenue grew 24%, supported by custom silicon, advanced nodes, memory interfaces, and chiplet architectures. Management also noted that new entrants naturally create opportunities for IP, hardware, and design services.
The economic transmission is broader than customers writing their own RTL. More custom-silicon programs increase demand for implementation expertise, high-speed interfaces, memory connectivity, packaging integration, verification, and manufacturing execution. Broadcom and Marvell participate in these technically demanding parts of the development process. Lowering selected design barriers can increase the number of viable programs without eliminating the need for experienced semiconductor partners.
The strongest positive implication is therefore expansion of the custom-silicon opportunity, including supporting silicon and connectivity, rather than an assumption that every new design becomes a large accelerator program. Smaller entrants may use licensed IP and design services without generating hyperscaler-scale production volumes. Design starts also precede meaningful production revenue, often by a substantial period.
The novelty is limited. Broadcom’s September results already identified exceptionally strong demand for custom AI accelerators and networking. Marvell’s August release anticipated an acceleration in its custom business, and its October investor event had already put substantial long-term AI expectations into the market. Cadence provides independent corroboration from an upstream engineering supplier, not a new customer allocation or reason to add undisclosed programs to either company’s forecast.
The near-term trading channel is confidence in existing custom-silicon growth expectations during the next earnings cycle. The more important fundamental effect is over approximately 12-36 months as additional programs convert into design wins, tapeouts, and production. No award should be assigned to Broadcom or Marvell from Cadence’s unnamed space-company engagement.
A relevant competitive limitation is that better tools also help customers retain more design work internally. The high-conviction positive exposure is the expansion of complex custom-chip development; the percentage of spending captured by an outside partner remains program-specific. In portfolio terms, Broadcom, Marvell, and the major hyperscalers remain economically connected exposures rather than independent sources of AI diversification.
FABLESS SEMICONDUCTORS: NAMED PRODUCTION DEPLOYMENTS SUPPORT ENGINEERING CAPACITY, NOT IMMEDIATE COST-CUTTING ESTIMATES (READ-THROUGH 5)
Affected companies: MediaTek (2454: Taiwan) and Socionext (6526: Japan). Direction and magnitude: Positive for engineering productivity and execution capability; potentially meaningful over a product cycle, but limited evidence for immediate consolidated EPS changes.
Cadence reported that MediaTek had deployed ChipStack in its production digital-verification flow, achieving a 50% to 70% improvement in verification coverage and engineering-effort improvements of 1.4x to 2x, with deployment expanding across design teams. Socionext was identified as deploying InnoStack in production design and expecting up to 5x overall productivity gains while maintaining design quality.
MediaTek’s reported production use is particularly important because it is evidence of operational adoption rather than a laboratory demonstration. Better verification can reduce the probability of costly design escapes, while lower engineering effort per task can increase the number of designs or verification scenarios supported by an existing team. The economic benefit can appear through schedule reliability, additional product capacity, avoided rework, or lower development cost per program.
For Socionext, the value is closely aligned with its custom-SoC business model. Reusing engineering knowledge and automating parts of physical design can improve the scalability of a scarce engineering workforce. Its October 20 announcement specifically described deployment on a large-scale 3-nanometer SoC and plans to expand the approach across projects. More projects supported per engineering team can improve growth capacity even if absolute R&D spending continues to rise.
The distinction between measured and prospective outcomes is essential. MediaTek’s figures were presented as achieved deployment results; Socionext’s up to 5x figure remains an expectation. Neither establishes an equivalent reduction in total corporate engineering expense, total chip-development time, or cost of goods sold. Additional EDA licensing, compute, integration, and validation costs must also be considered.
The clearest near-term catalyst is Socionext’s scheduled October 28 results, where deployment breadth, engineering capacity, and project conversion could provide additional evidence. However, the underlying Socionext announcement was already public before Cadence’s call, reducing its novelty as a trading signal. For MediaTek, the relevant next reporting-cycle evidence is expansion beyond the initial verification deployment and whether management associates the tools with improved delivery or development efficiency.
The fundamental horizon is approximately 6-24 months. Productivity gains are more likely to be reinvested in additional designs and faster execution than immediately converted into headcount reductions. That is positive for competitiveness, but it argues against mechanically raising near-term margins by applying the reported task-level efficiency multiples to the entire cost base.
LEADING-EDGE FOUNDRY AND PACKAGING: TSMC BENEFITS FROM DESIGN PROLIFERATION REGARDLESS OF WHICH CHIP ARCHITECTURE WINS (READ-THROUGH 6)
Affected company: Taiwan Semiconductor Manufacturing Company (TSM: Taiwan). Direction and magnitude: Positive and potentially material over the medium term; limited incremental near-term surprise because TSMC had already reported strong leading-edge demand.
Cadence highlighted new 2-nanometer projects, growing demand for advanced-node IP, expanding custom-silicon development, and the increasing importance of verifying chiplets as interconnected systems. Devgan emphasized that customers are verifying not only individual chiplets but also their interactions with other chiplets, while both component complexity and system scale are increasing.
The transmission mechanism is broader participation in advanced manufacturing and packaging. More viable custom designs expand the prospective customer and product pipeline for leading-edge processes. Greater chiplet and system integration raises the importance of packaging, interfaces, and co-optimization rather than confining value creation to the transistor layer.
TSMC has a comparatively architecture-agnostic exposure. A shift between merchant accelerators and customer-designed chips can redistribute value among chip vendors without necessarily reducing the foundry’s opportunity, provided the successful designs use its processes and packaging ecosystem. This makes TSMC less dependent on identifying the winning accelerator designer than an individual fabless supplier, although it remains highly exposed to the overall AI investment cycle.
Cadence’s evidence is corroborative rather than a new demand inflection. TSMC’s October 15 release already showed 2-nanometer technology at 8% of wafer revenue and explicitly anticipated a steep further ramp in Q4. Cadence adds evidence from the design pipeline that advanced-node activity is broad and technically demanding. It does not establish new wafer allocations, additional packaging orders, or higher capital-expenditure guidance.
The near-term catalysts are subsequent monthly revenue releases and confirmation of the leading-edge ramp. The longer-duration mechanism is conversion of today’s design activity into manufacturing revenue over approximately 12-24 months and beyond.
The 48x future chip-size claim relayed by Devgan should not be translated into a 48x foundry, packaging, or equipment revenue forecast. It was a technology-roadmap observation, not a financial commitment. Design complexity, physical area, packaging content, manufacturing yield, and customer shipment volumes are different variables. Similarly, this call alone is insufficient to allocate incremental orders to specific lithography, bonding, testing, or cooling suppliers.
ACCELERATED COMPUTING: NVIDIA BENEFITS FROM ENGINEERING WORKLOADS THAT DO NOT REQUIRE EXCLUSIVE DEPENDENCE ON FRONTIER MODELS (READ-THROUGH 7)
Affected company: NVIDIA (NVDA: United States). Direction and magnitude: Positive for accelerated engineering and enterprise deployment; modest near-term consolidated financial significance, with a more important long-duration platform implication.
Cadence reported strong adoption of Millennium, deployment of GPU-accelerated electronic and mechanical simulation, and a 5x acceleration in selected Nokia design and analysis workflows on an integrated on-premises platform. The Maestro announcement accompanying the call explicitly identified collaboration with NVIDIA through Nemotron models and OpenShell. These are concrete product relationships rather than a generic assumption that any AI application benefits NVIDIA.
The positive economic channel is a combination of accelerated simulation, model customization, inference, and additional engineering exploration. A customer can choose smaller or specialized models and still require substantial accelerated computing to evaluate designs and run physics-based solvers. NVIDIA therefore does not need a single frontier-model provider to capture the entire orchestration layer for this workload category to expand.
The deployment model is also significant. Customers can keep sensitive design information within their own environments while using specialized models and accelerated tools. That can unlock engineering workloads that would otherwise face confidentiality or governance barriers. Commercial opportunity can arise through customer-owned systems, dedicated enterprise infrastructure, or cloud deployment rather than exclusively through public-model API consumption.
The reported up to 5x token efficiency is not a reliable indicator of an equivalent reduction in NVIDIA hardware demand. Token consumption is only part of total engineering compute. More efficient inference can lower the cost of launching experiments, while those experiments increase solver activity. Conversely, efficiency gains do not guarantee that total compute spending rises; workload expansion and utilization must be observed.
The immediate catalyst is Maestro’s selected early-access rollout during Q4 2026 and additional production deployments of accelerated engineering tools. The NVIDIA collaboration was already announced earlier on the day of the call, so the earnings discussion is validation rather than a separate new contract. The more meaningful financial horizon is 2027 and beyond as these workflows move from selected deployments into broader production use.
The portfolio implication is narrower than a blanket NVIDIA earnings upgrade. The call supports diversification of accelerated-computing demand into engineering and physical simulation, but discloses neither GPU quantities nor NVIDIA revenue. It also does not resolve the separate competitive question of how much hyperscaler compute ultimately moves toward custom accelerators. The positive read-through is to NVIDIA’s engineering-computing platform, not proof that every part of its existing market position benefits equally.
Report record
- Sector
- Information Technology
- Industry
- Software
- Fiscal period end
- September 30, 2026
- Report date
- October 26, 2026
- Analysis
- 6616 words
- Read-throughs
- 2835 words
- Content fingerprint (PDF)
08d49eb784d2- Content fingerprint (analysis)
ba2173226784- Content fingerprint (read-throughs)
10562ccf01eb
Prepared from the company's earnings release and earnings call transcript. Figures as reported by the company. For information only. Not investment advice.
More from Cadence Design Systems, Inc.
No other reports yet.
All Cadence Design Systems, Inc. reports
More in Information Technology
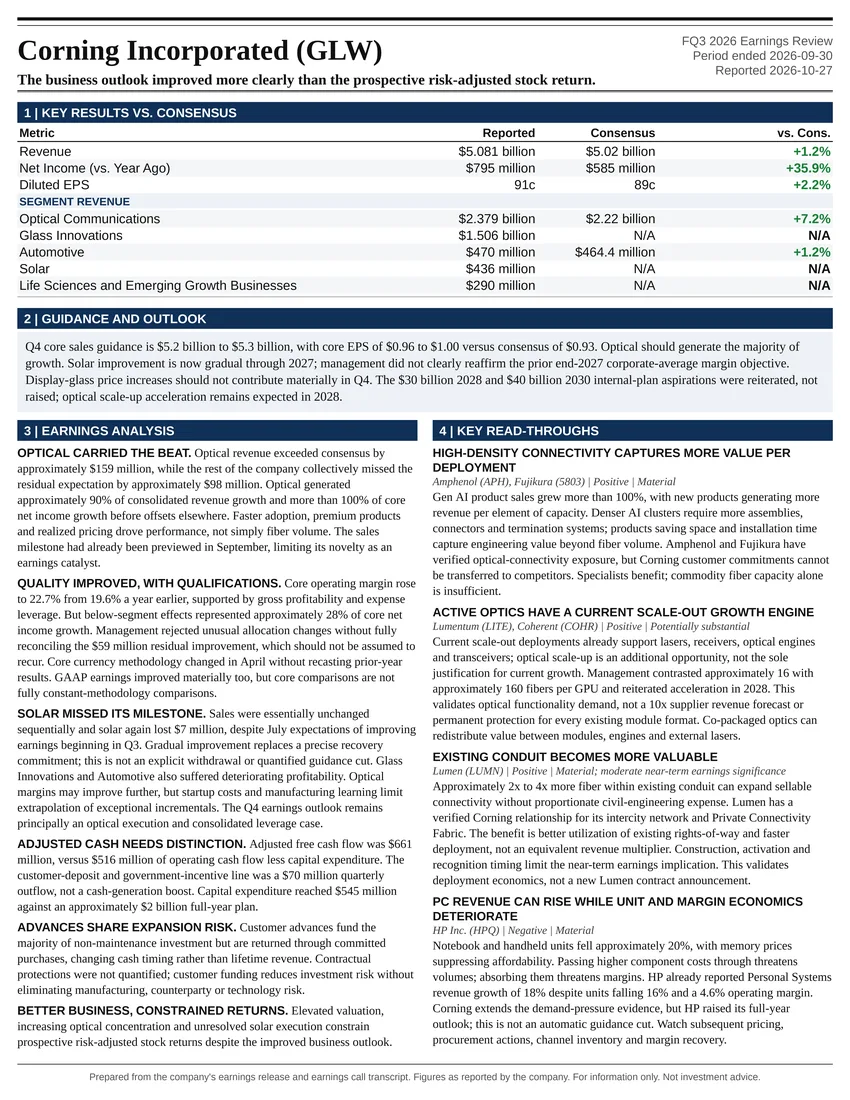
The business outlook improved more clearly than the prospective risk-adjusted stock return.
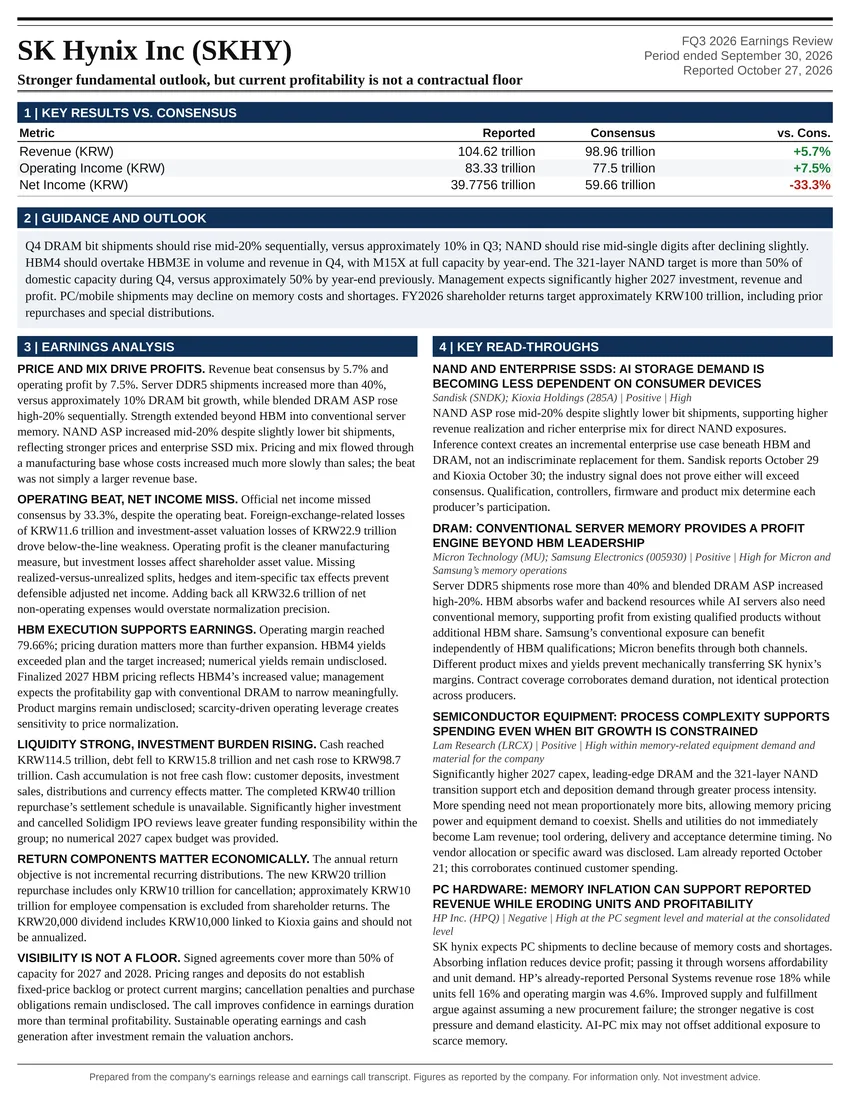
Stronger fundamental outlook, but current profitability is not a contractual floor
All Information Technology reports
Follow @AtlasPeakRes on X for new earnings reports as they publish.