The business outlook improved more clearly than the prospective risk-adjusted stock return.
Earnings Reports
F5, Inc. FQ4 2026 Earnings Report
F5, Inc. (FFIV) FQ4 2026 earnings: Substantially stronger evidence of revenue durability than of accelerating earnings or cash generation. Full earnings analysis, key read-throughs, and the one-page exhibit from Atlas Peak Research.
F5, Inc. (FFIV)
Sector: Information Technology · FQ4 2026 · Period end September 30, 2026 · Reported October 27, 2026
F5’s Q4 FY2026 results strengthen the case that its application delivery franchise is benefiting from structural demand beyond a conventional hardware replacement cycle. However, the quarter provides substantially stronger evidence of revenue durability than of accelerating earnings or cash generation.
Download the one-page report (PDF)
View one-page exhibit
Download analysis (.md)
Download read-throughs (.md)
Post to X
One-Page Exhibit
Earnings Analysis
EXECUTIVE CALL SUMMARY: F5 Inc. (10/27/26)
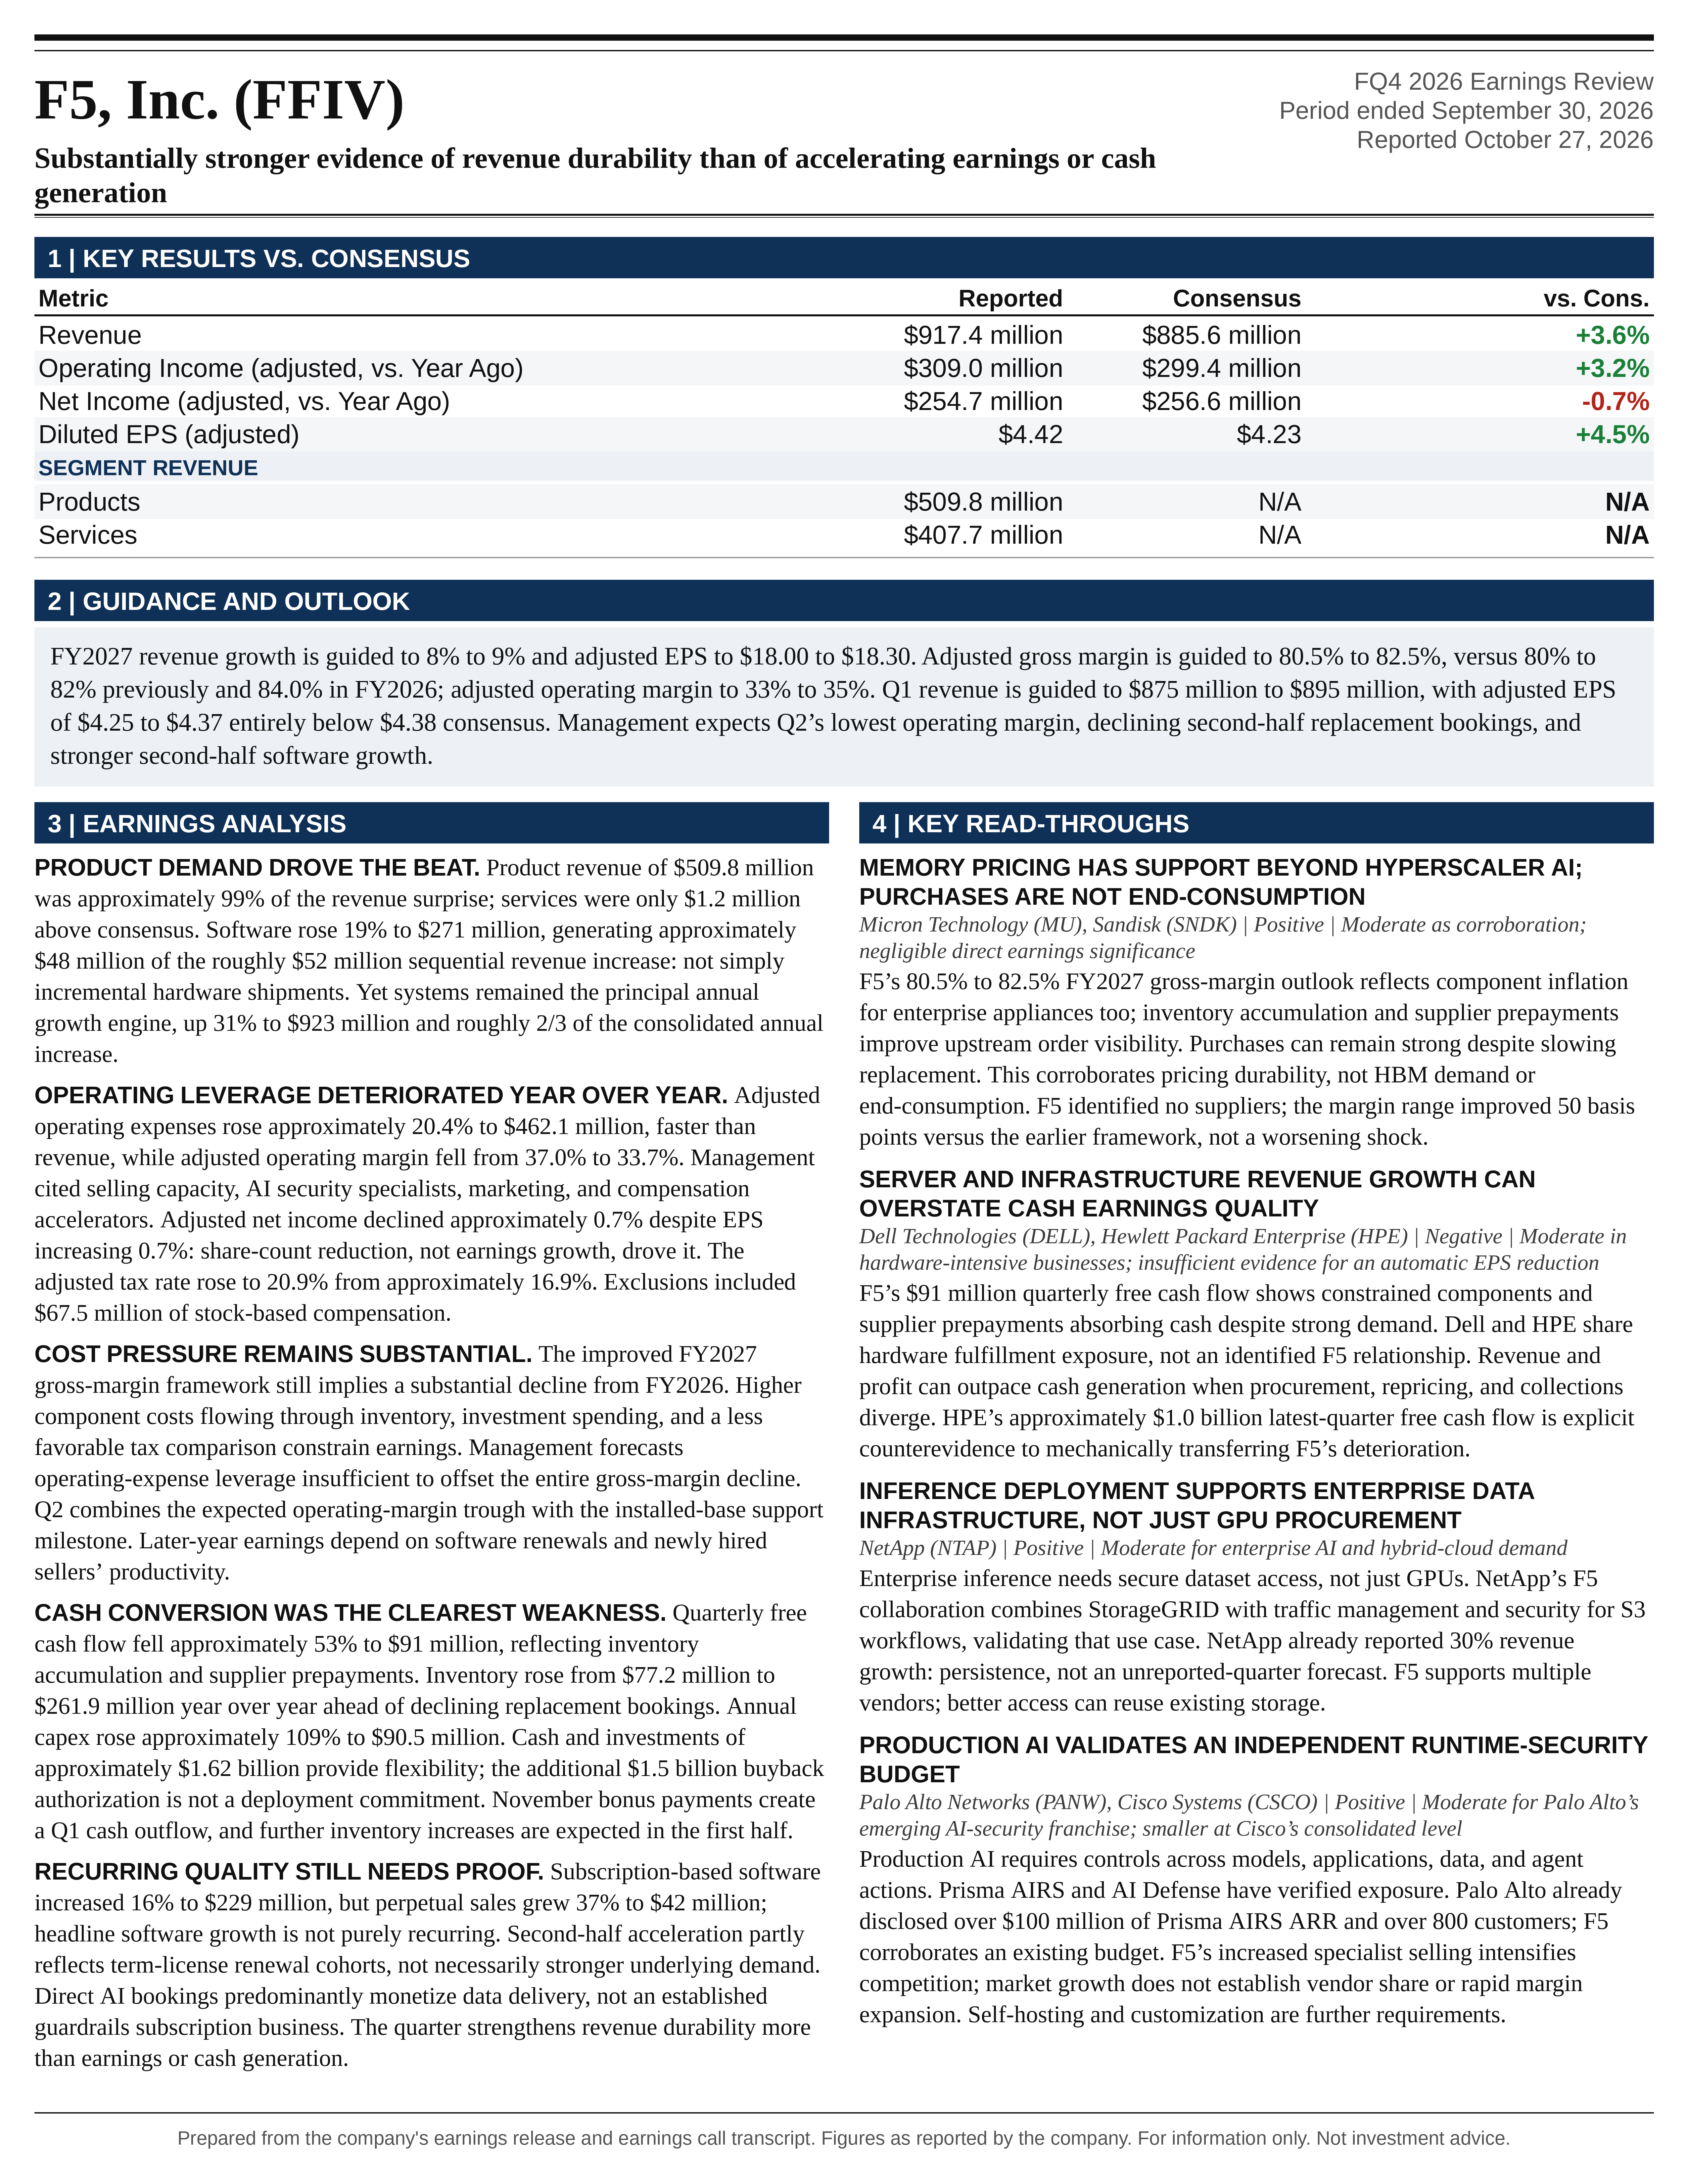
F5’s Q4 FY2026 results strengthen the case that its application delivery franchise is benefiting from structural demand beyond a conventional hardware replacement cycle. However, the quarter provides substantially stronger evidence of revenue durability than of accelerating earnings or cash generation. Revenue exceeded consensus by 3.6%, product revenue increased 23%, software growth accelerated to 19%, and direct AI bookings exceeded $100 million for FY2026. Against those positives, adjusted operating margin declined 330 basis points year over year, adjusted net income declined slightly, and quarterly free cash flow fell approximately 53%. The appropriate investment stance is constructive on the business but valuation-disciplined on the equity. The earnings surprise alone does not justify an aggressive increase in exposure.
The central investment question has shifted. F5 no longer needs merely to demonstrate that demand exists for its installed application delivery infrastructure. It must demonstrate that software expansion, security adoption, and new AI workloads can sustain growth after replacement demand moderates, while absorbing higher component costs and producing acceptable returns on increased selling capacity and working capital. FY2027 guidance describes that transition explicitly: systems growth should be stronger in the first half, software growth stronger in the second half, and operating expenses should decline as a percentage of revenue despite continued investment.
The financial outlook is positive but less powerful than the headline revenue momentum suggests. FY2027 revenue growth guidance of 8% to 9% implies approximately $3.690 billion to $3.724 billion of revenue. Adjusted EPS guidance of $18.00 to $18.30 implies only 2.9% to 4.6% growth from FY2026’s $17.49. The $18.15 midpoint exceeds the supplied Bloomberg consensus of $18.03 by just 0.7%. Q1 revenue guidance is above consensus at the midpoint, but the entire Q1 EPS range is below consensus. The forecast therefore supports sustained commercial momentum, not an immediate acceleration in shareholder earnings.
An important counterbalance is that the FY2027 gross-margin outlook actually improved relative to earlier guidance. The new 80.5% to 82.5% range is 50 basis points higher at both endpoints than the 80% to 82% framework reiterated on the July call. The anticipated decline from FY2026’s 84.0% remains substantial, but it is not a newly disclosed deterioration of that magnitude. The more consequential incremental issue is the combination of investment spending, higher component costs flowing through inventory, and a less favorable tax comparison.
The strongest evidence supporting a more durable franchise is the combination of broader product adoption, competitive consolidation wins, software renewal expansion, and emerging production AI deployments. The weakest part of the investment case remains the conversion of these indicators into incremental, high-quality recurring revenue and cash flow. AI security is strategically important, but most disclosed direct AI bookings still come from data delivery, while SaaS and managed services remain a relatively small share of consolidated revenue.
QUARTERLY PERFORMANCE AND THE COMPOSITION OF THE BEAT
Q4 revenue of $917.4 million exceeded the supplied Bloomberg consensus of $885.6 million by $31.8 million, or 3.6%. Product revenue of $509.8 million exceeded consensus of $478.2 million by $31.6 million, accounting for approximately 99% of the revenue surprise. Services revenue of $407.7 million was only $1.2 million above consensus. The outperformance was therefore concentrated in product demand rather than an unusually favorable services outcome.
The comparison with management’s own forecast was also strong. F5’s July 27 earnings release guided Q4 revenue to $870 million to $890 million and adjusted EPS to $4.14 to $4.26. Actual revenue exceeded the upper endpoint by $27.4 million, or 3.1%, and the midpoint by 4.3%. Adjusted EPS of $4.42 exceeded the upper endpoint by $0.16, or 3.8%, and the supplied consensus of $4.23 by 4.5%.
Year-over-year revenue increased from $810.1 million to $917.4 million. Product revenue increased from $414.1 million to $509.8 million, while services increased from $396.0 million to $407.7 million. Product consequently represented approximately 55.6% of quarterly revenue, compared with 51.1% a year earlier. This shift supports faster consolidated growth but increases exposure to product shipment timing, renewal cohorts, and component economics relative to the more stable services base.
Systems revenue reached $239 million, increasing 29%, while software reached $271 million, increasing 19%. The sequential comparison is particularly informative. Q3 systems revenue was approximately $240 million, software was $223 million, and services were $402 million. Software therefore generated approximately $48 million of the roughly $52 million sequential revenue increase. Q4 was not simply another quarter of incremental hardware shipments. Its sequential acceleration was overwhelmingly software-led.
The annual comparison nevertheless shows that hardware remained the principal growth engine during FY2026. Full-year systems revenue increased 31% to $923 million, software increased 8% to $870 million, and services increased approximately 3% to $1.623 billion. Systems contributed roughly 2/3 of the consolidated annual revenue increase. The distinction matters: the business exited FY2026 with improved software momentum, but the completed year’s growth still depended heavily on systems.
F5 delivered 9 consecutive quarters of product growth of at least 10%. That duration weakens the argument that recent performance reflects only a brief replacement surge. It does not, however, establish that the recent growth rate is sustainable. The company’s own FY2027 forecast assumes a material deceleration in systems growth and a change in the source of incremental revenue.
EARNINGS QUALITY, OPERATING LEVERAGE, AND TAX EFFECTS
Adjusted gross margin was 84.0%, compared with 84.3% a year earlier and 84.2% in Q3. The relatively modest gross-margin movement contrasts with a much larger decline in adjusted operating margin, from 37.0% to 33.7% year over year. The principal Q4 margin issue was therefore operating expenditure rather than a sudden collapse in product gross profitability.
Detailed financial statements show adjusted operating expenses increasing approximately 20.4%, from $383.9 million to $462.1 million, substantially faster than revenue growth of 13.2%. Adjusted operating income increased only 3.2%, from $299.4 million to $309.0 million. The incremental operating margin on the year-over-year revenue increase was approximately 9%, demonstrating limited conversion of incremental revenue into operating profit.
The comparison against expectations is less negative. Applying the supplied 33.8% consensus operating margin to consensus revenue implies approximately $299.3 million of expected operating income. Actual operating income exceeded that amount by approximately $9.7 million, equivalent to roughly 30% conversion of the revenue surprise. F5 delivered a meaningful profit beat against expectations even though its year-over-year operating leverage deteriorated. These are different conclusions and should not be conflated.
Management attributed the expenditure increase to expanded selling capacity, AI security specialists, marketing, and higher commission and bonus accelerators associated with performance. Cooper Werner stated, “the biggest driver on the OpEx are investments that we're making to drive future growth.” Actual adjusted operating expenses exceeded the prior $430 million to $442 million guidance range by approximately $20 million at the upper endpoint. The expenditure overrun is material even if part of it was mechanically linked to stronger sales.
The GAAP expense detail supports the explanation that investment increased. Sales and marketing expense rose approximately 27% year over year to $274.3 million, while research and development increased approximately 21% to $164.6 million. These increases are consistent with a larger commercial and product-development commitment. They do not establish the eventual return on that investment. Seller productivity, new-product bookings, customer acquisition economics, and renewal expansion must subsequently validate the spending.
Adjusted net income declined approximately 0.7%, from $256.6 million to $254.7 million, while adjusted EPS increased approximately 0.7%, from $4.39 to $4.42. The diluted share count declined approximately 1.3%, from 58.4 million to 57.7 million. Thus, the small EPS increase reflected share-count reduction rather than growth in aggregate adjusted earnings. At the prior-year diluted share count, current adjusted earnings would have produced approximately $4.36 per share.
Tax comparisons explain another important part of the apparent earnings weakness. The current adjusted tax rate was 20.9%, compared with approximately 16.9% a year earlier, as derived from the release reconciliation. Holding current pretax earnings constant, that difference represents approximately $0.23 per share. Q3’s adjusted tax rate was an unusually low 12.4%, reflecting disclosed discrete tax benefits. Consequently, the sequential EPS decline from $4.73 to $4.42 should not be interpreted entirely as operating deterioration.
GAAP operating margin was 23.1%, and GAAP EPS was $3.23, compared with adjusted figures of 33.7% and $4.42. Q4 exclusions included $67.5 million of stock-based compensation, $9.1 million of acquired-intangible amortization, $10.3 million of acquisition-related charges, and other items. Stock compensation alone represented approximately 7.4% of revenue. These exclusions are economically relevant, particularly when repurchases are presented as shareholder distributions. Adjusted earnings remain useful for operating comparisons, but they should not be treated as cash earnings without considering dilution and recurring compensation costs.
FY2027 GUIDANCE AND CHANGES FROM PREVIOUS EXPECTATIONS
The new FY2027 revenue range of approximately $3.690 billion to $3.724 billion follows FY2026 revenue of $3.417 billion, which increased 10.6%. The 8% to 9% growth forecast therefore represents deceleration from FY2026 but continued growth on a higher base than contemplated earlier in the year.
The May investor framework targeted upper-single-digit revenue growth through FY2029. The current 8% to 9% forecast is consistent with that directional framework rather than an entirely new growth regime. More specifically, management raised its FY2027 systems expectation from the previously discussed mid-to-upper-single-digit range to upper-single-digit growth. Software remains targeted to grow at least 10%, with management describing the expected outcome as “solid double-digit” growth. Services remain expected to grow at a low-to-mid-single-digit rate.
The higher FY2026 base is important. In July, management expected FY2026 revenue growth of approximately 9% to 10% and EPS of $17.21 to $17.33. Earlier guidance was 7% to 8% revenue growth and $16.25 to $16.55 of EPS. Actual FY2026 EPS of $17.49 exceeded the July upper endpoint by $0.16. The current FY2027 growth rate therefore applies to earnings and revenue that already exceeded earlier plans. Maintaining a similar revenue growth rate on that higher base is favorable, but it does not by itself establish an increase in a previously undisclosed absolute FY2027 EPS target.
The revenue-category arithmetic suggests that software probably needs to grow materially faster than 10% to support the consolidated midpoint. Systems represented approximately 27% of FY2026 revenue, software 25.5%, and services 47.5%. As an illustrative calculation, 8% systems growth and 4% services growth would require approximately 17.4% software growth to produce consolidated growth of 8.5%. Different category outcomes change that requirement, but the calculation shows why “double-digit software growth” should not automatically be modeled as 10% to 12%.
This is a meaningful execution requirement. SaaS acceleration helps, but the business remains too small to carry the entire software growth target. For illustration, 15% term-subscription growth, 16% SaaS growth, and flat perpetual revenue would generate only approximately 13.3% total software growth using the disclosed annual category bases. Reaching the consolidated midpoint under moderate systems and services assumptions could therefore require stronger term expansion, stronger perpetual sales, or higher growth elsewhere.
FY2027 adjusted gross-margin guidance of 80.5% to 82.5% compares with 84.0% in FY2026. At the revenue midpoint, the 250-basis-point difference between the gross-margin midpoints represents approximately $92.7 million of gross profit relative to maintaining 84.0%. At an illustrative 20% tax rate and the Q4 diluted share count, that is approximately $1.29 per share before operating offsets. Component inflation is therefore a substantial earnings constraint, not a minor modeling adjustment.
Nevertheless, the new gross-margin range is 50 basis points better than the 80% to 82% range reiterated in July. At the current revenue midpoint, that improvement represents approximately $18.5 million of pretax profit, or about $0.26 per share under the same illustrative assumptions. The correct interpretation is continued material cost pressure, but modestly better expected gross-margin performance than the previous framework.
Adjusted operating-margin guidance of 33% to 35% compares with 35.1% in FY2026. At the revenue and operating-margin midpoints, operating income would be approximately $1.260 billion, increasing approximately 5.1% from FY2026. The implied adjusted operating-expense ratio is approximately 47.5%, versus 48.8% in FY2026. Management is therefore forecasting operating-expense leverage, but insufficient leverage to offset the entire gross-margin decline.
FY2027’s 19% to 21% adjusted tax-rate range also compares unfavorably with an approximately 18.6% FY2026 adjusted rate. A move to the 20% midpoint represents roughly $0.30 of EPS pressure on an otherwise unchanged earnings base. This helps explain why forecast EPS growth trails revenue growth despite anticipated operating-expense efficiency.
The May investor framework targeted an adjusted EPS CAGR of at least 10% through FY2029. The current FY2027 EPS growth forecast falls below that multiyear ambition. A single year of lower growth does not constitute a formal withdrawal of the CAGR objective, but it increases dependence on subsequent margin recovery and stronger earnings growth in FY2028 and FY2029.
Q1 GUIDANCE AND THE TIMING OF THE FY2027 EARNINGS PROFILE
Q1 revenue guidance of $875 million to $895 million has an $885 million midpoint, approximately 0.9% above the supplied consensus of $876.8 million. Relative to approximately $822 million in Q1 FY2026, the range implies growth of roughly 6.4% to 8.9%, with 7.7% at the midpoint.
Adjusted EPS guidance of $4.25 to $4.37 is below the supplied $4.38 consensus throughout the range. The $4.31 midpoint is approximately 1.6% below consensus and 3.1% below the prior-year $4.45. Thus, the opening quarter is expected to deliver healthy revenue growth but lower EPS.
At the midpoints of revenue, gross margin, and operating expenses, Q1 guidance implies approximately $299.7 million of adjusted operating income and a 33.9% operating margin. This calculation combines separate guidance midpoints rather than reproducing an explicitly paired company earnings scenario. It nevertheless indicates that the sequential gross-margin decline is expected to be substantially offset by lower operating expenses following Q4’s elevated spending and compensation accruals.
The annual outlook places additional earnings improvement beyond Q1. Assuming the supplied annual and Q1 consensus figures are from a consistent pre-release snapshot, annual guidance less Q1 guidance implies approximately $13.84 of EPS for the remaining quarters, versus approximately $13.65 implied by consensus. The approximate $0.19 difference is a mechanical residual, not separately published quarterly guidance, and annual versus quarterly share-count effects can affect the comparison.
Management also expects Q2 to have the lowest operating margin because of payroll-tax resets, sales-capacity investment, and the annual customer event. The earnings profile therefore depends increasingly on later-year software renewals and operating leverage. That timing is commercially plausible, but it increases sensitivity to renewal execution and the productivity of newly hired sellers.
SYSTEMS: STRONG DEMAND, BUT THE REPLACEMENT TEST IS APPROACHING
The systems outlook is more credible than a simple extrapolation of replacement demand because management identified several distinct sources of growth: competitive displacement, capacity expansion, sovereignty-related deployments, and AI data delivery. The company also described approximately 1/3 of systems business as new opportunities and approximately 2/3 as the “refresh plus” motion.
That classification requires caution. The refresh category includes capacity expansion and higher-performance replacements, not just like-for-like replacement. Conversely, management expects some expansion previously purchased alongside refreshes to appear as standalone new opportunities after the replacement cycle moderates. A change in those category proportions will therefore not necessarily represent an equivalent change in underlying customer demand.
The most consequential statement was that “replacement bookings will be down year-over-year” in the second half of FY2027. Management expects new and expansion demand to offset that decline sufficiently to preserve positive systems growth. The July call identified an installed-base software-support milestone in fiscal Q2 FY2027, providing a concrete timing anchor for the expected moderation.
The investment test is therefore not whether systems growth slows from 31% in FY2026. That deceleration is explicitly embedded in guidance. The test is whether systems can maintain positive growth after replacement bookings decline, without relying disproportionately on price increases, accelerated customer purchasing, or additional inventory accumulation.
Pricing will complicate that assessment. Management reiterated an annual pricing-review philosophy, with off-cycle adjustments possible if component costs accelerate. The July call indicated that component-related price adjustments would contribute more to FY2027 than to Q3 FY2026. Reported systems growth could consequently include a greater price contribution next year. Unit growth, capacity shipped, realized pricing, and gross profit dollars would provide a cleaner measure of underlying expansion than revenue alone.
Supply availability appears supportive. Management stated that inventory had positioned the company “not just for our guidance, but for upside.” That reduces the risk that component shortages prevent realization of stronger demand. It does not eliminate component bottlenecks, validate the demand forecast, or establish that secured inventory will be consumed at attractive margins.
SOFTWARE: IMPROVING MIX, WITH RENEWAL TIMING STILL IMPORTANT
Q4 software revenue increased 19% to $271 million. Subscription-based software increased 16% to $229 million and represented approximately 85% of software revenue. Perpetual software increased 37% to $42 million. The quarter therefore contained a strong subscription contribution, but also benefited from faster-growing perpetual sales. The 19% headline should not be treated as a purely recurring-revenue growth rate.
For FY2026, term-based subscriptions contributed $578 million, increasing 14%, while SaaS and managed services contributed $182 million, increasing 3%. The draft transcript’s $11 million annual perpetual-license figure is internally inconsistent with the $870 million total and the other categories. The figures imply approximately $110 million of perpetual revenue, subject to rounding, which is also consistent with the quarterly amounts. The $11 million figure should not be used in modeling.
Term subscriptions remain the dominant software revenue source. Management described strong utilization, renewal rates, and expansion within multiyear agreements. Its explanation that Q4 upside reflected new use cases and higher expansion, rather than merely unanticipated contract timing, is encouraging. However, no quantified renewal rate, expansion rate, net retention measure, or FY2027 renewal-dollar schedule was supplied on this call.
Recurring contractual relationships do not necessarily produce ratable quarterly revenue. The license components of term arrangements can create revenue concentration around renewal dates, whereas SaaS is recognized over the service period. The expected second-half acceleration is therefore partly a contractual-cohort effect. It should not automatically be interpreted as an acceleration in underlying end-market demand.
The SaaS indicators improved more clearly than FY2026 recognized revenue suggests. Total SaaS and managed-services ARR reached $211 million, increasing 14%, while core ARR increased 24%. The difference reflects the legacy-offering transition. Management stated that the transition was complete and that SaaS would become an additional software growth contributor. This direction had already been discussed earlier in FY2026; the quarter provides additional evidence supporting it rather than introducing the thesis for the first time.
The $211 million ending ARR is approximately 16% above FY2026 SaaS and managed-services revenue of $182 million. If the exit run rate were maintained throughout FY2027, with comparable definitions and no material churn or other changes, it would imply approximately $29 million of additional annual revenue. That is an illustrative run-rate calculation, not company guidance. It represents only about 0.8% of consolidated FY2026 revenue, demonstrating that SaaS acceleration is helpful but not sufficient by itself to drive the consolidated outlook.
Software represented approximately 25.5% of annual revenue, and SaaS and managed services represented approximately 5.3%. The disclosed 68% recurring-revenue contribution in Q4 includes other recurring sources, particularly services. F5’s recurring exposure is meaningful, but its current economic model remains materially different from a predominantly ratable SaaS business.
AI: COMMERCIAL PROGRESS IS REAL, BUT THE REVENUE MIX MATTERS
Direct AI use-case bookings exceeded $100 million in FY2026 and increased nearly 300%, implying approximately 4x the prior-year level. Active direct AI customers increased 4x to more than 200. These disclosures establish a commercial business rather than merely an AI product roadmap.
They do not establish recognized AI revenue, recurring AI revenue, contract duration, gross margin, or incremental revenue beyond purchases that would otherwise have occurred. A customer’s ADC purchase can become AI-driven without every dollar representing a new market opportunity. Direct AI bookings, indirect AI-related capacity demand, and existing product revenue must not be added together as separate revenue streams.
The most important qualification came from management itself: “The majority of that is actually AI data delivery.” The near-term monetization engine is therefore primarily F5’s established delivery infrastructure being deployed for AI workloads, rather than a large, already-established AI guardrails subscription business.
AI data delivery has an identifiable technical role. Storage access, secure routing, traffic distribution, and protocol support can constrain the utilization of expensive compute infrastructure. F5 cited S3 and MCP capabilities, storage partnerships, and 29.2 terabits of deployed AI data-delivery capacity in Q4, increasing nearly 250%. That capacity indicator supports deployment growth, but it is not equivalent to actual utilization, traffic carried, customer savings, or revenue. Pricing per unit of capacity and the amount of incremental software attachment remain undisclosed.
Management’s AI market forecast rises from approximately $1 billion currently to $11 billion by 2030, including $9 billion of AI security and $1 billion each of data delivery and factory load balancing. The endpoint represents approximately 82% annualized growth over 4 years. Such a forecast is highly sensitive to market definitions, spending adoption, and competitive substitution.
There is also an important mismatch between current monetization and projected market size. Data delivery generates most disclosed AI bookings, but security represents approximately 82% of the projected 2030 AI opportunity. Capturing the forecast opportunity requires success in a market where F5’s financial contribution is currently much less established.
AI runtime security has a credible architectural rationale. Enterprises using multiple models across private and public environments need consistent controls over prompts, responses, sensitive data, model access, and agent actions. F5’s deployment flexibility and established traffic position can reduce integration friction. The disclosed selection by an unnamed global AI infrastructure provider to protect up to 500 models is strategically significant, particularly because the requirements included self-hosting and customized guardrails.
However, “up to 500” models is a potential deployment scope, not evidence of 500 active paid implementations or a disclosed contract value. Likewise, model coverage does not directly establish recurring revenue. The most useful next disclosures would be production customers, paid model coverage, subscription value, expansion, renewal performance, and unit economics.
AI factory load balancing is less mature. Management explicitly distinguished bare-metal GPU rental from enterprise token services, indicating that the former does not create a similarly significant F5 requirement. This is an important constraint on the investment narrative: aggregate GPU spending is not a direct proxy for F5’s addressable revenue.
Indosat and Telenor provide useful evidence of demand for tenant isolation, policy enforcement, governance, and traffic management. Their October announcements occurred after the September quarter-end and should not be assigned an undisclosed Q4 revenue contribution. Moreover, F5’s Telenor announcement describes token-aware governance and more advanced inference-aware optimization as planned capabilities. Current deployment selection is evidence of an infrastructure position, not proof that all prospective token-throughput or cost benefits have already been realized.
SECURITY DIFFERENTIATION AND THE LIMITS OF THE CLAIMS
Management’s core architectural argument was that “you cannot enforce consistent runtime protection without being in the data path.” F5’s presence in enterprise application traffic creates a valuable distribution and enforcement position. Integrating application delivery, WAF, API security, bot defense, and AI controls can reduce policy fragmentation and increase switching costs.
That position is an advantage, not proof of exclusive capability. Inspection of encrypted application traffic, application-specific context, identity controls, model semantics, and east-west agent interactions requires more than basic traffic forwarding. Hyperscalers, model providers, specialist vendors, and open-source tools can provide portions of the same functionality. The assertion that model providers cannot deliver appropriate protection is too categorical to treat as an independently established competitive fact.
More than 300 customers were deploying F5’s AI-powered WAF capabilities, with more than 75% of deployments operating in blocking mode. Blocking mode is a stronger adoption signal than passive monitoring because false positives can interrupt legitimate business activity. It suggests operational confidence. It does not disclose paid attachment, revenue per customer, the volume protected, or incremental monetization.
The PHP vulnerability example demonstrates potential value from adaptive protection without waiting for a new signature. It remains a company-described test involving selected attack variations. No independent false-positive rate, latency impact, comprehensive exploit coverage, or third-party production benchmark was provided. The example supports the product proposition but cannot establish universal protection against undisclosed vulnerabilities.
Similarly, the reported 84% increase in WAF requests and 103% increase in API security events can reflect customer growth, traffic growth, broader instrumentation, or changes in detection, as well as threat intensity. These telemetry measures should not be interpreted as equivalent growth rates in monetizable demand.
F5’s financial security mix has not yet shifted as dramatically as the strategic discussion might imply. Total security-related revenue increased 10% to approximately $1.3 billion, broadly matching consolidated growth. Product security revenue increased 15% to $746 million, below total product growth of 19%. Product security therefore represented approximately 41.6% of annual product revenue, compared with approximately 43% on an implied prior-year basis. Security remains central to the franchise, but FY2026 did not demonstrate a clear acceleration in its share of product revenue.
Regulation supports demand without prescribing F5’s solution. Article 55 of the EU AI Act imposes evaluation, systemic-risk mitigation, serious-incident reporting, and cybersecurity duties on providers of general-purpose AI models with systemic risk. These requirements are not equivalent to a universal mandate that every enterprise buy an independent runtime guardrails product. Regulatory urgency can accelerate spending, but the addressable opportunity depends on customer obligations, architecture, and purchasing choices.
F5’s own software-security execution is also material. Management described continuously scanning more than 140 million lines of code and completing fixes equivalent to 7 years of historical engineering work within 3 months. That is a management-estimated productivity comparison, not a quantified cost saving. Faster remediation can improve trust and reduce exposure, but its economic value depends on exploitability, testing quality, deployment speed, and the absence of regressions.
F5 Insight’s adoption by more than 200 customers is relevant because upgrade orchestration can shorten the interval between a fix becoming available and protection reaching production. Its benefits may appear through retention, reduced operating friction, and faster platform expansion rather than standalone revenue. Security execution is not an abstract risk: FY2026 financial reconciliations included approximately $28 million of cyber-incident costs and $10 million of related insurance recoveries.
PLATFORM CONSOLIDATION AND GEOGRAPHIC CONCENTRATION
The proportion of F5’s top 1,000 customers deploying at least 3 product families increased from 22% to 29%. That is a 7-percentage-point increase and supports the argument that customers increasingly view F5 as more than a standalone ADC supplier. However, the measure is not a fixed-cohort retention statistic, and changes in the composition of the top-customer group can affect it.
The large North American financial institution win is commercially important because it displaced 4 incumbent providers across application delivery and cloud-related services. A contract of at least $10 million demonstrates that platform consolidation can produce meaningful transactions. Contract duration, implementation timing, discounts, revenue recognition, and profitability were not disclosed, so the entire contract value cannot be treated as current-quarter revenue.
Consolidation can produce more than an initial competitive win. Policy integration, operational familiarity, and common management can support subsequent expansion. It can also increase customer concentration, implementation demands, and enterprise pricing pressure. The value of the strategy depends on retained economics and expansion after migration, not simply the number of competitors displaced.
Geographic performance was uneven despite growth in every region. EMEA increased 31%, APAC 14%, and the Americas 5%. Using rounded revenue shares and growth rates, EMEA contributed approximately $65 million, or roughly 60%, of the consolidated year-over-year revenue increase while representing only 30% of current revenue.
This concentration matters because the Americas represented 53% of revenue and slowed from 11% growth in Q3 to 5% in Q4. APAC improved from an 11% decline in Q3 to 14% growth, while EMEA remained strong. These movements support the international opportunity but also indicate substantial regional variability.
Management characterized sovereignty as an architectural shift rather than a collection of isolated projects. That is plausible: data residency, infrastructure control, and policy consistency can support multiyear deployments. Nevertheless, structural demand does not eliminate procurement timing, project delays, currency exposure, or difficult comparisons. The call did not provide constant-currency regional growth, limiting the precision of geographic demand conclusions.
CASH GENERATION, INVENTORY, AND CAPITAL ALLOCATION
Cash conversion was the clearest weakness in the quarter. Operating cash flow was $118 million, compared with approximately $208 million a year earlier and $316 million in Q3. Free cash flow was $91 million, compared with approximately $192 million a year earlier and $281 million in Q3. Quarterly free cash flow represented approximately 9.9% of revenue and 35.7% of adjusted net income.
Management attributed the weakness to deliberate inventory accumulation and supplier prepayments. The balance sheet supports a substantial inventory build: inventory increased from $77.2 million to $261.9 million year over year, an increase of approximately 239%. The annual cash-flow statement records $160.3 million of cash absorbed by inventory and $184.8 million by other current assets. The latter category should not be assigned entirely to supplier prepayments because a detailed allocation was not provided.
The inventory strategy has a legitimate economic purpose. Securing memory, storage, and other long-lead components can protect delivery capacity and support upside shipments. Some purchases also support next-generation appliances. However, inventory is being accumulated ahead of a period when replacement bookings are expected to decline. The strategy therefore increases exposure to demand forecasting, component compatibility, aging, and potential write-downs.
Inventory accumulation and margin pressure are linked. Higher-cost components may be purchased before their cost is recognized in products sold. Working-capital investment can therefore precede a gross-margin decline. Conversely, previously secured lower-cost components can temporarily support margins that are not representative of replacement economics. Improving gross margin and normalizing cash flow should not be assumed to occur simultaneously.
Full-year cash performance was better than Q4 but still lagged earnings. FY2026 operating cash flow increased approximately 1% to $959.5 million. Capital expenditure increased approximately 109% to $90.5 million, contributing to free cash flow declining approximately 4.1% to $868.9 million. Adjusted net income increased approximately 8.7%. The gap between earnings growth and cash growth warrants attention even after acknowledging strategic working-capital investment.
The employee bonus change adds another timing distortion. FY2026 bonuses are scheduled for payment in November 2026 after the company moved from quarterly to annual payments. That transition provided an unquantified benefit to FY2026 cash timing and creates a Q1 FY2027 cash outflow. Payment of a previously accrued bonus is not a new FY2027 expense, but it reduces cash available for repurchases and other uses.
Management expects operating cash flow to return to more normal patterns after Q1, while also expecting further inventory increases, particularly in the first half. “Normalized patterns” should not be interpreted as a commitment to release the accumulated inventory cash or achieve a particular free-cash-flow conversion ratio. No quantified normalized cash-flow forecast was supplied.
Deferred revenue increased approximately 10% to $2.204 billion, but its composition is important. Current deferred revenue increased approximately 4.3% to $1.265 billion, while long-term deferred revenue increased approximately 19.5% to $939 million. More of the increase therefore sits beyond the next 12 months. This supports longer-duration visibility but should not be treated as a 10% increase in near-term recognizable revenue. Total deferred revenue also increased only modestly from approximately $2.193 billion in Q3.
Cash and investments of approximately $1.62 billion provide flexibility. The board added $1.5 billion to the repurchase authorization, producing approximately $1.822 billion of remaining capacity. Authorization is permission to repurchase, not a commitment to deploy the full amount within FY2027.
FY2026 repurchases of $600 million represented approximately 69% of free cash flow. Nevertheless, year-end outstanding shares declined only approximately 1.5%, and the annual diluted weighted-average share count declined approximately 1.7%. Equity issuance and compensation offset part of the gross repurchase activity. The expected FY2027 minimum of 50% of annual free cash flow is consequently best assessed alongside net dilution and the cash requirements of inventory, capex, and acquisitions.
INVESTMENT IMPLICATIONS, VALUATION, AND SCENARIOS
The call improves the strategic case for F5 as a durable application delivery and security supplier. It provides less support for treating the company as a predominantly recurring AI security platform today. Current growth still reflects a substantial systems contribution, term-license renewal timing, and a relatively small SaaS revenue base. A higher valuation requires evidence that the emerging businesses improve the growth and cash-flow profile after the replacement cycle moderates.
The principal positive revision is greater confidence that growth can persist beyond refresh. The principal negative revision is that stronger revenue is not translating into comparable EPS or free-cash-flow growth in the near term. The company is investing ahead of demand in both selling capacity and physical inventory. That can create attractive returns, but it also raises the amount of capital and expense committed before commercial outcomes are fully visible.
No verified contemporaneous trading price is used here. The disclosed Q4 average repurchase price of $422 provides only a historical valuation reference. At that price, FY2027 midpoint EPS of $18.15 implies approximately 23.3x adjusted earnings. RBC’s supplied $525 target implies approximately 28.9x the same earnings base. Such a valuation requires substantial confidence in post-FY2027 earnings acceleration, not merely delivery of the current 3.8% midpoint EPS growth forecast.
An illustrative base case, assigned a 50% probability, assumes FY2027 revenue growth of 8.5%, operating margin near 34%, and EPS around $18.15. A 24x multiple would imply approximately $436 per share. This multiple assumes durable revenue growth, improving cash conversion, and subsequent margin recovery. It is not justified by the FY2027 EPS growth rate in isolation.
An illustrative bull case, assigned a 25% probability, assumes approximately 12% revenue growth, operating margin near 36%, and EPS around $20.00. This would require stronger software expansion, systems resilience after the support milestone, productive AI-security selling investment, and better component-cost absorption. A 28x multiple would imply approximately $560 per share. Both earnings outperformance and valuation expansion are required.
An illustrative bear case, assigned a 25% probability, assumes approximately 4% revenue growth, operating margin near 31.5%, and EPS around $16.00. This could result from a sharper replacement slowdown, delayed software expansion, persistent component pressure, and continued spending ahead of monetization. An 18x multiple would imply approximately $288 per share. The main downside mechanism is a simultaneous reduction in earnings expectations and the multiple assigned to those earnings.
These deliberately illustrative scenarios produce a probability-weighted value of approximately $430. Relative to the historical $422 repurchase reference, the expected appreciation is limited despite meaningful bull-case upside, because the bear case is also substantial. The conclusion is not that $422 is the current market price or a precise fair value. It is that a valuation already capitalizing the strategic transition leaves limited room for execution disappointments.
A conditional entry threshold near 20x current FY2027 midpoint EPS, approximately $363, would provide a more attractive margin of safety under this framework. Alternatively, stronger verified earnings expectations could justify a higher entry price. Without either development, maintaining a watchlist or existing appropriately sized exposure is preferable to adding solely because of the revenue beat.
For a new position meeting those conditions, an initial allocation of approximately 0.5% of portfolio NAV would be proportionate to the unresolved cash-conversion and replacement-cycle risks. Expansion toward 1% would require evidence of second-half systems resilience, software execution, and improving cash conversion. A 15% price decline from entry would trigger a position-level risk exit, with earlier exit warranted by a thesis break. At 0.5% initial weight, that represents approximately 7.5 basis points of portfolio loss before gaps or slippage; a 10-basis-point loss budget would remain subject to those execution risks.
The relevant investment horizon is 6 to 12 months, encompassing the replacement milestone and the expected software acceleration. The approximately $436 base-case valuation provides a review or profit-taking reference unless earnings expectations improve. Actual portfolio sizing remains conditional on existing holdings. F5 adds exposure to enterprise infrastructure, cybersecurity spending, international demand, and AI deployment; it is not a clean diversifier for a portfolio already concentrated in those factors.
CATALYSTS, REVIEW TRIGGERS, AND THESIS INVALIDATION
The immediate catalyst is Q1 FY2027 execution against $875 million to $895 million of revenue and $4.25 to $4.37 of EPS. The associated cash-flow result will require adjustment in interpretation for the November bonus payment, but not dismissal. Inventory and supplier-prepayment growth should be evaluated against shipment performance and the subsequent revenue outlook.
Fiscal Q2 is the next major checkpoint because it combines the expected operating-margin trough with the installed-base support milestone identified on the prior call. The second half is the decisive period: replacement bookings are expected to decline while software growth accelerates. Continued systems growth, successful renewal expansion, and better cash conversion during that interval would materially strengthen the structural-growth case.
The principal thesis-breaking outcomes would be a reduction in the 8% to 9% revenue forecast because new demand cannot offset replacement weakness; software failing to achieve the growth needed to support the consolidated outlook; gross margin falling below the 80.5% annual lower boundary without a credible offset; or inventory continuing to rise while demand indicators deteriorate. Weak AI-security monetization alongside sustained selling-cost growth would also challenge the expected return on investment.
The most valuable incremental disclosures would be AI-security ARR or recognized revenue, quantified renewal expansion, systems growth separated into price and volume, inventory aging and purchase commitments, and a clear normalized cash-flow framework. Until those are available, adoption counts, market-size estimates, and competitive anecdotes should support the investment case rather than substitute for financial proof.
SOURCE AND INTERPRETATION LIMITS
Financial comparisons incorporate F5’s October 27 earnings release and accompanying financial statements, its July 27 release and presentation, relevant prior-call and investor-event disclosures, and the supplied Bloomberg consensus snapshot. Current-call quotations are taken from the supplied draft transcript. Several Q&A speaker labels appear inconsistent, so uncertain responses are attributed to management collectively. The annual perpetual-software discrepancy is treated as an arithmetic reconciliation rather than an independently verified correction. AI market-size estimates, threat statistics, productivity comparisons, and unnamed customer claims remain management assertions unless otherwise identified.
COMPANY EMPLOYEES ON THE CALL
• François Locoh-Donou, Chairman, President and Chief Executive Officer. • Cooper Werner, Executive Vice President and Chief Financial Officer. • Kunal Anand, Chief Product Officer. • Suzanne DuLong, Vice President, Investor Relations.
RESEARCH ANALYSTS ON THE CALL
• Matthew Hedberg, RBC Capital Markets. • Joseph Cardoso, J.P. Morgan. • Tim Long, Barclays. • George Notter, Wolfe Research. • James Fish, Piper Sandler. • Meta Marshall, Morgan Stanley. • Jeffrey Hopson, Needham & Company. • Tal Liani, Bank of America Securities. Called upon, but no substantive question was audible. • Simon Leopold, Raymond James. Called upon, but no substantive question was audible.
Key Read-Throughs
KEY READ-THROUGHS FROM F5’S Q4 FY2026 EARNINGS CALL
F5’s October 27 call supports a selective broadening of enterprise AI spending beyond GPUs into data delivery, runtime security, traffic governance, and sovereign infrastructure. The strongest positive read-throughs concern memory pricing, enterprise storage, independent AI-security platforms, and infrastructure that makes shared AI capacity commercially usable. The principal negative implication is that strong infrastructure demand can coexist with weaker cash conversion and limited earnings leverage as suppliers accumulate inventory and absorb component inflation. The distinction between market growth and company-specific capture is critical: F5’s competitive wins do not identify the displaced public companies, its AI bookings are not recurring revenue, and its sovereign deployments do not establish incremental GPU orders. Impact assessments below distinguish business-level significance from consolidated earnings materiality. Country labels identify corporate domicile.
SEMICONDUCTORS AND ENTERPRISE HARDWARE
MEMORY PRICING HAS SUPPORT OUTSIDE HYPERSCALER AI, BUT INVENTORY PURCHASES ARE NOT END-CONSUMPTION (READ-THROUGH 1)
Affected companies: Micron Technology (MU: US) and Sandisk (SNDK: US). Direction: positive for pricing durability and supplier bargaining power. Magnitude: moderate as corroborating industry evidence; negligible direct earnings significance from F5 alone.
The supporting call evidence is unusually concrete. F5 attributed its FY2027 gross-margin outlook of 80.5% to 82.5%, versus 84.0% in FY2026, to higher component costs. Management identified “memory and storage” as the principal supply concerns and described continued inventory accumulation, supplier prepayments, and procurement for next-generation appliances. Inventory increases are expected to be strongest in the first half of FY2027.
The transmission mechanism extends beyond the familiar demand for memory inside GPU servers. Enterprise networking and application-delivery appliances also consume memory and storage components. When these buyers secure supply earlier, prepay suppliers, and hold larger inventories, component manufacturers gain better order visibility and potentially stronger pricing. Micron has exposure through DRAM and NAND; Sandisk through NAND-based storage. F5 did not identify its suppliers, so neither company should be assigned a specific F5 contract or revenue contribution.
The non-consensus implication is that a slowdown in an individual equipment replacement cycle need not immediately weaken upstream component orders. F5 expects replacement bookings to decline in the second half of FY2027, yet is still increasing inventory and purchasing components for future appliances. Supplier purchases can therefore remain stronger than contemporaneous equipment demand because procurement includes supply insurance and next-generation preparation.
There are important limits. Advance procurement shifts demand between periods and can eventually create an inventory correction; it does not establish equivalent growth in underlying memory-bit consumption. This is also not an HBM-specific signal. Moreover, F5’s FY2027 gross-margin range improved by 50 basis points versus its earlier framework. The call confirms persistent cost pressure, not a newly worsening shock of the full year-over-year magnitude.
Near term, Sandisk’s October 29 results provide the clearest trading catalyst for testing pricing, bookings, and customer procurement behavior. Micron’s September 30 results had already established a strong memory-cycle baseline, making F5’s disclosure corroboration rather than discovery. The longer-duration implication is continued component-supplier pricing support into the first half of 2027, with customer inventory accumulation becoming an increasingly important indicator of eventual cycle risk.
SERVER AND INFRASTRUCTURE REVENUE GROWTH CAN OVERSTATE CASH EARNINGS QUALITY (READ-THROUGH 2)
Affected companies: Dell Technologies (DELL: US) and Hewlett Packard Enterprise (HPE: US). Direction: negative for cash-conversion assumptions and the valuation premium assigned to revenue growth without equivalent cash generation. Magnitude: moderate, particularly in hardware-intensive businesses; insufficient evidence for an automatic EPS reduction.
F5 reported Q4 operating cash flow of $118 million and free cash flow of $91 million against adjusted net income of approximately $255 million. Management attributed the cash weakness to inventory and supplier prepayments. It also maintained an annual pricing-review cadence despite rapidly changing component costs. These disclosures illustrate how strong demand can require additional cash before the associated revenue is collected.
The transmission mechanism to Dell and HPE is shared exposure to constrained components and large hardware fulfillment obligations, not a supplier relationship with F5. Higher component prices increase the cash required to support a given physical shipment volume. Longer procurement lead times require earlier commitments. If customer pricing, supplier payments, and customer collections adjust at different speeds, revenue and accounting profit can increase while free cash flow underperforms.
Cost pass-through creates a separate analytical issue. Higher equipment selling prices can lift revenue without a comparable increase in physical deployments or economic value added. Even full dollar recovery of component inflation does not necessarily preserve the gross-margin percentage. Conversely, favorable inventory costs and rapid repricing can temporarily improve margins. Revenue growth, unit growth, gross profit dollars, and working-capital investment therefore need to be evaluated separately.
This is not evidence that Dell and HPE are already experiencing the same outcome. Dell’s September release showed very strong revenue and earnings growth, while HPE’s latest reported quarter generated approximately $1.0 billion of free cash flow, increasing approximately $0.2 billion year over year. HPE’s cash performance is explicit counterevidence against mechanically transferring F5’s deterioration. F5’s annual bonus-payment change is also company-specific and should not be imposed on either peer.
Near-term catalysts are the next results covering their fiscal quarters ending in October 2026, particularly inventory, purchase commitments, pricing realization, backlog conversion, and cash-flow guidance. The longer-duration implication is a wider valuation distinction between infrastructure suppliers that translate demand into cash and those that finance growth through progressively larger balance sheets. The high-conviction negative read-through concerns earnings quality and capital intensity, not a forecast of weakening infrastructure demand.
ENTERPRISE STORAGE AND DATA INFRASTRUCTURE
INFERENCE DEPLOYMENT SUPPORTS ENTERPRISE DATA INFRASTRUCTURE, NOT JUST GPU PROCUREMENT (READ-THROUGH 3)
Affected company: NetApp (NTAP: US). Direction: positive. Magnitude: moderate for enterprise AI and hybrid-cloud demand; modest incremental information relative to NetApp’s already strong reported performance.
F5 disclosed more than $100 million of direct AI bookings for FY2026, increasing nearly 300%, and stated, “The majority of that is actually AI data delivery.” Customers deployed 29.2 terabits of F5-powered AI data-delivery capacity in Q4, increasing nearly 250%. Management also highlighted S3 capabilities, storage partnerships, and demand led by banking, financial services, and healthcare.
The mechanism is the requirement to make enterprise datasets securely accessible to inference infrastructure. GPU availability alone does not resolve storage throughput, application access, availability, or policy constraints. Production deployments can require upgrades to object storage, data management, and the infrastructure connecting storage to compute. The opportunity is therefore broader than adding storage capacity: it includes improving the performance and governability of existing enterprise data.
NetApp’s exposure is supported by an identified relationship rather than thematic similarity. Its established collaboration with F5 combines NetApp data infrastructure, including StorageGRID, with F5 traffic management and security for S3-based AI workflows. F5’s stronger AI data-delivery activity consequently validates a use case that NetApp already addresses commercially.
The geographic evidence strengthens the durability argument. F5 reported 31% EMEA growth and described customers repatriating applications to local clouds or private data centers because of sovereignty requirements. That supports infrastructure capable of operating across private and public environments. It is not evidence that public-cloud storage must contract: NetApp’s own latest release showed growth in both Hybrid Cloud and Public Cloud revenue.
The magnitude must remain bounded. F5’s deployed throughput is not a measure of NetApp shipments, storage capacity purchased, or exclusive supplier share. S3 is an ecosystem standard, and F5 supports multiple storage vendors. Some expenditure can improve access to existing storage rather than create a new array purchase.
Near term, NetApp’s next FY2027 update provides a test of whether AI-related pipeline activity converts into additional bookings and revenue. Its September 2 release had already reported 30% revenue growth, so F5’s call supports persistence rather than predicting an unreported quarter. The longer-duration positive is enterprise inference spending becoming less narrowly concentrated in accelerators and more dependent on governed data infrastructure.
AI NETWORKING AND ACCELERATED INFRASTRUCTURE
BLUEFIELD GAINS ARCHITECTURAL VALIDATION AS AI FACTORIES BECOME MULTITENANT SERVICES (READ-THROUGH 4)
Affected company: NVIDIA (NVDA: US). Direction: positive for BlueField’s role in enterprise and sovereign AI infrastructure. Magnitude: meaningful product-level validation, but immaterial near-term consolidated earnings impact from the disclosed projects.
The direct supporting evidence is Telenor’s selection of F5 BIG-IP Next for Kubernetes running on NVIDIA BlueField-3 DPUs. The call described tenant isolation, policy-based traffic control, and observability operating in the AI service path while preserving host CPU capacity. This is an explicitly identified technology relationship, not an inferred supplier allocation.
The transmission mechanism is the transition from dedicated GPU capacity to shared commercial services. Bare-metal GPU rental requires less application-level governance than an infrastructure platform serving multiple enterprise tenants, models, and security policies. As those services become more complex, isolated infrastructure processing becomes more valuable. Third-party software support can improve the utility of BlueField and strengthen its position in future infrastructure designs.
Management’s distinction between GPU rental and token services is particularly important. F5 indicated that bare-metal GPU-as-a-service does not create a similarly significant F5 opportunity, whereas enterprise token services require more governance, isolation, and traffic management. The read-through is therefore stronger for the composition and functionality of AI infrastructure than for aggregate GPU demand.
Several boundaries prevent overstatement. Telenor’s selection does not prove a new DPU purchase rather than software deployment on already acquired infrastructure. The disclosed platform uses BlueField-3 and should not be converted into an assumed order for a newer generation. F5’s separate unnamed customer protecting up to 500 models also cannot be identified as NVIDIA from the transcript.
The accompanying Telenor announcement describes advanced token-aware governance and inference optimization as planned capabilities. Current selection validates the architecture, but not all prospective utilization or token-cost improvements. These projects were announced before the earnings call, so the call adds context rather than a new award.
Near-term trading significance is limited. Subsequent NVIDIA disclosures and sovereign deployment milestones can test whether this architecture spreads, but the call does not support a standalone earnings-estimate increase. The longer-duration implication through 2027 is a larger role for networking, isolation, and security processing as AI factories evolve into commercial services.
CYBERSECURITY AND APPLICATION SECURITY
PRODUCTION AI VALIDATES AN INDEPENDENT RUNTIME-SECURITY BUDGET (READ-THROUGH 5)
Affected companies: Palo Alto Networks (PANW: US) and Cisco Systems (CSCO: US). Direction: positive for AI-security demand, with increasing competitive intensity limiting near-term margin implications. Magnitude: moderate for Palo Alto’s emerging AI-security franchise; smaller at Cisco’s consolidated level.
F5 described a production deployment in which an unnamed global AI infrastructure provider selected its guardrails to protect up to 500 models. Requirements included prompt-injection protection, sensitive-data controls, customization, and self-hosted deployment. Management also reported more than 200 active direct AI customers and emphasized enterprises deploying multiple model types across private and public environments.
The critical mechanism is that enterprise control requirements extend beyond the safety features of an individual model. Organizations need policy across models, applications, data sources, and agent actions. Those controls can become a separate purchasing requirement when AI moves into production, supporting spending on runtime inspection, model assessment, discovery, and governance.
Palo Alto’s Prisma AIRS and Cisco’s AI Defense have verified product exposure to these requirements. Their installed security relationships provide distribution into the relevant buyers, while their runtime products address threats identified on the F5 call. The implication is validation of a real budget category, not proof that either vendor will win F5’s customers.
For Palo Alto, this is corroboration of an existing commercial trajectory. Its September earnings call had already disclosed more than $100 million of Prisma AIRS ARR and more than 800 customers. F5’s results provide additional evidence that production AI protection is being purchased across vendors. The figures are not directly comparable: F5 disclosed bookings across multiple AI use cases, predominantly data delivery, whereas Palo Alto disclosed product-specific ARR.
The competitive offset is equally clear. F5 plans to double specialist seller headcount, more than double related marketing investment, and incentivize its broader field organization to sell AI security. This increases competition for enterprise budgets and technical resources. A growing market can support multiple vendors without producing rapid margin expansion for all of them.
The call also does not establish a security-industry growth explosion. F5’s total security revenue grew 10%, and product security revenue grew 15%, below its overall product growth of 19%. The high-conviction positive concerns the emergence and persistence of production AI-security spending, not an extrapolation of AI customer growth into consolidated cybersecurity revenue growth.
Near-term catalysts are the next FY2027 disclosures on paid deployments, AI-security ARR, expansion, and sales productivity. The longer-duration shift is toward model-independent enterprise policy enforcement. That supports security-platform relevance, while leaving vendor share and profitability dependent on execution.
AI AGENTS INCREASE THE VALUE OF AUTHENTICATION AND SELECTIVE CONTROL, NOT SIMPLY TRAFFIC VOLUME (READ-THROUGH 6)
Affected companies: Akamai Technologies (AKAM: US) and Cloudflare (NET: US). Direction: positive for bot-management, account-protection, and API-security relevance; mixed for immediate monetization. Magnitude: moderate at the product level, with a smaller and unquantified near-term consolidated revenue effect.
F5 disclosed that a major financial institution was using Bot Defense to block personal AI agents entering customer accounts, with other enterprises adopting similar protection. Traffic from self-identifying AI agents more than doubled during the quarter. The call also reported an 84% increase in WAF requests and a 103% increase in API-security events.
The most actionable implication is not that every additional AI request becomes billable security revenue. It is that identifying whether traffic comes from a human or a bot is becoming insufficient. Enterprises must determine whether an agent is authorized to perform a specific action, on a particular endpoint, with particular credentials. Account access and money movement require different policies from browsing public information.
Akamai and Cloudflare have relevant deployed capabilities in bot detection, application security, and traffic-policy enforcement. Akamai’s October 26 discussion of silent agents specifically addressed authenticated account activity and endpoint-level controls. Cloudflare’s recent verified-bot framework likewise distinguishes identity from ongoing behavior. F5’s bank example provides customer-side evidence supporting those already identified product requirements.
The initial economic benefit may be retention and product relevance rather than new revenue. F5 explicitly noted that some customers were addressing the problem with capabilities already available to them. Similar functionality at competitors may also be bundled into existing subscriptions. Incremental revenue requires paid upgrades, broader deployment, usage-sensitive pricing, or a distinct new service.
There is also a competitive constraint. F5 described a financial-services consolidation win replacing 4 incumbent vendors across application delivery and cloud-related tools. The displaced vendors were not identified, so this cannot be presented as a confirmed Akamai or Cloudflare loss. Nevertheless, it demonstrates that growing security needs can coincide with fewer suppliers and greater pressure on standalone product pricing.
The November 5 earnings releases for Akamai and Cloudflare are near-term catalysts for testing security demand, customer expansion, and monetization. The longer-duration positive is that agentic activity makes granular access control more important. The corresponding negative is that neither rising request counts nor greater agent activity automatically produces completed commercial transactions, incremental subscriptions, or improved margins.
TELECOMMUNICATIONS AND SOVEREIGN AI
SOVEREIGN AI CREATES A COMMERCIAL SERVICE OPPORTUNITY, BUT CAPITAL DEPLOYMENT PRECEDES PROVEN RETURNS (READ-THROUGH 7)
Affected companies: Telenor ASA (TEL: Norway) and PT Indosat Tbk, operating as Indosat Ooredoo Hutchison (ISAT: Indonesia). Direction: positive for enterprise-service positioning; negative for early cash requirements where capacity investment precedes utilization. Magnitude: modest near-term group earnings significance, with longer-duration strategic relevance.
These are named customers rather than inferred beneficiaries. F5 described Indosat’s Intelligence Suite providing governed access to more than 300 open and closed models, supported by tenant isolation, container security, and GPU-aware load balancing. Telenor selected F5’s service plane for sovereign AI infrastructure serving Norwegian and European enterprises.
The transmission mechanism is commercialization of infrastructure that would otherwise be sold primarily as compute capacity. Governance, model routing, tenancy, auditability, and cost controls make shared capacity more usable for regulated enterprise customers. Telecom operators can combine local infrastructure and enterprise relationships with these capabilities to offer a managed service rather than undifferentiated GPU rental.
The geographic evidence is supportive. F5’s 31% EMEA growth, 14% APAC growth, and customer examples involving national financial infrastructure indicate demand for local control and consistent policy. This supports the relevance of domestic or regionally governed AI services. It does not establish that every workload must remain local: Indosat’s architecture can route requests to global models where policy permits.
The negative cash implication is already visible at Telenor. Its Q2 report identified NOK 150 million of GPU investment in AI Factory and linked that investment to higher group capital intensity. F5’s software selection can improve the platform’s commercial readiness, but it does not demonstrate sufficient utilization, pricing, or customer commitments to earn an attractive return on that capital.
The same distinction applies to Indosat. Access to more than 300 models measures platform breadth, not paid demand. A governed interface may increase customer adoption, but model availability cannot be converted into recurring revenue or profit without evidence of customer usage and commercial economics. Contract values and incremental earnings contributions were not disclosed.
Telenor’s confirmed October 28 results and Indosat’s upcoming 9-month update provide immediate opportunities to assess commercial progress, investment requirements, and enterprise demand. The F5 partnerships were announced earlier in October, so the earnings call reinforces their significance rather than creating new awards.
The longer-duration opportunity is a differentiated enterprise AI service built around local control, governance, and reliable operation. The principal risk is that suppliers monetize equipment and software before operators achieve sufficient utilization. Sovereign AI is a credible new service category, but the call does not yet establish a material improvement in telecom earnings or returns on invested capital.
Report record
- Sector
- Information Technology
- Industry
- Communications Equipment
- Fiscal period end
- September 30, 2026
- Report date
- October 27, 2026
- Analysis
- 6351 words
- Read-throughs
- 2892 words
- Content fingerprint (PDF)
c4d0d22a6946- Content fingerprint (analysis)
776e852f8fd5- Content fingerprint (read-throughs)
27414732646f
Prepared from the company's earnings release and earnings call transcript. Figures as reported by the company. For information only. Not investment advice.
More from F5, Inc.
No other reports yet.
More in Information Technology
Stronger fundamental outlook, but current profitability is not a contractual floor
Earnings power, financial resilience, and capacity to return cash have improved substantially
All Information Technology reports
Follow @AtlasPeakRes on X for new earnings reports as they publish.