The business outlook improved more clearly than the prospective risk-adjusted stock return.
Earnings Reports
Seagate Technology Holdings plc FQ1 2027 Earnings Report
Seagate Technology Holdings plc (STX) FQ1 2027 earnings: Earnings power, financial resilience, and capacity to return cash have improved substantially. Full earnings analysis, key read-throughs, and the one-page exhibit from Atlas Peak Research.
Seagate Technology Holdings plc (STX)
Sector: Information Technology · FQ1 2027 · Period end March 31, 2027 · Reported October 27, 2026
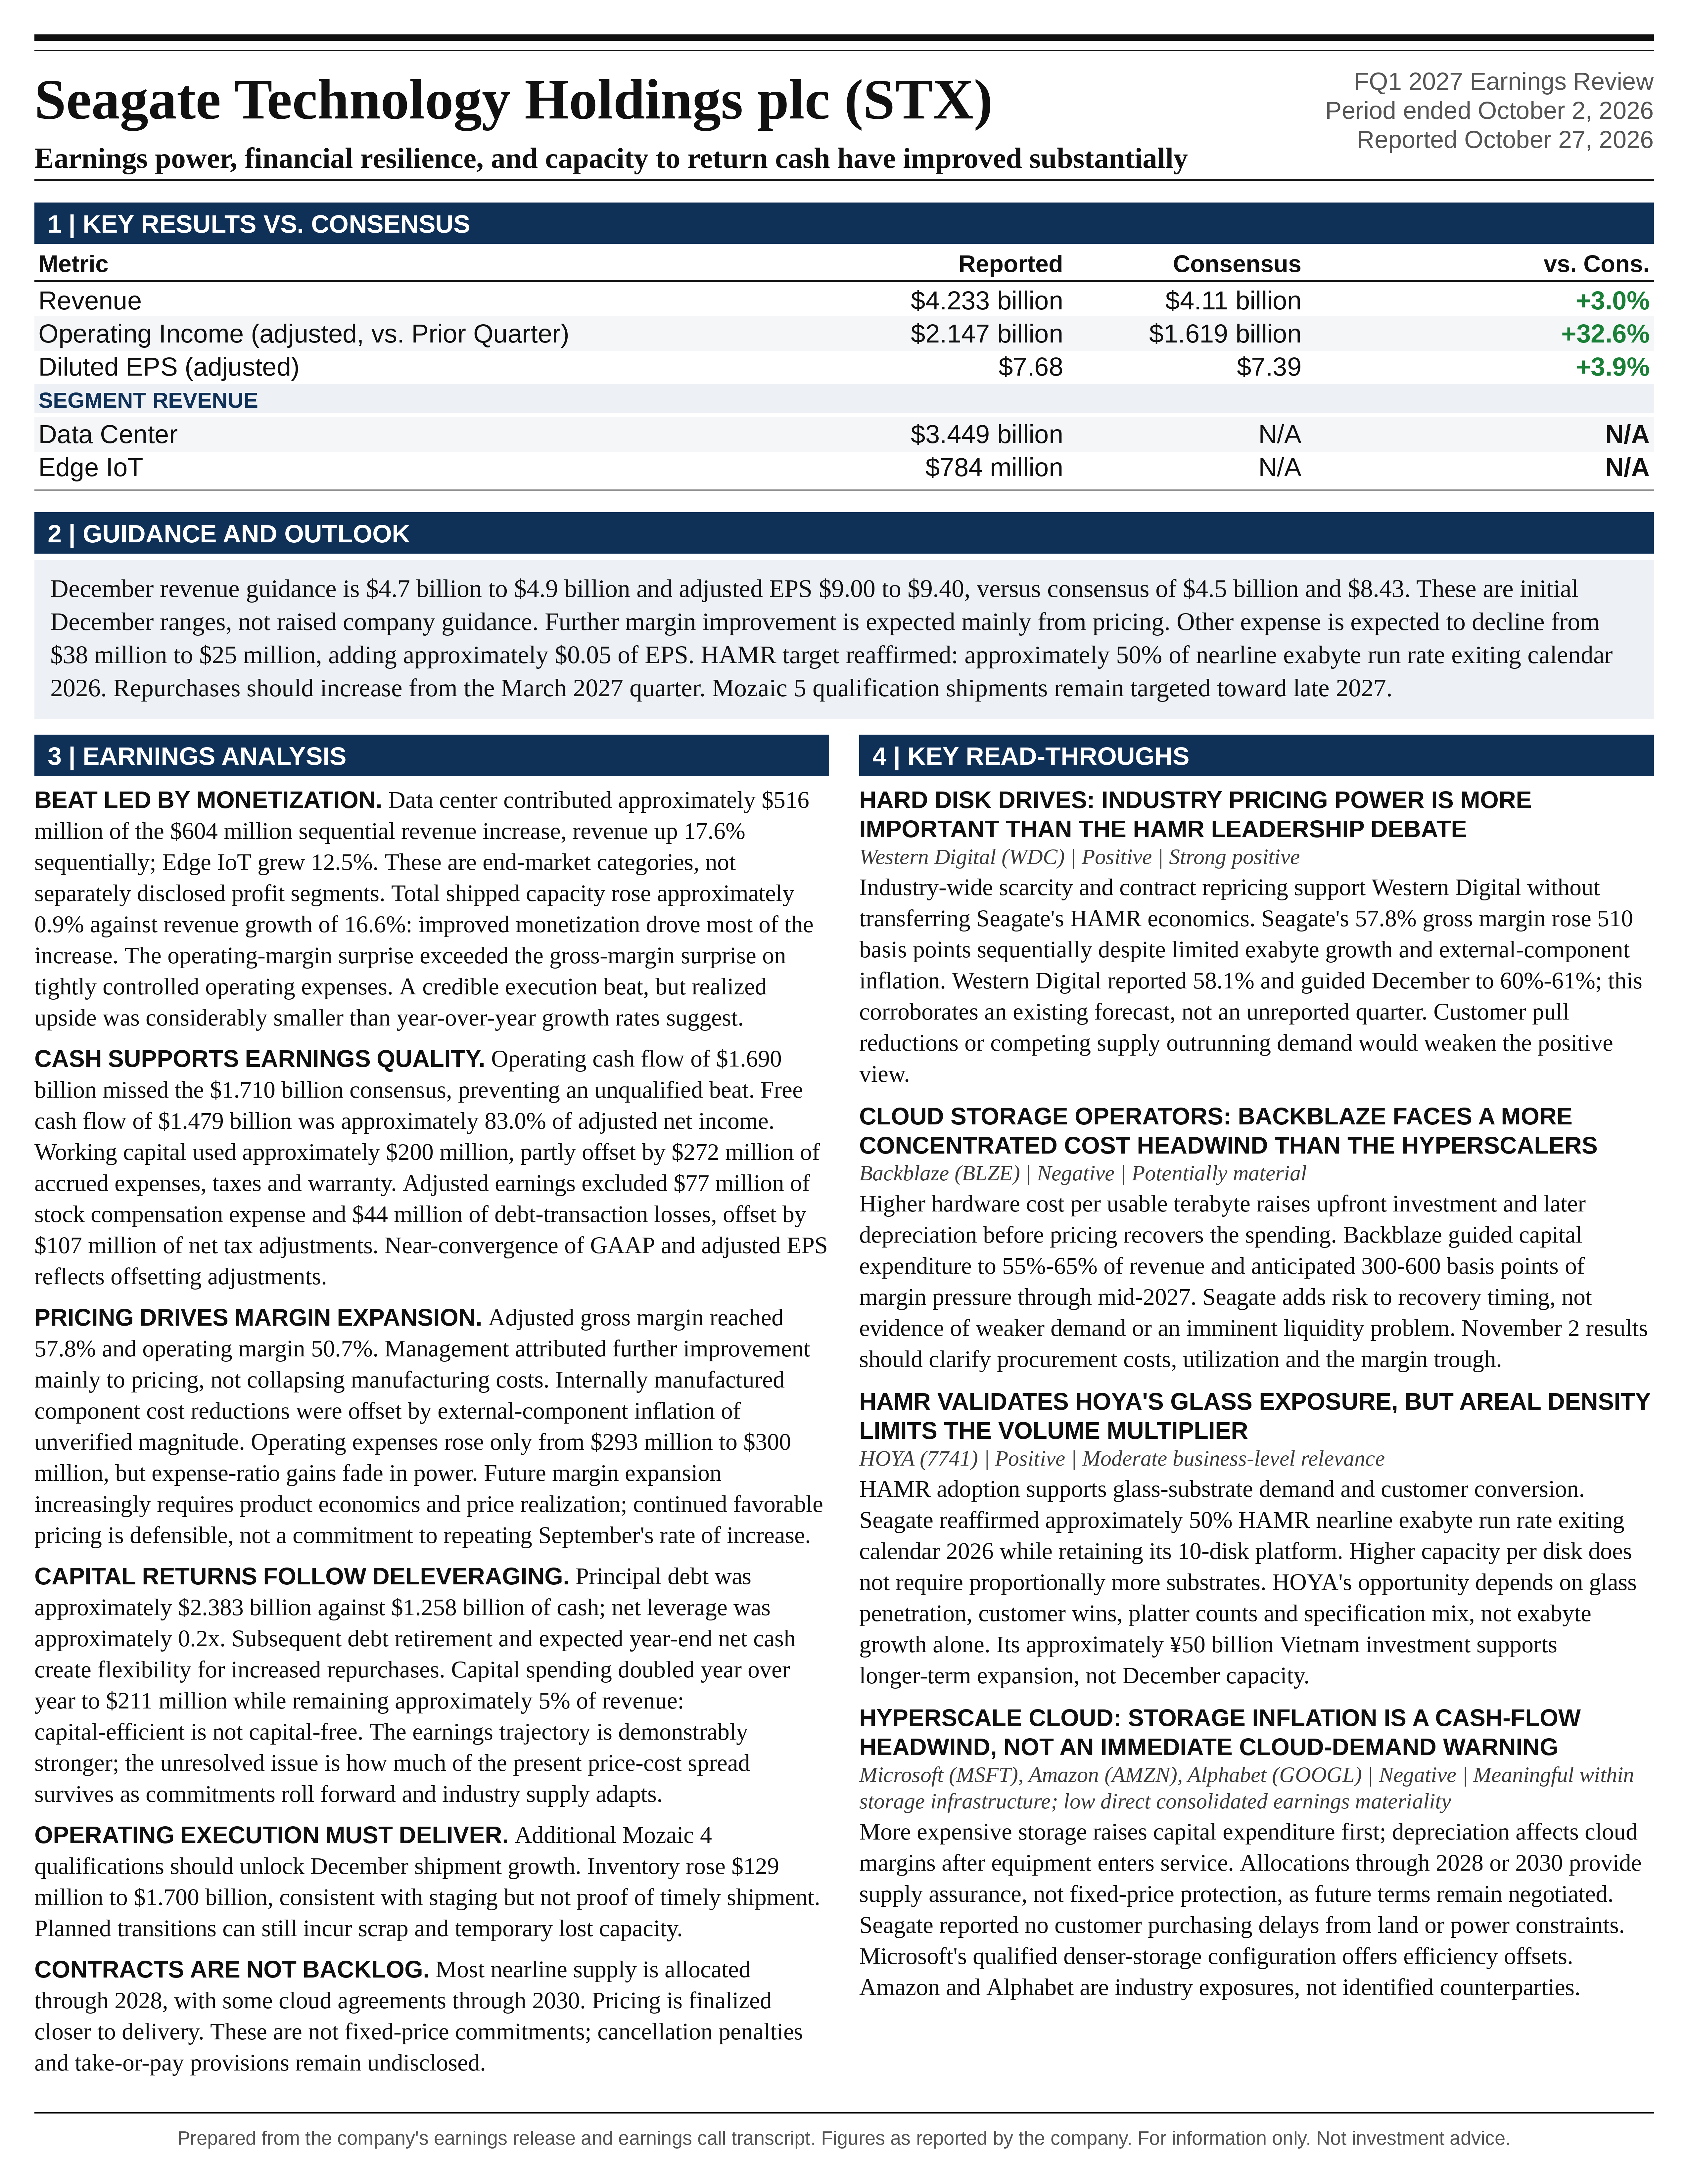
Seagate’s fiscal Q1 2027 call strengthens the case for sustained earnings growth, but the investment conclusion is more favorable on fundamentals than on immediate valuation upside.
Download the one-page report (PDF)
View one-page exhibit
Download analysis (.md)
Download read-throughs (.md)
Post to X
One-Page Exhibit
Earnings Analysis
EXECUTIVE CALL SUMMARY: Seagate Technology Holdings PLC (10/27/26)
Seagate’s fiscal Q1 2027 call strengthens the case for sustained earnings growth, but the investment conclusion is more favorable on fundamentals than on immediate valuation upside. The company is converting constrained storage supply, higher-capacity products, and improving contractual pricing into exceptional profitability. December guidance implies another substantial increase in earnings, while the completion of major debt-reduction objectives creates a meaningful capital-return catalyst beginning in the March 2027 quarter. Maintaining measured exposure is justified. Aggressively adding exposure solely because of the reported beat is less compelling, given the increasing dependence of incremental earnings on pricing and the distinction between long-term capacity allocations and enforceable, fixed-price revenue commitments.
September revenue reached $4.233 billion, adjusted EPS was $7.68, adjusted gross margin was 57.8%, and adjusted operating margin was 50.7%. Revenue increased 61.0% year over year, while adjusted EPS increased 194.3%. These results exceeded the supplied Bloomberg consensus by approximately 3.0% on revenue and 3.9% on EPS. The more important positive surprise was the December outlook: revenue of $4.8 billion and adjusted EPS of $9.20 at the midpoints exceeded the supplied consensus by 6.7% and 9.1%, respectively. The call therefore supports upward earnings revisions beyond the completed quarter rather than merely recognizing previously anticipated strength.
The central analytical distinction is that September was primarily a monetization quarter rather than a capacity-growth quarter. Total shipments increased only from 218 exabytes to 220 exabytes sequentially, and nearline shipments increased from 195 exabytes to 198 exabytes. Nevertheless, revenue increased 16.6%, reflecting a substantial increase in blended revenue per shipped terabyte. Management expects a meaningful shipment increase in December as additional Mozaic 4 qualifications convert into deliveries. The next quarter therefore becomes an important test of whether the business can combine sustained pricing strength with renewed physical shipment growth.
The strongest evidence supporting durability is management’s description of customer behavior. Mosley stated, “Absolutely everything we can make above and beyond our plans is being spoken for.” Most nearline supply is allocated through calendar 2028, and some cloud agreements extend through calendar 2030. However, configuration and pricing are generally finalized closer to shipment. These arrangements provide valuable planning visibility, but they do not establish fixed-price backlog through 2030 or eliminate cancellation, renegotiation, competitive, and deployment risks.
The principal investment debate has shifted from balance-sheet repair and HAMR feasibility toward the sustainability of pricing, the pace of commercial qualification, and the appropriate valuation of operating margins above 50%. Seagate’s earnings trajectory is demonstrably stronger. The evidence is less conclusive that recent mid-teens sequential increases in blended revenue per terabyte can persist, or that current profitability should be capitalized without a meaningful cyclical discount.
REPORTED PERFORMANCE AND THE QUALITY OF THE BEAT
The precise financial statements provide a stronger comparison than the rounded $4.2 billion headline. Revenue of $4.233 billion exceeded Bloomberg consensus of $4.11 billion by $123 million. Adjusted EPS of $7.68 exceeded consensus of $7.39 by $0.29. Adjusted gross margin exceeded the 57.4% consensus by 40 basis points, while adjusted operating margin exceeded the 49.8% consensus by 90 basis points. The operating-margin surprise was larger than the gross-margin surprise because operating expenses remained tightly controlled.
The comparison with management’s prior guidance is also favorable, although the magnitude should not be overstated. On July 28, Seagate guided September revenue to $4.1 billion, plus or minus $100 million, and adjusted EPS to $7.30, plus or minus $0.20. Actual revenue exceeded the prior midpoint by 3.2% and the upper bound by 0.8%. EPS exceeded the midpoint by 5.2% and the upper bound by 2.4%. This was a credible execution beat, but the realized upside was considerably smaller than the year-over-year growth rates might suggest.
Historical comparisons demonstrate that the quarter extended an already powerful earnings progression. Revenue increased from $2.629 billion in fiscal Q1 2026 to $2.825 billion, $3.112 billion, $3.629 billion, and $4.233 billion over the subsequent quarters. Adjusted EPS progressed from $2.61 to $3.11, $4.10, $5.71, and $7.68. Adjusted gross margin expanded from 40.1% to 57.8% over that period, while adjusted operating margin increased from 29.0% to 50.7%.
September adjusted operating income was $2.147 billion, compared with $1.619 billion in June and $763 million a year earlier. Approximately 87% of the sequential revenue increase converted into incremental adjusted operating income. The corresponding year-over-year conversion was approximately 86%. These unusually high incremental margins reflect substantial pricing leverage and an expense base growing far more slowly than revenue. They should not be treated as perpetual contribution margins.
Adjusted operating expenses increased only from $293 million in June to $300 million in September, and from $291 million a year earlier. Operating expenses consequently declined to approximately 7.1% of revenue, compared with approximately 11.1% a year earlier. This is genuine operating leverage, but it also creates an important future constraint: expense-ratio improvement becomes progressively less powerful as the denominator grows and the expense ratio approaches a practical minimum. Sustained future margin expansion must increasingly come from product economics and price realization rather than expense dilution alone.
Cash generation was strong, but it did not beat the supplied consensus. Operating cash flow of $1.690 billion was approximately $20 million, or 1.2%, below the $1.710 billion Bloomberg estimate. This is not a material deterioration, but it prevents characterizing the quarter as an unqualified beat across every major financial metric.
PRICING, PRODUCT MIX, AND THE ECONOMIC SOURCE OF MARGIN EXPANSION
The most consequential operating observation is the divergence between revenue growth and shipped capacity. Total exabytes increased approximately 0.9% sequentially, versus revenue growth of 16.6%. Dividing consolidated revenue by total shipped capacity produces a blended revenue-per-terabyte proxy of approximately $19.24, compared with $16.65 in June and $14.45 a year earlier. That represents approximately 15.6% sequential growth and 33.2% year-over-year growth.
The corresponding data-center proxy increased to approximately $17.42 per terabyte, from $15.04 in June and $13.30 a year earlier. These calculations are not like-for-like HDD pricing measures. Data-center revenue includes systems and multiple customer categories, while consolidated revenue includes non-nearline products. Nevertheless, the consistency of the direction across both calculations supports the conclusion that improved monetization, rather than physical volume growth, drove most of the September revenue increase.
Management explicitly acknowledged this mechanism. Romano stated that further gross-margin improvement was coming “at this point mainly from pricing.” This is an important qualification to the broader HAMR narrative. HAMR remains central to structural cost reduction and capacity expansion, but the current acceleration in reported profitability is not primarily evidence that manufacturing costs have suddenly collapsed.
The external-component discussion reinforces that distinction. Management described continued strong cost reductions in internally manufactured components, particularly heads and media, offset by higher prices for externally sourced components. It did not quantify the external cost headwind, identify its principal component categories, or provide a complete bridge between pricing, mix, manufacturing efficiency, and purchased-component inflation. The direction of the explanation is credible; its magnitude remains unverified.
A consolidated cost-per-shipped-terabyte proxy illustrates the issue. Adjusted cost of revenue was approximately $1.786 billion, or $8.12 per shipped terabyte, compared with approximately $8.65 a year earlier. This implies a decline of approximately 6.2%, consistent with the Q&A characterization of slowing aggregate cost declines. Sequentially, the same proxy increased approximately 3.1%. These are blended analytical measures, not disclosed product-level manufacturing costs, but they indicate that September margin expansion occurred despite less favorable aggregate cost-per-capacity trends.
Passing through purchased-component inflation cannot, by itself, explain a rising gross-margin percentage. Recovering an additional $1 of cost with an additional $1 of revenue leaves gross-profit dollars unchanged and increases the revenue denominator. The expansion to 57.8% therefore requires favorable pricing beyond simple dollar-for-dollar recovery, improved product mix, internal productivity, or some combination of these factors. Management’s explanation that pricing more than offset external inflation is economically consistent with the reported results.
The forward risk is extrapolation. A 15% sequential pricing increase repeated for 4 quarters would compound to approximately 75% annually. Management did not provide guidance supporting that trajectory. Mosley emphasized strong demand and periodic contractual step-ups, but Romano also cautioned, “Every quarter is a bit different.” The defensible interpretation is continued favorable pricing, not a commitment to repeating September’s rate of increase.
Pricing sensitivity is now material. At December’s $4.8 billion revenue midpoint, a 1% change in realized pricing, with shipped volume and costs otherwise unchanged, would alter pretax earnings by approximately $48 million and quarterly EPS by approximately $0.17 using the guided tax rate and share count. This sensitivity works in both directions and explains why pricing durability matters more to valuation than the headline exabyte growth rate alone.
EXABYTE GROWTH, INVENTORY, AND MANUFACTURING EXECUTION
Nearline shipments increased 24.5% year over year to 198 exabytes, but only approximately 1.5% sequentially. Total capacity shipments increased approximately 21% year over year, compared with 34% growth in June. Nearline growth also moderated from approximately 43% in June to approximately 24% in September. The deceleration is real, even if its explanation is product staging rather than weakening demand.
Management repeatedly described the shipment pattern as planned. Mosley stated, “I don’t think we had any issues with product transitions. I think it’s all been planned.” Additional customer qualifications are expected to enable a meaningful shipment increase in December. This explanation is consistent with manufacturing ahead of customer acceptance and coordinating drive deliveries with broader infrastructure readiness.
However, the manufacturing discussion contained a separate acknowledgment of ordinary transition inefficiency. Mosley described scrap, temporary lost capacity, and yields that require improvement over subsequent quarters. That does not necessarily contradict the assertion that September’s shipment timing was planned. Planned transitions can still incur yield-related costs and reduce near-term factory efficiency. The distinction is between expected ramp friction and an unplanned qualification or reliability failure.
Inventory increased $129 million sequentially to $1.700 billion, an 8.2% increase. This is consistent with staging additional products, but it is not independent proof that those products will qualify or ship on the expected schedule. The December evidence should include higher shipped capacity, continued qualification progress, and an absence of disproportionate further inventory accumulation.
The draft transcript’s reference to inventory days increasing from 83 to 97 requires caution. A simple calculation using ending inventory, reported quarterly cost of revenue, and a 91-day quarter produces approximately 86 days on a GAAP basis or 87 days on an adjusted basis. The 97-day figure cannot be reconciled from the published financial tables using that convention. It should therefore be treated as an unconfirmed Q&A figure rather than a definitive company-reported metric.
Management’s repeated emphasis on approximately 25% long-term exabyte growth is also significant. The July call already described a mid-20% growth framework. October therefore does not establish a reduction from a formal 30%-35% company target, even though analysts questioned whether stronger growth could persist. The appropriate baseline remains approximately 25% compound supply growth, with quarterly variability around product transitions.
This supply framework should not be confused with an estimate of unconstrained demand. Romano stated that “the supply-demand gap is probably growing at this point.” That is management’s assessment, not a quantified measure of unserved demand. The call did not disclose lost orders, unmet exabytes, customer inventories, or an independently measurable demand-to-supply ratio.
END-MARKET PERFORMANCE AND DEMAND BREADTH
Data-center revenue increased to $3.449 billion, up 17.6% sequentially and 63.2% year over year. It represented approximately 81% of total revenue and 90% of shipped capacity. Data center contributed approximately $516 million of the company’s $604 million sequential revenue increase, making it the dominant source of incremental growth.
Cloud nearline revenue increased for the 12th consecutive quarter. This provides stronger evidence of sustained commercial demand than isolated statements about AI-related storage requirements. It also means that the current strength is not simply an initial rebound from a depressed quarter. Revenue momentum has persisted across multiple phases of the broader infrastructure cycle.
Enterprise OEM revenue increased for the 6th consecutive quarter, with double-digit growth sequentially and year over year, and reached its 2nd-highest quarterly level in more than a decade. This broadening is favorable because it reduces reliance on incremental demand from only the largest hyperscalers. However, cloud customers still account for the substantial majority of data-center revenue and exabyte demand, so the company remains heavily exposed to a concentrated infrastructure buyer group.
The enterprise discussion also suggested faster adoption of higher-capacity products. Mosley noted that enterprise and OEM customers historically lagged the highest capacity points but are beginning to close that gap. Faster adoption could expand the addressable market for Mozaic beyond the leading hyperscalers and improve the economics of production standardization. It also increases the number of customer environments requiring qualification and support.
Edge IoT revenue increased to $784 million, up 12.5% sequentially and 52.2% year over year. The strength is notable because non-nearline shipped capacity was approximately flat year over year and slightly lower sequentially. This again points toward price and mix, rather than broad physical shipment expansion, as the principal explanation.
Edge IoT should not be treated as a separately disclosed profit segment. The company reports these figures as end-market categories, and no category-level operating margin was provided. The call therefore does not establish whether Edge IoT’s strong revenue growth is accretive or dilutive to the consolidated margin.
LONG-TERM AGREEMENTS: WHAT HAS IMPROVED AND WHAT REMAINS UNLOCKED
The most meaningful contractual development is the extension of some cloud supply agreements through calendar 2030. The July call already stated that the vast majority of nearline exabytes were allocated into calendar 2028 and that customer planning extended through 2029 and beyond. October adds greater specificity around longer-dated agreements, rather than introducing multiyear visibility for the 1st time.
The agreement structure contains distinct levels of commitment. Long-term arrangements allocate future exabyte supply. Build-to-order contracts establish product configuration and pricing closer to delivery. Management stated that configuration and pricing terms cover calendar 2027 and that calendar 2028 terms will begin to be finalized over the next several quarters.
This distinction matters for valuation. Allocated exabytes through 2030 are not equivalent to recognized revenue, fixed-price backlog, or an unconditional minimum-purchase obligation. The call did not disclose cancellation penalties, take-or-pay provisions, deposits, price escalators, or the precise legal enforceability of the longer-term allocations. Revenue visibility is therefore stronger than in a purely transactional model, but the duration and certainty of future gross profit remain lower than the headline agreement horizon might imply.
The model nevertheless has genuine economic advantages. Better visibility supports factory scheduling, reduces the incentive to build speculative inventory, and permits closer coordination of technology transitions. If pricing is finalized closer to delivery, Seagate may also retain an ability to capture a favorable future supply-demand balance rather than committing all future output at today’s economics.
The downside is symmetrical. Future pricing negotiations could occur after customer demand weakens or competing capacity becomes more available. Management’s ability to reduce output if customers stop pulling against plans limits inventory risk, but it does not eliminate lower revenue or poorer fixed-cost absorption.
The call did not establish that previously contracted pricing automatically floats upward. Management attributed much of the pricing improvement to rolling contract renewals and incorporating external cost changes into new negotiations. Broad assumptions that all calendar 2027 commitments can be repriced retrospectively would therefore be unsupported.
HAMR, MOZAIC, AND THE TECHNOLOGY ROADMAP
The core technology proposition remains increasing capacity per disk rather than materially increasing drive production. Higher areal density enables more shipped exabytes from a relatively stable unit base and improves customer economics through reduced infrastructure requirements per stored terabyte.
Management reaffirmed that HAMR should represent approximately 50% of nearline exabyte shipment run rate exiting calendar 2026, with Mozaic 4 representing approximately half of HAMR exabytes. Taken together, those targets imply Mozaic 4 at approximately 25% of total nearline exabytes at that exit point. They do not imply that Mozaic 4 will represent 50% of all nearline capacity.
The July call reported that HAMR had already reached approximately 40% of the nearline shipment run rate exiting June 2026. The December target therefore represents continued migration from an established production base, not a transition from pilot production to initial commercialization. The earlier approximately 70% HAMR objective for June 2027 was referenced in July’s Q&A; October management stated that the fiscal-year targets were unchanged without restating the percentage.
Mozaic 4 is ramping with 2 leading cloud service providers, with additional qualifications expected over the next several months. Broadening qualification is important for more than immediate revenue. It reduces dependence on a limited number of early adopters, improves flexibility in allocating output, and provides additional field evidence across different customer architectures.
Mozaic 5 remains targeted for qualification shipments toward the end of calendar 2027. That timing falls in fiscal 2028, not fiscal 2027. Management expressed increased optimism about the speed of the transition, but did not formally move forward the qualification schedule or provide a commercial-volume date. Fiscal 2027 earnings forecasts should therefore not assume a substantial Mozaic 5 contribution.
The economics of the 10-disk platform are attractive. Holding total drive cost constant, increasing capacity from 40 terabytes to 50 terabytes reduces cost per terabyte by 20%, not 25%. Moving from 30 terabytes to 40 terabytes reduces cost per terabyte by 25%. These are mechanical illustrations rather than realized cost guidance; actual outcomes depend on yields, purchased components, production cycle times, and the cost of the new recording technology.
Mosley emphasized that retaining the mechanical platform avoids repeated tooling changes and simplifies customer qualification. The company also stated that there is no technical prohibition against adding platters. The current choice is therefore an economic and execution preference, rather than a disclosed physical limitation.
The demonstration of 8 terabytes per disk in the laboratory supports the long-term technical runway but should not be treated as a commercial product announcement. The call did not provide production yields, reliability data, qualification timing, or a volume-manufacturing schedule at that density. The investment significance is evidence of potential scalability, not a near-term revenue contribution.
SMR QUALIFICATION AND THE MICROSOFT-BROADCOM READ-THROUGH
Microsoft’s qualification of a joint Seagate-Broadcom solution is a constructive commercialization milestone. HAMR increases recording density through a different physical recording mechanism, while SMR increases capacity through overlapping magnetic tracks and corresponding changes in data management. These technologies can be complementary, but they address different engineering constraints.
The significance of the qualification is that additional capacity is not useful if customers cannot deploy it economically within their existing software and connectivity architectures. The combined solution provides a validated configuration that can reduce adoption friction. It does not establish that SMR becomes universally suitable across workloads.
SMR retains application-specific trade-offs, especially around write behavior, data placement, and software management. Higher-capacity drives also require customer attention to rebuild behavior, throughput per terabyte, and failure-domain design. The qualification reduces uncertainty around a particular implementation; it does not eliminate every architectural constraint associated with denser storage.
The read-through for Broadcom is favorable at the ecosystem level because connectivity infrastructure enables deployment of higher-capacity storage. The call provides no basis for quantifying incremental Broadcom revenue, content per system, or earnings. Similarly, Microsoft’s participation validates technical adoption but does not disclose a new storage-capex commitment.
AI DEMAND: CREDIBLE STORAGE IMPLICATIONS WITHOUT OVERSTATING DIRECT ATTACH
Management’s AI argument is strongest when framed around retention and reuse. As historical information becomes more useful for inference, retrieval, governance, and agentic workflows, the economic incentive to retain data increases. This can support persistent storage demand beyond the initial construction of AI compute infrastructure.
The argument is weaker when AI activity is translated directly into HDD demand without specifying storage architecture. Frequently accessed inference state and active key-value caches generally require memory or fast flash tiers. HDDs are more directly exposed to retained datasets, durable context, logs, checkpoints, and information promoted into faster tiers as needed. A larger AI data lifecycle can benefit HDD demand without implying that latency-sensitive working sets reside directly on hard drives.
The KV-cache discussion did not quantify an HDD attach rate, incremental exabyte demand, or a customer-specific deployment opportunity. Management described improved movement between application and storage layers and greater efficiency in accessing retained information. This supports an indirect demand mechanism, but not a numerically defensible revenue forecast.
Physical AI was explicitly described as an early opportunity rather than a current material driver. Mosley stated, “I would say not yet directly, but we’re hopeful.” Physical AI should therefore be treated as optionality, not as an explanation for September’s revenue growth or a necessary assumption underpinning December guidance.
The retention thesis is also subject to economic limits. Data deduplication, compression, selective retention, application redesign, and tighter information-governance policies can reduce storage requirements relative to gross data creation. Seagate’s opportunity depends on the growth of economically retained data and its placement across storage tiers, not merely the volume of data generated.
DECEMBER GUIDANCE AND COMPARISON WITH PRIOR EXPECTATIONS
December revenue guidance of $4.7 billion to $4.9 billion implies approximately 13.4% sequential growth and 69.9% year-over-year growth at the midpoint. Adjusted EPS guidance of $9.00 to $9.40 implies approximately 19.8% sequential growth and 195.8% year-over-year growth at the midpoint.
Relative to the supplied Bloomberg consensus, the midpoint revenue premium is $300 million and the EPS premium is $0.77. Even the lower bounds exceed consensus by approximately 4.4% on revenue and 6.8% on EPS. This is a substantial forward surprise.
The comparison is against analyst expectations, not a previously issued numerical company forecast for the December quarter. The July call guided September and described sequential revenue, margin, and cash-generation growth through fiscal 2027. October provides the initial formal December ranges and reinforces that broader trajectory. Characterizing the December figures as a quantified increase from prior company guidance would be inaccurate.
The operating-margin wording requires careful interpretation. Prepared remarks and the supplement describe movement toward the mid-50% range, while the draft Q&A clarifies a result between 50% and 55%. Modeling exactly 55% at the revenue midpoint is not fully consistent with the EPS midpoint.
Using $9.20 EPS, 233 million diluted shares, a 16% tax rate, and $25 million of other expense produces approximately $2.577 billion of operating income, or a 53.7% operating margin. Adding $300 million of operating expenses implies gross margin of approximately 59.9%. The release separately states a projected annual adjusted tax rate of 15.5%; using that rate produces approximately 53.4% operating margin and 59.6% gross margin. These calculations are analytical reconciliations, not additional company guidance.
At a 55% operating margin and the other midpoint assumptions, EPS would be approximately $9.43, slightly above the upper end of the disclosed range. The practical modeling conclusion is an operating margin in the low-to-mid-54% vicinity, rather than automatically inserting 55%.
The improvement is predominantly operational. Other expense is expected to decline from $38 million to $25 million, contributing approximately $0.05 of quarterly EPS. That explains only a small portion of the $1.52 sequential increase in guided EPS. The diluted share-count assumption actually increases from approximately 232 million to 233 million, so December guidance does not depend on buyback-driven share shrinkage.
Fiscal 2027 revenue growth is expected to meaningfully outpace fiscal 2026’s 34% increase. July already guided growth above fiscal 2026, so the directional framework is not new. The September result and December outlook make it substantially better supported.
At the December midpoint, fiscal 1st-half revenue would reach $9.033 billion. Holding December revenue flat in March and June would produce fiscal 2027 revenue of $18.633 billion, approximately 52.8% above fiscal 2026. Holding quarterly EPS flat at $9.20 over the same periods would produce approximately $35.28 of annual EPS. These are mechanical illustrations, not management forecasts or guaranteed floors. Management’s stated expectation for continued sequential growth implies a stronger trajectory if execution remains on plan.
CASH GENERATION, EARNINGS QUALITY, AND CAPITAL INTENSITY
Free cash flow was $1.479 billion, calculated as $1.690 billion of operating cash flow less $211 million of capital expenditures. It increased 32.3% sequentially and 246.4% year over year. Free-cash-flow margin reached approximately 34.9%, compared with approximately 30.8% in June and 16.2% a year earlier.
Cash conversion supports the quality of the earnings expansion. Operating cash flow represented approximately 94.9% of adjusted net income, while free cash flow represented approximately 83.0%. The business is generating substantial cash rather than merely reporting higher accrual earnings.
Working capital was a net cash use of approximately $200 million. Receivables absorbed $283 million and inventory absorbed $129 million. These uses were partially offset by accounts payable and accrued liabilities. This is consistent with a growing business building products and extending credit against higher revenue, rather than cash flow being driven by inventory liquidation.
The offset from accrued expenses, income taxes, and warranty liabilities was meaningful at $272 million. Continued cash growth should therefore be assessed alongside the timing of tax and liability payments, not simply extrapolated from reported profit. The available statement does not establish that the entire offset is temporary, but neither does it justify assuming identical support each quarter.
Capital expenditures doubled year over year to $211 million despite remaining approximately 5% of revenue. This distinction is important: maintaining a 4%-6% capital-intensity framework does not mean absolute capital investment is flat. Rapid revenue growth provides substantial capacity to increase equipment spending while staying within the ratio.
At illustrative fiscal 2027 revenue of approximately $19.4 billion, the 4%-6% range would permit approximately $775 million to $1.16 billion of annual capital expenditures, compared with approximately $569 million in fiscal 2026. The technology strategy is capital-efficient, not capital-free.
Quarterly capital spending also exceeded depreciation and amortization of $76 million by approximately 2.8x. This is consistent with active investment in the transition and indicates that the current depreciation burden should not automatically be treated as representative of a fully matured investment base.
GAAP results confirm that the profitability expansion is not principally an adjustment artifact. GAAP operating margin was 48.8%, compared with adjusted operating margin of 50.7%, and GAAP EPS was $7.59 versus adjusted EPS of $7.68. However, the small EPS difference understates the gross size of the adjustments.
Adjusted earnings exclude $77 million of share-based-compensation-related charges, $44 million of debt-transaction losses, and smaller items, offset by $107 million of income-tax adjustments. The near-convergence of GAAP and adjusted EPS therefore reflects offsetting adjustments rather than immaterial compensation or financing costs.
The December EPS outlook excludes approximately $0.30 per share of pretax stock-compensation expense, equivalent to approximately $70 million at the guided share count. This is not a complete GAAP earnings bridge. Financing-classified employee-award withholding also consumed $17 million of cash in September outside the company’s free-cash-flow definition, a modest but relevant distinction when assessing cash available for distributions.
BALANCE-SHEET REPAIR AND THE CAPITAL-RETURN TRANSITION
The balance sheet has changed materially. September ended with approximately $2.383 billion of principal debt and $1.258 billion of cash, producing approximately $1.125 billion of net debt. Net leverage was approximately 0.2x trailing adjusted EBITDA. Management also reported the restoration of investment-grade status.
The subsequent retirement of $750 million of debt reduced principal outstanding to approximately $1.633 billion. Management expects to become net cash positive by calendar year-end. The remaining financing burden is now small relative to current cash generation, reducing refinancing risk and increasing financial flexibility.
The debt reduction should not be mechanically combined with unchanged September cash. A debt repayment funded from cash reduces both cash and debt at the time of payment. The improvement in net debt comes from cash generation and other balance-sheet changes, not the repayment transaction alone.
Shareholder distributions totaled $568 million in September, consisting of $400 million of repurchases and $168 million of dividends. This was approximately 38% of free cash flow, reflecting the continuing priority assigned to debt retirement. The expected increase in repurchases beginning in the March quarter represents a genuine change in the destination of cash generation.
The capital-return framework is not a commitment to repurchase shares with 100% of free cash flow. Mosley stated, “Our model is 75%, and we should be able to get back to that model over some period of time.” The most defensible interpretation is approximately 75% of free cash flow returned through the combined dividend and repurchase program, with additional returns potentially opportunistic.
At September’s free-cash-flow level, a 75% distribution rate would support approximately $1.109 billion of quarterly capital returns. After approximately $175 million of dividends at the new rate and the quarter-end share count, approximately $934 million would remain for repurchases. This is an illustrative steady-state calculation, not management’s March buyback guidance.
The $4.4 billion remaining authorization provides capacity to execute, but authorization is not equivalent to completed repurchases or a binding schedule. Moreover, ordinary shares outstanding increased from approximately 227 million to 230 million during September despite $400 million of buybacks. Historical dilution and the resolution of convertible instruments mean that gross repurchase spending should not be equated with proportional net EPS accretion.
The dividend increase from $0.74 to $0.76 is approximately 2.7%, consistent with the stated approximately 3% increase. Its significance is primarily confidence in cash-flow durability. Repurchases, rather than the dividend, are intended to be the principal mechanism for returning incremental cash.
COMPETITIVE AND INDUSTRY IMPLICATIONS
The call supports an industry structure in which technology transitions, qualification requirements, and coordinated supply chains constrain the speed of incremental supply. Mosley rejected the idea that meaningful HDD capacity can be added simply by installing a small number of machines. This is consistent with the complexity of integrating heads, media, mechanics, electronics, firmware, and customer qualification.
It does not establish that competing supply cannot expand. Higher platter counts, alternative recording roadmaps, incremental manufacturing investment, and successful qualification can all increase industry exabyte output. Stable drive-unit production also does not imply stable industry capacity because density improvements themselves increase supplied exabytes.
The 4%-6% capital framework is favorable if Seagate can meet its technology and shipment objectives within it. Comparing that ratio directly with a competitor’s reported or discussed capital intensity is insufficient to establish superiority. Different production architectures, investment timing, product mixes, and accounting classifications can affect the comparison.
Western Digital and Toshiba could benefit from the same broad demand and pricing environment. Seagate’s differentiated upside depends on translating HAMR leadership into better cost, capacity, qualification, or customer-allocation outcomes. The call does not demonstrate a quantified market-share gain.
Conversely, stronger HDD pricing improves the economic incentive for customers to reassess storage-tier placement and for competitors to invest. NAND substitution is not determined solely by device price per terabyte, but the relationship between HDD pricing, flash pricing, power, density, and workload performance remains an important constraint on indefinite price increases.
VALUATION, SCENARIOS, AND INVESTMENT IMPLICATIONS
Valuation calculations use a $667.85 regular-session reference displayed by Yahoo Finance on October 27, not a verified post-call executable price. A usable live Bloomberg price was unavailable. Consensus comparisons throughout use the supplied Bloomberg notice rather than mixing estimate snapshots from other reporting services.
At that reference price, Seagate trades at approximately 18.1x December midpoint EPS annualized to $36.80. Using approximately 230 million quarter-end shares implies an equity value of approximately $153.6 billion. Annualizing September free cash flow produces approximately $5.9 billion, equivalent to a 3.9% equity free-cash-flow yield. The annualized dividend yield is approximately 0.5%.
These figures illustrate why apparently inexpensive earnings multiples require context. Current profitability is unusually strong, and quarterly earnings annualization is not a substitute for a through-cycle forecast. The stock can be attractive if pricing and margins remain structurally elevated, but less inexpensive if current earnings represent a high point in supply scarcity.
The following scenarios are illustrative analytical estimates, not company guidance or consensus forecasts. Probabilities and valuation multiples are judgmental and carry lower confidence than the reported financial results. The model retains December midpoint guidance, uses a 16% tax rate, approximately $25 million of quarterly other expense, and 233 million diluted shares for the remaining quarters. No additional buyback accretion is included.
The base case, assigned a 55% probability, assumes March revenue of $5.040 billion and June revenue of $5.292 billion, with adjusted operating margins of 55% and 56%. Fiscal 2027 revenue would reach approximately $19.365 billion and adjusted EPS approximately $37.38. Applying a 20x multiple produces a valuation of approximately $748, or approximately 12% price appreciation from the reference price. This case requires continued qualification progress, favorable pricing, and renewed shipment growth, without extrapolating September’s pricing acceleration indefinitely.
The bull case, assigned a 25% probability, assumes March revenue of $5.4 billion and June revenue of $6.0 billion, with operating margins of 57% and 59%. Fiscal revenue would reach approximately $20.433 billion and adjusted EPS approximately $40.56. Applying a 24x multiple produces a valuation of approximately $973, or approximately 46% upside. This outcome requires stronger sustained pricing, a successful Mozaic 4 ramp, and greater investor confidence that high margins are durable rather than cyclical.
The bear case, assigned a 20% probability, assumes March revenue of $4.4 billion and June revenue of $4.1 billion, with operating margins declining to 48% and 44%. Fiscal revenue would still reach approximately $17.533 billion because of the strong opening quarters, but adjusted EPS would be approximately $30.82. Applying a 14x multiple produces a valuation of approximately $431, or approximately 35% downside. This scenario reflects weakening price realization, qualification delays, customer deployment slippage, or a change in perceived supply discipline.
The probability-weighted valuation is approximately $741, implying approximately 11% price appreciation before dividends from the stated reference. The result supports a constructive operating view but does not establish an unusually favorable immediate risk-reward balance. The upside depends partly on valuation support, while the downside combines lower earnings with multiple compression.
An entry around $600 or below would improve the same illustrative probability-weighted appreciation potential to approximately 23%, although the bear-case downside would remain approximately 28%. The investment implication is therefore to retain measured exposure and prefer valuation-driven additions rather than treating the earnings beat as sufficient justification to increase risk at any price.
CATALYSTS, POSITION DISCIPLINE, AND THESIS INVALIDATION
The most immediate catalyst is the December operating outcome. Additional Mozaic 4 qualifications are expected over the next several months, followed by a meaningful increase in exabyte shipments. Confirmation of both shipment growth and gross margin approaching approximately 60% would support the interpretation that pricing strength and technology-driven capacity expansion can coexist.
The March quarter introduces a separate capital-allocation catalyst as repurchases increase following the major debt reductions. The relevant evidence is actual net share-count reduction, not simply a larger gross buyback announcement.
Calendar 2028 pricing negotiations provide another important catalyst over the next several quarters. Favorable pricing on allocated supply would convert longer-term capacity visibility into greater earnings visibility. Stable allocations accompanied by weaker pricing would provide a materially less favorable signal.
Mozaic 5 qualification shipments toward late calendar 2027 are a longer-duration catalyst. They matter for fiscal 2028 and beyond, but should not be necessary to achieve the central fiscal 2027 earnings case.
For a hypothetical diversified portfolio, an initial position of approximately 1% of NAV at a sufficiently discounted entry, with a maximum of approximately 2% after December execution is demonstrated, is more consistent with the scenario dispersion than a concentrated position. A 15% entry-price stop would correspond to an intended position-level NAV loss of approximately 15 basis points at 1% sizing or 30 basis points at 2% sizing, before gaps, slippage, or correlated portfolio losses. These are illustrative risk limits; actual portfolio holdings and exposures were not provided.
The principal portfolio exposures are hyperscaler capital spending, AI infrastructure sentiment, storage pricing, technology-transition execution, and growth-equity valuation. Seagate adds a different economic layer from accelerators or networking, but it should not be treated as an independent hedge against a broad AI infrastructure retrenchment. Exposure alongside Western Digital, memory suppliers, or other AI infrastructure beneficiaries could materially increase correlated risk.
An immediate review would be warranted if December results fall below the disclosed guidance ranges, if exabytes remain broadly flat despite the expected qualification-driven increase, or if gross margin fails to approach the level implied by the earnings guide. A single miss would require diagnosis rather than automatically proving structural impairment.
The thesis would be more decisively invalidated by customer pull reductions, sustained pricing concessions, repeated qualification delays, rising inventory without corresponding shipment growth, or evidence that competitive supply is increasing faster than retained-data demand. Capital intensity persistently exceeding the stated framework without commensurate exabyte growth would also weaken the capital-efficiency argument.
The overall conclusion is that Seagate has substantially improved its earnings power, financial resilience, and capacity to return cash. The principal unresolved issue is not whether the business is performing well, but how much of the present price-cost spread can be sustained as customer commitments roll forward and industry supply adapts. The call supports higher earnings estimates and continued ownership discipline, not the assumption that current pricing momentum is permanent.
SOURCE BASIS AND LIMITATIONS
The analysis is based on the supplied October 27, 2026 draft earnings-call transcript and Bloomberg earnings notice; Seagate’s October 27 earnings release and fiscal Q1 2027 supplemental financial information; the July 28, 2026 earnings release, supplemental financial information, and corrected fiscal Q4 2026 transcript; and the dated Yahoo Finance price reference. Precise financial-statement figures take precedence over rounded spoken figures. The draft contains speaker-label inconsistencies, so ambiguous Q&A responses are attributed to management rather than assigned with unwarranted precision. Contract enforceability, product-level pricing, qualification economics, and external-component cost effects remain incompletely disclosed.
COMPANY EMPLOYEES ON THE CALL
• William David Mosley, Chairman and Chief Executive Officer. • Gianluca Romano, Executive Vice President and Chief Financial Officer. • Shanye Hudson, Senior Vice President, Investor Relations and Treasury.
RESEARCH ANALYSTS ON THE CALL
• CJ Muse, Cantor Fitzgerald. • Erik Woodring, Morgan Stanley Equity Research. • Amit Daryanani, Evercore ISI. • Krish Sankar, TD Cowen. • Asiya Merchant, Citi Research. • Mark Newman, Bernstein. • Wamsi Mohan, Bank of America Merrill Lynch. • Ben Reitzes, Melius Research. • Karl Ackerman, BNP Paribas Exane. • Joe Quatrochi, Wells Fargo Securities. • Joseph Cardoso, J.P. Morgan.
Key Read-Throughs
KEY READ-THROUGHS FROM SEAGATE TECHNOLOGY’S FISCAL Q1 2027 EARNINGS CALL
Seagate’s October 27 call provides stronger evidence of pricing power across the HDD industry than of an equivalent acceleration in physical hardware demand. Revenue increased 17% sequentially while shipped capacity increased approximately 1%, and management attributed further margin expansion primarily to pricing. The most actionable positive implication is for Western Digital, whose already-issued outlook receives independent support from its principal competitor. The clearest negative implication is for businesses purchasing substantial storage capacity ahead of customer monetization, particularly Backblaze. Selective benefits also extend to qualified connectivity and glass-substrate suppliers, but exabyte growth should not be translated directly into component-unit growth. Across cloud and enterprise infrastructure, the critical distinction is between benefiting from greater data retention and retaining the associated economic value. Countries below identify primary listing markets. Directional assessments concern the specified business mechanism, not a guaranteed share-price response.
HARD DISK DRIVES: INDUSTRY PRICING POWER IS MORE IMPORTANT THAN THE HAMR LEADERSHIP DEBATE (READ-THROUGH 1)
Affected company: Western Digital (WDC: US).
Direction and magnitude: Strong positive for core earnings durability and cash generation. High consolidated exposure makes this the most financially material positive read-through.
Supporting evidence: Seagate reported 57.8% adjusted gross margin, up 510 basis points sequentially, despite limited sequential exabyte growth and higher externally sourced component costs. Romano said further margin improvement was coming “at this point mainly from pricing.” Mosley stated, “Absolutely everything we can make above and beyond our plans is being spoken for.” Most nearline supply is allocated through calendar 2028, with some cloud agreements extending through calendar 2030.
The transmission mechanism is industry-wide scarcity rather than the transfer of Seagate’s proprietary manufacturing economics to Western Digital. Higher demand for retained data, constrained qualified supply, and periodic contract repricing allow HDD manufacturers to capture more revenue per terabyte. Western Digital does not need to match Seagate’s HAMR shipment mix immediately to participate in this pricing environment.
Western Digital had already reported on October 22, posting 58.1% adjusted gross margin and guiding December gross margin to 60%-61%. Seagate’s results therefore corroborate an existing Western Digital forecast; they are not a leading indicator of an unreported September quarter. The incremental information is that another major supplier sees continuing pricing strength, no meaningful customer pullback, and no requirement to expand drive-unit production aggressively.
The non-consensus implication is that a simple “Seagate wins, Western Digital loses” interpretation of HAMR leadership is inadequate. Western Digital’s September gross margin was slightly higher than Seagate’s despite their different technology-transition schedules. This does not eliminate future cost or qualification risks, but it shows that market structure and contractual pricing currently matter at least as much as recording technology for realized profitability.
The earnings sensitivity is substantial. At Western Digital’s $5.1 billion December revenue midpoint, an additional 100 basis points of gross margin would contribute approximately $51 million of operating profit and approximately $0.11 of quarterly EPS, assuming unchanged operating expenses and its guided tax rate and share count. This is a sensitivity, not an estimate increase.
Near-term catalyst: Confirmation that December contract pricing and shipment execution support Western Digital’s existing 60%-61% margin outlook. The immediate trading relevance is reduced concern that its forecast depends on company-specific assumptions unsupported elsewhere in the industry.
Longer-duration implication: Multiyear supply planning and technology-led capacity growth support sustained cash generation without requiring proportional increases in drive production. However, allocations through 2030 are not fixed-price revenue guarantees. The positive view would weaken if customers reduce planned purchases or competing exabyte supply begins to outrun demand.
CLOUD STORAGE OPERATORS: BACKBLAZE FACES A MORE CONCENTRATED COST HEADWIND THAN THE HYPERSCALERS (READ-THROUGH 2)
Affected company: Backblaze (BLZE: US).
Direction and magnitude: Negative for incremental infrastructure costs, near-term free cash flow, and the timing of margin recovery. Potentially material to the company, although not evidence of an imminent liquidity problem or weaker customer demand.
Supporting evidence: Seagate’s revenue rose approximately 17% sequentially against approximately 1% growth in shipped capacity. Management expects continued pricing improvement, described a potentially widening supply-demand gap, and indicated that most nearline capacity is allocated through 2028. These conditions are unfavorable for a storage operator purchasing additional hardware to fulfill growing customer commitments.
Backblaze is a direct economic exposure rather than merely an AI-themed proxy. Its published fleet reports identify deployed Seagate drives, and its business requires substantial owned storage infrastructure. Unlike a diversified hyperscaler, a larger proportion of its economics is tied to the cost of providing persistent storage.
The transmission mechanism begins with capital expenditure. Higher acquisition cost per usable terabyte increases the cash required to provision capacity. Once that equipment enters service, depreciation affects GAAP gross margin. Customer pricing and utilization must subsequently recover the higher investment. Consequently, strong contracted revenue growth can coexist with weaker near-term free cash flow or a slower return on invested capital.
Backblaze’s own disclosures make this particularly relevant. Its August call placed 2026 capital expenditure at 55%-65% of revenue and explicitly identified rapidly changing hardware prices as a reason not to provide a 2027 capital-intensity forecast. At its September 9 Investor Day, management already anticipated 300-600 basis points of gross-margin pressure through approximately mid-2027 as infrastructure deployment preceded revenue ramp-up.
The novelty is therefore not that margin pressure or negative free cash flow could occur. Those outcomes were already disclosed. Seagate’s call increases the risk that acquisition-cost assumptions remain unfavorable during Backblaze’s buildout, making the timing and magnitude of the subsequent recovery more important.
The financing update materially qualifies the negative conclusion. Backblaze raised approximately $201 million through a 0% coupon convertible and described replacing expensive lease financing with cash-funded investment. Its September framework already contemplated negative adjusted free cash flow for 4-5 quarters. Seagate’s pricing commentary should not be misrepresented as newly revealing that cash-flow transition or as establishing a financing shortfall. The more defensible concern is infrastructure economics and recovery timing.
Customer-owned deployments provide another important boundary. Backblaze’s managed-storage offering for CoreWeave runs on customer-owned hardware and does not require Backblaze to fund that equipment. The cost exposure therefore differs between its owned-capacity platform and its managed-service activities. Applying the same capital-cost assumption to both would overstate the risk.
Near-term catalyst: Backblaze’s scheduled November 2 results, particularly updated hardware procurement costs, capital deployment, utilization, and the expected margin trough. Strong revenue alone would not resolve the issue.
Longer-duration implication: The investment distinction becomes increasingly important between storage software and services deployed on customer-owned infrastructure and storage supplied from an owned hardware fleet. The former can retain attractive revenue growth with less exposure to HDD inflation. Backblaze’s ability to reprice services and expand managed storage is the principal offset to the negative cost read-through.
HYPERSCALE CLOUD: STORAGE INFLATION IS A CASH-FLOW HEADWIND, NOT AN IMMEDIATE CLOUD-DEMAND WARNING (READ-THROUGH 3)
Affected companies: Microsoft (MSFT: US), Amazon (AMZN: US), and Alphabet (GOOGL: US).
Direction and magnitude: Negative for incremental storage procurement costs and capital efficiency. Meaningful within storage infrastructure, but low direct consolidated earnings materiality relative to the scale of these companies. Microsoft is explicitly identified in the call; Amazon and Alphabet are industry-exposure read-throughs, not identified counterparties to the specific agreements discussed.
Supporting evidence: Seagate said pricing continues to improve, attributed much of the increase to rolling contract renewals, and reported that build-to-order agreements establish configuration and pricing through calendar 2027. Calendar 2028 terms will be finalized over subsequent quarters. Management also said the supply-demand gap may be widening.
The transmission mechanism is straightforward: more expensive storage capacity raises the capital required to accommodate retained-data growth. The initial effect is on cash expenditure and infrastructure investment. Depreciation subsequently affects cloud-service margins as the equipment enters operation. This is not an immediate dollar-for-dollar operating-expense increase.
The scale sensitivity is useful without assigning undisclosed procurement volumes. Each $1 increase in acquisition cost per terabyte adds $100 million to the purchase cost of 100 exabytes. The call does not disclose any hyperscaler’s volume, contract price, or repricing schedule, so company-specific EPS adjustments would be unsupported.
The important contractual implication is that long-term supply assurance is not necessarily long-term price protection. Allocations extending through 2028 or 2030 can reduce availability risk while leaving future pricing negotiations exposed to the market balance. Hyperscalers may therefore face a recurring negotiation over the cost of incremental capacity even when physical supply has been reserved.
This should not be extrapolated into a bearish cloud-demand conclusion. Mosley reported no evidence of customer purchasing delays attributable to land, power, or other infrastructure constraints in the orders discussed. The signal is that customers continue to procure storage despite higher prices, not that deployment programs are collapsing.
There is also a material efficiency offset. Microsoft’s qualification of the Seagate-Broadcom HAMR-plus-SMR configuration supports higher storage density within a similar cost and power envelope. More bytes per drive can reduce the required number of slots, enclosures, connections, and associated infrastructure for a given capacity target. Consequently, HDD purchase-price inflation can coexist with improvements elsewhere in total storage cost.
Near-term catalysts: Microsoft’s October 28 and Amazon’s October 29 earnings updates, particularly capital expenditure, infrastructure depreciation, and cloud-margin commentary. Seagate’s call supplies a specific cost channel to distinguish from GPU purchases or construction spending; it does not establish that storage will explain a material portion of any aggregate capex increase.
Longer-duration implication: Persistent data retention creates a continuing infrastructure obligation beyond the initial AI compute buildout. The relevant competitive advantage shifts toward operators that can combine supply access, density improvements, software efficiency, and customer pricing. The negative procurement read-through is high confidence; the net effect on each company’s cloud margin remains unquantified.
ENTERPRISE INFRASTRUCTURE: STORAGE REVENUE GETS SUPPORT, BUT SCARCITY PROFITS DO NOT AUTOMATICALLY REACH SYSTEMS VENDORS (READ-THROUGH 4)
Affected companies: Dell Technologies (DELL: US) and Hewlett Packard Enterprise (HPE: US).
Direction and magnitude: Positive for the storage-demand backdrop, but negative for assumptions that nominal storage growth necessarily produces proportional margin expansion. Modest consolidated impact because storage is only part of each company and HDD-based products are only part of storage.
Supporting evidence: Seagate’s enterprise OEM revenue increased for the 6th consecutive quarter, grew double digits sequentially and year over year, and reached its 2nd-highest quarterly level in more than a decade. Mosley also said enterprise customers are moving toward higher-capacity drives more quickly than historically. At the same time, Seagate’s aggregate revenue growth substantially exceeded exabyte growth, and management emphasized stronger pricing.
The positive channel is broader demand for persistent data infrastructure outside the largest hyperscalers. Enterprise and sovereign-cloud deployments require capacity, integration, management, support, and data-protection capabilities. Dell and HPE can participate through storage systems and associated services. The call supports continuing demand across these environments rather than an exclusively hyperscale storage cycle.
The evidence is corroborative rather than a new discovery. Dell had already reported storage revenue of approximately $4.9 billion, up 26%, for its July quarter. HPE had reported approximately $1.3 billion, up 10.2%. Seagate’s September commentary extends the evidence of end-market strength into a later period, but does not identify either company’s orders or establish a company-specific beat.
The more actionable distinction concerns profit capture. Seagate and Western Digital sell the scarce underlying media. Systems vendors purchase that media and must recover higher costs through their own pricing, product mix, software value, or services. If customer pricing adjusts more slowly than procurement costs, gross profit is pressured. Even full dollar-for-dollar cost recovery can inflate revenue while diluting gross-margin percentage.
Therefore, stronger storage revenue is not sufficient evidence of a broad physical-unit refresh or superior operating leverage. The call does not disclose enterprise OEM exabytes separately, so price and mix cannot be cleanly separated from volume in that category. It also does not quantify a relationship between storage demand and purchases of AI servers, CPUs, or accelerators.
Magnitude requires restraint. Storage represented approximately 10%-11% of Dell’s and HPE’s latest reported quarterly revenue, and those categories include products not directly exposed to HDD procurement. Applying Seagate’s growth or margin changes to either company’s entire infrastructure business would materially overstate the read-through.
Near-term catalyst: The next reporting cycle for their October-ending quarters, especially storage orders, gross-profit dollars, pricing actions, and inventory. A revenue beat driven by component inflation should be distinguished from an increase in underlying system demand.
Longer-duration implication: Systems vendors with differentiated software, support, and customer integration have better tools to recover rising media costs than undifferentiated hardware assemblers. The call favors selective exposure to storage franchises with demonstrated profit conversion rather than a blanket positive view on enterprise hardware.
STORAGE CONNECTIVITY SEMICONDUCTORS: BROADCOM HAS A VERIFIED QUALIFICATION BENEFIT, NOT A QUANTIFIED AI REVENUE WIN (READ-THROUGH 5)
Affected company: Broadcom (AVGO: US).
Direction and magnitude: Positive for the competitiveness and adoption of storage-connectivity products. Low consolidated earnings materiality on the evidence disclosed; insufficient support for a material group EPS revision.
Supporting evidence: Seagate specifically identified Microsoft’s qualification of a joint solution combining HAMR-based Mozaic drives configured with SMR and Broadcom connectivity infrastructure. Mosley described the solution as providing “a blueprint for implementing SMR storage” and emphasized that broader adoption had previously required meaningful architectural and software changes.
The supporting October 26 announcement identifies Broadcom’s host bus adapter as the connection between servers and storage devices. It also states that Seagate’s drives are the 1st SMR drives added to the relevant Broadcom approved-vendor list and that Azure Storage completed qualification of the combined configuration.
The transmission mechanism is lower deployment friction. Higher-capacity drives create economic value only if the host infrastructure can address, manage, and operate them reliably. A qualified configuration reduces integration uncertainty and can make Broadcom’s connectivity products easier to specify in future storage deployments.
The qualification also strengthens Broadcom’s position within a validated architecture. Customer qualification work, interoperability testing, and operational familiarity can encourage reuse of the same configuration. This is a credible commercial advantage, although the call does not establish exclusivity or permanent switching costs.
The limitation is the revenue denominator. More exabytes do not necessarily require proportionally more HBAs. Higher-capacity drives can supply additional storage using fewer physical drives and potentially fewer connections per stored terabyte. The evidence supports product relevance and adoption eligibility, not a 25% annual increase in Broadcom storage-controller units.
The event is also not entirely new information. The interoperability milestone was announced on October 26, before the earnings call. October 27 adds management emphasis and broader demand context rather than a fresh disclosed purchase order.
Near-term catalyst: Production deployments and additional customer qualifications following the validated configuration. No shipment quantity, content value, or revenue-recognition schedule was disclosed, so an immediate earnings catalyst cannot be quantified.
Longer-duration implication: Broadcom benefits if its qualified connectivity becomes a commonly adopted route for deploying denser persistent-storage systems. This is distinct from its AI accelerators and networking franchises. The call should not be used to increase forecasts for unrelated Broadcom product categories.
JAPANESE STORAGE MATERIALS: HAMR VALIDATES HOYA’S GLASS EXPOSURE, BUT AREAL DENSITY LIMITS THE VOLUME MULTIPLIER (READ-THROUGH 6)
Affected company: HOYA (7741: Japan).
Direction and magnitude: Positive for the durability of its HDD glass-substrate business and longer-term addressable-market expansion. Moderate business-level relevance, with a smaller consolidated impact because HOYA also operates substantial non-storage businesses.
Supporting evidence: Seagate reaffirmed that HAMR should represent approximately 50% of nearline exabyte shipments at the calendar 2026 exit rate, with Mozaic 4 representing approximately half of those HAMR shipments. Additional customer qualifications are expected over the next several months. Management retained the 10-disk platform and described progression toward higher capacity per disk.
HOYA’s own integrated report identifies HDD glass substrates as a core product and states that it holds approximately 40% of the overall nearline substrate market and 100% of the glass-based HDD substrate market. Those are company estimates. HOYA explicitly links longer-term market-share expansion to HAMR adoption and higher platter counts.
The positive transmission mechanism is increasing use of glass-compatible recording architectures across the industry. Commercial qualification and field deployment reduce the risk that advanced recording remains a delayed laboratory roadmap. They support the economic rationale for substrate development, customer qualification, and production capacity.
However, Seagate’s exabyte growth is not an equivalent forecast for HOYA’s substrate volumes. A 10-disk drive moving from 4 terabytes to 5 terabytes per disk provides 25% more capacity without requiring additional disks. Furthermore, a transition from an existing glass-based product to a newer glass-based product does not create a new substrate attachment merely because the recording technology improves.
The high-conviction positive conclusion is therefore technology and customer-conversion support, not proportional volume acceleration. HOYA’s incremental opportunity depends on additional manufacturers and platforms moving to glass, actual platter counts, substrate pricing and specification mix, and customer production volumes.
The geographic implication is tangible but longer dated. HOYA has announced approximately ¥50 billion of initial investment in a new Vietnam facility targeted to begin operations in its fiscal 2028. Seagate’s roadmap and customer commitments support the demand rationale behind that investment. They do not establish that the facility’s capacity is available for the December 2026 shipment ramp or that Seagate awarded a new order to HOYA on this call.
Near-term catalyst: Subsequent HDD-substrate disclosures on production, customer qualification, and mix. Seagate’s December volume ramp is supportive evidence, but a substrate earnings beat cannot be inferred from exabyte growth alone.
Longer-duration implication: HOYA offers exposure to the transition in recording materials rather than a simple bet on total HDD units. That is the attractive distinction. The limiting factor is that areal-density improvements also allow storage customers to obtain more capacity from each substrate, making glass penetration and customer wins more important than headline data growth.
Report record
- Sector
- Information Technology
- Industry
- Technology Hardware, Storage & Peripherals
- Fiscal period end
- March 31, 2027
- Report date
- October 27, 2026
- Analysis
- 6265 words
- Read-throughs
- 2901 words
- Content fingerprint (PDF)
7abcd22ffd62- Content fingerprint (analysis)
22c2c5254276- Content fingerprint (read-throughs)
c11a7283674f
Prepared from the company's earnings release and earnings call transcript. Figures as reported by the company. For information only. Not investment advice.
More from Seagate Technology Holdings plc
No other reports yet.
All Seagate Technology Holdings plc reports
More in Information Technology
Improving operating economics accompanied by greater capital intensity and execution exposure
A substantive forward upgrade, not merely the incorporation of an already completed quarter
All Information Technology reports
Seagate Technology Holdings plc on the Atlas Peak ticker page
Follow @AtlasPeakRes on X for new earnings reports as they publish.