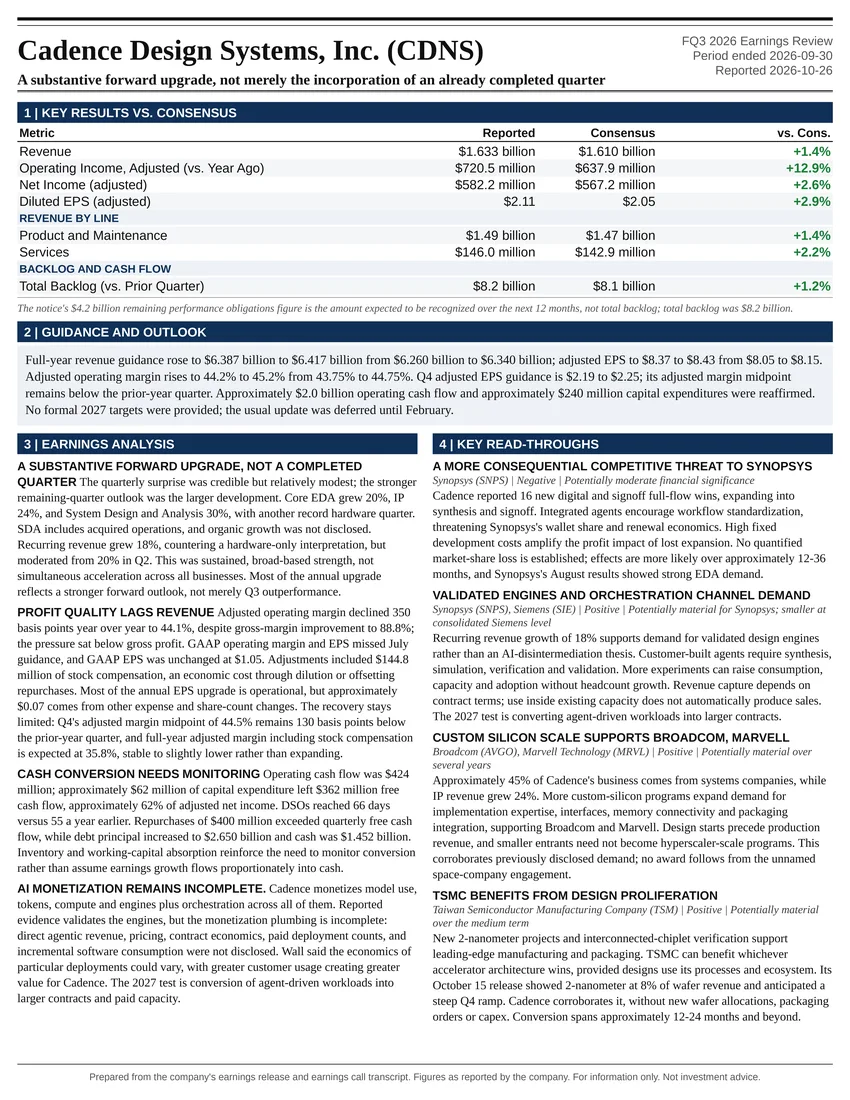
A substantive forward upgrade, not merely the incorporation of an already completed quarter
Earnings Reports
Amkor Technology, Inc. FQ3 2026 Earnings Report
Amkor Technology, Inc. (AMKR) FQ3 2026 earnings: Improving operating economics accompanied by greater capital intensity and execution exposure. Full earnings analysis, key read-throughs, and the one-page exhibit from Atlas Peak Research.
Amkor Technology, Inc. (AMKR)
Sector: Information Technology · FQ3 2026 · Period end September 30, 2026 · Reported October 26, 2026
Amkor’s Q3 2026 earnings call supports a more favorable assessment of its operating mix and advanced-packaging opportunity, but not an unqualified upgrade to the equity investment case.
Download the one-page report (PDF)
View one-page exhibit
Download analysis (.md)
Download read-throughs (.md)
Post to X
One-Page Exhibit
Earnings Analysis
EXECUTIVE CALL SUMMARY: Amkor Technology Inc. (10/26/26)
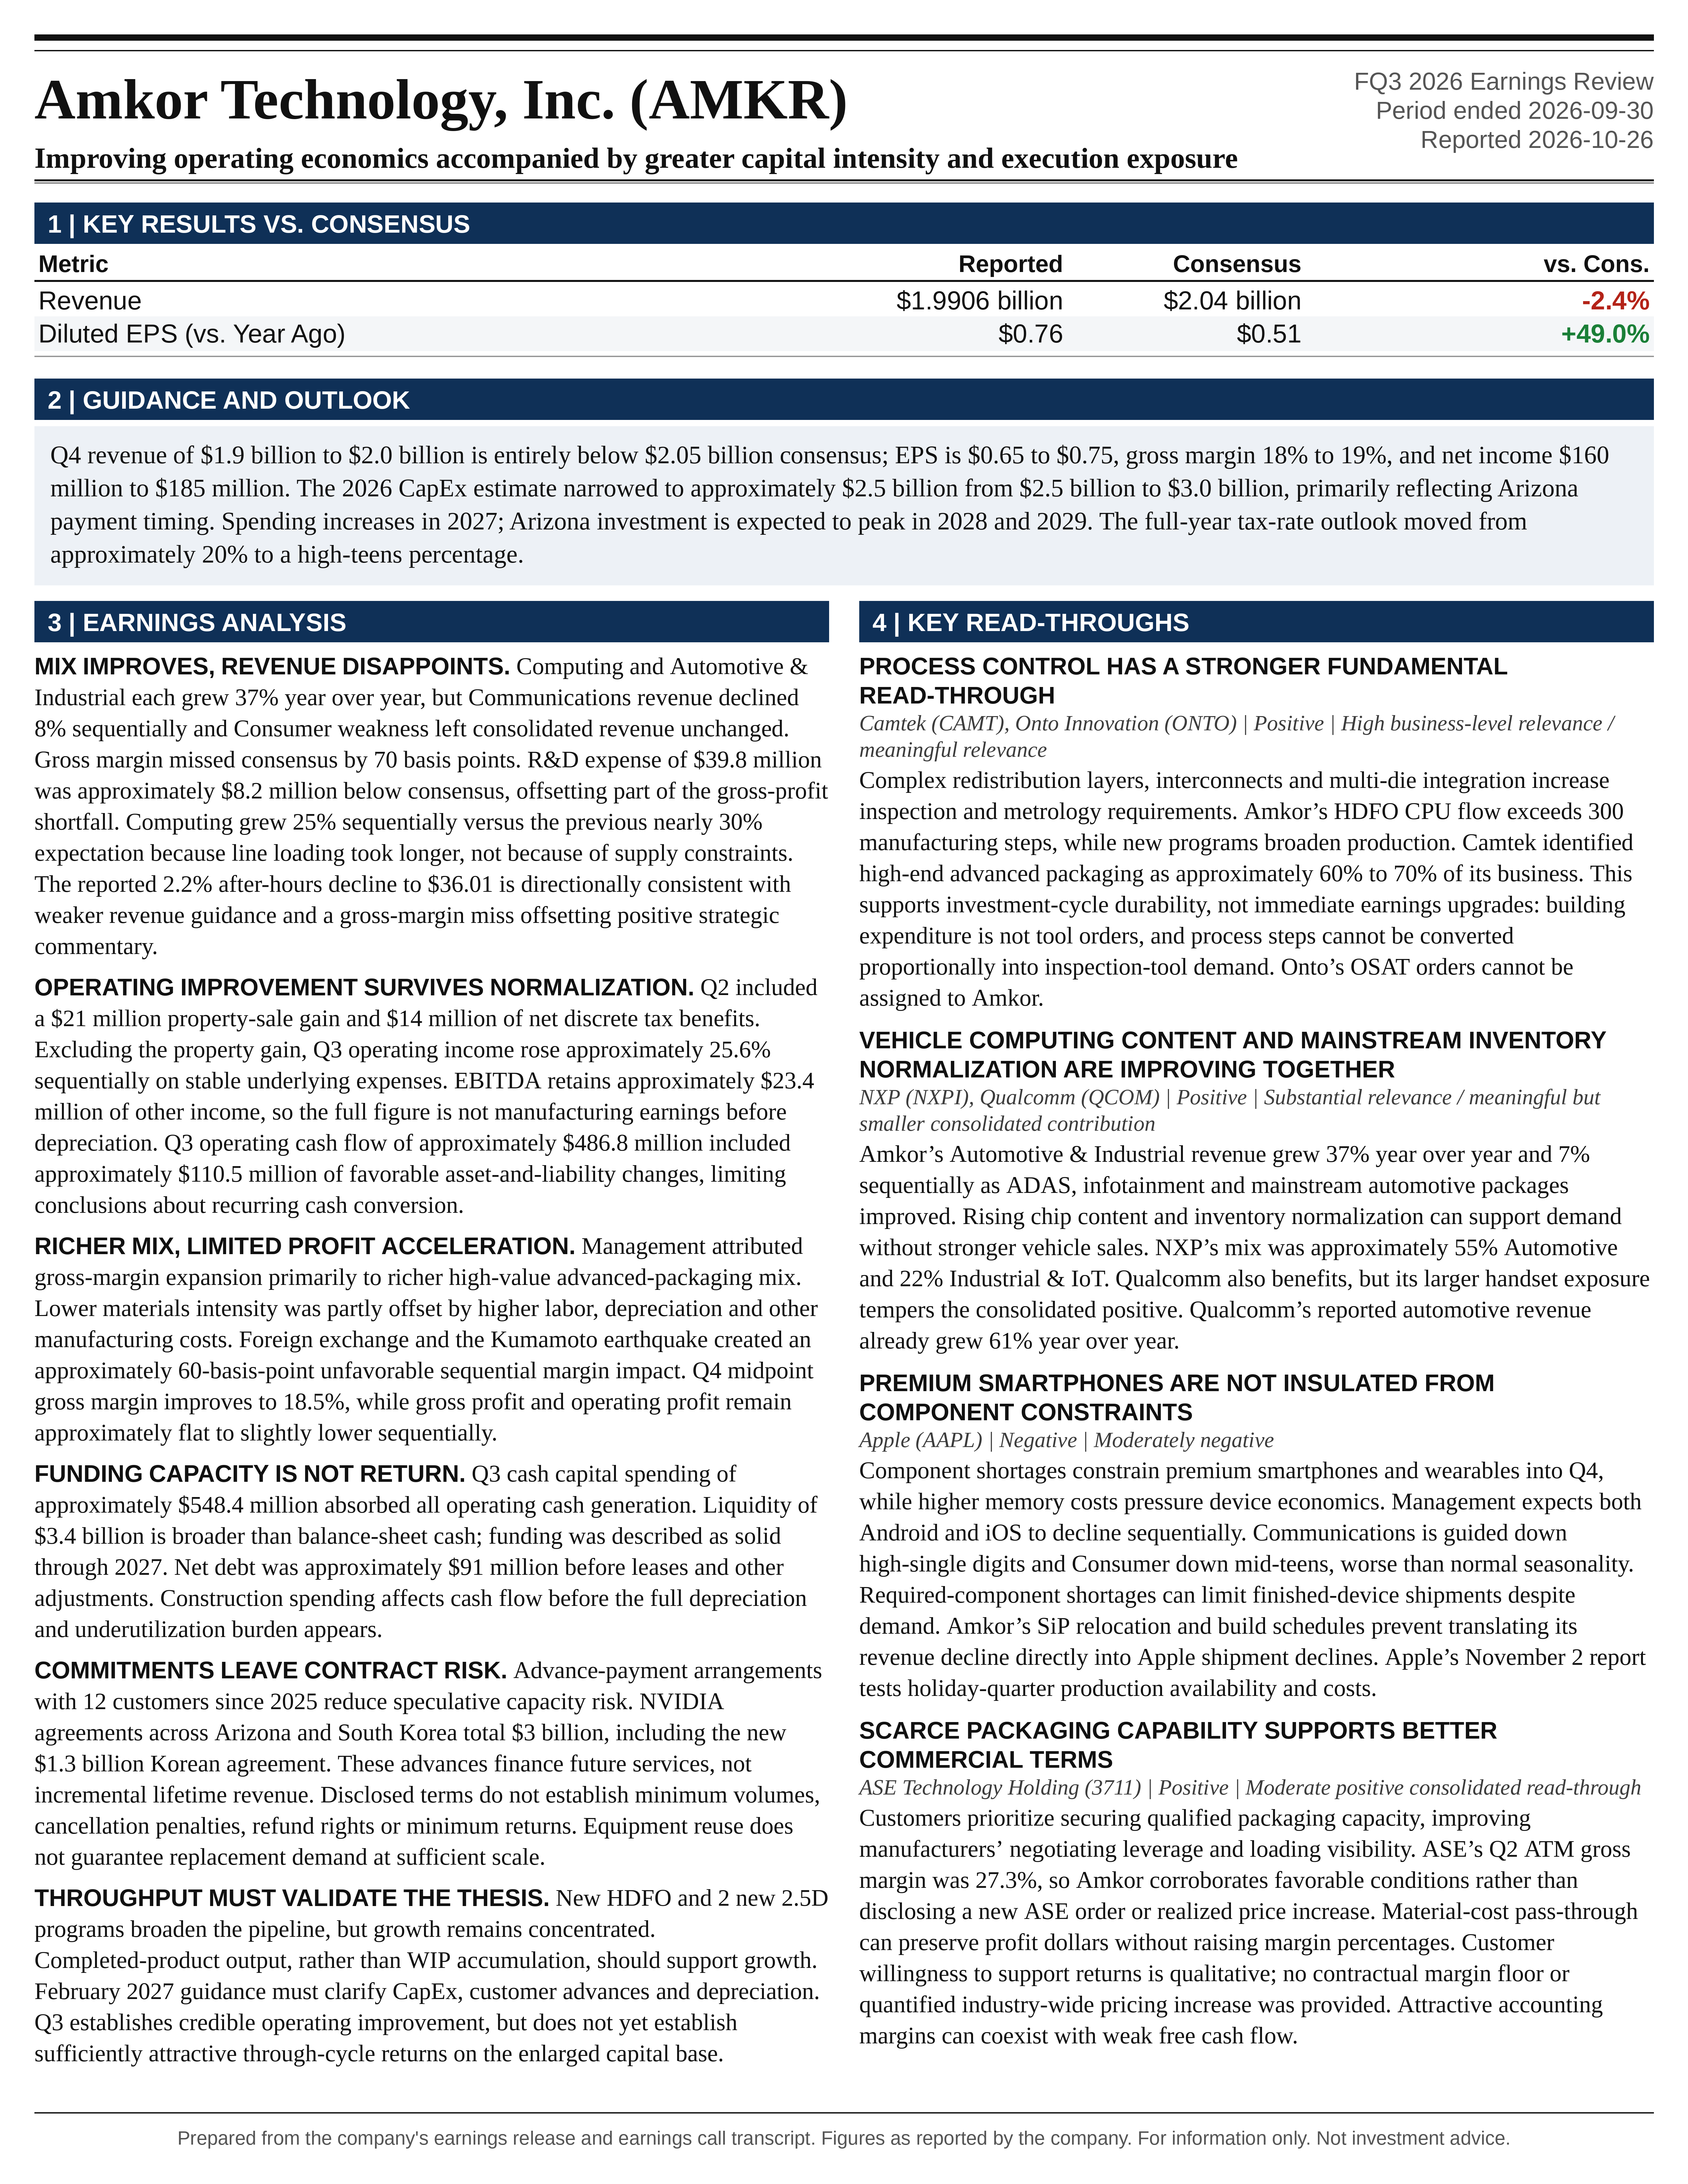
Amkor’s Q3 2026 earnings call supports a more favorable assessment of its operating mix and advanced-packaging opportunity, but not an unqualified upgrade to the equity investment case. Computing and Automotive & Industrial each grew 37% year over year, gross margin expanded 400 basis points, and operating income increased 41% despite essentially unchanged consolidated revenue. These results demonstrate that the business can generate materially more profit from a similar revenue base. However, revenue and gross margin missed consensus, Q4 revenue guidance fell below expectations, the flagship computing ramp progressed more slowly than previously anticipated, and the capital-investment cycle is now expected to remain elevated through 2029. The appropriate interpretation is improving operating economics accompanied by greater capital intensity and execution exposure. The call supports holding a controlled position rather than initiating a large allocation solely on the apparent earnings inflection.
The principal positive development is the combination of visible computing growth, stronger customer capacity commitments, and evidence that advanced packaging is becoming a more strategically important component of semiconductor production. Management expects Computing revenue to grow more than 30% in 2026 and at a similar or higher rate in 2027. Customer advance-payment arrangements have been executed with 12 customers since 2025, with additional agreements under discussion. These commitments improve funding visibility and reduce the risk of building entirely speculative capacity. They do not, however, establish the profitability, cancellation protection, or cash returns of the underlying investments.
The principal near-term negative is that computing strength is not yet sufficient to produce sustained consolidated revenue growth as Communications and Consumer weaken. Q3 revenue of $1.991 billion increased 4.9% sequentially but only 0.2% year over year and missed the Bloomberg consensus of $2.04 billion by 2.4%. Q4 revenue guidance of $1.9 billion to $2.0 billion implies a midpoint decline of 2.0% sequentially and a 4.9% shortfall against consensus. The midpoint gross margin improves to 18.5%, but gross profit and operating profit remain approximately flat to slightly lower sequentially. This is a favorable mix transition, not yet an across-the-board earnings acceleration.
The principal longer-term issue is the difference between funding capacity and earning an adequate return on that capacity. Approximately $2.5 billion of 2026 capital expenditure represents about 33% of mechanically implied full-year revenue. Spending increases again in 2027, while Arizona investment is expected to peak in 2028 and 2029. Construction spending initially affects cash flow and invested capital more than the income statement, with depreciation and underutilization costs becoming more significant as facilities enter service. Consequently, stronger 2027 earnings would not by themselves establish sustainable earnings power after the full manufacturing footprint becomes operational.
REPORTED PERFORMANCE, CONSENSUS, AND PRIOR GUIDANCE
The October 26 earnings release reports Q3 revenue of $1.9906 billion, gross profit of $363.5 million, operating income of $224.7 million, net income attributable to Amkor of $190.6 million, and diluted EPS of $0.76. Revenue increased from $1.8980 billion in Q2 and $1.9870 billion in Q3 2025. Gross profit increased 14.1% sequentially and 27.8% year over year. Operating income increased 12.4% sequentially and 41.4% year over year. Net income increased 50.6% year over year, while diluted EPS increased 49.0% from $0.51. Profit growth substantially exceeded revenue growth, providing direct evidence of improved revenue quality and manufacturing economics.
The comparison with Amkor’s own July 27 guidance is less negative than the comparison with consensus. Management previously guided Q3 revenue to $1.95 billion to $2.05 billion, making actual revenue only 0.5% below the $2.0 billion midpoint and comfortably within the range. EPS of $0.76 was within the previous $0.72 to $0.82 range and $0.01 below its midpoint. Net income of $190.6 million was close to the previous $192.5 million midpoint. The significant miss against management’s guidance was gross margin: 18.3% compared with a range of 18.5% to 19.5%. Actual gross margin was 20 basis points below the bottom of that range and 70 basis points below its midpoint.
Against the Bloomberg notice, revenue missed consensus by approximately $49 million, gross margin missed by 70 basis points, and EBITDA of approximately $435 million was 1.1% below the $439.7 million estimate. Applying consensus gross margin of 19% to consensus revenue of $2.04 billion implies expected gross profit of approximately $387.6 million, about $24.1 million above actual gross profit. This is a more material operating shortfall than the relatively small EBITDA miss might suggest. R&D expense of $39.8 million was approximately $8.2 million below consensus, offsetting part of the gross-profit shortfall. A complete consensus operating-expense and nonoperating-income bridge is unavailable, so the remaining offset cannot be assigned precisely.
The Bloomberg notice does not provide a comparable Q3 EPS consensus or Q4 EPS consensus. Accordingly, the reported EPS cannot be classified as a consensus beat or miss from that notice alone. Similarly, the notice labels the $435 million figure adjusted EBITDA, whereas Amkor’s earnings release identifies it as EBITDA and provides its own reconciliation. The company-defined measure should govern interpretation.
The reported 2.2% after-hours decline to $36.01 is directionally consistent with weaker revenue guidance and a gross-margin miss offsetting positive strategic commentary. That price is an event-time snapshot from the Bloomberg notice, not a subsequently verified trading price. The limited after-hours volume also constrains conclusions about the durability of the immediate market reaction.
UNDERLYING EARNINGS QUALITY AND COMPARABILITY
The sequential operating improvement is stronger than the unadjusted figures initially indicate. Q2 operating expenses included a $21 million gain on the sale of real estate, as disclosed on the July call. Removing that benefit for analytical comparability reduces Q2 operating income from approximately $199.9 million to $178.9 million and operating margin from 10.5% to approximately 9.4%. Against that adjusted baseline, Q3 operating income increased approximately 25.6%, and operating margin improved by approximately 190 basis points. This adjustment is an analytical normalization, not a company-reported alternative earnings measure.
The same distinction explains the apparent sequential increase in operating expenses. Reported operating expenses rose from $118.7 million in Q2 to $138.8 million in Q3. Adding back the Q2 real-estate gain produces an underlying Q2 expense base of approximately $139.7 million, indicating that expenses were essentially stable rather than increasing sharply. Operating leverage therefore reflects higher gross profit flowing through a relatively stable underlying expense structure.
Taxes also complicate sequential EPS comparisons. Q2 benefited from $14 million of net discrete tax benefits and had an effective tax rate of approximately 14%. Q3’s effective tax rate was approximately 17.1%. The increase in reported EPS from $0.70 to $0.76 therefore occurred despite the absence of an equivalent disclosed Q2 tax benefit and despite the prior quarter’s real-estate gain. This strengthens the interpretation that operating earnings improved, although the precise normalized EPS comparison requires the tax treatment of the property gain and any additional discrete items.
Amkor’s EBITDA definition also warrants attention. The company starts with net income and adds interest expense, income tax expense, and depreciation and amortization. This leaves other nonoperating income within EBITDA. Q3 operating income of $224.7 million plus depreciation and amortization of $186.6 million equals approximately $411.3 million, compared with reported EBITDA of approximately $434.6 million. The difference is approximately $23.4 million of other income. Thus, the full EBITDA figure should not be treated as manufacturing earnings before depreciation, nor should it be compared indiscriminately with peer measures that exclude comparable nonoperating income.
GROSS MARGIN: STRUCTURAL MIX BENEFITS WITH IMPORTANT LIMITATIONS
Gross margin increased from 16.8% in Q2 to 18.3% in Q3 and from 14.3% in the prior-year quarter. Management attributed the improvement primarily to higher-value Computing and Automotive revenue. Faust stated, “Gross margin expansion is primarily driven by a richer mix of high-value advanced packaging.” The improvement is consistent with the disclosed cost structure, but it should not be interpreted simply as evidence of lower material prices or a broad increase in pricing across all products.
Materials declined from 57.5% of revenue in Q3 2025 to 50.7% in Q3 2026, a 680-basis-point improvement. Over the same period, labor increased from 9.2% to 10.1% of revenue, manufacturing depreciation increased from 7.5% to 8.6%, and other manufacturing costs increased from 11.5% to 12.3%. These combined increases offset 280 basis points of the materials improvement, leaving the reported 400-basis-point gross-margin expansion. The economics are therefore consistent with a shift away from material-intensive revenue toward a higher-value manufacturing mix, rather than uniform cost improvement across the factory network.
The formal product classifications reinforce this distinction. Revenue classified as Advanced products declined from $1.684 billion to $1.632 billion year over year, while Mainstream products increased from $303 million to $359 million. Advanced products therefore declined approximately 3.1%, while Mainstream products grew approximately 18.5%. This does not contradict strong HDFO and 2.5D growth. Amkor’s broad Advanced category includes flip chip, memory, wafer-level processing, and related testing, and is not synonymous with AI packaging. The investment thesis depends on improvement within the product mix, not simply on growth in the reported Advanced category.
Foreign exchange and the July earthquake at the Kumamoto facility created an approximately 60-basis-point unfavorable sequential gross-margin impact. At Q3 revenue, that corresponds to approximately $11.9 million of gross profit. Mechanically adding back 60 basis points produces a margin near 18.9%, close to the previous 19% guidance midpoint. However, this is only a sensitivity calculation. The disclosure describes a sequential headwind, does not allocate the amount precisely between foreign exchange and the earthquake, and does not establish that the entire amount is recoverable.
The Japanese facility returned to full operations during Q3, reducing the likelihood of a continuing major earthquake-related production drag. Foreign exchange remains unfavorable in the Q4 outlook. Consequently, the 18.5% midpoint Q4 gross margin is not a clean post-disruption margin that can automatically be extrapolated into 2027.
COMPUTING: STRONG DEMAND, BUT THE RAMP STILL REQUIRES EXECUTION
Computing revenue increased 25% sequentially and 37% year over year, reaching a record for the 2nd consecutive quarter. Its share of consolidated revenue increased to 26%, compared with 22% in Q2 and 19% in Q3 2025. Applying the rounded disclosed mix to total revenue implies approximately $518 million of Q3 Computing revenue. These dollar estimates are approximate because the published end-market percentages are rounded.
The result was below the previous expectation of nearly 30% sequential growth. The difference is roughly 5 percentage points of growth, or approximately 4% of the previously implied Computing revenue level. Using the rounded Q2 revenue mix, the shortfall is on the order of $20 million. This is not large enough to invalidate the growth thesis, but it is meaningful because the flagship CPU program is central to the margin and earnings outlook.
Engel explicitly rejected a supply-availability explanation: “I wouldn't say anything related to supply constraints.” Instead, the process required more time to establish the intended work-in-process loading across a manufacturing flow with more than 300 steps. He explained that “it took a little bit longer to really load the line to the level we wanted to.”
This distinction matters operationally. A long manufacturing flow can experience a slower revenue ramp even when end demand, equipment availability, and nominal capacity are adequate. Balanced loading across process stages, cycle-time stability, yield, and completed-product throughput determine how quickly installed equipment translates into revenue. Management did not disclose a material yield problem, but the explanation also does not eliminate process-execution risk. Increasing WIP without proportional improvement in completed output would consume working capital and delay returns on installed assets.
The program pipeline is broadening. An additional hyperscaler HDFO CPU program began ramping in Q3, while 2 new 2.5D programs in networking and data centers are expected to come online in Q4. Other engagements include XPU and switching applications. Nevertheless, management acknowledged that the core programs are scaling substantially faster than the newer opportunities. Program breadth is improving, but near-term revenue growth remains concentrated in a relatively limited number of major ramps.
The flagship CPU customer was not identified in the call. It should not automatically be equated with NVIDIA merely because NVIDIA was discussed extensively elsewhere. Similarly, the presence of multiple HDFO and 2.5D engagements does not establish equal economic significance, equal production maturity, or comparable margins across those programs.
The Q4 outlook calls for low-double-digit sequential Computing growth and more than 50% year-over-year growth. For 2026 as a whole, management expects more than 30% growth. For 2027, Engel stated, “We would expect a similar growth rate to even higher-growth rate into 2027.” The relevant annual baseline is the approximately 30% or greater full-year growth expectation, not the more than 50% Q4 year-over-year growth rate. Extrapolating the Q4 comparison into a 50% full-year 2027 forecast would overstate management’s guidance.
Fan-out bridge remains a later opportunity, with timing described as late 2027 into 2028. The prior call had characterized it broadly as a 2028 opportunity. The current description is consistent with development progressing toward that window, but does not establish a material acceleration in recognized revenue. For investment purposes, the immediate earnings drivers remain the existing HDFO CPU ramp, the newer hyperscaler CPU program, and the forthcoming 2.5D production ramps.
AUTOMOTIVE AND INDUSTRIAL: A DISTINCT AND MATERIAL SOURCE OF STRENGTH
Automotive & Industrial revenue increased 7% sequentially and 37% year over year, also reaching a record for the 2nd consecutive quarter. Sequential growth exceeded the prior expectation of mid-single-digit growth. The end market represented 22% of Q3 revenue, compared with 16% in Q3 2025, implying approximately $438 million of current-quarter revenue using the rounded mix disclosure.
Management described strength across advanced automotive computing, mainstream automotive packages, and industrial applications. These are economically different drivers. ADAS and infotainment growth reflect increasing semiconductor content and packaging complexity per vehicle. The recovery in mainstream automotive packages reflects a more cyclical improvement in customer inventories and production demand. Industrial strength adds another source of recovery beyond automotive content growth.
The coexistence of these drivers is positive because the growth is not entirely dependent on higher vehicle unit production. Advanced semiconductor content can grow even in a modest vehicle market, while improving mainstream utilization can support absorption of existing factory costs. Nevertheless, the call provides no split between automotive and industrial revenue, no quantified customer inventory data, and no evidence sufficient to characterize the entire automotive semiconductor industry as having completed its inventory correction.
Q4 Automotive & Industrial revenue is expected to increase low-single digits sequentially. That implies continued strength but a slower sequential growth rate than Q3. The appropriate forecast treatment is sustained positive contribution, not indefinite extrapolation of the current 37% year-over-year growth rate.
COMMUNICATIONS AND CONSUMER: MORE THAN A TEMPORARY SEASONAL DISLOCATION
Communications revenue declined 8% sequentially, broadly matching the previous high-single-digit decline forecast. The principal factors remained the SiP migration to Vietnam, memory supply constraints, and changes in customer build patterns. Additional component shortages affecting premium smartphones and wearable devices created further pressure during Q3.
Communications represented 37% of revenue, down from 51% a year earlier. Using the rounded mix disclosures, revenue declined from approximately $1.01 billion to approximately $737 million, or about 27%. Computing and Automotive & Industrial together contributed approximately $260 million of year-over-year revenue growth, while Communications declined by approximately $277 million. This arithmetic explains why record performance in the growth businesses coexisted with essentially flat consolidated revenue.
The Q4 outlook calls for another high-single-digit sequential Communications decline. Importantly, weakness is not confined to lower-priced Android devices. Faust stated, “we do see Android being down in Q4 compared to Q3. And we also see iOS down.” The exposure therefore spans both major smartphone ecosystems, although the mechanisms differ across product tiers and customers.
The call distinguishes between memory affordability and physical component availability. Lower-priced phones have greater difficulty absorbing higher memory costs, creating a demand and bill-of-materials pressure. Premium smartphones and wearables also face component shortages, which can constrain production independently of underlying demand. The transcript does not quantify either effect, making it inappropriate to translate Amkor’s revenue decline directly into a forecast for smartphone sell-through.
The SiP relocation should also not be treated as a completed Q3 event. On the July call, management had already indicated that a particular application’s transfer-related headwind could extend through Q4 and into H1 2027. The current call’s positive comments about a future SiP rebound do not explicitly withdraw that earlier timing assessment. A complete near-term recovery should therefore not be embedded without additional evidence.
Consumer revenue increased 10% sequentially, below the previous mid-teens growth expectation. Q4 revenue is expected to decline by a mid-teens percentage, worse than normal seasonality, with component constraints continuing. The combination of Consumer underperformance against its prior growth outlook and continued Communications weakness means that the revenue disappointment cannot be attributed exclusively to the CPU program’s manufacturing ramp.
Management’s discussion of changed smartphone launch schedules is relevant to quarterly modeling but remains qualitative. A different launch cadence could reduce the historical concentration of production in H2 and support better H1 loading. It could also shift revenue between quarters without increasing annual demand. Engel did not identify a substantial packaging-content uplift from new form factors. A structural content-growth assumption based solely on those form factors is therefore unsupported.
Q4 GUIDANCE AND WHAT HAS CHANGED
Q4 revenue guidance of $1.9 billion to $2.0 billion is entirely below the Bloomberg consensus of $2.05 billion. The midpoint is approximately $100 million below consensus, while even the high end is approximately 2.4% below expectations. This is a clear near-term revenue reset, although it is not a cut to an earlier formal Q4 revenue range because no comparable prior range was provided.
Gross-margin guidance of 18% to 19% has a midpoint 20 basis points above Q3 but 50 basis points below the Bloomberg consensus. At midpoint revenue and margin, gross profit is approximately $360.8 million, slightly below Q3’s $363.5 million. Subtracting approximately $140 million of guided operating expenses produces operating income of approximately $220.8 million and an operating margin of approximately 11.3%. The operating margin is effectively unchanged from Q3 despite the modest improvement in gross margin.
This distinction is central to the earnings interpretation. A favorable mix can increase percentage margins while lower revenue prevents growth in absolute profit. The Q4 outlook therefore demonstrates resilience, not a new step-change in quarterly operating earnings.
Net-income guidance of $160 million to $185 million implies a midpoint decline of approximately 9.5% sequentially. EPS guidance of $0.65 to $0.75 implies a midpoint decline of approximately 7.9%. Those declines are greater than the mechanically implied operating-income decline. Taxes, nonoperating income, and share-count assumptions therefore matter. The call does not provide enough detail to reconcile the entire difference, and it should not automatically be attributed to weaker factory performance.
The full-year effective-tax-rate outlook moved from approximately 20% on the July call to a high-teens percentage, reflecting year-to-date discrete benefits. This is favorable to reported annual EPS but should not be treated as a permanent reduction in the underlying tax burden. It is also full-year guidance, not a statement that the Q4 tax rate itself will be in the high teens. With the 9-month effective rate approximately 15.1%, a higher Q4 rate could be consistent with the full-year outlook.
Combining reported 9-month results with Q4 guidance mechanically implies 2026 revenue of approximately $7.47 billion to $7.57 billion and annual EPS of approximately $2.44 to $2.54. The midpoint calculations are approximately $7.52 billion and $2.49. The EPS sum is approximate because annual weighted-average shares and quarterly rounding can differ. These are derived full-year outcomes, not separately issued company guidance.
PRICING POWER AND THE ECONOMICS OF CUSTOMER COMMITMENTS
Management’s commentary indicates an improvement in the negotiating environment for advanced packaging. Customers are engaging earlier in architecture, manufacturing, testing, and capacity planning. This increases the importance of execution capability and makes packaging less interchangeable than a purely transactional manufacturing service.
Engel’s strongest pricing statement was that “the margin profile and the return is not a major issue. They are more focused on making sure they secure the capacity.” That suggests customers are willing to support investment economics when access to packaging capacity threatens their product roadmaps. It does not, by itself, quantify a margin floor, a return guarantee, or the durability of current pricing once industry capacity expands.
Cost pass-through and economic pricing power also need to be separated. Management indicated that higher substrate and material costs are generally being passed to customers. Such recovery protects gross-profit dollars but does not necessarily improve gross-margin percentage. A more valuable pricing outcome would involve compensation for scarce process capability, engineering complexity, reliability, or capacity reservation beyond reimbursement of input inflation. The call suggests that this environment exists in advanced computing packages, but provides no realized pricing data to measure it.
For SiP, management was more restrained, emphasizing cost recovery rather than margin acceleration. A recovery in SiP could therefore increase revenue and gross-profit dollars while diluting the consolidated gross-margin percentage relative to a computing-heavy mix. That would not necessarily be economically negative. Margin percentage alone is an incomplete measure when revenue streams differ substantially in purchased material content and capital requirements.
The company’s turnkey packaging-and-test model creates potential opportunities to capture more value per program. Testing represented 12% of Q3 revenue, compared with 11% a year earlier. However, that modest mix change is not sufficient to quantify incremental test attach rates, standalone test profitability, or the return on new test capacity.
NVIDIA FUNDING, CUSTOMER CONCENTRATION, AND CONTRACT LIMITATIONS
The October 21 company announcement establishes a new $1.3 billion NVIDIA agreement supporting South Korean capacity and states that NVIDIA agreements across Arizona and South Korea total $3 billion. This distinction is important: $3 billion refers to the NVIDIA arrangements, not necessarily the total value of advance-payment commitments across all 12 customers.
The previously discussed July NVIDIA arrangement involved a $1.5 billion prepayment expected in 2027, to be credited back as U.S. services are provided over an expected 5-year to 10-year period. The October announcement’s $3 billion aggregate is not fully reconciled by simply adding that earlier $1.5 billion to the newly announced $1.3 billion. The disclosed aggregate should be retained without inventing the treatment of the approximately $200 million difference.
Customer advances are a source of financing, not incremental lifetime revenue on top of the future services they fund. When an advance is applied against packaging and testing deliveries, future cash collections are correspondingly reduced. The investment model must recognize the cash benefit when received and the later settlement mechanism without counting the same economic value twice.
Similarly, the NVIDIA total cannot simply be subtracted from the $12 billion Arizona campus investment. The agreements span Arizona and South Korea, and the allocation, timing, and contractual restrictions are not fully disclosed. The fact that funding is available does not establish that all funding is interchangeable among facilities.
Engel also acknowledged the limits of diversification through equipment reuse: “the scale that we're working with this customer is hard to offset.” Equipment may be technically usable across HDFO, 2.5D, and wafer-bumping applications, but replacement demand of sufficient scale may not be immediately available. Qualification, process conversion, customer approval, utilization during transition, and package-specific tooling can create costs even when core equipment is reusable.
Top-10 customer revenue concentration declined from 73% to 66% year over year, an encouraging measure of current revenue diversification. Nevertheless, future capital commitments may become concentrated around a smaller set of large AI programs. A reduction in historical revenue concentration does not necessarily imply lower forward investment concentration.
The disclosed advance agreements do not establish enforceable minimum volumes, cancellation penalties, refund rights, minimum returns, or protection against changes in product architecture. These are the contract terms most relevant to determining whether customer funding merely improves liquidity or also transfers a meaningful portion of demand risk away from Amkor.
GEOGRAPHIC EXPANSION AND THE TIMING OF EARNINGS CONTRIBUTIONS
South Korea is the primary near-term growth platform. SiP transfers to Vietnam release existing Korean cleanroom space that can be repurposed for advanced packaging. The Songdo assembly-and-test building is expected to be completed by the end of 2026. The 2 new Gwangju buildings are expected to complete construction in late 2027, supporting additional growth into 2028. Across these projects, the Korean footprint is expected to increase by approximately 40% from 2025 through 2028.
A 40% increase in footprint should not be converted mechanically into a 40% increase in output or revenue. The economic result depends on equipment density, package mix, process complexity, utilization, yield, and qualification timing. Cleanroom completion is a prerequisite for production, not the same event as revenue recognition.
Vietnam is both a manufacturing expansion and an internal capacity-release mechanism. Moving SiP to Vietnam can improve scale and automation there while making scarce Korean space available for higher-value programs. This is strategically attractive, but it introduces transfer costs, qualification requirements, and temporary disruption. Its value should be assessed through combined network economics rather than the profitability of either location in isolation.
Arizona is a later earnings contributor. Phase 1 construction remains scheduled for completion at the end of 2027. The NVIDIA-related ramp discussed on the call was characterized as a late-2028 opportunity. Phase 2 is expected to break ground in late 2027. The planned campus represents approximately $12 billion of investment, more than 90,000 square meters of cleanroom space, and more than 3,500 employees at full ramp.
The draft transcript contains an isolated statement suggesting Arizona completion “late this year.” That conflicts with the CFO’s repeated end-2027 schedule and should not be interpreted as an acceleration. Likewise, the isolated reference to a Korean budget beginning at $400 billion conflicts with the CEO’s clear $400 million to $450 million range. The internally consistent figures are the appropriate basis for analysis.
Management expects higher Arizona building depreciation and labor costs, to be offset through automation, high utilization, a narrower production mix, and preferential customer loading. The intended model would load Arizona consistently and use Asia to accommodate more variable demand. This may protect Arizona economics, but it redistributes some utilization variability to the Asian network. It does not eliminate consolidated cyclicality.
CAPITAL EXPENDITURE: A LONGER AND MORE DEMANDING INVESTMENT CYCLE
The 2026 capital-expenditure estimate was narrowed to approximately $2.5 billion from the previous $2.5 billion to $3.0 billion range. That is a reduction of approximately $250 million, or 9.1%, from the previous midpoint. Management attributed the change primarily to the timing of Arizona construction payments. It should therefore be interpreted mainly as a timing shift, not evidence that the total investment required to execute the strategy has declined.
For 2027, Arizona spending could reach up to 15% of the $12 billion campus program, or approximately $1.8 billion. Adding $400 million to $450 million of Korean construction and approximately $50 million in Vietnam produces an illustrative facility-spending total of approximately $2.25 billion to $2.30 billion if Arizona reaches that indicated level. This is not a formal consolidated CapEx forecast or a minimum commitment. It also excludes additional equipment investment and other spending categories.
The distinction between facilities and equipment is important. Buildings enable later production, but do not themselves generate the projected revenue. Equipment purchases, qualification spending, working capital, and ramp costs must follow. A large facility budget therefore signals substantial future manufacturing opportunity while also implying additional capital requirements beyond the construction phase.
Management expects the Arizona investment profile to peak in 2028 and 2029 because Phase 2 construction will overlap with Phase 1 equipment installation. The market should not assume that the 2027 step-up is the final peak or that capital intensity quickly returns to historical low-to-mid-teens percentages. Management explicitly declined to provide a normalized long-term CapEx ratio.
The income-statement timing creates another risk. Construction spending is capitalized while facilities are being built. Depreciation generally becomes relevant when assets are ready for their intended use, with the effect increasing as equipment and buildings enter service. Consequently, 2027 can show attractive revenue growth and mix-driven margins while not yet reflecting the full cost burden of the expanded footprint. The prior call also identified underutilized Arizona manufacturing as a potential gross- and operating-margin headwind in 2028.
CASH FLOW AND BALANCE-SHEET CAPACITY
The earnings releases provide a more complete cash-flow picture than the call’s EBITDA discussion. For the first 9 months of 2026, operating cash flow was $868.3 million, while cash payments for property, plant, and equipment were $1.2368 billion. Operating cash flow less those payments was negative $368.5 million, before dividends and excluding asset-sale proceeds and other investing items. This analytical cash-flow measure compares with negative $21.4 million in the corresponding 2025 period.
The standalone Q3 result was better than the cumulative comparison. Subtracting the June year-to-date figures from the September figures yields Q3 operating cash flow of approximately $486.8 million and cash capital spending of approximately $548.4 million. The resulting deficit was approximately $61.6 million, compared with approximately $77.9 million in Q3 2025. Operating cash generation improved substantially, but capital spending absorbed all of it.
Q3 also benefited from approximately $110.5 million of favorable changes in assets and liabilities, compared with an outflow during H1. The release does not disaggregate that aggregate sufficiently to determine how much reflects ordinary working-capital movement versus customer advances or other liability changes. The entire Q3 cash-flow improvement should therefore not be characterized as recurring cash conversion independent of customer funding.
At September 30, cash and short-term investments totaled approximately $2.376 billion, against approximately $2.467 billion of debt, implying net debt of approximately $91 million before leases and other adjustments. This is a modest net-debt position, but it compares with slight net cash at June 30. Total liquidity of $3.4 billion is broader than cash on the balance sheet and should not be treated as an additional cash balance.
The financing history also matters. Amkor raised $1.15 billion through convertible notes in May. The 0% coupon reduces current cash interest, but does not eliminate financing costs, repayment obligations, or potential dilution. The cash-flow statement records approximately $56.4 million of capped-call payments and approximately $21.3 million of year-to-date debt issuance costs. The current liquidity position therefore reflects financing already obtained, not simply internally generated cash.
Faust’s clearest funding statement was that “the balance sheet positioning is solid through 2027.” She was more qualified about 2028 and beyond. That supports confidence in near-term execution funding, but not a conclusion that the entire expansion can be completed without additional borrowing. The timing of customer advances relative to construction and equipment payments remains critical.
VALUATION, SCENARIOS, AND INVESTMENT IMPLICATIONS
At the Bloomberg notice’s $36.01 reference price, mechanically implied 2026 EPS of approximately $2.49 produces a P/E of approximately 14.5x. Annualizing the $0.70 Q4 EPS midpoint produces a lower multiple of approximately 12.9x, but that annualization is not a 2027 forecast. It does not capture seasonality, changing tax benefits, or the timing of new depreciation.
A rough enterprise value using the current diluted share count and September net debt is approximately $9.1 billion, or approximately 5.2x annualized Q3 EBITDA. That apparently inexpensive multiple requires caution. Reported EBITDA includes nonoperating income, gross capital expenditure substantially exceeds annualized depreciation, and major facilities have not yet entered their full depreciation and utilization cycle. A low EBITDA multiple can coexist with an unattractive equity cash-flow yield during a prolonged investment program.
An illustrative 2027 base case, assigned a 50% probability, assumes approximately $8.35 billion of revenue, 19% gross margin, $590 million of operating expenses, no net nonoperating contribution, a 20% tax rate, and 250 million diluted shares. These assumptions produce EPS of approximately $3.19. This case requires continued Computing growth around management’s indicated trajectory, further automotive support, and stabilization rather than a major recovery in Communications. It does not assume a meaningful Arizona production contribution.
An illustrative bull case, assigned a 25% probability, assumes $9.0 billion of revenue, 20.5% gross margin, $600 million of operating expenses, the same tax and share assumptions, and no net nonoperating contribution. EPS would be approximately $3.98. This outcome requires better-than-base computing throughput, strong conversion of new programs, favorable advanced-packaging pricing, and a more meaningful SiP and communications recovery.
An illustrative bear case, assigned a 25% probability, assumes $7.5 billion of revenue, 17% gross margin, $600 million of operating expenses, and the same tax and share assumptions. EPS would be approximately $2.16. This case could arise from slower computing ramps, persistent smartphone weakness, weaker utilization, or costs rising faster than mix improvement. It does not require the long-term advanced-packaging opportunity to disappear.
These are analytical scenarios rather than company guidance or consensus estimates. Their probability-weighted EPS is approximately $3.13, but that figure is not sufficient to establish fair value. The appropriate multiple depends on whether incremental earnings are accompanied by acceptable returns on invested capital and eventual cash generation. At approximately $8 billion of annual revenue, a 100-basis-point gross-margin change is worth approximately $80 million of operating income and roughly $0.26 per share after a 20% tax rate. Relatively modest margin differences can therefore materially alter the valuation outcome.
A high-conviction price target is constrained by undisclosed contract economics, the absence of a complete 2027 capital budget, and uncertainty over the 2028-2029 depreciation and utilization burden. The call supports a hold assessment with controlled exposure rather than treating the current earnings multiple as sufficient evidence of undervaluation. For a new investment, the February 2027 guidance update is a more useful underwriting milestone than the headline customer-prepayment total.
For an existing tactical position, an illustrative ceiling of 0.5% of portfolio NAV would limit exposure while the capital-return case remains incomplete. A 15% price-based risk threshold from the $36.01 event reference is approximately $30.60, corresponding to approximately 0.075% of NAV at that position size before gaps, slippage, or hedging effects. This is an illustrative risk discipline, not a statement about any existing portfolio. A reassessment or exit should also be triggered by repeated computing-ramp slippage, a material retreat from the approximately 30% annual Computing growth trajectory, or evidence that customer commitments provide materially less downside protection than expected.
Portfolio diversification should not be assumed from the declining smartphone mix. Amkor is becoming more exposed to AI infrastructure spending, advanced-packaging capacity investment, and large-customer product schedules. For a portfolio already concentrated in AI accelerators, foundries, semiconductor equipment, or data-center infrastructure, Amkor may add exposure to the same underlying spending cycle rather than provide meaningful diversification. Actual portfolio correlation and concentration cannot be quantified without the holdings.
CATALYSTS AND THESIS VALIDATION
The nearest operating catalysts are Q4 evidence that the flagship HDFO line is achieving the intended throughput, successful production starts for the new 2.5D programs, and continued growth in the additional hyperscaler CPU program. Computing growth should increasingly be supported by completed-product output rather than simply installed capacity, customer engagement, or WIP accumulation.
The February 2027 earnings call is the central financial catalyst. Formal CapEx guidance should clarify the split among construction, equipment, and other uses; the timing and amount of customer advances; and whether operating cash flow plus committed funding adequately covers the investment schedule. A fuller depreciation outlook is also needed to distinguish sustainable margin improvement from favorable timing before new facilities enter service.
During 2027, Songdo utilization and the pace of SiP migration will test whether the geographic reallocation is producing the expected combined benefits. Successful execution should allow Vietnam to recover revenue while Korea expands higher-value production. Prolonged disruption, weak SiP recovery, or underutilized new capacity would weaken the premise that the network transition creates value beyond simply changing the revenue mix.
The decisive longer-term test is whether Arizona can approach management’s intended economics despite higher labor and building costs. Construction completion, equipment installation, customer qualification, and commercial loading are separate milestones. Revenue growth or customer funding at an earlier milestone should not be treated as proof of satisfactory returns at the final milestone.
Overall, Q3 establishes a credible improvement in Amkor’s operating earnings power and strategic relevance. It does not yet establish that the enlarged capital base will generate sufficiently attractive through-cycle returns. The next stage of the investment case depends less on additional announcements of capacity and more on verified throughput, contract protection, depreciation-adjusted profitability, and cash generation.
COMPANY EMPLOYEES ON THE CALL
• Jennifer Jue, Vice President, Investor Relations. • Kevin Engel, President and Chief Executive Officer. • Megan Faust, Executive Vice President and Chief Financial Officer.
RESEARCH ANALYSTS AND QUESTIONERS ON THE CALL
• Ruplu Bhattacharya, Analyst, BofA Global Research. • Joseph Moore, Analyst, Morgan Stanley. • Jackie, surname and title not disclosed, Melius Research, speaking on behalf of Ben Reitzes. The operator introduced Ben Reitzes, but Jackie asked the questions. • Randy Abrams, Analyst, UBS. • Steven Fox, Analyst, Fox Advisors. • Steve Barger, Analyst, KeyBanc Capital Markets. • Denis Pyatchanin, Analyst, Needham & Company.
Key Read-Throughs
KEY READ-THROUGHS FROM AMKOR TECHNOLOGY’S Q3 2026 EARNINGS CALL
Amkor’s results indicate an increasingly divided semiconductor cycle, rather than a broad-based recovery or an emerging AI slowdown. Advanced computing and automotive electronics are supporting higher-value manufacturing activity, while memory costs, component shortages, and changing production schedules are constraining smartphones and PCs. The most actionable negative signal is that these constraints now extend across both Android and iOS, including premium smartphones and wearables. The strongest positive signals concern advanced-packaging economics, inspection and metrology demand, and semiconductor content growth in vehicles. However, customer-funded capacity expansion should not be confused with immediate production availability, new equipment orders, or guaranteed investment returns. Several developments corroborate trends already disclosed by the affected companies; the incremental information lies principally in their persistence, geographic allocation, and conversion timing. Countries below identify corporate home markets rather than stock-exchange locations.
SMARTPHONES AND CONSUMER ELECTRONICS
PREMIUM SMARTPHONES ARE NOT INSULATED FROM THE COMPONENT CONSTRAINTS AFFECTING ANDROID (READ-THROUGH 1)
Affected company: Apple (AAPL: United States). Directional impact: moderately negative for near-term hardware production and revenue timing, with a smaller and less certain effect on consolidated earnings.
The critical commentary is broader than weakness in inexpensive Android devices. Amkor stated that “Component shortages affecting premium-tier smartphones and IoT wearable devices created an additional headwind” during Q3 and expects those conditions to persist in Q4. Asked to distinguish the ecosystems, CFO Megan Faust said, “we do see Android being down in Q4 compared to Q3. And we also see iOS down.” Communications revenue is expected to decline by a high-single-digit percentage sequentially, while Consumer revenue is expected to decline by a mid-teens percentage, worse than normal seasonality.
The transmission mechanism is constrained production of finished devices. A shortage of a required component can limit shipments of an otherwise complete smartphone or wearable, regardless of demand for the finished product. Higher memory costs create a separate pressure through the bill of materials. Apple can mitigate those costs through procurement, product mix, and pricing, but those responses do not make physical component shortages irrelevant. Simultaneous pressure in smartphones and wearables also reduces the likelihood that strength in adjacent hardware categories fully offsets constrained iPhone production.
The important distinction is between supply pressure and demand deterioration. Amkor’s revenue is also affected by its own SiP relocation, customer build schedules, and packaging content. Its Communications decline cannot be translated directly into an equivalent decline in Apple shipments. Apple’s previously reported June quarter was strong, including record June-quarter iPhone, Mac, and Services revenue. The high-conviction conclusion is therefore that premium hardware faces persistent supply and cost constraints, not that Apple has already experienced an equivalent deterioration in consumer demand.
The near-term catalyst is Apple’s November 2 earnings report, particularly December-quarter production availability, component costs, and hardware guidance. The trading implication is greater downside sensitivity to an outlook that assumes uncomplicated holiday-quarter fulfillment. Over a longer horizon, altered launch schedules could redistribute manufacturing activity between H1 and H2 without changing annual demand. Amkor explicitly declined to identify a substantial packaging-content benefit from new form factors, weakening any argument that those form factors automatically offset production constraints across the supply chain.
ANDROID CHIP SUPPLIERS FACE A PERSISTENT UNIT-ECONOMICS SQUEEZE, NOT SIMPLY TEMPORARY PACKAGING DISRUPTION (READ-THROUGH 2)
Affected companies: MediaTek (2454: Taiwan) and Qualcomm (QCOM: United States). Directional impact: negative for handset revenue and near-term earnings estimates; moderate potential consolidated impact, partly offset by non-handset businesses.
Amkor identified memory pricing and availability as constraints on both smartphones and PCs. CEO Kevin Engel stated that “the low-tier type phones had a harder time absorbing those cost changes than the premium tier” and added, “I think that will continue.” The expectation of another sequential Communications decline in Q4 indicates that the pressure is persisting beyond the initial disruption.
For smartphone chip suppliers, the mechanism operates through handset manufacturers’ production decisions. Higher memory costs increase the cost of a complete device. Manufacturers must absorb those costs, raise selling prices, reduce specifications, or produce fewer devices. Absorption compresses OEM margins and increases pressure on other component suppliers; price increases can reduce unit demand; production cuts reduce application-processor, modem, connectivity, and related chip purchases. A semiconductor supplier can successfully raise its own prices while still facing weaker unit volumes.
This is corroboration of an established problem, not an entirely new downturn signal. MediaTek’s Q2 prepared remarks reported a 20% year-over-year decline in Mobile Phone revenue, explicitly attributing weakness to increasing smartphone bill-of-materials costs. Mobile Phone represented 41% of its revenue. Qualcomm’s latest reported handset revenue also declined 20% year over year and represented approximately 51% of consolidated revenue. Amkor’s incremental contribution is evidence that the pressure continues into the calendar year-end production period and is not confined to a particular Android customer.
The exposure is financially meaningful. As an illustrative sensitivity, a 5% handset-revenue shortfall, holding other businesses unchanged, would reduce consolidated revenue by approximately 2.1% at MediaTek and 2.6% at Qualcomm using their latest disclosed mixes. These are exposure calculations, not forecasts derived from Amkor’s decline.
MediaTek’s October 30 earnings call and Qualcomm’s November reporting cycle are the immediate catalysts. The relevant questions are whether flagship product ramps offset weaker lower-tier demand, whether component-price increases are successfully recovered, and whether handset inventories remain aligned with actual device sales. Longer term, automotive, edge computing, and data-center diversification become more valuable. Qualcomm’s strong automotive business is an important offset, making a blanket negative conclusion on the entire company less defensible than a negative conclusion on its handset exposure.
ADVANCED PACKAGING AND SEMICONDUCTOR EQUIPMENT
PROCESS CONTROL HAS A STRONGER FUNDAMENTAL READ-THROUGH THAN AN UNDIFFERENTIATED PACKAGING-EQUIPMENT BASKET (READ-THROUGH 3)
Affected companies: Camtek (CAMT: Israel) and Onto Innovation (ONTO: United States). Directional impact: positive, with high business-level relevance for Camtek and meaningful relevance for Onto’s advanced-packaging operations; insufficient evidence for an immediate incremental earnings upgrade.
Amkor’s flagship HDFO CPU process involves more than 300 manufacturing steps. Computing revenue increased 25% sequentially, another hyperscaler HDFO CPU program began ramping in Q3, and 2 new networking and data-center 2.5D programs are expected to enter production in Q4. Management also expects Computing revenue to grow approximately 30% or more in 2027.
The transmission mechanism combines manufacturing capacity expansion with greater process-control requirements. Complex redistribution layers, interconnects, bump structures, and multi-die integration increase the importance of detecting defects before expensive downstream processing is completed. Higher wafer and package volumes support tool demand, while additional control points and tighter tolerances can increase inspection and metrology requirements per production flow. More than 300 process steps does not mean more than 300 inspection steps, and the call does not support a proportional tool-count calculation.
The exposure is independently supported by the equipment suppliers’ disclosures. Camtek’s October investor presentation identified high-end advanced packaging as approximately 60% to 70% of its business and described applications in fan-in, fan-out, interposers, and advanced bump metrology. Onto’s Q2 call reported more than $200 million of Dragonfly orders from an unnamed OSAT, mostly for delivery in 2027, and raised its advanced-packaging growth outlook. Neither disclosure identifies Amkor as the customer, so those orders cannot be assigned to Amkor.
The most important qualification is the composition and timing of Amkor’s spending. Its 2027 facility framework can reach approximately $2.25 billion to $2.30 billion before additional equipment spending, but buildings are not inspection-tool orders. Some equipment for repurposed Korean space is already on order. The current call therefore supports the durability of the investment cycle without proving that new orders should immediately be added to supplier forecasts.
Onto’s November reporting cycle and Amkor’s February 2027 capital-budget disclosure are near-term catalysts. Camtek had already presented an initial 2027 growth outlook exceeding 35% in October, making Amkor’s commentary corroborative rather than a new forecast. The longer-duration positive is continued spending on process capability through the Korean and Arizona buildouts. The call does not justify assuming that all packaging-equipment categories, particularly technologies not specified in these programs, benefit equally.
SCARCE PACKAGING CAPABILITY SUPPORTS BETTER COMMERCIAL TERMS, BUT NOT AUTOMATICALLY BETTER CASH RETURNS (READ-THROUGH 4)
Affected company: ASE Technology Holding (3711: Taiwan). Directional impact: positive for advanced-packaging pricing, utilization, and customer visibility; moderate positive consolidated read-through, tempered by capital requirements and its broader business mix.
Amkor’s strongest pricing commentary was that customers recognize the need for returns on significant capital investment. Engel stated, “the margin profile and the return is not a major issue. They are more focused on making sure they secure the capacity.” Management also described a limited number of qualified providers and said customers are securing capacity into 2027 and 2028.
The mechanism is a shift in negotiating leverage toward manufacturers with qualified advanced-packaging processes, scale, and reliable execution. When packaging constrains a customer’s product roadmap, the cost of unavailable capacity can exceed the benefit of obtaining a modestly lower packaging price. Earlier technical engagement and longer capacity commitments can improve loading visibility and support contracts that better compensate manufacturers for equipment, engineering, and operating costs.
ASE is a relevant peer through its assembly, testing, and materials operations. Its Q2 release already showed strong ATM growth and a 27.3% ATM gross margin. Amkor’s commentary supports persistence of favorable industry conditions rather than establishing an undisclosed ASE order or proving an incremental price increase. ASE’s electronics-manufacturing-services operations also dilute the consolidated sensitivity to advanced-packaging economics.
The distinction between cost recovery and genuine pricing power remains essential. Amkor said it generally passes higher substrate and material costs to customers. Such recovery can preserve profit dollars without improving margin percentages. The more valuable signal is customer willingness to support returns on scarce manufacturing capability. The call provides qualitative evidence of that willingness but no contractual margin floor or quantified industry-wide price increase.
ASE’s late-October reporting cycle is the near-term catalyst, particularly the relationship between advanced-packaging growth, realized margins, equipment spending, and cash generation. The longer-term positive is a more strategic, less transactional role for qualified packaging providers. The negative is that attractive accounting margins can coexist with weak free cash flow during a prolonged capacity expansion. Amkor’s investment peak extending into 2028 and 2029 is a warning against valuing the entire OSAT sector as though improved EBITDA immediately becomes distributable cash.
AI ACCELERATORS AND FOUNDRY SUPPLY CHAINS
CUSTOMER PREPAYMENTS IMPROVE NVIDIA’S SUPPLY SECURITY WHILE MOVING CASH COMMITMENTS EARLIER (READ-THROUGH 5)
Affected company: NVIDIA (NVDA: United States). Directional impact: positive for medium-term supply availability and manufacturing resilience; negative for the timing and flexibility of cash commitments, but not evidence of an immediate material earnings charge.
Amkor’s October 21 announcement established a new $1.3 billion NVIDIA agreement supporting South Korean capacity and stated that the companies’ agreements across Arizona and South Korea total $3 billion. On the earnings call, management described customer advances as a major source of expansion funding and identified a late-2028 ramp for the NVIDIA-related Arizona opportunity.
The economic benefit to NVIDIA is access to qualified production capacity ahead of competing demand. Advance funding can enable suppliers to purchase equipment, build facilities, and align process development with product roadmaps. Geographic diversification also reduces dependence on a narrower set of manufacturing locations. The benefit is principally a reduction in future supply-execution risk, not an immediate increase in current-quarter GPU shipments.
The offset is earlier cash deployment and less flexibility if product requirements, demand, or manufacturing architectures change. Prepayments economically accelerate cash outflows ahead of future purchases. They are not necessarily an immediate expense, and the disclosed commitment should not be treated as though its full amount has already been paid. Amkor’s disclosure does not reveal all refund, cancellation, volume, or pricing provisions.
The scale mismatch is important. A $3 billion customer commitment is highly significant relative to Amkor’s investment program but much less consequential relative to NVIDIA’s financial scale, which included $96.2 billion of revenue in its latest reported quarter. The high-conviction negative is increased capital commitment and reduced optionality, not a claim of financing stress at NVIDIA.
The agreement was announced before the earnings call and should not be counted again as a fresh order. The call adds useful sequencing: Korea is the nearer-term expansion platform, while the discussed Arizona production contribution is later. NVIDIA’s November earnings commentary on supply commitments and subsequent disclosures of Amkor funding receipts are near-term catalysts. The longer-term positive depends on successful qualification and production loading during 2027 and 2028. Nothing in the call supports assigning the unnamed flagship CPU program to NVIDIA or converting Amkor’s Computing growth directly into a NVIDIA revenue revision.
ARIZONA PACKAGING IS COMPLEMENTARY TO TSMC’S U.S. FABS, BUT SUPPLY-CHAIN LOCALIZATION REMAINS INCOMPLETE (READ-THROUGH 6)
Affected company: Taiwan Semiconductor Manufacturing Company (2330: Taiwan). Directional impact: strategically positive for its U.S. manufacturing proposition; low immediate earnings impact, with benefits predominantly dependent on 2028-and-later execution.
Amkor reiterated that Arizona Phase 1 construction is scheduled for completion at the end of 2027, with Phase 2 expected to break ground in late 2027. The planned campus represents approximately $12 billion of investment and more than 90,000 square meters of cleanroom space. These plans sit alongside the June 2026 agreement under which TSMC can procure advanced packaging and testing services from Amkor through a 10-year collaboration framework.
The mechanism is complementary rather than necessarily competitive. Domestic wafer fabrication does not create a fully domestic semiconductor supply chain if advanced packaging and testing must occur elsewhere. Qualified Arizona packaging can make TSMC’s U.S. wafer output more useful to customers seeking geographically integrated manufacturing, reduce cross-border production transfers, and strengthen the commercial proposition of its regional ecosystem.
This does not establish that Amkor is taking packaging revenue from TSMC. The disclosed framework explicitly involves procurement and cooperation. Nor should Amkor’s $12 billion campus be added to TSMC’s capital budget or treated as a quantified TSMC revenue opportunity. The allocation among customers, package types, and production periods remains undisclosed.
The timing creates an important negative portfolio implication. Building completion is not equivalent to qualified high-volume output. Customer qualification, equipment installation, yields, and utilization remain necessary milestones. The late-2028 NVIDIA-related Arizona ramp illustrates why meaningful Asian production dependence persists during the intervening period. Geographic diversification announcements therefore do not justify immediately removing Taiwan-related supply-chain exposure from AI and semiconductor portfolios.
TSMC had already reported its September-quarter results on October 15. Amkor’s call is not a leading indicator for that completed quarter; it provides additional information about regional manufacturing integration. The next relevant milestones are the 2027 construction and equipment-installation updates, followed by customer qualification and production loading in 2028. Management’s acknowledgement of higher U.S. labor and building costs also means localization should be valued as resilience and customer access, not automatically as a source of higher consolidated margins.
PCS AND ENTERPRISE CLIENT HARDWARE
AI SERVER STRENGTH IS MASKING A WEAKER PC ECONOMIC ENVIRONMENT (READ-THROUGH 7)
Affected company: HP Inc. (HPQ: United States). Directional impact: negative for PC unit demand and Personal Systems margins; moderate consolidated earnings relevance, with printing and company-specific mitigation providing offsets.
Amkor explicitly separated data-center growth from client-computing demand. Engel stated, “PC is relatively soft, but the Data center has offset that.” He also observed that memory is a sizable component of PC costs and that Amkor had seen corresponding market impacts. Its record Computing revenue therefore cannot be used as evidence of a broad PC recovery.
For HP, the transmission mechanism is the interaction among input costs, selling prices, and units. Higher DRAM and storage costs can compress system margins if not fully recovered. Passing those costs to customers can protect profit per unit but reduce affordability and shipment volumes. Premium mix can raise reported revenue even while the underlying unit market deteriorates.
HP’s latest reported results demonstrate that distinction. Personal Systems revenue increased 18% year over year to $11.8 billion, while total units declined 16%. Segment operating margin was 4.6%. Amkor’s commentary corroborates the persistence of cost and volume pressure rather than predicting a deterioration that had not previously appeared in HP’s results.
The earnings sensitivity is meaningful because system margins are relatively thin. At the latest reported quarterly revenue, a 50-basis-point Personal Systems margin change represents approximately $59 million of operating profit, or about 11% of the segment’s reported operating profit. This is an illustrative sensitivity, not an estimate revision derived from Amkor.
The counterevidence is material. HP reported improved memory availability and fulfillment, raised its annual guidance, and generated strong quarterly cash flow. Amkor’s comments do not invalidate those company-specific measures. The more defensible negative conclusion is that a rapid, uncomplicated recovery in PC unit demand or margins remains difficult to underwrite.
The near-term catalyst is HP’s fiscal year-end reporting and initial fiscal 2027 outlook, particularly whether pricing continues to offset component inflation without further unit weakness. The longer-duration implication is a greater divergence between premium commercial systems and price-sensitive consumer PCs. Amkor’s separate observation that Arm migration continues should not be confused with growth in the overall PC market: architecture gains can coexist with a contracting unit pool.
AUTOMOTIVE AND INDUSTRIAL SEMICONDUCTORS
VEHICLE COMPUTING CONTENT AND MAINSTREAM INVENTORY NORMALIZATION ARE IMPROVING TOGETHER (READ-THROUGH 8)
Affected companies: NXP Semiconductors (NXPI: Netherlands) and Qualcomm (QCOM: United States). Directional impact: positive, with substantial relevance to NXP’s end-market mix and a meaningful but smaller consolidated contribution at Qualcomm.
Amkor’s Automotive & Industrial revenue increased 37% year over year and 7% sequentially, reaching a record. Management identified growth in ADAS, infotainment, industrial applications, and mainstream automotive packages. Engel stated that “the mainstream legacy type packages going into cars are also rebounding” and described customer inventories as being under better control. Q4 revenue is expected to grow further, albeit at a slower low-single-digit sequential rate.
The most valuable signal is that structural content growth and cyclical normalization are occurring together. More sophisticated ADAS, vehicle networking, and centralized or zonal computing increase processing and connectivity requirements per vehicle. At the same time, improving inventory positions can allow semiconductor purchasing to track actual production more closely instead of being suppressed by destocking. These mechanisms can support chip demand even without strong growth in vehicle units.
NXP has directly relevant exposure through S32 automotive processing, vehicle networking, microcontrollers, and industrial edge processing. Its latest reported mix was approximately 55% Automotive and 22% Industrial & IoT. Its own Q2 commentary had already described accelerating S32-related design activity and improving inventory metrics. Amkor’s observations therefore provide independent corroboration of the existing recovery rather than evidence that NXP should replicate Amkor’s 37% growth rate.
Qualcomm’s latest reported automotive revenue increased 61% year over year to approximately $1.59 billion. Amkor’s emphasis on infotainment and advanced in-car computing supports the durability of that demand channel. Nevertheless, this positive exposure must be weighed against Qualcomm’s larger handset business. The same call provides both a favorable automotive read-through and an unfavorable smartphone read-through for Qualcomm.
NXP’s October 27 earnings report is the most immediate catalyst, particularly whether automotive processing, industrial demand, and inventory normalization remain consistent with its prior outlook. Qualcomm’s November results provide the next test of whether automotive growth continues to offset handset pressure. Over a longer horizon, rising semiconductor content per vehicle is the more durable driver than any short-term restocking cycle.
The conclusion should not be extended indiscriminately to all automotive exposures. Amkor did not provide evidence of stronger vehicle unit sales, improved automaker margins, a broad EV-demand acceleration, or a comparable recovery in silicon-carbide power devices. The highest-conviction benefit is concentrated in automotive processing, connectivity, and selected mainstream semiconductor demand, not the entire automotive value chain.
Report record
- Sector
- Information Technology
- Industry
- Semiconductors & Semiconductor Equipment
- Fiscal period end
- September 30, 2026
- Report date
- October 26, 2026
- Analysis
- 6055 words
- Read-throughs
- 3215 words
- Content fingerprint (PDF)
6dd222022c64- Content fingerprint (analysis)
2e1f2e6079dd- Content fingerprint (read-throughs)
bc263aadbfb7
Prepared from the company's earnings release and earnings call transcript. Figures as reported by the company. For information only. Not investment advice.
More from Amkor Technology, Inc.
No other reports yet.
All Amkor Technology, Inc. reports
More in Information Technology
Strong operating quarter, but a licensing-heavy beat
AI Participation Is Proven; a Consolidated Growth Inflection Is Not
All Information Technology reports
Amkor Technology, Inc. on the Atlas Peak ticker page
Follow @AtlasPeakRes on X for new earnings reports as they publish.