AI Participation Is Proven; a Consolidated Growth Inflection Is Not
Earnings Reports
Rambus Inc. FQ3 2026 Earnings Report
Rambus Inc. (RMBS) FQ3 2026 earnings: Strong operating quarter, but a licensing-heavy beat. Full earnings analysis, key read-throughs, and the one-page exhibit from Atlas Peak Research.
Rambus Inc. (RMBS)
Sector: Information Technology · FQ3 2026 · Period end September 30, 2026 · Reported October 26, 2026
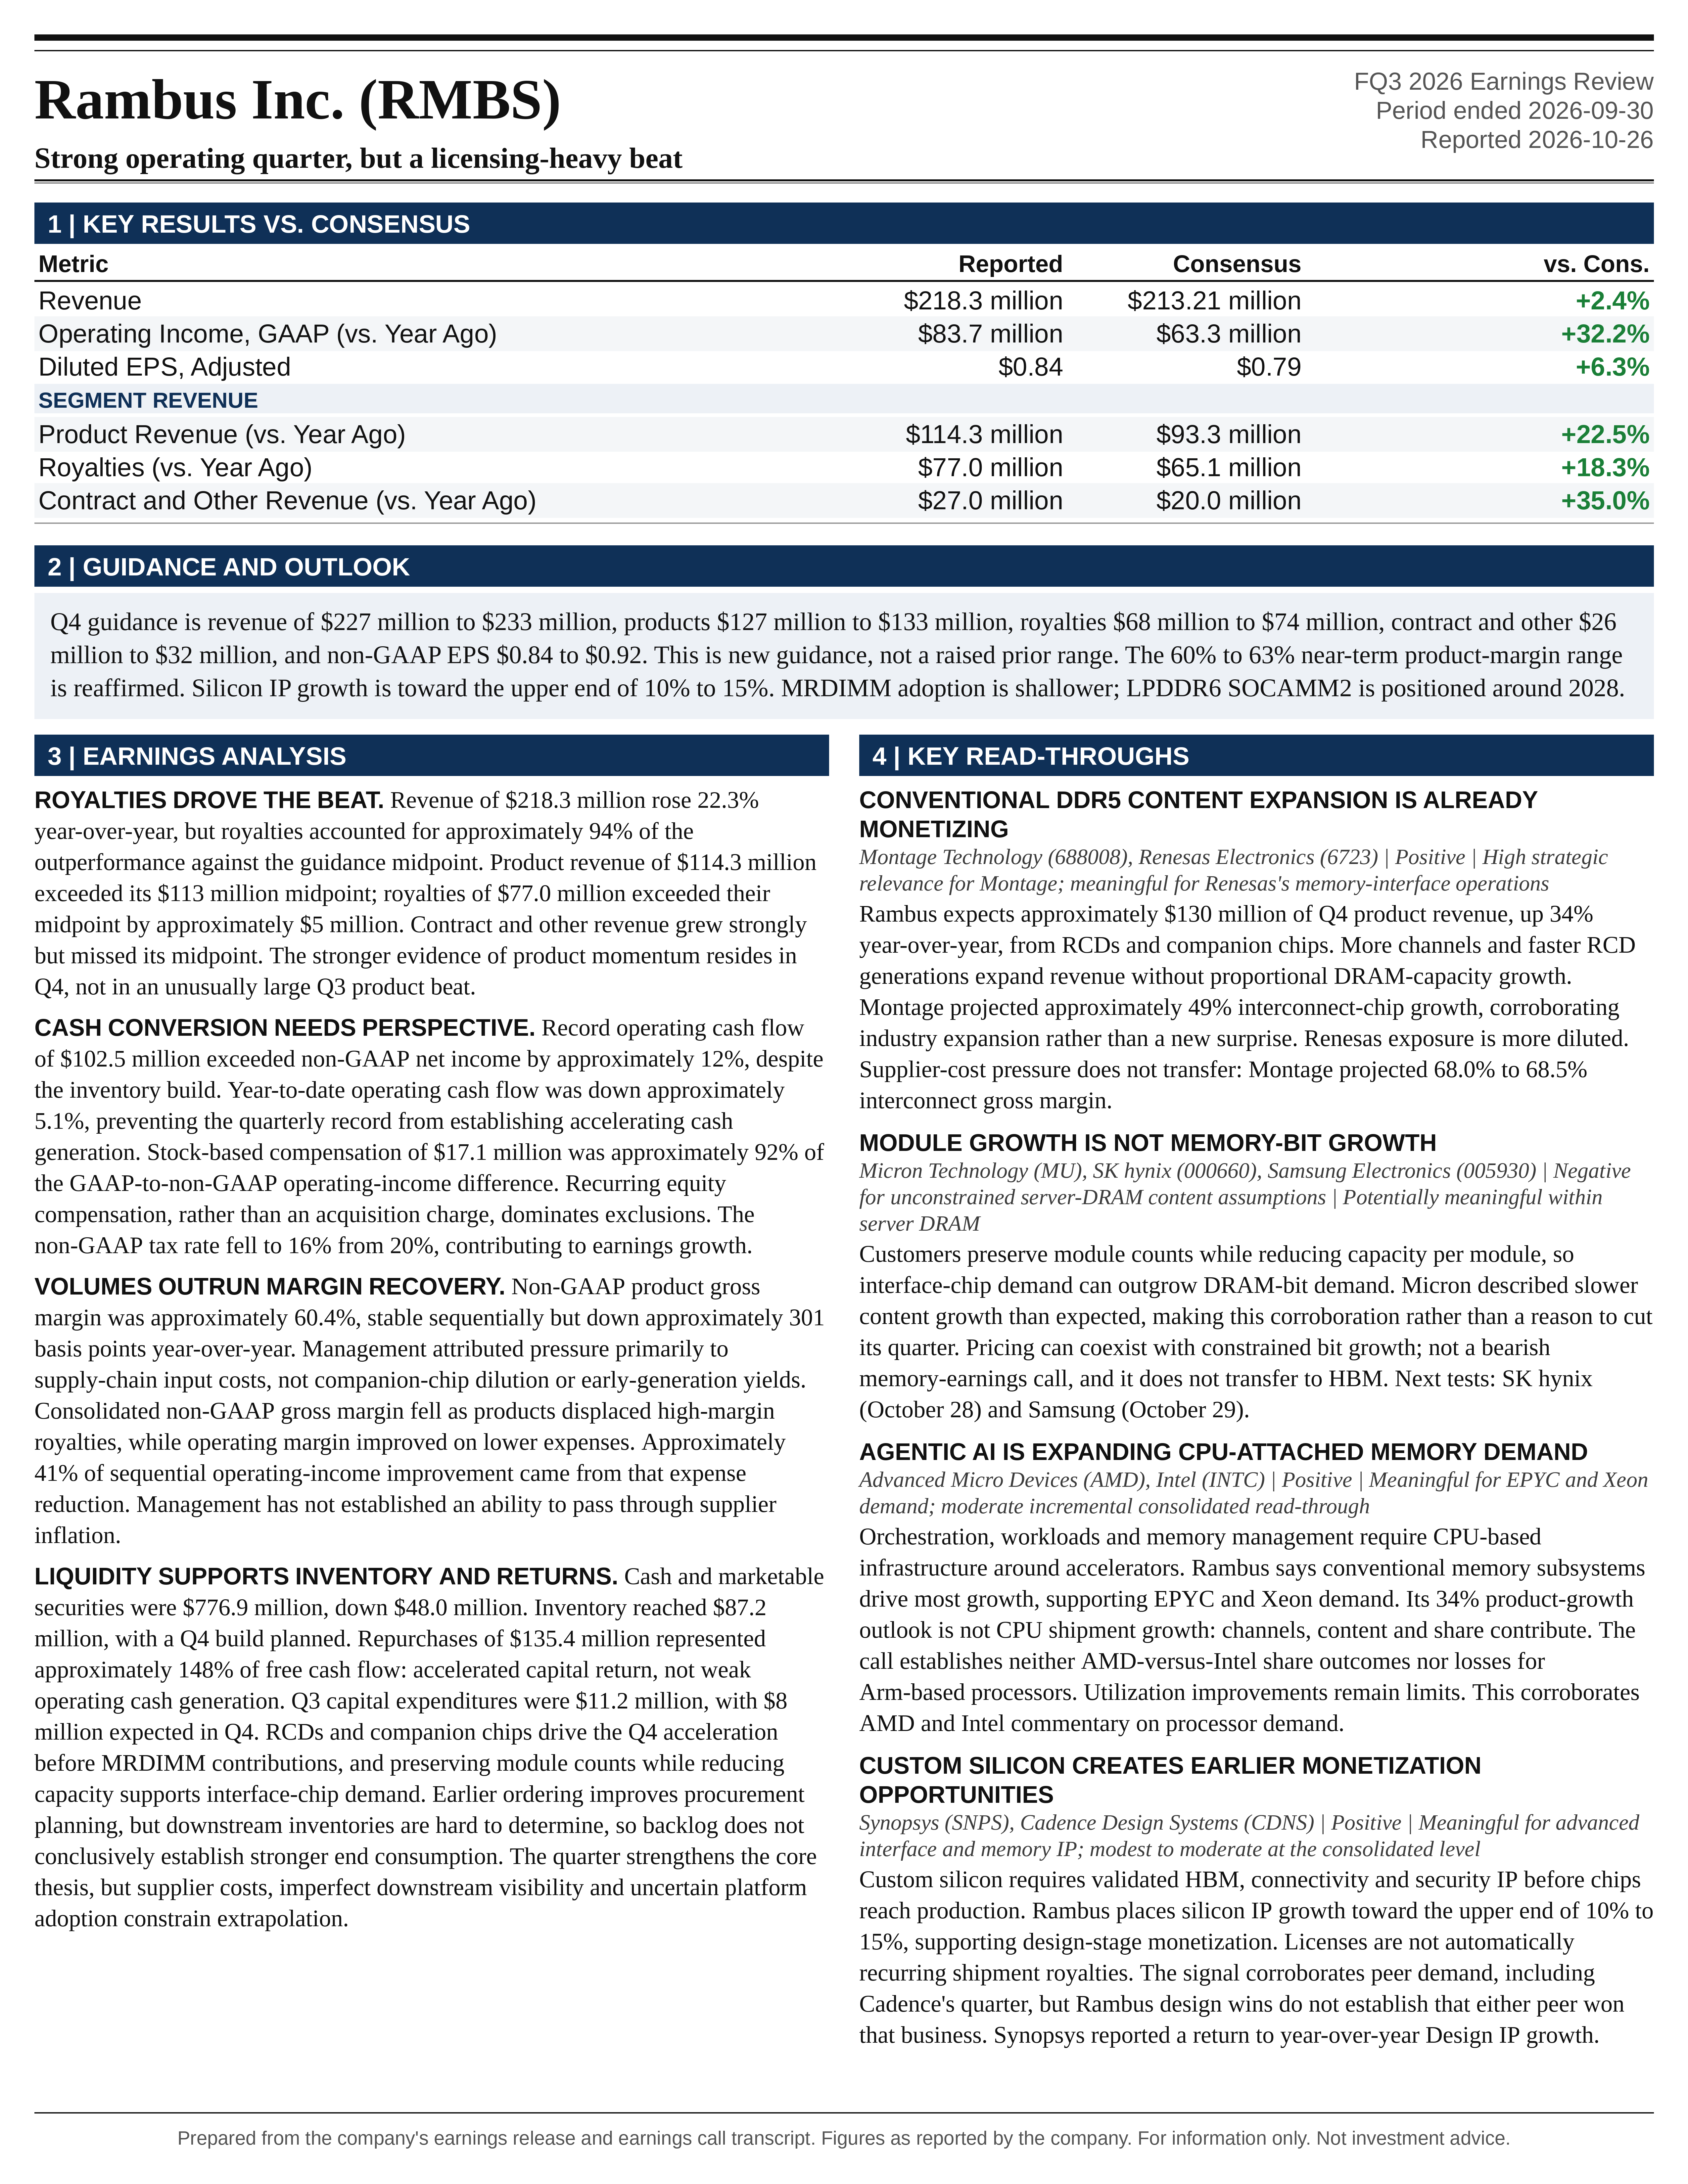
Rambus delivered a strong operating quarter and an improving near-term product outlook, but the composition of the earnings beat is more nuanced than the headline results suggest. Q3 revenue reached $218.3 million, up 22.3% year-over-year, while non-GAAP EPS increased to $0.84 from $0.62.
Download the one-page report (PDF)
View one-page exhibit
Download analysis (.md)
Download read-throughs (.md)
Post to X
One-Page Exhibit
Earnings Analysis
EXECUTIVE CALL SUMMARY: Rambus Inc. (10/26/26)
Rambus delivered a strong operating quarter and an improving near-term product outlook, but the composition of the earnings beat is more nuanced than the headline results suggest. Q3 revenue reached $218.3 million, up 22.3% year-over-year, while non-GAAP EPS increased to $0.84 from $0.62. Q4 guidance implies product revenue growth accelerating to 34.3%, despite only modest MRDIMM contributions. The principal positive investment implication is that the existing DDR5 registering clock driver, or RCD, franchise and expanding companion-chip portfolio are generating substantial growth before the larger contribution anticipated from emerging memory architectures. The quarter supports a constructive fundamental stance and valuation-sensitive accumulation, rather than an unconditional increase in exposure based on the AI narrative.
The most important qualification is that royalties, rather than product revenue, accounted for approximately 94% of the revenue outperformance against the prior guidance midpoint. Product revenue of $114.3 million exceeded its $113 million midpoint but remained within the previous $110 million to $116 million range. Royalties of $77.0 million exceeded their $72 million midpoint by approximately $5 million. The stronger evidence of incremental product momentum therefore resides in the Q4 outlook, not in an unusually large Q3 product beat. Similarly, product gross margin remained approximately 60.4%, down approximately 301 basis points year-over-year, despite the revenue acceleration.
Management’s commentary separates the opportunity into distinct investment horizons. RCD generations, companion-chip adoption, rising memory-channel counts and CPU-based infrastructure demand are driving current results. MRDIMM remains a potentially material opportunity, but the adoption curve is explicitly described as shallower than a conventional RCD transition. The LPDDR6 SOCAMM2 opportunity is positioned around 2028, not as a significant near-term earnings driver. Silicon IP is performing toward the upper end of the previously communicated 10% to 15% growth range, supported by earlier architectural engagement with hyperscalers and custom-silicon developers.
The central investment question is whether accelerating module demand and richer chip content can outweigh supply-chain inflation, architectural mix changes and potentially less reliable order visibility. Management acknowledged that customers are placing orders earlier while also conceding limited visibility into downstream inventories. Consequently, the stronger backlog supports production planning but does not conclusively establish stronger end consumption. The most defensible thesis is expanding memory-interface content across heterogeneous infrastructure, supported by a profitable licensing business. The least defensible thesis is a direct, uniform relationship between AI spending, DRAM capacity, Rambus revenue and accelerating margins.
QUARTERLY PERFORMANCE AND THE QUALITY OF THE BEAT
Q3 revenue increased from $178.5 million in Q3 2025 and $207.4 million in Q2 2026 to $218.3 million. Product revenue increased 22.5% year-over-year and 15.3% sequentially to $114.3 million. Contract and other revenue increased 34.7% year-over-year and 12.7% sequentially to $27.0 million. Royalties increased 18.2% year-over-year to $77.0 million but declined from $84.3 million in Q2. The quarter therefore combined strong product and contract growth with a sequential normalization in royalties.
The revenue mix became more product-oriented. Products represented 52.4% of total revenue, compared with approximately 47.8% in Q2. This matters because products carry substantially lower reported gross margins than royalties and contract revenue. Strong product growth can therefore depress consolidated gross margin even when product-level profitability is stable. Conversely, a royalty revenue surprise can generate a disproportionate earnings benefit without a comparable improvement in physical shipment demand.
Rambus’s July 27 earnings release guided Q3 revenue to $210 million to $216 million. Actual revenue exceeded the midpoint by $5.3 million, or 2.5%, and the upper end by $2.3 million. The category bridge is revealing: product revenue exceeded its midpoint by approximately $1.3 million, royalties exceeded theirs by approximately $5.0 million, and contract and other revenue was approximately $1.0 million below its midpoint. Contract revenue still grew strongly year-over-year, but it was not a source of outperformance relative to the quarterly forecast.
Non-GAAP EPS of $0.84 exceeded the previous $0.75 to $0.82 range. The $0.055 improvement over the midpoint was supported by higher revenue, approximately $0.9 million of lower total non-GAAP costs relative to the cost midpoint, and a diluted share count below the 110 million assumption. Non-GAAP operating income of $102.2 million exceeded the prior $91 million to $101 million range. The operating profit beat was therefore real, although its composition was more licensing-heavy than the headline product-growth discussion might imply.
MarketBeat’s contemporaneous October 26 earnings report cited consensus revenue of $213.21 million and EPS of $0.79. Against that specific estimate set, revenue exceeded expectations by approximately 2.4% and EPS by approximately 6.3%. These are meaningful but not transformational surprises. Management’s forecast and the reported consensus were closely aligned, making the royalty-driven bridge relevant to both comparisons.
The longer historical perspective also warrants restraint. Full-year product revenue grew approximately 41% in 2025, versus approximately 24% implied for 2026. Total revenue grew approximately 27% in 2025, versus approximately 18% implied for 2026. Q4 represents a reacceleration within 2026, not evidence that every growth measure is accelerating relative to the previous year.
Q4 GUIDANCE AND CHANGES RELATIVE TO PRIOR EXPECTATIONS
Q4 revenue guidance is $227 million to $233 million, with a $230 million midpoint. This implies approximately 5.4% sequential growth and 20.9% year-over-year growth. Product revenue guidance is $127 million to $133 million, implying $130 million at the midpoint, approximately 13.7% sequential growth and 34.3% year-over-year growth. Contract and other revenue is expected to reach $26 million to $32 million, while royalties are expected to be $68 million to $74 million.
The midpoint revenue bridge is strongly product-led. Products contribute approximately $15.7 million of sequential growth and contract revenue contributes approximately $2.0 million, offset by a roughly $6.0 million royalty decline. Products would account for 56.5% of revenue, versus 52.4% in Q3. This is a more economically informative signal than the approximately 5% consolidated growth rate: the shipment-oriented business is expanding materially faster than the total company.
The written October 26 release confirms non-GAAP total operating costs of $124 million in the downside case and $120 million in the upside case. The descending presentation is not an expense-sign error. Pairing the revenue and cost endpoints implies operating income of $103 million to $113 million, completing the operating-profit statement that is truncated in the draft transcript. At the midpoint, operating income is $108 million and operating margin is approximately 47.0%, broadly consistent with Q3’s 46.8%.
With $6.5 million of interest and other income, a 16% non-GAAP tax rate and 109 million diluted shares, the midpoint produces approximately $0.88 of EPS. The $0.84 to $0.92 EPS range implies approximately 29% midpoint growth against Q4 2025’s $0.68. Product revenue growth therefore exceeds earnings growth, reflecting the less favorable revenue mix and continued cost requirements. The category revenue ranges should not be summed at all their low or high endpoints; their midpoints reconcile to consolidated guidance, but the individual extremes do not represent a single coordinated scenario.
The previous call did not establish a numerical Q4 revenue or EPS forecast. The new outlook should therefore not be described as an increase to an existing formal Q4 range. It does substantiate the earlier expectation that H2 would be stronger than H1. At the Q4 midpoint, H2 product revenue reaches approximately $244.3 million, 30.5% above H1’s $187.2 million.
The full-year implications are approximately $835.9 million of revenue and $431.5 million of product revenue, representing growth of 18.1% and 24.1%, respectively. Approximate full-year non-GAAP EPS is $3.12 based on the quarterly results and Q4 midpoint, consistent with management’s approximately 24% growth commentary. Quarterly EPS sums are approximate because annual weighted-average shares can differ from individual quarterly denominators.
Several qualitative expectations changed more subtly. Silicon IP moved from confidence in a 10% to 15% growth range toward the upper end of that range, without an explicit increase to the ceiling. MRDIMM remained modest near-term, but the current call emphasized a shallower adoption curve more strongly. Management retained the 60% to 63% near-term product-margin range and 60% to 65% long-term target, while attributing current pressure primarily to supply-chain costs. No numerical 2027 revenue, earnings or supply-capacity commitment was provided.
MARGINS, OPERATING LEVERAGE AND AN IMPORTANT GUIDANCE TENSION
Non-GAAP product gross margin was approximately 60.4%, versus approximately 60.3% in Q2 and 63.4% in Q3 2025. The sequential stabilization is encouraging, but the year-over-year decline remains economically significant. Product revenue increased approximately $21.0 million year-over-year, while product gross profit increased only approximately $9.9 million. The implied incremental product gross margin was approximately 47%, below the current average margin.
The CFO directly identified the main source of pressure: “the margin trending towards the lower end is primarily driven by the supply chain input cost.” This narrows the interpretation of the quarter. Management did not principally attribute the weakness to companion-chip dilution or early-generation yields, despite the analyst explicitly raising those possibilities. Internal savings are offsetting supplier inflation sufficiently to preserve the near-term range, but the call does not establish that Rambus can pass through higher costs fully.
That distinction is reinforced by the prior call. In July, management emphasized the standard-product nature of the business and did not identify a meaningful opportunity for price increases despite industry tightness. The current results therefore illustrate a company benefiting from stronger volumes without necessarily capturing the scarcity economics available elsewhere in the memory supply chain. Rising DRAM or CPU prices should not be assumed to translate into equivalent Rambus pricing power.
Consolidated non-GAAP gross margin declined from approximately 80.6% in Q2 to 78.9% in Q3, despite the slight improvement in product margin. The explanation is the shift toward products and away from exceptionally high-gross-margin royalties. Nevertheless, non-GAAP operating margin increased from 45.2% to 46.8% because operating expenses declined from $73.6 million to $70.0 million. Approximately 41% of the sequential operating-income improvement came from that expense reduction. A continuation of the same rate of operating leverage would require more than simply sustaining current product growth.
There is also a numerical tension in the full-year product-margin commentary. The CFO stated, “We expect 2026 to be right in the middle of that 60% to 63% range.” The published quarterly cost reconciliations imply a revenue-weighted product gross margin of approximately 60.8% through Q3. At $130 million of Q4 product revenue, achieving exactly 61.5% for the full year would require approximately 63.2% in Q4. A 63% Q4 margin would produce approximately 61.4% for the year, reasonably close to the stated midpoint. A 60% to 61% Q4 margin would instead produce approximately 60.5% to 60.8%.
The annual comment therefore appears to require a Q4 outcome near the upper end of the near-term range, whereas the discussion of a possible slight quarterly improvement sounds less ambitious. This is not sufficient evidence of a formal guidance contradiction because the language is approximate and the transcript is a draft. It is, however, a material modeling sensitivity. A forecast that simultaneously assumes only a modest Q4 margin increase and a full-year margin precisely at 61.5% would not reconcile.
EARNINGS QUALITY, TAXES AND SHARE REPURCHASES
GAAP operating income increased to $83.7 million from $63.3 million, while GAAP EPS rose to $0.69 from $0.44. The Bloomberg notice’s $0.69 EPS and 38% operating margin are therefore consistent with the GAAP results, not the call’s $0.84 non-GAAP EPS and approximately 47% non-GAAP operating margin. These measures should not be mixed when evaluating valuation or operating performance.
The difference between GAAP and non-GAAP operating income was approximately $18.6 million. Stock-based compensation of $17.1 million accounted for approximately 92% of that difference. Stock compensation increased approximately 20.5% year-over-year and represented approximately 7.8% of revenue. The adjusted earnings result is consequently not dominated by an isolated acquisition charge; its principal exclusion is recurring equity compensation.
The lower non-GAAP tax rate also contributed meaningfully to reported growth. Rambus uses 16% in 2026 versus 20% in 2025. Holding pretax earnings constant, that change increases after-tax income by 5%. Applying the prior 20% rate to Q3 2026 adjusted earnings would produce approximately $0.80 per share, with growth closer to 29% than the reported approximately 35%. The underlying earnings expansion remains strong, but not all of the EPS acceleration represents improving operating economics.
GAAP growth is even more affected by tax comparability. The effective GAAP tax rate declined from approximately 30.2% in Q3 2025 to 17.6% in Q3 2026. GAAP EPS growth therefore overstates the improvement in pretax operating performance. The approximately 29% increase in non-GAAP operating income provides a cleaner indication of the quarter’s operating earnings expansion.
The $135.4 million of Q3 share repurchases, including the $100 million accelerated program, supported per-share results. Diluted weighted-average shares declined approximately 1.1% sequentially but only approximately 0.5% year-over-year. The current share-count benefit is thus relatively modest compared with the gross repurchase expenditure. Q4’s 109 million diluted-share assumption is also broadly consistent with Q3, rather than embedding a large additional denominator reduction. Repurchases should be assessed against net dilution and purchase valuation, not simply their announced dollar amount.
THE CORE PRODUCT THESIS: MODULES AND CONTENT, NOT DRAM DOLLARS
The strongest operational evidence is that current growth is being generated by established products and companion-chip adoption. Management characterized the Q4 product outlook as “34% year-over-year growth based on the core, I would say, RCD and companionships.” This matters because it reduces dependence on an immediate MRDIMM inflection. The core franchise is funding and supporting the roadmap rather than waiting for a new architecture to rescue growth.
The underlying revenue model depends on server and CPU deployments, memory channels, populated modules, chip content per module, product-generation mix and Rambus’s share within each chip category. These variables should be modeled separately. DDR platforms moving from 8 to 12 channels increase potential channel count by 50%; moving from 12 to 16 increases it by another 33%. These are substantial structural opportunities, but they are not automatic revenue increases. Population rates, platform mix, DIMMs per channel, qualification timing and market share determine realized revenue.
Management’s observation about memory “despecking” is particularly important. Seraphin stated, “it’s not that people decrease the number of modules, but they tend to decrease the capacity of each one of these modules.” Maintaining module counts while reducing capacity preserves much of the opportunity for interface and support chips even when DRAM bits per system are constrained. Rambus can therefore outperform a simple model based on aggregate installed DRAM capacity.
The implication is conditional rather than universal. If memory inflation ultimately causes customers to populate fewer channels, defer servers or change architecture, Rambus would face a more direct demand impact. The current evidence suggests that customers are preserving bandwidth-oriented module configurations while economizing on capacity. It does not establish that module demand is insensitive to memory pricing.
Companion chips add another source of growth. The July call described a progression from a low-double-digit share of product revenue toward a higher share by year-end. The current call confirmed continued sequential growth but did not provide an updated dollar contribution or attach rate. This supports the direction of the strategy without allowing a precise decomposition between RCD demand, companion-chip share gains and generation mix.
The sixth-generation RCD supporting DDR5 9600 is now broadly sampling. That demonstrates roadmap execution and customer engagement, but sampling is not equivalent to production revenue, a qualified platform position or a guaranteed share gain. The call supports confidence in technological readiness more clearly than it establishes the ultimate commercial allocation among competing suppliers.
MRDIMM: SUBSTANTIAL OPTIONALITY, MORE CONSERVATIVE TIMING
MRDIMM remains attractive because the architecture requires additional supporting silicon and can increase Rambus’s content opportunity relative to conventional modules. However, the current call provides little evidence that it materially contributed to the reported acceleration. Management described shipments as qualification and pre-production activity, with the emerging platform ramp still modest.
The most consequential statement was that “the ramp will be shallower in our opinion than the other generations of products.” The reasons were specific: platform introductions are staggered, adoption is not universal, customers must work through a new technology transition, and current memory economics influence configuration choices. These are constraints on the conversion of the addressable market into realized revenue.
The approximately $600 million opportunity cited by management should be treated as an addressable-market estimate, not Rambus revenue guidance. Monetization depends on compatible CPU shipments, the percentage of those systems adopting MRDIMM, module population, chip content, pricing and competitive share. The call did not provide enough information to convert that estimate into a reliable annual revenue forecast.
The competitive response was also incomplete. An analyst asked why Rambus could take a leadership position when a competitor had won the initial platform. Management addressed adoption timing and the market opportunity rather than providing concrete evidence of share displacement or a superior qualified position. The addressable-market thesis and the leadership thesis therefore require different levels of confidence.
Relative to the July call, which already described Q4 contributions as minimal and 2027 as more meaningful, the current comments are not an explicit withdrawal of the 2027 opportunity. They do argue against an aggressive, smooth adoption curve. The prudent modeling approach is to preserve longer-term optionality while requiring actual qualifications, platform shipments and revenue disclosure before assigning a steep near-term ramp.
SOCAMM, LPDDR AND ARCHITECTURAL MIX RISK
The LPDDR6 PMIC extends Rambus’s participation in lower-power server-memory architectures. The October 13 product announcement confirms that the device is sampling to lead customers and is intended to operate with Rambus’s SPD Hub. The company already offers an LPDDR5X SOCAMM2 chipset, so the call’s approximately 2028 timing should be understood in the context of the emerging LPDDR6 generation, not as the initial introduction of all SOCAMM2 products.
Management stated that “the dollar content is going to increase from that first generation to that second generation.” The stated mechanism is greater power-management complexity and higher module performance. That is a favorable direction of travel, but the final specification, exact component configuration and dollar content were not disclosed. A quantitative content uplift cannot be derived from the call.
The more immediate investment issue is whether LPDDR architectures dilute the opportunity associated with conventional DDR modules. An analyst suggested an approximately 4x content difference between x86 configurations and SOCAMM-based systems. Management did not validate that estimate. It instead argued that LPDDR deployment is complementary and that the larger growth opportunity remains CPU-based systems using conventional memory.
Seraphin’s strongest statement was, “the majority of the growth is coming from CPUs with, with standard memory subsystems.” If accurate, LPDDR participation adds architectural coverage without materially undermining the principal revenue pool. However, a portfolio spanning multiple architectures is not necessarily economically neutral across them. Different configurations can carry different chip counts, prices, margins and supplier shares.
The appropriate investment interpretation is that SOCAMM reduces technological exclusion risk but does not eliminate mix risk. The bullish outcome is growth in conventional DDR systems alongside incremental lower-power deployments. The adverse outcome is a larger-than-expected migration toward architectures with lower Rambus content before the next-generation power-management opportunity becomes meaningful. Management’s preference for broad participation is strategically sensible, but the ultimate revenue outcome depends on deployment mix.
CPU DEMAND, AGENTIC AI AND THE LIMITS OF THE ARCHITECTURAL ARGUMENT
Management linked stronger demand to orchestration, persistent workloads, memory management and rising CPU requirements relative to GPUs. This provides a credible explanation for why Rambus can benefit from AI investment without supplying GPU compute or HBM memory itself. The exposure extends to the infrastructure required to coordinate and operate accelerated systems.
The argument is strongest where workloads require more CPU-based execution and broader memory bandwidth. It is weaker when translated into a fixed CPU-to-GPU ratio or a guaranteed revenue multiplier. No quantified ratio, customer deployment data or revenue sensitivity was disclosed. The claim remains an architectural observation supported by current demand, rather than a fully measurable long-term forecast.
Software efficiency, higher CPU utilization, workload consolidation and offload to specialized processors could moderate the relationship between agent deployment and CPU demand. Conversely, dedicated resources per agent or user could increase infrastructure intensity. The relevant question is not whether agentic AI grows, but how much additional memory-interface content is required per unit of useful workload after efficiency improvements.
The cross-company implication is therefore directional. Rambus’s results corroborate stronger demand for CPU-associated memory infrastructure, but they do not establish the revenue growth of any individual CPU, DRAM or accelerator supplier. Memory-capacity reductions can affect DRAM suppliers differently from module-interface suppliers, and custom-silicon growth can benefit licensing activity without producing a matching increase in Rambus chip shipments.
SUPPLY CONSTRAINTS, BACKLOG QUALITY AND INVENTORY
Management’s supply commentary was reassuring for Q3 and Q4 but explicitly conditional beyond that horizon. Seraphin stated that longer supplier lead times “has not impacted our Q3 number and it will not impact the Q4 number that we just talked about.” Customer-facing lead times had not increased at the time of the call. Inventory investment and supplier coordination were therefore delivering a tangible operational benefit.
The 2027 commentary was less definitive. Management said, “Supply will remain tight,” and described weekly work with suppliers to support expected demand. There was no quantified capacity commitment, disclosed long-term supply agreement or assurance that all potential demand could be fulfilled. The present outlook supports confidence in the guided quarter, not unconstrained participation in every potential 2027 upside scenario.
Backlog visibility improved because customers are ordering earlier. That is useful for procurement and production planning, but it is not equivalent to improved visibility into final consumption. Asked about downstream inventory, Seraphin replied, “It’s very hard to determine.” The subsequent statement, “we don’t see people building inventory, but we see people placing backlog,” should therefore be interpreted in light of that visibility limitation.
Earlier ordering can reflect genuine growth, precautionary scheduling or overlapping attempts to secure supply. The call does not establish double ordering, but it also does not rule it out. Longer order horizons can temporarily make backlog appear stronger even when the underlying consumption trajectory has changed less dramatically. Order placement, cancellation terms, customer inventory and final server shipments are separate indicators.
Rambus’s own inventory increased from $74.8 million at June 30 to $87.2 million at September 30, versus $44.1 million at year-end 2025. Inventory has therefore nearly doubled since the beginning of the year. Management plans another Q4 increase broadly similar to recent quarterly builds. The strategy can protect customer relationships and allow Rambus to convert demand that less-prepared suppliers cannot serve, but it also increases exposure to platform delays, generation transitions and forecast errors.
The risk is not immediate balance-sheet stress. Liquidity is ample. The risk is that inventory selected for anticipated ramps loses flexibility if customer schedules or architectures change. The strongest confirmation of the strategy would be continued sales growth without a persistent deterioration in inventory efficiency or eventual write-downs.
SILICON IP: BETTER MOMENTUM, DISTINCT ECONOMICS
Silicon IP is a stronger contributor than the contract-revenue line alone suggests. The CFO reiterated that only part of silicon IP revenue appears in contract and other revenue, with the remainder included in royalties. It would therefore be incorrect to treat $27 million of quarterly contract revenue as the full IP business or to apply its 35% growth rate to the entire IP portfolio.
Management described the business as approximately $130 million in scale, with growth toward the upper end of the previously communicated 10% to 15% range. The exchange did not establish a revised annual revenue target with an unambiguous baseline. Applying 15% to $130 million to generate a new formal forecast would create more precision than the disclosure supports.
The strategic improvement is deeper engagement before standards and system architectures are finalized. HBM, PCIe controller and switch IP, and hardware security are increasingly part of early discussions with hyperscalers and custom-silicon developers. Early participation can improve specification alignment, increase reuse across related programs and create opportunities to license multiple blocks within a system.
However, the revenue model should not be confused with a shipment royalty on every accelerator. The July call specifically described important hyperscaler engagements as license- or multi-license-based rather than volume-based. Licensing revenue can therefore arrive well before the customer’s chip reaches production. That is favorable for near-term monetization, but it also means future chip-volume growth does not automatically produce proportionate recurring royalties.
The potential expansion toward broader system-level collaboration could increase contract size and strategic importance. It could also require more customization, integration support and engineering expenditure. Larger engagements are not necessarily higher-margin engagements if service intensity rises. The current call did not disclose contract values, exclusivity, committed program duration or incremental staffing requirements.
The new Caliptra-compatible root-of-trust solution strengthens participation in data-center security architectures. Standards alignment can reduce adoption friction and make the product more relevant to large customers. It does not establish exclusive ownership of the standard or automatically confer unique pricing power. Hardware roots of trust also address a specific security foundation; they should not be interpreted as a comprehensive solution to application-level or agent-level security risks.
The combined IP and chip portfolio provides a potentially useful information advantage. Management explained that architectural discussions reveal where customers expect to use DDR, LPDDR and different module configurations. That can improve roadmap decisions. It is not, by itself, evidence that an IP design win guarantees a corresponding memory-module chip award.
CHIPAGENTS: STRATEGIC OPTION, NOT A DEMONSTRATED EARNINGS DRIVER
The October 22 ChipAgents announcement combines companywide adoption of an agentic design platform, collaboration around Rambus IP integration and a strategic investment. The potential value is straightforward: shorter design and verification cycles, greater engineering capacity, faster product introductions and more efficient customer integration.
The commercial evidence remains limited. Neither the call nor the announcement quantified investment size, software costs, engineering savings, development-cycle reductions or expected financial returns. No independent revenue stream from the collaboration was established. The appropriate near-term treatment is a strategic investment with possible productivity benefits, not a new material earnings segment.
Timing is also important. Both the ChipAgents announcement and the LPDDR6 PMIC announcement occurred after the September 30 quarter-end. They strengthen the forward roadmap but should not be used to explain Q3’s expense reduction or realized revenue. Any claim that the newly announced AI design collaboration caused the quarter’s operating leverage would be premature.
CASH FLOW, CAPITAL ALLOCATION AND BALANCE-SHEET CAPACITY
Q3 operating cash flow reached a record $102.5 million, versus $61.2 million in Q2. Capital expenditures of $11.2 million imply conventional free cash flow of approximately $91.3 million, or 41.8% of revenue. Operating cash flow exceeded non-GAAP net income by approximately 12%, demonstrating strong quarterly cash conversion despite the inventory build.
The annual perspective is less uniformly positive. Q1, Q2 and Q3 operating cash flow total approximately $246.9 million. The comparable 2025 period was approximately $260.2 million, derived from $360.0 million of full-year operating cash flow less $99.8 million in Q4. Operating cash flow is therefore down approximately 5.1% year-to-date, notwithstanding the Q3 record. That does not establish deteriorating earnings quality, since working capital and licensing collections can vary substantially, but it prevents the quarterly record from being treated as proof of accelerating annual cash generation.
Exceeding the 2025 full-year operating cash flow record would require more than approximately $113.1 million in Q4, approximately 13.3% above Q4 2025. Management did not provide that commitment. Through Q3, capital expenditures total approximately $40.4 million, and the $8 million Q4 outlook implies approximately $48.4 million for the year. Free cash flow should therefore be evaluated after both inventory support and development infrastructure spending.
The $135.4 million of Q3 repurchases represented approximately 148% of quarterly free cash flow. Cash and marketable securities consequently declined by $48.0 million to $776.9 million. This is consistent with a deliberately accelerated capital return rather than weak operating cash generation, but it is not a sustainable quarterly payout ratio without reducing accumulated liquidity.
Management’s stated intention to return 40% to 50% of free cash flow “over time” provides the appropriate framework. The accelerated repurchase can front-load that policy, but it does not imply comparable repurchases every quarter. Inventory, development spending, potential acquisitions and strategic investments remain competing uses of cash.
Liquidity is approximately $7.1 per assumed diluted share. That provides substantial operating flexibility, although leases and EDA software obligations still require recognition in an enterprise-value framework. Cash also contributes to reported earnings through interest income. A valuation that capitalizes total EPS and then adds all cash separately risks double-counting part of the cash benefit.
2027 OUTLOOK AND ILLUSTRATIVE INVESTMENT SCENARIOS
Management’s 2027 outlook is positive but qualitative. Seraphin stated, “The demand is strengthening. We have a better visibility into our backlog, going into 2027.” The same discussion retained expected seasonality between H1 and H2. A sequential decline from a strong Q4 would not necessarily contradict the thesis, while continued strength would provide evidence that demand is overcoming normal seasonal patterns.
Q4 product guidance implies a $520 million annualized revenue pace, approximately 20.5% above the implied $431.5 million full-year 2026 result. This creates a favorable starting point for 2027, but annualizing a seasonally strong quarter is not equivalent to a full-year forecast. Higher 2027 growth still requires sufficient H1 demand, continued content gains and adequate supply.
An illustrative base case with a 50% probability assumes 2027 product revenue of $535 million, approximately 24% growth, and combined royalties plus contract revenue of $425 million. At a 61.5% product gross margin, a 98.5% combined non-product gross margin and $300 million of non-GAAP operating expenses, operating income would be approximately $448 million. Assuming $24 million of interest and other income, a 16% tax rate and 109 million shares produces EPS of approximately $3.63. This case assumes healthy conventional-module growth, continued companion-chip gains and gradual MRDIMM adoption, without a major LPDDR6 contribution.
An illustrative bull case with a 25% probability assumes $620 million of product revenue, $455 million of combined non-product revenue, a 64% product margin and $320 million of operating expenses. Under the same other-income, tax and share assumptions, EPS would be approximately $4.23. This requires materially stronger unit and content growth, successful supply execution, greater new-platform adoption and a meaningful reduction in the current margin pressure. It is not simply the base case with additional AI enthusiasm.
An illustrative bear case with a 25% probability assumes $450 million of product revenue, $395 million of combined non-product revenue, a 59% product margin and $300 million of operating expenses. EPS would be approximately $2.92. This outcome could result from backlog normalization, slower platform adoption, more unfavorable architecture mix or continued cost inflation. Revenue would remain near the implied 2026 level, but operating leverage would weaken.
These scenarios produce probability-weighted EPS of approximately $3.60. They are analytical assumptions, not company guidance or consensus. The combined non-product category deliberately preserves the accounting distinction between contract revenue, silicon IP royalties and other royalties. The model does not assume that all royalty revenue grows at the silicon IP business’s stated rate.
VALUATION, PORTFOLIO IMPLICATIONS AND RISK PARAMETERS
The quarter improves confidence in the earnings trajectory more clearly than it establishes valuation upside. Applying illustrative multiples of 25x, 30x and 35x to the $3.63 base-case EPS produces values of approximately $91, $109 and $127 per share. These are sensitivities rather than independently established fair values. They demonstrate how heavily the investment outcome depends on the multiple assigned to a business combining cyclical chip demand, recurring engineering expenditure and highly profitable licensing revenue.
A 20% multiple contraction would offset approximately 25% EPS growth. The distinction between business performance and stock performance is therefore critical. Strong execution can coexist with limited equity returns if the entry valuation already assumes rapid MRDIMM adoption, margin recovery and sustained AI-related demand. Conversely, a valuation nearer 25x the illustrative base case requires substantially less credit for the longer-duration options.
The appropriate stance is constructive on fundamentals, with selective accumulation at valuations that do not require the bull case. An entry near the illustrative $91 level is more defensible than paying approximately $127 while product margins remain near the bottom of the near-term range and 2027 supply remains uncertain. A precise return forecast requires a verified executable share price; none is assumed here.
For a discretionary long allocation, a provisional 1% of NAV initial position with a 20% price-stop budget implies approximately 20 basis points of planned portfolio loss, before gaps and execution slippage. This is a risk-budget illustration rather than optimized sizing. Additional exposure should require confirmation of backlog conversion, supply availability and product-margin improvement. Actual sizing depends on existing semiconductor, hyperscaler-capex and growth-factor exposures.
Rambus offers different revenue mechanics from a direct accelerator or DRAM position, but not necessarily independent portfolio risk. Demand remains linked to data-center investment, server deployments, semiconductor supply conditions and growth-equity valuation. The licensing business and liquidity cushion reduce some operating risk, while the emerging-product narrative adds duration and execution risk.
Fundamental review triggers include product growth falling below 10% for 2 consecutive quarters without a clearly temporary explanation, product gross margin remaining below 60%, material order cancellations, inventory growth persistently exceeding shipment requirements, or evidence that architectural shifts reduce realized content more rapidly than new products compensate. A delayed MRDIMM ramp alone would not invalidate the core thesis, but it would reduce justified valuation if a significant premium had been assigned to that option.
CATALYSTS AND THE DECISIVE MONITORING POINTS
The immediate catalyst is Q4 execution against $130 million of product revenue and approximately $0.88 of non-GAAP EPS at the midpoints. The most informative details will be product-margin recovery, the balance between core RCDs and companion chips, and whether additional inventory continues to support shipments without extending customer lead times.
The next major test is the 2027 opening outlook. H1 seasonality, supplier capacity and the behavior of customers that ordered early will determine whether the Q4 exit rate is a durable foundation or partly a timing effect. Backlog strength becomes more persuasive when accompanied by shipment conversion, stable cancellation behavior and evidence of end-system deployment.
During 2027, MRDIMM qualifications and measurable production contributions should determine how much of the longer-term opportunity deserves inclusion in earnings estimates. Silicon IP monetization can occur earlier in customers’ development cycles, making license activity and program breadth more relevant than waiting for final chip production. LPDDR6 SOCAMM2 remains a later catalyst around 2028, while ChipAgents requires operational evidence before material financial credit is warranted.
The overall conclusion is that Rambus is executing well and has a stronger near-term product outlook than its consolidated growth rate alone suggests. The investment case is supported by expanding conventional memory-interface demand, companion-chip adoption and profitable IP engagement. Its principal vulnerabilities are supplier-cost pressure, imperfect downstream visibility, uncertain new-platform adoption and valuation that could capitalize optionality before it becomes earnings. The quarter strengthens the core thesis, but it also identifies the specific assumptions that should not be extrapolated without further evidence.
COMPANY PARTICIPANTS
• Luc Seraphin, President and Chief Executive Officer. • Sumeet Gagneja, Senior Vice President and Chief Financial Officer.
RESEARCH ANALYST PARTICIPANTS
• Kevin Garrigan, Jefferies. • Gary Mobley, StoneX. • Sebastien Naji, William Blair. • Mark Lipacis, Evercore ISI. • Tristan Gerra, Robert W. Baird. • Kevin Cassidy, Rosenblatt Securities.
Key Read-Throughs
KEY READ-THROUGHS FROM RAMBUS Q3 2026 EARNINGS CALL
Rambus’s results strengthen the case that AI infrastructure spending is broadening beyond accelerators into CPU-based servers, conventional memory modules and increasingly complex silicon designs. The most actionable signal is the expected acceleration in product revenue to 34% year-over-year growth in Q4 despite minimal MRDIMM contributions. However, the call also exposes important differences between module demand, memory-bit demand, supplier profitability and actual end consumption. Customers are preserving module counts while reducing module capacity, semiconductor input costs are pressuring Rambus’s margins, and earlier ordering is improving backlog visibility without resolving uncertainty about downstream inventories. The strongest positive implications concern conventional DDR5 interface suppliers, server processors and advanced semiconductor IP. The strongest negative implications concern aggressive MRDIMM adoption assumptions, unconstrained server-DRAM content forecasts and valuations that treat precautionary ordering as equivalent to final demand. Countries below indicate corporate domicile; magnitude refers to the affected business and consolidated earnings exposure, not a forecast share-price movement.
MEMORY INTERFACE SEMICONDUCTORS: CONVENTIONAL DDR5 CONTENT EXPANSION IS ALREADY MONETIZING, WITHOUT REQUIRING MRDIMM (READ-THROUGH 1)
Affected companies: Montage Technology (688008: China) and Renesas Electronics (6723: Japan). Direction: positive. Magnitude: high strategic relevance for Montage’s concentrated interconnect business; meaningful for Renesas’s memory-interface operations but more diluted at the consolidated level.
The critical evidence is Rambus’s expectation of approximately $130 million in Q4 product revenue, up 34% year-over-year, with management attributing the growth primarily to existing RCD generations and companion chips. Seraphin described the outlook as “34% year-over-year growth based on the core, I would say, RCD and companionships.” MRDIMM remains “very modest.” This is evidence that the conventional memory-interface opportunity is generating substantial revenue before the more speculative architectural transitions become material.
The transmission mechanism is a combination of more populated memory modules, higher-speed RCD generations and increased supporting-chip content. Management highlighted the progression from 8 to 12 to 16 memory channels. A move from 12 to 16 channels increases potential channel count by 33%, although realized module demand depends on population rates and platform mix. RCDs, power-management devices, SPD hubs and temperature sensors can benefit from this expansion without requiring proportional growth in DRAM capacity per module. Renesas’s disclosed portfolio spans these categories, while Montage’s operating exposure is heavily concentrated in interconnect chips.
Montage provides unusually strong independent corroboration. Its October 20 preliminary announcement projected Q3 interconnect-chip revenue growth of approximately 49%, identified higher shipments of DDR5 interface and supporting chips, and anticipated further demand growth in Q4. Interconnect chips represented approximately 98% of its preliminary quarterly revenue, although that category is broader than RCDs alone. Rambus therefore confirms an already-disclosed industry expansion rather than providing the initial evidence for a Montage earnings surprise.
The margin comparison is particularly important. Rambus attributed its approximately 60.4% product margin primarily to supplier-cost pressure, while Montage projected an interconnect gross margin of 68.0% to 68.5%, improving both sequentially and year-over-year. Product mixes and accounting definitions differ, so the figures are not a clean competitiveness comparison. Nevertheless, they demonstrate that Rambus’s margin pressure should not automatically be extrapolated across the entire interface-chip group.
The near-term catalyst is Q4 shipment conversion and the next disclosures on higher-generation RCD mix and companion-chip adoption. The longer-duration driver is rising interface content per server as platforms add channels and memory speeds increase. The cross-portfolio implication is favorable for qualified interface suppliers across China, Japan and the US, but the call does not establish regional share shifts or identify a beneficiary of any specific customer allocation.
MEMORY INTERFACE SEMICONDUCTORS: MRDIMM ADOPTION SHOULD BE MODELED MORE CONSERVATIVELY THAN THE ADDRESSABLE-MARKET NARRATIVE (READ-THROUGH 2)
Affected companies: Renesas Electronics (6723: Japan), Montage Technology (688008: China) and Micron Technology (MU: US). Direction: negative for aggressive adoption and product-mix assumptions. Magnitude: moderate for MRDIMM-specific revenue expectations; limited for immediate consolidated earnings where current contributions remain small.
Management’s clearest qualification was that “the ramp will be shallower in our opinion than the other generations of products.” The reasons were platform-specific introductions, uncertainty about the proportion of systems adopting MRDIMM rather than conventional DIMMs, customer qualification requirements and unfavorable memory economics. Rambus’s strong Q4 growth explicitly does not require a substantial MRDIMM contribution.
The transmission mechanism is delayed monetization of richer module content. MRDIMM introduces multiplexing and additional buffering functionality, creating opportunities for higher interface-chip revenue and differentiated high-bandwidth memory products. However, suppliers realize that opportunity only when compatible processors ship, system vendors qualify the configurations and customers select MRDIMM over conventional alternatives. A large addressable market cannot substitute for those adoption steps.
Renesas has direct exposure through its MRCD and multiplexed data-buffer portfolio, alongside supporting PMICs and other module components. Its July announcement placed production availability for its third-generation MRDIMM chipset in H2 2027. Rambus’s commentary does not contradict that schedule or establish a delay to Renesas’s announced plan. It does reduce confidence in scenarios that assume rapid, broad-based adoption across platforms before customer economics and qualifications are established.
For Montage, the implication is to separate the already-strong conventional DDR5 franchise from incremental MRDIMM upside. For Micron, it argues for caution around the timing of premium server-module mix benefits rather than a reduction in aggregate memory demand. Revenue can remain strong in conventional modules while the richer architecture develops more slowly.
The competitive question is unresolved. An analyst noted that a competitor had secured the initial MRDIMM platform, but Rambus’s response emphasized market timing rather than demonstrating that it had displaced that supplier. Consequently, the call provides no basis for assuming an immediate competitive loss at Renesas or Montage. Equally, early participation in a platform does not guarantee that the entire market will adopt MRDIMM rapidly.
The near-term trading implication is reduced justification for capitalizing a steep MRDIMM ramp into 2027 estimates without shipment evidence. The longer-duration opportunity remains intact. Relevant catalysts are production qualifications, disclosed module shipments and actual adoption across successive CPU platforms during 2027. This is a timing caution, not evidence of canceled platforms or a formal reduction to peer guidance.
DRAM PRODUCERS: MODULE GROWTH IS NOT MEMORY-BIT GROWTH, AND HIGH PRICES ARE ALREADY CHANGING CONFIGURATIONS (READ-THROUGH 3)
Affected companies: Micron Technology (MU: US), SK hynix (000660: South Korea) and Samsung Electronics (005930: South Korea). Direction: negative for unconstrained conventional server-DRAM content assumptions, while near-term pricing can remain positive. Magnitude: potentially meaningful within server DRAM, but not sufficient to establish a consolidated earnings downgrade.
The most important quotation is: “it’s not that people decrease the number of modules, but they tend to decrease the capacity of each one of these modules.” Management attributed that behavior to memory economics. This is a direct indication that customers are protecting bandwidth-oriented configurations while reducing capacity to manage system cost.
The transmission mechanism differs materially between interface-chip suppliers and DRAM producers. Interface-chip demand is substantially linked to the number and configuration of modules. DRAM-bit demand also depends on capacity per module. More modules can therefore support strong RCD shipments while generating much less memory-bit growth. Illustratively, 20% growth in modules combined with a 15% reduction in average capacity produces only 2% growth in installed bits. Those percentages are a sensitivity, not an estimate of the observed market.
This is not a high-conviction outright bearish call on memory earnings. Lower capacity growth can coexist with strong pricing, richer product mix and rising profitability when supply remains constrained. The read-through is specifically negative for models that simultaneously assume unrestricted bit-content growth, rapidly rising prices and no customer adaptation. It also should not be transferred to HBM, whose configurations and demand drivers differ from conventional CPU-attached memory.
The novelty is limited but useful. Micron’s September earnings call had already described strong server-unit growth accompanied by a modestly lower rate of content growth than previously expected because of tight memory supply. Rambus provides independent, module-level corroboration of that adjustment. It is therefore stronger evidence for the mechanism, not a newly discovered reason to cut Micron’s already-reported quarter.
Near-term catalysts are SK hynix’s October 28 results and Samsung’s October 29 earnings discussion, particularly their commentary on conventional DRAM shipments, server configurations and pricing. Samsung’s preliminary profit guidance is already public; the incremental information is the underlying volume, mix and outlook discussion. For Micron, the relevant catalyst is the next update to fiscal 2027 shipments and content assumptions.
The longer-duration implication is that memory spending and useful installed capacity may diverge materially during a tight supply cycle. Across a portfolio, interface-chip strength should not be treated as an interchangeable confirmation of DRAM-bit growth. Conversely, lower capacity per module should not be interpreted as evidence that server deployments or AI infrastructure investment are collapsing.
SERVER PROCESSORS: AGENTIC AI IS EXPANDING CPU-ATTACHED MEMORY DEMAND RATHER THAN SIMPLY REPLACING CPU INFRASTRUCTURE (READ-THROUGH 4)
Affected companies: Advanced Micro Devices (AMD: US) and Intel (INTC: US). Direction: positive. Magnitude: meaningful for EPYC and Xeon demand; moderate incremental consolidated read-through because pricing, market share, supply and other businesses remain important.
Rambus identified orchestration, persistent workloads, tools management and memory management as drivers of higher CPU requirements. Seraphin stated that “the majority of the growth is coming from CPUs with, with standard memory subsystems.” He also described the CPU-to-GPU ratio as moving in Rambus’s favor.
The transmission mechanism is additional CPU-based infrastructure around accelerated workloads. Agent execution requires coordination, data preparation, application logic and access to memory outside the accelerator’s local HBM. Those requirements can increase CPU deployments and favor platforms with greater memory bandwidth, more channels and stronger performance under memory-intensive workloads. AMD and Intel monetize the processor demand; their qualified memory ecosystems help determine how quickly that demand becomes deployed systems.
The distinction between head nodes and the broader CPU estate is important. Rambus characterized LPDDR-based configurations as a smaller portion of the market and conventional DIMMs as the dominant source of growth. This weakens the assumption that growth in specialized accelerator-associated CPU configurations necessarily displaces the broader conventional server opportunity.
However, standard DDR memory is not exclusive to x86. The call supports the end market served by EPYC and Xeon; it does not establish that Arm-based server processors are losing share. Nor does it establish an AMD-versus-Intel share outcome. Rambus’s 34% product-growth outlook also cannot be translated into 34% CPU shipment growth because memory channels, chip content and supplier share contribute to its revenue.
The signal corroborates existing company commentary. AMD’s August release described accelerating EPYC demand, while Intel’s July release reported strong Data Center and AI growth and highlighted agentic infrastructure deployments. Rambus adds a later observation from the memory subsystem, strengthening confidence that the CPU opportunity is supported by actual platform requirements rather than only processor-vendor positioning.
The most immediate catalysts are Intel’s October 29 earnings and AMD’s November 3 earnings. The key variables are CPU demand, shipment capacity and the 2027 outlook, rather than headline data-center revenue alone. AMD’s data-center business also contains accelerators, while Intel’s consolidated outcome includes foundry and other exposures. Over the longer term, the structural positive is a broader CPU workload base; the limiting factors are utilization improvements, workload consolidation and offload to other processors.
ENTERPRISE SERVER HARDWARE: PHYSICAL MEMORY-SUBSYSTEM DEMAND SUPPORTS THE REFRESH CYCLE, BUT DOES NOT VALIDATE HEADLINE REVENUE GROWTH AS UNIT GROWTH (READ-THROUGH 5)
Affected companies: Dell Technologies (DELL: US) and Hewlett Packard Enterprise (HPE: US). Direction: positive for conventional server demand, with important limits on revenue and margin extrapolation. Magnitude: moderate at the server-business level and more diluted at the consolidated level.
The supporting commentary is Rambus’s observation that module counts are increasing even as capacity per module declines, combined with its expectation that conventional CPU systems will generate most of the growth. These are physical configuration signals, not merely higher dollar spending on memory.
The transmission mechanism is demand for complete CPU-based systems used in enterprise refreshes, orchestration and inference-related infrastructure. Dell and HPE can monetize that demand through servers, configuration options, support and related infrastructure. Their exposure is downstream through the server ecosystem; Rambus did not identify either company as the recipient of a particular order or establish a direct customer relationship.
The non-consensus distinction is between genuine infrastructure demand and the magnitude of reported dollar growth. Rambus’s evidence makes an explanation based entirely on memory-price inflation less persuasive. Nevertheless, higher channel counts can increase modules per server without an equivalent increase in server units. The call therefore supports physical infrastructure activity but cannot independently establish OEM unit growth.
This distinction matters against already-reported results. Dell’s September release showed traditional servers and networking revenue increasing 122% year-over-year. HPE also reported strong server growth, and its earnings discussion identified both robust demand and supply constraints. Rambus corroborates the market direction, but provides no basis for applying its own growth rate to those companies or treating their revenue increases as shipment increases.
Margin transmission is also conditional. Higher memory prices can be passed through, absorbed or managed through configuration changes and procurement arrangements. HPE’s recent profitability improvement demonstrates why a blanket conclusion that memory inflation must compress OEM margins would be incorrect. Conversely, continued supply tightness can delay shipments and increase working-capital requirements even when pricing is effective.
The near-term catalysts are the upcoming results covering the October 2026 fiscal quarters, especially unit commentary, traditional-server order conversion, gross profit per system and component availability. The longer-duration positive is a broader role for conventional servers within AI-enabled enterprise infrastructure. The principal cross-portfolio risk is that OEM dollar growth, component shipments and end-system deployment are different measures and should not be counted as independent confirmations of the same growth rate.
SEMICONDUCTOR IP AND DESIGN SOFTWARE: CUSTOM SILICON CREATES EARLIER MONETIZATION OPPORTUNITIES THAN PRODUCTION CHIP SHIPMENTS (READ-THROUGH 6)
Affected companies: Synopsys (SNPS: US) and Cadence Design Systems (CDNS: US). Direction: positive. Magnitude: meaningful for advanced interface and memory IP; modest to moderate at the consolidated level because these are broader businesses and competitive allocation remains unknown.
Rambus reported additional Tier 1 next-generation HBM design wins, increasing interest in PCIe controller and switch IP, and deeper architectural engagement before standards are finalized. Management described customers as “designing increasingly differentiated architectures and tailored silicon optimized for their own environments.” The CFO placed silicon IP growth toward the upper end of the previously communicated 10% to 15% range.
The transmission mechanism is increased demand for validated design building blocks and verification as customers develop more complex custom systems. HBM interfaces, high-speed connectivity, security and integration must be addressed before a chip can reach production. Synopsys and Cadence have direct product exposure to these requirements, rather than merely sharing a broad AI label.
The timing advantage is important. IP licenses and associated engineering activity can monetize during design, before the customer’s finished chip reaches meaningful shipment volume. Design spending can therefore remain strong even while system adoption is constrained by memory supply or platform qualifications. However, licensing terms differ, and design wins should not automatically be treated as recurring royalties on every future chip shipment.
The opportunity is reinforced by previously disclosed peer performance. Synopsys’s August results described a return to year-over-year growth in Design IP and specifically identified memory-interface, wired-interface and security IP within the business. Cadence released its Q3 results on October 26, reporting strong double-digit growth across product categories and record backlog. Rambus is consequently corroborating an established design-demand cycle, not predicting Cadence’s already-announced quarter.
There are clear limits to the read-through. Rambus’s wins could represent competitive displacement in individual programs, so they do not establish that Synopsys or Cadence won the same business. The 35% growth in Rambus’s contract-and-other line is also not an appropriate growth assumption for the entire IP industry, since Rambus’s IP revenue spans multiple accounting categories.
The near-term catalysts are Synopsys’s fiscal Q4 results and subsequent 2027 outlooks, with emphasis on IP bookings, program breadth and integration intensity. The longer-duration positive is greater engineering content per custom system. Rambus’s ChipAgents collaboration does not establish displacement of incumbent EDA tools or a quantified reduction in industry design spending; neither conclusion deserves financial credit from this call.
CROSS-PORTFOLIO SUPPLY-CHAIN RISK: EARLIER ORDERING IMPROVES PLANNING BUT DOES NOT PROVE STRONGER FINAL CONSUMPTION (READ-THROUGH 7)
Affected companies: Rambus (RMBS: US), Montage Technology (688008: China) and Renesas Electronics (6723: Japan). Direction: negative for the evidentiary quality of backlog-based growth assumptions, not evidence of an imminent demand decline. Magnitude: moderate for visibility and valuation; potentially more material for focused interface-chip suppliers if ordering later normalizes.
The decisive exchange concerned downstream inventories. Management acknowledged, “It’s very hard to determine,” before explaining that customers are placing orders earlier. Seraphin summarized the distinction as: “we don’t see people building inventory, but we see people placing backlog.” That is narrower than confirmation that downstream inventories are lean.
The transmission mechanism is a change in order timing. Customers responding to longer supplier lead times can extend procurement horizons without increasing the same proportion of final consumption. Suppliers then see stronger backlog and may build inventory or reserve capacity. If customers subsequently shorten those horizons, bookings can weaken even while underlying end demand remains healthy. Precautionary ordering can therefore amplify both the apparent upturn and a later normalization.
Rambus’s own actions illustrate the balance-sheet consequence. Inventory increased approximately $12 million during Q3, another increase is planned for Q4, and management is using liquidity to protect supply. This strategy has worked operationally: management stated that supplier constraints did not affect Q3 or the Q4 outlook. The negative read-through is therefore not a reason to assume an immediate supply-driven miss. It is a reason to distinguish current execution from the durability of the visible order book.
The risk cannot be transferred mechanically across suppliers. Contract terms, cancellation provisions, customer deposits, product breadth and inventory ownership differ. In particular, memory producers’ disclosed longer-term supply commitments should not be treated as equivalent to Rambus’s unspecified product backlog. Nor does Rambus’s limited visibility prove that Montage or Renesas has the same customer behavior.
The near-term catalyst is the Q4-to-H1 2027 transition, when seasonal patterns, inventory coverage and earlier orders begin to interact. Shipment conversion, cancellations and inventory efficiency will be more informative than backlog growth alone. Over the longer term, suppliers that can maintain availability without excessive inventory commitments should earn better returns on capital. The cross-portfolio implication is to avoid counting stronger CPU demand, higher module shipments and longer component backlogs as 3 fully independent signals when they can reflect different stages of the same procurement cycle.
Report record
- Sector
- Information Technology
- Industry
- Semiconductors & Semiconductor Equipment
- Fiscal period end
- September 30, 2026
- Report date
- October 26, 2026
- Analysis
- 5778 words
- Read-throughs
- 3036 words
- Content fingerprint (PDF)
4dd07c6eeb78- Content fingerprint (analysis)
4ddd35ffd013- Content fingerprint (read-throughs)
5342ca59258e
Prepared from the company's earnings release and earnings call transcript. Figures as reported by the company. For information only. Not investment advice.
More from Rambus Inc.
No other reports yet.
More in Information Technology
Operating Thesis Strengthened; Cash Conversion Remains Unproven
Optical and IP Growth Validated; Cash Conversion Moved the Other Way
All Information Technology reports
Follow @AtlasPeakRes on X for new earnings reports as they publish.