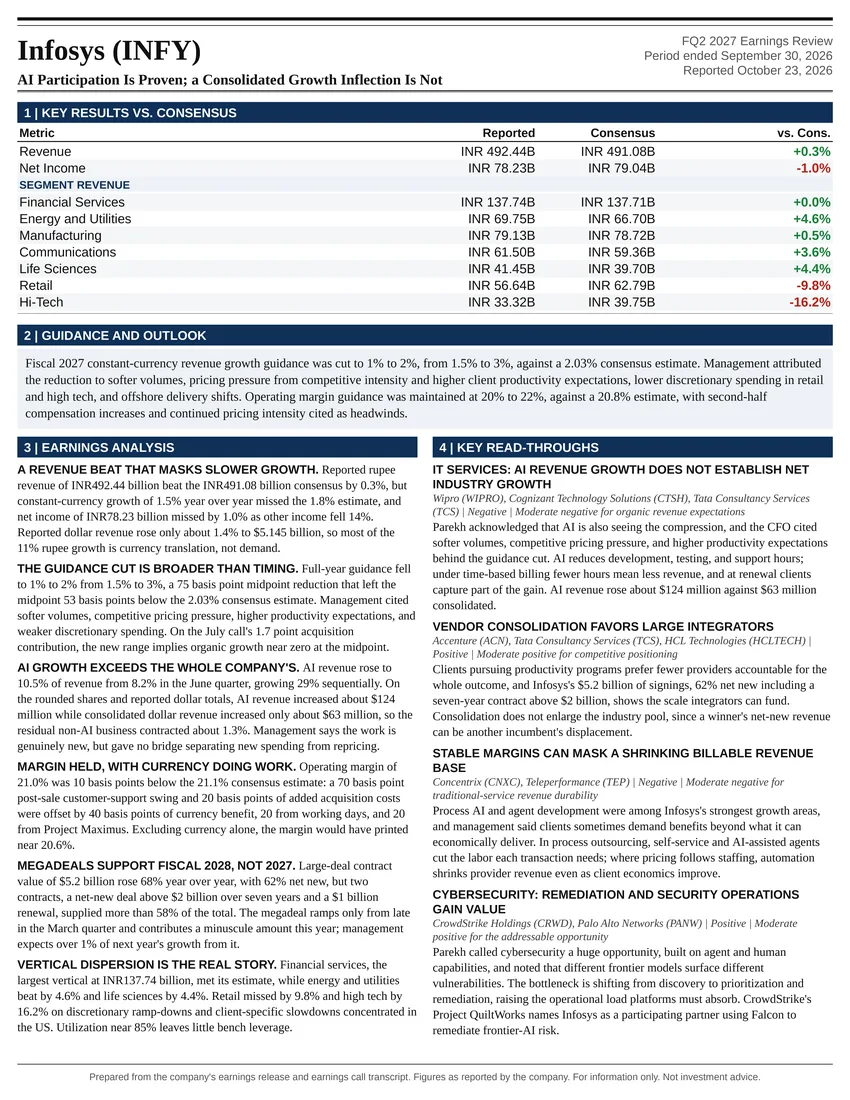
AI Participation Is Proven; a Consolidated Growth Inflection Is Not
Earnings Reports
Nokia Corporation FQ3 2026 Earnings Report
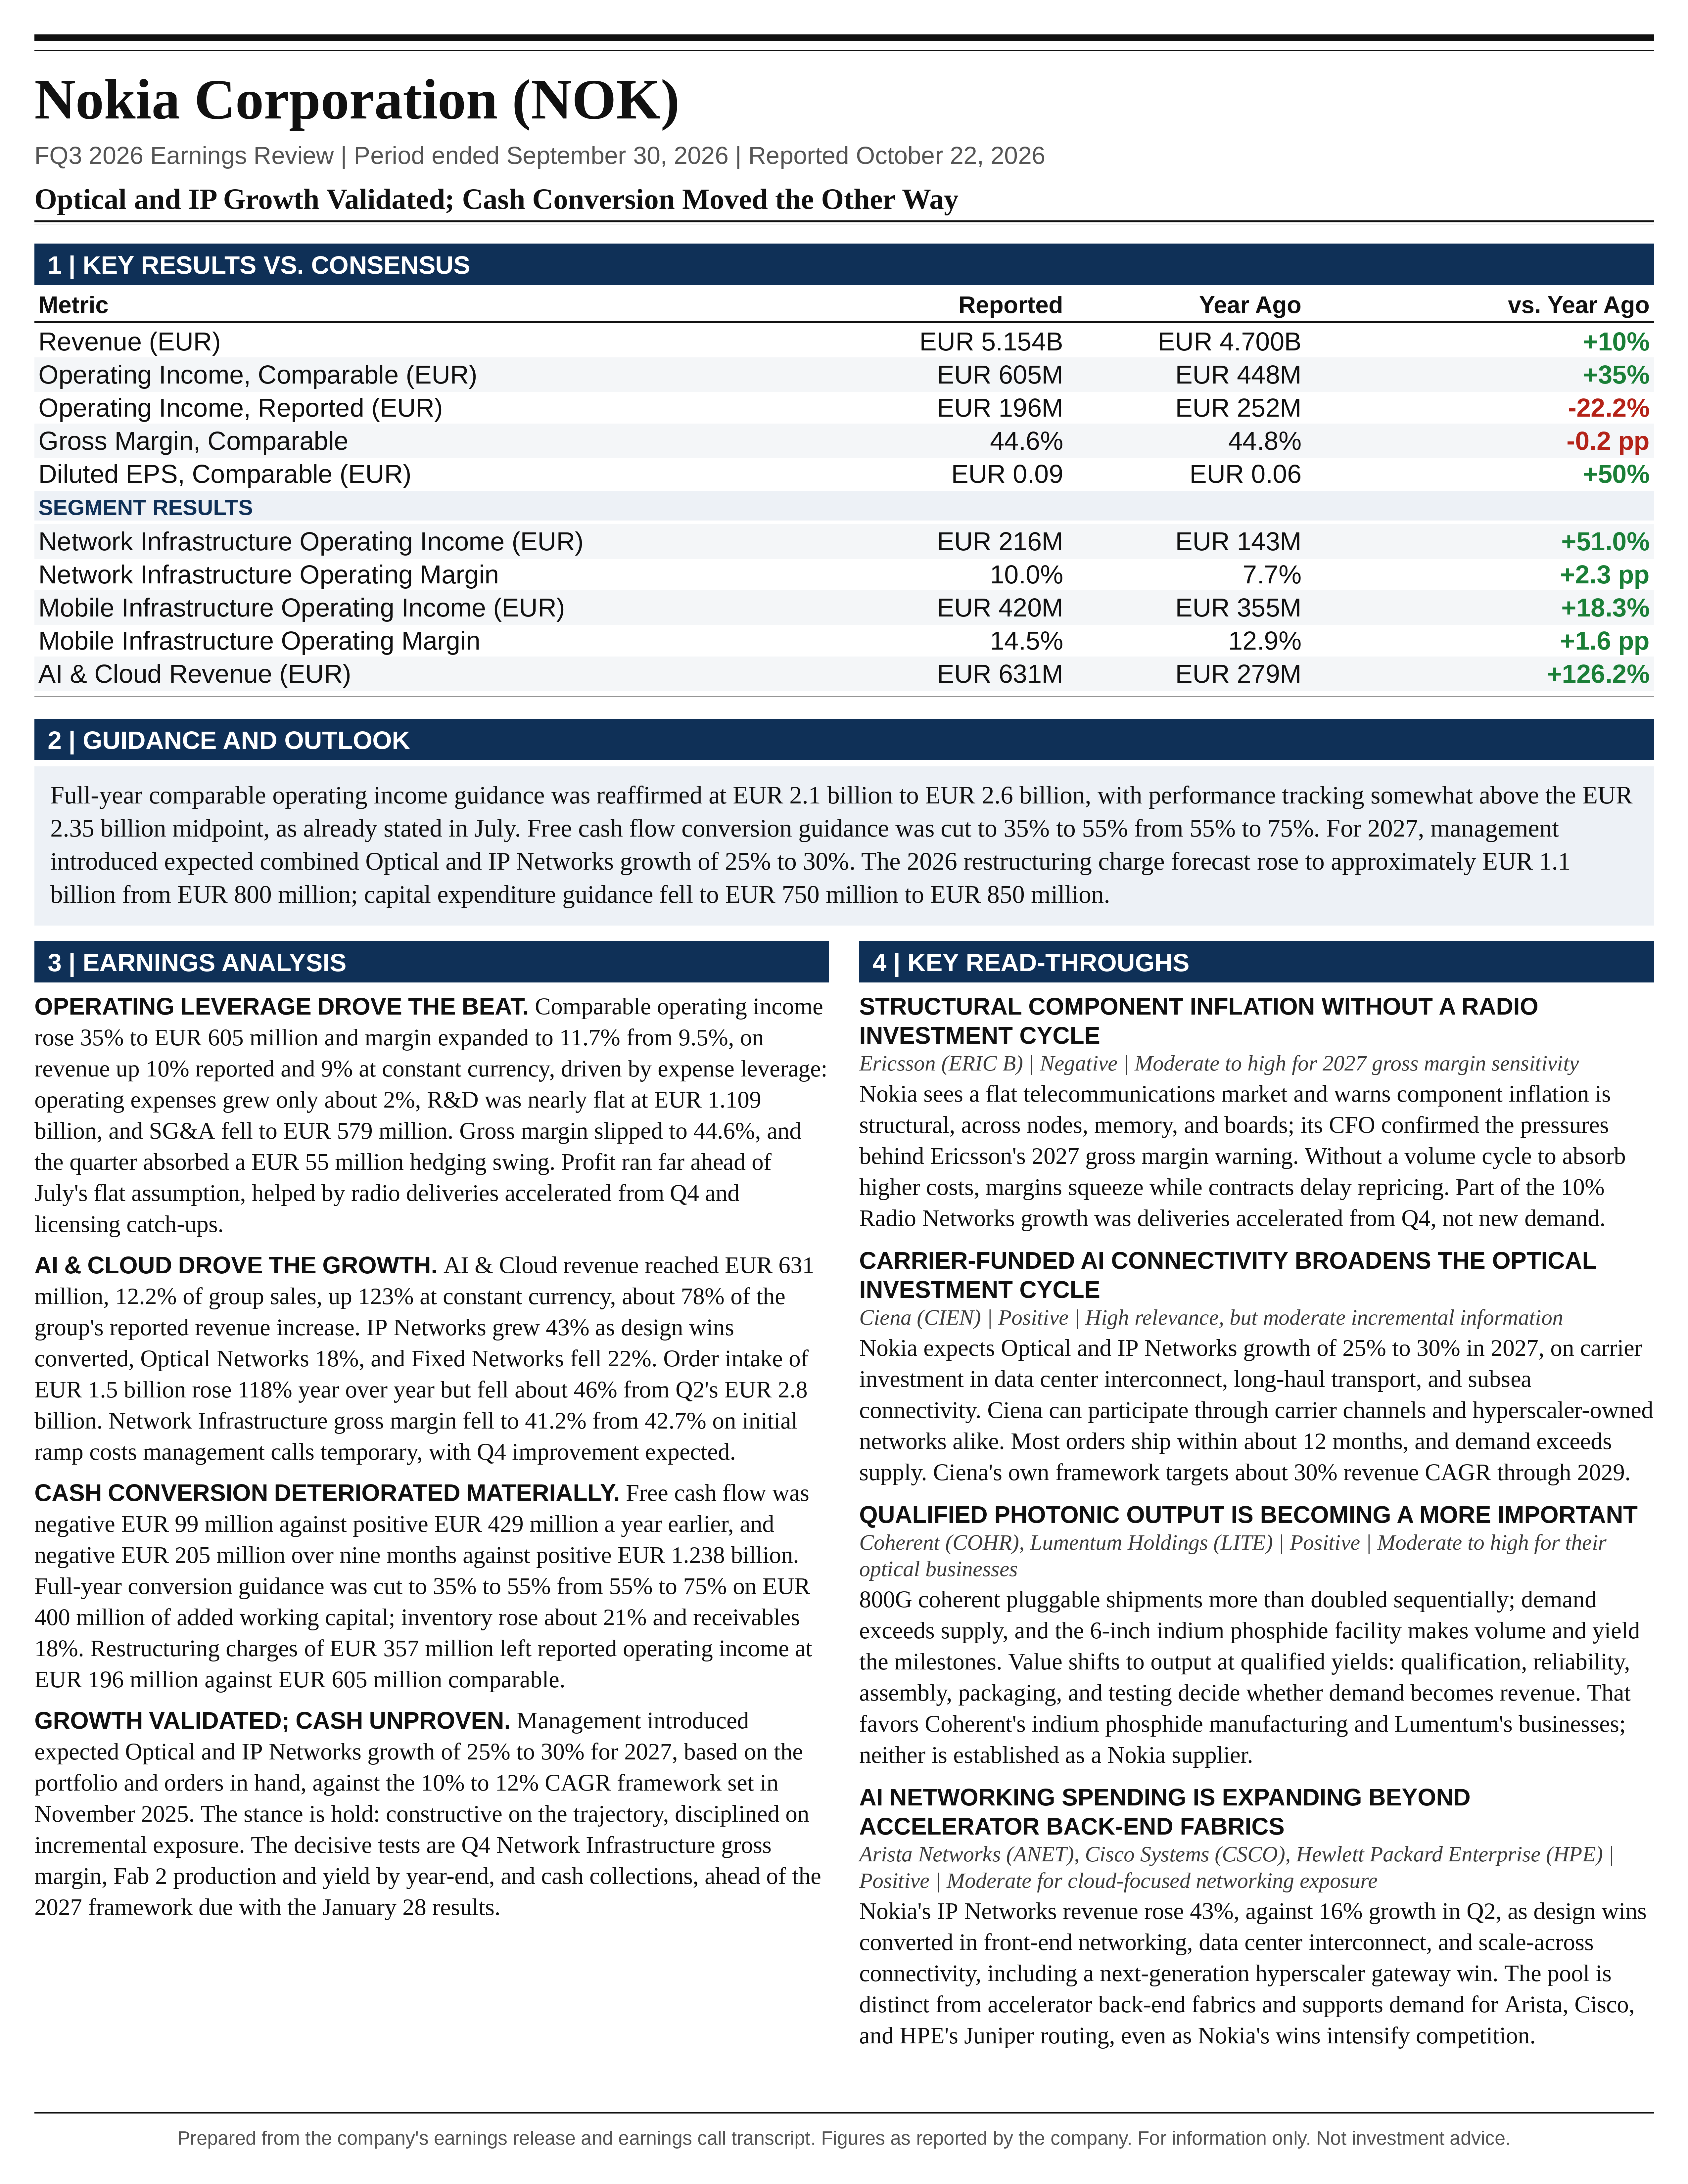
Nokia Corporation (NOK) FQ3 2026 earnings: Optical and IP Growth Validated; Cash Conversion Moved the Other Way. Full earnings analysis, key read-throughs, and the one-page exhibit from Atlas Peak Research.
Nokia Corporation (NOK)
Sector: Information Technology · FQ3 2026 · Period end September 30, 2026 · Reported October 22, 2026
Nokia’s Q3 2026 results strengthen the operating thesis that optical transport and IP networking can become materially larger earnings contributors, but they do not yet establish a corresponding improvement in sustainable cash generation.
Download the one-page report (PDF)
View one-page exhibit
Download analysis (.md)
Download read-throughs (.md)
Post to X
One-Page Exhibit
Earnings Analysis
EXECUTIVE CALL SUMMARY: Nokia (10/22/26)
Nokia’s Q3 2026 results strengthen the operating thesis that optical transport and IP networking can become materially larger earnings contributors, but they do not yet establish a corresponding improvement in sustainable cash generation. The appropriate investment stance is constructive on the business trajectory but disciplined on incremental equity exposure. The quarter supports retaining exposure to the transformation rather than automatically increasing it: comparable operating profit rose 35%, AI & Cloud revenue increased 123%, and management introduced a strong 25%-30% combined Optical Networks and IP Networks growth expectation for 2027. Against that, free cash flow remained negative, full-year cash conversion expectations were reduced substantially, restructuring requirements increased again, and part of the operating outperformance represented revenue accelerated from Q4.
The most important positive development was the conversion of previously announced IP design wins into meaningful revenue. IP Networks grew 43%, compared with 16% in Q2, demonstrating that Nokia’s expansion beyond traditional telecommunications customers is becoming financially consequential. AI & Cloud generated EUR 631 million of revenue, or 12.2% of group sales, and approximately 78% of the group’s reported year-over-year revenue increase. However, consolidated constant-currency revenue growth remained 9%, unchanged from Q2. Growth accelerated within strategically important businesses, not uniformly across Nokia.
The principal negative development was the widening separation between comparable earnings and cash realization. Full-year free cash flow conversion guidance declined to 35%-55% from 55%-75%. At an unchanged EUR 2.35 billion operating profit midpoint, that reduces illustrative annual free cash flow by EUR 470 million, or approximately 31%. The underlying causes are partly constructive, including inventory and supply commitments supporting anticipated growth, but also include additional restructuring payments. This is a real reduction in near-term shareholder cash generation, not merely an accounting presentation issue.
A material guidance inconsistency requires attention. During the Q3 call, management described tracking above the operating profit guidance midpoint as “a signal up from where we were last quarter.” Nokia’s official July 23 Q2 release had already stated that the company remained on track to deliver “somewhat above the midpoint.” The unchanged EUR 2.1 billion-EUR 2.6 billion operating profit range therefore represents a reaffirmation with stronger supporting execution, not a clearly identifiable new upgrade in the expected position within the range. The genuine incremental changes are the stronger Optical and IP growth assumptions, the initial 2027 growth outlook, weaker cash conversion, higher restructuring requirements, and increased expected financial income.
The central investment question has consequently shifted. Evidence that Nokia can win AI-related connectivity business is becoming stronger. The unresolved issue is whether the company can manufacture, deliver, and monetize that business at attractive returns after working capital, capital expenditure, restructuring, and ongoing product investment. The next decisive evidence will come from Q4 Network Infrastructure gross margin, the year-end optical manufacturing ramp, cash collections, and the financial framework accompanying the January 28, 2027 results.
QUARTERLY PERFORMANCE AND THE QUALITY OF THE OPERATING IMPROVEMENT
Nokia reported Q3 revenue of EUR 5.154 billion, compared with EUR 4.700 billion in the prior-year period. Reported growth was 10%, while constant-currency growth was 9%. Comparable operating profit increased to EUR 605 million from EUR 448 million, and comparable operating margin expanded to 11.7% from 9.5%. Comparable gross profit increased to EUR 2.299 billion from EUR 2.109 billion, although gross margin slipped to 44.6% from 44.8%.
The operating improvement was therefore primarily a function of revenue growth and expense leverage, rather than stronger gross profitability per unit of revenue. Comparable operating expenses, including other operating income and expenses, increased approximately 2%, materially below comparable revenue growth of approximately 9.5%. Comparable R&D expense was nearly unchanged at EUR 1.109 billion, while SG&A declined to EUR 579 million from EUR 590 million. This is credible evidence that Nokia is beginning to support a larger revenue base without proportionate increases in its existing operating expense structure.
The improvement was not created by favorable operating currency hedges. The financial report identifies a negative EUR 16 million hedging impact in Q3 2026, compared with a positive EUR 39 million in Q3 2025. That EUR 55 million adverse swing makes the underlying operating progress more substantive than the headline profit growth alone suggests. Conversely, the quarter benefited from radio deliveries accelerated from Q4 and licensing catch-up revenue, limiting the extent to which the earnings level can be treated as a normalized quarterly run rate.
Performance exceeded the company’s own prior profit expectations considerably. In July, Nokia assumed Q3 sales would increase 3%-7% sequentially and comparable operating profit would remain largely flat against Q2 because of software revenue recognition timing. Actual revenue increased approximately 7%, reaching the upper end of that sales assumption. Comparable operating profit increased approximately 39% from Q2’s EUR 434 million. The EUR 171 million sequential profit increase was therefore much larger than the revenue outcome alone would have suggested.
The quarter’s incremental profit was not exclusively an AI infrastructure story. Network Infrastructure operating profit increased EUR 73 million year over year, Mobile Infrastructure increased EUR 65 million, Portfolio Businesses improved approximately EUR 7 million, and Group Common and Other losses narrowed EUR 12 million. Network Infrastructure supplied approximately 47% of the consolidated operating profit increase, while Mobile Infrastructure supplied approximately 41%. The earnings recovery still depends substantially on execution in the legacy telecommunications and licensing businesses.
Historical comparisons require consistent reporting boundaries. Nokia introduced its current segment structure in 2026 and subsequently classified Fixed Wireless Access CPE and Enterprise Campus Edge as discontinued operations. The Q3 financial report provides recast comparative figures, which are the appropriate basis for analysis. Infinera was acquired on February 28, 2025, so its acquisition no longer creates a year-over-year consolidation benefit in Q3 2026. Its effect remains relevant to year-to-date comparisons: Optical Networks’ 29% reported growth over the first 9 months reduces to 19% after currency and portfolio adjustments.
AI & CLOUD: REVENUE VALIDATION IS IMPROVING, BUT BOOKINGS REQUIRE CAREFUL INTERPRETATION
AI & Cloud revenue reached EUR 631 million, compared with EUR 279 million in Q3 2025 and EUR 446 million in Q2 2026. That represents 123% constant-currency growth year over year and approximately 41% reported sequential growth. The customer category increased from approximately 5.9% of group revenue a year earlier and 9.3% in Q2 to 12.2% in Q3. This is now large enough to change consolidated growth, rather than merely provide an attractive narrative around a small business.
The customer classification should not be confused with a separate operating segment or a pure AI revenue measure. AI & Cloud sales overlap principally with Optical Networks and IP Networks and cannot be added to those businesses’ revenue. Cloud infrastructure spending is also not necessarily dedicated to AI workloads. Conversely, Nokia’s AI-related economic exposure extends beyond the category because telecommunications providers are purchasing transport and routing capacity to support data center connectivity. The disclosed 12% share is useful, but neither a complete measure of AI-driven demand nor a measure of AI-specific revenue purity.
Q3 AI & Cloud order intake was EUR 1.5 billion, up 118% year over year. Relative to EUR 631 million of quarterly revenue, that implies an indicative orders-to-revenue ratio of approximately 2.4x. This supports continued backlog accumulation, subject to differences in timing, cancellations, and order scope. It is not a disclosed backlog balance or a guarantee of future revenue recognition.
Sequentially, bookings declined approximately 46% from Q2’s unusually strong EUR 2.8 billion. That decline does not contradict the year-over-year growth or the strong revenue conversion. Management had previously cautioned that large customer commitments would make order intake uneven. The more useful interpretation is that bookings remained materially above shipments after an exceptional Q2, while the business began converting earlier wins into revenue.
Management’s timing commentary provides meaningful visibility, but not a fully scheduled revenue bridge. Hotard stated that “the majority of orders we’ve seen are in a 12-month timeframe,” with some extending beyond 12 months but still largely into 2027. In July, Nokia had said approximately half of Q2’s orders would convert over the following 12 months. These statements concern different order populations and dates; they should not be interpreted as a precise acceleration in the delivery schedule of the same backlog.
The analyst reference to approximately EUR 5 billion of orders over several quarters should likewise not be treated as EUR 5 billion of undelivered backlog. Cumulative order intake includes orders already recognized as revenue. Nokia did not disclose an opening backlog, closing backlog, cancellation rate, customer concentration schedule, or contracted margin profile on the call. Those omissions matter when translating bookings into earnings and valuation.
The strongest statement of near-term demand was Hotard’s observation: “we’re not demand constrained today. So if we could ship more, we would certainly do it.” This supports confidence in available demand, but also identifies the dominant execution risk. Under these conditions, product availability, supplier commitments, manufacturing yields, and customer qualification determine realized growth more directly than incremental sales opportunities.
The 2 additional hyperscaler IP design wins are encouraging, particularly the next-generation data center gateway win. However, design-win counts should not be equated with new customer counts. Hotard explicitly explained that the company evaluates opportunities at the design-win level because each can represent a distinct product revenue stream and lifecycle. Multiple wins at an existing hyperscaler may deepen penetration without improving customer diversification. Customer concentration and bargaining power therefore remain important undisclosed variables.
NETWORK INFRASTRUCTURE: STRONGER SCALE, LOWER GROSS MARGIN
Network Infrastructure generated EUR 2.158 billion of revenue, up 15% at constant currency, compared with 12% growth in Q2. Operating profit increased to EUR 216 million from EUR 143 million, and operating margin improved to 10.0% from 7.7%. Gross profit increased to EUR 889 million from EUR 790 million, but gross margin declined to 41.2% from 42.7%.
The businesses within the segment followed sharply different trajectories. Optical Networks revenue reached EUR 933 million, up 18% at constant currency. IP Networks reached EUR 839 million, up 43%. Fixed Networks declined 22% to EUR 386 million. Optical and IP together represented approximately 82% of Network Infrastructure revenue and 34% of group revenue. Their growing weight makes the segment increasingly sensitive to data center networking demand rather than residential broadband equipment alone.
IP’s acceleration was the clearest positive surprise within the operating portfolio. Optical growth, while strong, moderated from 20% in Q2 to 18% in Q3. Management expects Optical Networks to contribute more to the combined growth opportunity in 2027 as capacity expands. The 43% IP growth rate should therefore not automatically become the recurring assumption for the entire networking portfolio.
The margin performance supports operating leverage, but not yet premium incremental gross economics. Network Infrastructure added EUR 308 million of revenue and EUR 99 million of gross profit year over year, implying approximately 32% incremental gross margin. It added EUR 73 million of operating profit, implying approximately 24% incremental operating margin. The business is generating attractive incremental operating profit despite a gross margin below its historical segment average, because operating expenses are increasing more slowly than revenue.
This distinction is important for evaluating management’s assertion that AI & Cloud is accretive. A business can dilute gross margin while adding operating profit at a rate above the existing operating margin. That is broadly consistent with Q3. It does not, by itself, establish that the incremental business produces superior free cash flow or returns on invested capital after manufacturing and inventory requirements.
Marco Wirén described the gross margin dilution as temporary and stated that “in quarter four we should see improvement in the gross margin levels.” He also said AI & Cloud brings “very strong incremental gross profit” and is accretive to operating margin. The explanation centered on initial product ramp costs, particularly in IP Networks, rather than deterioration in demand.
The written financial report adds that Q4 recovery should be supported by scale benefits and pricing discipline. This is now a specific near-term test of management credibility. A sustained gross margin recovery would support the argument that current dilution reflects temporary industrialization costs. Continued compression despite higher revenue would raise questions about customer pricing, product economics, component inflation, or the actual cost of serving hyperscalers.
The sensitivity is meaningful. At Q3’s Network Infrastructure revenue level, a 150-basis-point gross margin improvement would add approximately EUR 32 million of quarterly gross profit before changes in operating expenses. Conversely, strong sales growth can coexist with disappointing earnings if product mix and component costs absorb those scale benefits.
Management did not provide a quantified 2027 operating expense framework. The CFO’s response emphasized continuing resource allocation and opportunities to improve profitability, but did not specify incremental R&D, engineering support, manufacturing overhead, or hiring requirements. The 25%-30% revenue growth expectation therefore cannot be translated mechanically into a group earnings upgrade using a fixed incremental margin.
2026 GUIDANCE: STRONGER EXECUTION WITHOUT A FORMAL OPERATING PROFIT RAISE
Nokia retained its full-year comparable operating profit range of EUR 2.1 billion-EUR 2.6 billion, using EUR/USD of 1.14 for the remaining period. This is unchanged from Q2 on both the range and currency assumption. The midpoint remains EUR 2.35 billion.
The July increase from EUR 2.0 billion-EUR 2.5 billion to EUR 2.1 billion-EUR 2.6 billion was a technical reporting change associated with excluding discontinued businesses from continuing operations, not an underlying operational upgrade. That distinction prevents a false impression of successive fundamental earnings increases during 2026.
The Q3 call’s description of above-midpoint performance as a new upward signal is not supported by the prior written baseline. The Q2 release already contained that directional expectation. The appropriate interpretation is increased evidence supporting an existing above-midpoint outcome, rather than a newly raised earnings commitment.
The actual growth assumption did improve. Combined Optical and IP Networks are now expected to grow somewhat above the previous 18%-20% assumption for 2026. However, total Network Infrastructure growth remains at 12%-14%. That combination indicates that stronger performance in Optical and IP is being partly offset by weakness or deliberate contraction elsewhere, particularly Fixed Networks.
Q4 sales are expected to increase 20%-24% sequentially. Applied to Q3 revenue, that implies approximately EUR 6.185 billion-EUR 6.391 billion of Q4 sales and approximately EUR 20.590 billion-EUR 20.796 billion of full-year comparable revenue. These are arithmetic implications of the disclosed assumptions, not a separately issued annual revenue range.
With EUR 1.340 billion of comparable operating profit generated through Q3, achieving the full-year midpoint requires EUR 1.010 billion in Q4. Against the implied sales range, that corresponds to a Q4 operating margin of approximately 15.8%-16.3%. Reaching the EUR 2.6 billion upper end requires EUR 1.260 billion of Q4 operating profit and a margin of approximately 19.7%-20.4%.
Those calculations explain why the company did not commit to the upper end despite Q3’s strong result. Q4 must still deliver a substantial seasonal improvement, while radio revenue has been partly accelerated into Q3 and Technology Standards is expected to generate lower revenue than in recent quarters. Normal seasonality supports a large earnings step-up, but the upper end requires a materially stronger conversion outcome than the midpoint.
The increase in expected financial income is separate from operating guidance. Nokia raised its full-year comparable financial income and expenses assumption to positive EUR 300 million-EUR 400 million from EUR 150 million-EUR 250 million, primarily because of venture investment performance. The tax assumption narrowed to approximately 26% from approximately 26%-27%. These changes support EPS without representing additional network operating profit.
At a 26% tax rate and approximately 5.745 billion diluted shares, the EUR 150 million increase in the financial income midpoint corresponds to approximately EUR 0.02 of illustrative after-tax EPS. That contribution should not receive the same valuation treatment as recurring operating earnings from equipment and software.
2027 OUTLOOK: A MATERIAL GROWTH SIGNAL, NOT A COMPLETE FINANCIAL PLAN
The new expectation for combined Optical and IP Networks growth of 25%-30% in 2027 is the most consequential forward-looking disclosure. It implies further acceleration on top of an already strong 2026 revenue base. It also suggests that management sees customer commitments and supply expansion supporting substantially more than a short-lived shipment catch-up.
The scope of the forecast matters. Hotard stated that the 2027 assumption “doesn’t assume anything outside of the portfolio we have and the orders we have.” This reduces dependence on speculative revenue from new markets such as linear pluggable optics, external lasers, or other emerging intra-data-center opportunities. It does not establish that every euro of expected 2027 revenue is already noncancelably contracted, nor that manufacturing capacity is fully qualified.
At Q3’s approximately 34.4% group revenue weight, 25%-30% growth in Optical and IP would contribute roughly 8.6%-10.3% to group growth if all other businesses remained flat and the starting mix were unchanged. This is a static sensitivity, not a full-year forecast. It nevertheless illustrates why the combined businesses can now materially influence Nokia’s consolidated growth profile even without a broad telecommunications spending recovery.
The outlook is substantially stronger than the original November 2025 Capital Markets Day framework, which targeted a 10%-12% combined Optical and IP revenue CAGR over 2025-2028. However, a 2027 annual growth assumption is not directly interchangeable with a multiyear CAGR. Strong growth in 2026 and 2027 raises the possibility that the original strategic revenue assumptions are conservative, but does not constitute a formal revision to all 2028 financial targets.
Management declined to provide a 2028 growth forecast or a corresponding group profit commitment. The original Capital Markets Day targets included EUR 2.7 billion-EUR 3.2 billion of comparable operating profit by 2028, a 13%-17% Network Infrastructure operating margin, and 65%-75% free cash flow conversion. The call improves the revenue case for reaching or potentially exceeding parts of that framework, but the current cash conversion downgrade demonstrates that revenue and cash targets can diverge materially.
The necessary model revisions are therefore asymmetric. Forward Optical and IP revenue assumptions should increase where they remain below management’s new range. Gross margin recovery should be phased rather than assumed immediately. Incremental working capital, manufacturing depreciation, product development expense, and component inflation must also be incorporated. Treating the entire revenue upgrade as high-margin earnings would overstate the evidence.
CASH FLOW: THE MOST IMPORTANT COUNTERWEIGHT TO THE GROWTH THESIS
Q3 free cash flow was negative EUR 99 million, compared with positive EUR 429 million a year earlier and negative EUR 732 million in Q2. The sequential improvement is substantial, but the year-over-year deterioration remains material. For the first 9 months, free cash flow was negative EUR 205 million, compared with positive EUR 1.238 billion in 2025, despite a EUR 316 million increase in comparable operating profit.
Nokia defines free cash flow as operating cash flow less capital expenditure, net of investment grants received. Q3 operating cash flow was positive EUR 95 million and capital expenditure was EUR 194 million, producing the negative EUR 99 million result. This measure is before dividends, acquisitions, and repayment of lease principal. It should not be confused with cash remaining after all shareholder distributions and financing requirements.
The working capital bridge is especially important. Q3 cash outflow classified within changes in net working capital was approximately EUR 563 million. That included approximately EUR 290 million of restructuring-related payments. The remaining approximately EUR 270 million reflected around EUR 230 million of receivables growth and EUR 130 million of inventory investment, partly offset by approximately EUR 90 million of increased liabilities. Restructuring cash must not be subtracted again after using the reported working capital outflow.
The balance sheet supports the conclusion that growth is becoming more capital intensive. Inventory reached EUR 2.880 billion, approximately 21% above September 2025, while trade receivables reached EUR 4.701 billion, approximately 18% higher. Both exceeded reported revenue growth. These comparisons do not prove inventory obsolescence or collection problems because mix, timing, and payment terms also matter. They do identify metrics that must improve as the revenue ramp matures.
The financial report also states that the balance-sheet impact from receivables sales increased during Q3. The amount was not quantified. That limits the ability to assess underlying collection performance independently of financing techniques. Stronger cash conversion would be more persuasive if accompanied by stable or lower reliance on receivables sales.
The full-year free cash flow conversion reduction from 55%-75% to 35%-55% is a 20-percentage-point decline across the range. Management attributed it to an additional EUR 400 million of working capital investment relative to the plan at the start of the year and accelerated restructuring. The company is paying earlier to support future deliveries and a more streamlined operating structure.
At a constant EUR 2.35 billion operating profit assumption, the old conversion midpoint implied approximately EUR 1.528 billion of annual free cash flow. The new midpoint implies approximately EUR 1.058 billion. The approximately EUR 470 million decline is broadly consistent with EUR 400 million of extra working capital, a EUR 100 million increase in the midpoint of restructuring cash payments, and a EUR 50 million reduction in the capital expenditure midpoint. This is an approximate analytical bridge, not a company-provided reconciliation, because the reference periods and other cash assumptions differ.
The year-end cash requirement remains demanding even after the downgrade. Combining the broad operating profit and conversion ranges produces an illustrative annual free cash flow envelope of approximately EUR 735 million-EUR 1.430 billion. Given negative EUR 205 million through Q3, this implies approximately EUR 940 million-EUR 1.635 billion of Q4 free cash flow. At the unchanged operating profit midpoint and the new conversion midpoint, Q4 would need approximately EUR 1.263 billion.
Seasonal collections can support a large Q4 cash release, but this outcome is not assured by the earnings guidance. The company must convert a substantial portion of its existing receivables while continuing to fund growth and restructuring. The updated forecast consequently embeds both an operational recovery and meaningful collection execution.
Capital expenditure guidance declined to EUR 750 million-EUR 850 million from EUR 800 million-EUR 900 million. Importantly, part of that reduction reflects manufacturing cash payments moving into 2027, not reduced manufacturing ambition. The lower 2026 capital expenditure number should not be treated entirely as permanent capital efficiency. Some of the cash burden has moved forward.
Management’s suggestion that working capital pressures will ease also requires qualification. Faster inventory turnover and improved collections can release cash, but sustained 25%-30% growth may require a permanently larger absolute working capital base. Successful growth can therefore continue consuming cash even as operational efficiency improves. The critical measure is working capital intensity relative to revenue and gross profit, not simply whether inventory or receivables stop increasing.
REPORTED EARNINGS, RESTRUCTURING, AND THE ECONOMIC COST OF TRANSFORMATION
Comparable operating profit of EUR 605 million contrasts with reported operating profit of EUR 196 million, down from EUR 252 million a year earlier. Reported operating margin declined to 3.8% from 5.4%. The EUR 409 million difference between comparable and reported operating profit was approximately 68% of comparable operating profit.
The principal adjustment was EUR 357 million of restructuring and associated charges, compared with EUR 44 million in Q3 2025. Additional adjustments included EUR 46 million of acquired asset amortization and depreciation and EUR 8 million of transaction and integration costs. Comparable earnings are useful for understanding the emerging operating structure, but the restructuring costs are economically relevant to the returns required to create that structure.
For the first 9 months, comparable operating profit was EUR 1.340 billion, while reported operating profit was EUR 229 million. Restructuring and associated charges reached EUR 903 million. This is not a small normalization issue. The investment case requires confidence that the current cost burden produces durable savings and that repeated transformation programs do not become a continuing claim on cash.
The 2026 restructuring charge forecast increased to approximately EUR 1.1 billion from EUR 800 million in July, a 37.5% increase. Associated cash outflows increased to EUR 800 million-EUR 900 million from EUR 700 million-EUR 800 million. The changes reflect both acceleration and expanded scope. They should not be described entirely as the same unavoidable costs being paid earlier.
Management expects to achieve the EUR 1.2 billion upper end of the original 2023-2026 gross savings program. That outcome is positive, but it was already identified as the expected result in Q2. Gross savings also do not equal incremental net profit: component inflation, compensation, growth investments, and additional engineering requirements can absorb part of the benefit.
China integration is progressing faster, with management targeting approximately 90% completion by year-end and a 12-24-month overall integration period. The July release had already shortened the original 2-3-year expectation to within 2 years. The Q3 commentary therefore indicates further execution progress rather than an entirely new decision to accelerate the program.
The strategic rationale in China is defensive. Management explicitly linked restructuring to the limited market share available to a Western supplier. Reducing the cost base to reflect that commercial reality can improve returns, but it should not be mistaken for evidence of stronger Chinese demand.
Infinera integration is largely complete, with the EUR 200 million net synergy target expected by the end of 2026 rather than 2027. This validates part of the acquisition rationale and should reduce integration distraction. However, the target cannot be added in full to 2027 profit forecasts as a new benefit because some savings are already embedded in the 2026 cost base. The call did not quantify the remaining incremental 2027 contribution.
EPS also requires normalization. Comparable diluted EPS increased to EUR 0.09 from EUR 0.06, while comparable continuing profit increased 49% to EUR 498 million. Net financial income was EUR 51 million, compared with EUR 38 million. The comparable effective tax rate declined to approximately 25.3% from 32.1%. Faster net profit growth than operating profit therefore reflects favorable below-operating-line factors as well as stronger business performance. Venture investment revaluations remain included in comparable earnings and should not be capitalized as recurring network operating income.
OPTICAL MANUFACTURING: A SOURCE OF ADVANTAGE AND EXECUTION RISK
San Jose Fab 2 is central to converting the demand outlook into 2027 shipments. Management reported approximately 90% completion of process development and recipes, expected 24/7 operations by the end of October, and continued to target production before year-end. The sequence is plausible: continuous operation can support qualification and ramp work before commercial production reaches scale.
The disclosure does not establish manufacturing yield, customer-qualified capacity, or unit economics. Completion of 90% of process development is not equivalent to a 90% yield or 90% readiness for profitable volume output. Hotard acknowledged that volume and yield are the next key milestones, with another update expected in January.
The transition from 3-inch to 6-inch indium phosphide wafers provides a theoretical 4x increase in wafer area, but not an automatic 4x increase in saleable output or a corresponding reduction in unit cost. Defect density, usable area, process uniformity, die size, throughput, qualification, and packaging capacity determine realized economics. Early ramp costs can remain elevated even when the technology roadmap is progressing successfully.
The company is also investing in downstream testing and packaging, which matters because optical capacity is a system rather than a single fabrication bottleneck. Additional wafer output has limited revenue value if assembly, test, modules, electronics, or customer qualification remain constrained.
Chandler is a separate, longer-term capacity option. The July disclosure described initial leased capacity beginning in early 2027, conversion toward indium phosphide production, and expected acquisition of the full NXP site in Q1 2029. On the Q3 call, management emphasized a 2029 timeframe and declined to provide detailed capacity metrics. Chandler should not be credited as the primary solution to 2027 shipment constraints.
Internal optical manufacturing can create differentiation through integration, supply assurance, and customer co-development. It also increases fixed capital exposure and the cost of a demand slowdown. Longer customer planning horizons improve confidence, but the call did not establish take-or-pay commitments or disclose customer financing of the capacity expansion.
MOBILE INFRASTRUCTURE: BETTER EXECUTION, NOT A NEW SPENDING CYCLE
Mobile Infrastructure revenue increased 5% at constant currency to EUR 2.902 billion. Operating profit increased to EUR 420 million from EUR 355 million, and operating margin improved to 14.5% from 12.9%. Gross margin was broadly stable at 47.5%, compared with 47.3% a year earlier, although below Q2’s 49.3%.
Radio Networks revenue increased 10% at constant currency to EUR 1.958 billion. Core Software declined 13% to EUR 519 million. Technology Standards increased 8% to EUR 425 million. This is a mixed result: stronger radio deliveries and licensing offset software weakness, while cost discipline supported profitability.
The radio growth should not be extrapolated as evidence of a new telecommunications capital expenditure cycle. Management explicitly maintained a flat underlying market view. Part of Q3’s strength came from projects completing earlier than expected, transferring revenue from Q4 rather than creating additional full-year demand.
There was some ambiguity in the discussion of customer behavior. Hotard initially described customers accepting available supply earlier because of concerns about future availability. Later, management rejected the characterization of broad pre-buying and emphasized accelerated project completion. These statements can coexist if the behavior is project-specific rather than industry-wide inventory accumulation. Nevertheless, the economic implication is that Q3 benefited from timing and is not a clean measure of underlying demand growth.
Core Software’s 13% decline has both strategic and external causes. Nokia is de-emphasizing selected applications, while server supply constraints are delaying some operator projects. The latter is important because AI investment can simultaneously benefit Nokia’s transport businesses and constrain components required by its traditional customers. AI infrastructure demand is not an unqualified positive across every part of the portfolio.
Technology Standards revenue included catch-up sales and benefited from agreements signed over recent quarters. Management expects slower deal activity and a lower revenue level in Q4. This is a direct caution against annualizing Q3 licensing revenue or assuming normal year-end licensing strength. Because licensing has different economics from equipment, even modest revenue changes can meaningfully affect segment profitability.
Supply inflation presents a broader risk. Hotard stated: “It is not just a shortage, it is also a structural cost increase that we are seeing in the supply chain.” The constraints extend across advanced semiconductor nodes, memory, source materials, and printed circuit boards. Management expects pricing to increase, but did not quantify the timing or completeness of cost recovery.
Price increases are not equivalent to margin protection. Contract duration, competitive conditions, customer budgets, and redesign cycles determine whether Nokia can recover higher costs. Revenue could rise through price while unit volumes weaken. The call therefore supports better commercial discipline, but not a conclusion that 2027 radio gross margin is insulated from component inflation.
AI-RAN: TECHNICAL PROGRESS WITH UNPROVEN COMMERCIAL RETURNS
AI-RAN milestones are strategically meaningful. T-Mobile completed a live voice call over the platform in its production network, while Elisa demonstrated voice, mobile data, and AI workloads running simultaneously in a commercial network. Nokia reported engagement with 19 customers and live spectral efficiency gains exceeding 20%.
These achievements reduce technical risk around deployment in operational networks. They do not yet establish broad commercial adoption, meaningful recurring revenue, or attractive customer economics at scale. Customer engagement is not equivalent to a purchase commitment, and a production-network demonstration is not equivalent to a full network rollout.
The distinction between current results and roadmap aspirations is particularly important. Demonstrated spectral efficiency improvement exceeds 20%, while the roadmap targets approximately 100% improvement in 2028. The latter is a future objective, not an achieved result. The call did not disclose enough about spectrum, traffic conditions, antenna configuration, power consumption, or comparison baselines to independently assess the economic value of either figure.
General-purpose accelerated computing can improve software flexibility and enable new workloads, but may introduce different cost and dependency structures. Full economics depend on processing cost, power per unit of traffic, real-time performance, utilization, software licensing, and the sharing of value between Nokia, NVIDIA, and operators. Higher spectral efficiency can be valuable without automatically producing better vendor margins or lower total network cost.
The proposed software upgrade path to 6G is an attractive architectural claim, but future standards, spectrum requirements, radio hardware, and site conditions may still require additional investment. Similarly, sensing, positioning, robotics, and physical AI applications create potential new services without yet establishing operator willingness to pay.
AI-RAN should therefore remain an option value component rather than the principal basis for 2027 earnings estimates. The nearer-term financial thesis is supported more directly by Optical and IP orders, shipment conversion, and operating leverage.
FIXED NETWORKS, PORTFOLIO SIMPLIFICATION, AND ADJACENT OPPORTUNITIES
Fixed Networks’ 22% revenue decline largely reflected reduced customer-premises equipment volumes. Optical line terminal sales were stable. Management emphasized that the products being reduced were generally margin-dilutive rather than loss-making. Eliminating them therefore removes some positive gross profit as well as revenue, and does not mechanically create an equivalent increase in operating earnings.
The investment rationale is better resource allocation, reduced exposure to lower-return products, and a more attractive revenue mix. The immediate margin benefit is limited by the relatively small size of the affected business and the time required to complete existing contracts. This explains why portfolio pruning did not offset the gross margin pressure from new AI & Cloud product ramps.
Nokia’s approximately 45% optical line terminal port share excludes China and should not be interpreted as global revenue share. Its new 16-port line card supporting 10G, 25G, and 50G PON, together with SoftBank’s deployment, supports the competitive position in access networking. Reuse of existing fiber and coexistence with earlier technologies can improve customer upgrade economics, but does not eliminate the need for equipment investment.
Passive optical out-of-band management is a potentially attractive extension of that technology base into data centers. Management’s claim of approximately 50% lower energy consumption applies to the proposed management-network architecture, not to total data center electricity use. With an initial design win announced in Q2 and additional engagements underway, the opportunity remains too early for material independent revenue attribution.
Portfolio exits are advancing, but their cash effects should not be overstated. The Fixed Wireless Access transaction closed on October 1, after quarter-end. Nokia received an equity interest and warrants in Inseego and made an associated USD 10 million investment. The transaction is not simply a conventional cash disposal. The Enterprise Campus Edge sale agreement was signed in October, with closing expected in the first half of 2027. The discontinued businesses’ losses are already excluded from continuing comparable operating profit, so their eventual disposal should not be counted again as a new operating earnings uplift.
The Google relationship supports Nokia’s relevance to large-scale optical and IP deployments, but Google’s EUR 13 billion Finland investment is not Nokia’s contract value. The call did not disclose the associated Nokia revenue commitment. Similarly, ICEYE and sovereign satellite communications provide strategic optionality, initially oriented toward European government and defense needs, rather than a quantified near-term North American revenue catalyst.
BALANCE SHEET, VALUATION IMPLICATIONS, AND PORTFOLIO EXPOSURE
Nokia ended Q3 with EUR 5.023 billion of cash and interest-bearing financial investments and EUR 2.584 billion of net cash, down EUR 192 million sequentially and EUR 794 million from year-end 2025. The balance sheet remains a source of flexibility, but the decline shows that growth and restructuring are consuming part of that flexibility.
Nokia’s net cash definition excludes lease liabilities. Including approximately EUR 935 million of lease obligations would produce an analytically adjusted net cash figure of approximately EUR 1.649 billion. This is not the company’s reported measure, but it is relevant when comparing enterprise value and capital intensity across businesses with different lease structures.
The valuation implication is a partial, conditional improvement in business quality. A larger Optical and IP contribution can support stronger growth, customer diversification, and differentiated technology exposure. However, Nokia remains a mixed business: Mobile Infrastructure represented approximately 56% of Q3 revenue and generated EUR 420 million of operating profit, compared with EUR 216 million from Network Infrastructure. Applying a premium AI infrastructure valuation to all consolidated earnings would ignore that composition.
A segment-based valuation framework is more appropriate. Optical and IP can justify higher growth assumptions if backlog converts at attractive margins. Radio and Core Software require a more mature-market framework. Technology Standards should be valued on normalized licensing income rather than catch-up quarters. Corporate costs, continuing restructuring requirements, manufacturing investment, and the liquidity available after lease obligations must remain explicit.
The stock’s economic factor exposure is also changing. Greater reliance on hyperscaler spending increases sensitivity to AI capital expenditure expectations, optical component capacity, and technology investment sentiment. Traditional telecommunications exposure may moderate some demand cyclicality, but does not eliminate correlation with an existing AI infrastructure portfolio. Nokia should not automatically be treated as diversification from optical suppliers, data center networking vendors, or semiconductor equipment exposure merely because its historical identity is telecommunications equipment.
OPERATING SCENARIOS AND INVESTMENT DECISION FRAMEWORK
A base case with a 50% analytical probability assumes combined Optical and IP growth of 25%-30% in 2027, broadly flat traditional telecommunications demand, successful but gradual Fab 2 ramping, and improving product economics. Under this scenario, Network Infrastructure gross margin recovers toward approximately 42.5%-43.5%, operating margin progresses toward approximately 11.5%-12.5%, and group free cash flow conversion recovers to approximately 55%-65%. These are analytical assumptions, not company guidance. The investment outcome would be supported by higher earnings and improving confidence in cash realization, but would not require immediate achievement of the original long-term margin ceiling.
A bull case with a 25% probability assumes combined Optical and IP growth exceeds 30%, manufacturing capacity becomes available ahead of conservative delivery schedules, and new product margins improve without proportionate operating expense growth. Network Infrastructure gross margin could move toward approximately 44%-45%, operating margin toward approximately 13%-14%, and group cash conversion toward 65%-75%. This would make the growth profile and cash economics reinforce each other, supporting a more substantial valuation improvement.
A bear case with a 25% probability assumes strong demand is not converted efficiently because of yield delays, component shortages, customer rescheduling, or unfavorable pricing. Combined Optical and IP growth could fall to approximately 10%-20%, while Network Infrastructure gross margin remains around 40%-41.5% and operating margin around 8%-10%. Cash conversion could remain approximately 35%-45% as working capital and restructuring absorb operating cash. The adverse equity outcome would arise from both lower earnings and a reduced willingness to value the company as an AI infrastructure beneficiary.
The scenario distribution favors continued operating growth, but not an unconditional rerating. The principal upside catalyst is the combination of stronger shipments, recovering gross margin, and lower working capital intensity. The principal downside mechanism is strong reported revenue accompanied by persistent cash absorption and a widening need for excluded restructuring charges.
The immediate investment action supported by the call alone is HOLD rather than an automatic increase in exposure. Incremental allocation should remain 0% until valuation is assessed against normalized cash generation and the existing portfolio’s AI infrastructure concentration. A numerical share-price target, entry level, or price stop would be unsupported without a verified contemporaneous valuation and position context.
Operational review triggers are more clearly established. Failure to improve Network Infrastructure gross margin in Q4 would challenge management’s temporary-ramp explanation. Failure to enter Fab 2 production by year-end would challenge the supply assumptions supporting 2027. Another material reduction in cash conversion, continued receivables and inventory growth materially above sales, or further restructuring expansion without quantified incremental benefits would weaken the quality-of-earnings thesis. A sustained reduction in the 25%-30% combined growth expectation would require reassessment of both earnings and valuation assumptions.
The next major catalyst is the January 28, 2027 results release, when Q4 cash generation, year-end manufacturing milestones, and the 2027 financial framework should become clearer. The relevant investment horizon is 12-18 months, covering the conversion of current orders, manufacturing scale-up, and evidence that restructuring benefits persist. The decisive measure of success is not another increase in AI-related bookings alone. It is whether those bookings produce higher operating profit, stronger free cash flow, and attractive returns on the capital required to deliver them.
COMPANY EMPLOYEES ON THE CALL
• Justin Hotard, President and Chief Executive Officer. • Marco Wirén, Chief Financial Officer. • David Mulholland, Head of Investor Relations.
RESEARCH ANALYSTS ON THE CALL
• Rob Sanders, Deutsche Bank. • Simon Leopold, Raymond James. • Artem Beletski, SEB. • Daniel Djurberg, Handelsbanken. • Sami Sarkamies, Danske Bank. • Richard Kramer, Arete. • Emil Immonen, DNB Carnegie. • Felix Henriksson, Nordea. • Jakob Bluestone, BNP Paribas. • Janardan Menon, Jefferies. • Sandeep Deshpande, JPMorgan.
Key Read-Throughs
KEY READ-THROUGHS FROM NOKIA’S Q3 2026 EARNINGS CALL
Nokia’s call supports a widening AI connectivity investment cycle, but not a broad telecommunications equipment recovery. The strongest positive implications concern optical transport, cloud routing, photonic components, and infrastructure connecting geographically dispersed computing resources. The strongest negative implications concern conventional radio equipment margins and incumbent optical suppliers facing a more competitive Nokia. A central cross-market distinction is emerging between demand beneficiaries and profit beneficiaries: AI & Cloud revenue increased 123%, yet Nokia’s Network Infrastructure gross margin declined 150 basis points and full-year cash conversion expectations were reduced. Available capacity, pricing discipline, and capital efficiency are therefore becoming more important than order growth alone. The impact assessments below describe business and earnings relevance, not projected share-price returns.
TELECOMMUNICATIONS EQUIPMENT
STRUCTURAL COMPONENT INFLATION WITHOUT A RADIO INVESTMENT CYCLE CREATES A DIFFICULT MARGIN EQUATION (READ-THROUGH 1)
Affected company: Ericsson (ERIC B: Sweden). Directional impact: Negative. Magnitude: Moderate to high for 2027 gross margin sensitivity, although the incremental news is corroborative rather than entirely new.
The decisive evidence is the combination of Nokia’s flat telecommunications market outlook and its warning that component inflation is structural. Hotard stated: “It is not just a shortage, it is also a structural cost increase that we are seeing in the supply chain.” Management identified constraints across advanced semiconductor nodes, memory, source materials, and printed circuit boards. When specifically asked about Ericsson’s 2027 gross margin warning, Nokia’s CFO confirmed similar pressures.
The transmission mechanism is higher equipment production cost without a sufficiently strong volume cycle to absorb it. Existing contracts can delay repricing, while customers operating within fixed capital budgets may respond to higher prices by buying fewer units or postponing projects. Product redesign and restructuring can mitigate the pressure, but neither provides immediate protection against broad-based component increases.
Nokia’s 10% Radio Networks growth should not be interpreted as evidence against this concern. Management attributed part of the performance to deliveries accelerated from Q4 and explicitly rejected the existence of an imminent investment cycle. Some Q3 strength therefore represents a change in shipment timing rather than additional annual demand.
Ericsson’s October 15 results had already identified component costs as a 2027 gross margin headwind. Nokia’s independent confirmation makes the risk harder to dismiss as company-specific. However, it does not justify applying Nokia’s exact margin or restructuring profile to Ericsson.
Near-term trading relevance centers on avoiding an overly bullish extrapolation from Q3 equipment shipments and monitoring the next gross margin guidance. The longer-duration issue is whether equipment vendors can recover structural inflation through pricing without sacrificing volumes. Nominal revenue growth could become increasingly price-driven, weakening its usefulness as a signal of underlying market recovery.
The cross-portfolio implication is clear: optical transport growth and radio equipment recovery are different investment exposures. The former is receiving incremental AI-related demand; the latter remains dependent on cost control and commercial execution in a broadly flat market.
MEMORY AND SEMICONDUCTORS
AI-RELATED SCARCITY IS REACHING CONVENTIONAL INFRASTRUCTURE, SUPPORTING MEMORY PRICING DURABILITY (READ-THROUGH 2)
Affected companies: Micron Technology (MU: United States), SK hynix (000660: South Korea), and Samsung Electronics (005930: South Korea). Directional impact: Positive. Magnitude: Moderate incremental confirmation for memory earnings durability, with greater dilution at Samsung because of its diversified operations.
Nokia explicitly included memory in its description of broadening supply constraints. It also reported that some Core Software projects were delayed because operators could not obtain the required server infrastructure. Hotard contrasted the current environment with the narrower shortages of 2021 and described customers providing longer procurement visibility.
The transmission mechanism is tighter component availability and stronger supplier bargaining power extending beyond dedicated AI accelerator systems. If conventional networking and server purchasers face constrained access to memory, suppliers can benefit through firmer pricing, longer customer commitments, and reduced pressure to discount available output.
This is an important distinction from an investment thesis focused exclusively on HBM. Nokia’s commentary indicates that AI infrastructure demand is affecting procurement elsewhere in the technology ecosystem. It does not establish that Nokia purchases HBM, that all delayed servers are memory-constrained, or that specific production capacity has been diverted between memory products.
The most useful signal is downstream purchasing behavior. Nokia is asking customers for 12-18 months of visibility rather than operating primarily around shorter ordering cycles. That is consistent with an environment in which component availability increasingly determines delivery schedules.
The near-term catalyst is corroboration in memory suppliers’ subsequent pricing, allocation, and customer commitment commentary. The longer-duration implication is a stronger negotiating position for scarce component suppliers relative to equipment manufacturers that cannot immediately pass through costs.
This creates a portfolio asymmetry: stronger memory economics can coexist with weaker telecommunications equipment margins. Long positions in memory suppliers and infrastructure equipment manufacturers should not automatically be treated as independent beneficiaries of the same AI spending cycle.
OPTICAL TRANSPORT AND PHOTONIC COMPONENTS
CARRIER-FUNDED AI CONNECTIVITY BROADENS THE OPTICAL INVESTMENT CYCLE (READ-THROUGH 3)
Affected company: Ciena (CIEN: United States). Directional impact: Positive. Magnitude: High fundamental relevance, but moderate incremental information because Ciena already has an aggressive growth framework.
Nokia expects combined Optical and IP Networks growth of 25%-30% in 2027 and indicated that Optical Networks could contribute more as manufacturing capacity expands. Management also described telecommunications providers increasing investment in data center interconnect, long-haul transport, and subsea connectivity to serve AI and cloud demand.
The transmission mechanism extends beyond equipment sold directly to hyperscalers. Carriers and backbone operators are purchasing transport capacity to connect computing facilities and provide services to cloud customers. Ciena can therefore participate through multiple customer channels rather than relying exclusively on hyperscaler-owned networks.
Hotard’s observation that connectivity can improve utilization of constrained compute is particularly important. A shortage of computing capacity does not necessarily reduce networking investment. When resources are distributed across locations, additional connectivity can improve access to those resources and increase their economic utilization.
Nokia’s statement that most orders are scheduled within approximately 12 months, with much of the remainder extending into 2027, supports a multiquarter shipment opportunity. Its assertion that demand exceeds supply also suggests that supplier-specific delivery weakness should not automatically be interpreted as deteriorating end demand.
Ciena’s September 2026 investor forum already established an approximately 30% revenue CAGR objective from 2026 through 2029. Nokia’s outlook is independent validation of a strong market, not a mechanical reason to raise Ciena above its own targets. Different product mixes, customer exposures, and forecast periods prevent a direct comparison.
The near-term catalyst is increased confidence in forthcoming order and backlog conversion commentary. The longer-duration benefit is a broader optical investment cycle spanning hyperscalers and telecommunications providers. The key qualification is competitive: Nokia is both confirming the market opportunity and increasing its ability to capture it.
QUALIFIED PHOTONIC OUTPUT IS BECOMING A MORE IMPORTANT DIFFERENTIATOR THAN DEMAND VISIBILITY (READ-THROUGH 4)
Affected companies: Coherent (COHR: United States) and Lumentum Holdings (LITE: United States). Directional impact: Positive for optical demand and the strategic value of available production capacity. Magnitude: Moderate to high for their optical businesses, with less certainty around near-term free cash flow.
Nokia reported that 800G coherent pluggable shipments increased more than 2x sequentially and that demand continues to exceed supply. Management emphasized the importance of its new 6-inch indium phosphide facility, while identifying manufacturing volume and yield as the next critical milestones.
The transmission mechanism is the increased value of components that can actually be delivered at qualified yields. Announced fabrication capacity is not equivalent to customer-approved output. Process qualification, reliability, assembly, packaging, and testing determine whether available demand becomes recognized revenue.
Coherent’s established indium phosphide manufacturing capabilities and Lumentum’s laser and optical component businesses provide exposure to this industry constraint. The positive read-through is to the broader optical ecosystem. The call does not establish that either company supplies Nokia’s particular 800G products, and Nokia’s internal manufacturing expansion should not be treated as an outsourced order for them.
Hotard’s statement that “we’re not demand constrained today” shifts the focus toward manufacturing execution. Suppliers with reliable output can capture business that competitors with equally strong order books cannot deliver. This favors demonstrated production capability over capacity announcements alone.
The qualification is capital intensity. Nokia is investing an additional EUR 400 million in working capital and has reduced expected cash conversion despite stronger operating earnings. Growth can require inventory, supplier commitments, and manufacturing investment before customer cash is collected. The exact burden differs across companies, but the call argues against equating strong bookings with immediate cash generation.
The near-term catalysts are shipments, manufacturing yields, and customer qualification milestones. The longer-duration risk is the industry supply response. Nokia’s San Jose ramp and subsequent Chandler plans increase prospective capacity, limiting the case for treating current shortages as permanent pricing power.
NOKIA’S OPTICAL DESIGN WINS CHALLENGE ASSUMPTIONS OF UNCHANGED INCUMBENT SHARE AND PRICING (READ-THROUGH 5)
Affected companies: Cisco Systems (CSCO: United States), particularly Acacia and optical networking, and Ciena (CIEN: United States). Directional impact: Negative for competitive assumptions. Magnitude: Moderate within the affected optical franchises, but low at Cisco’s consolidated earnings level.
The evidence is specific: Nokia now has 29 customers with 800G coherent pluggable design wins, secured a significant line-system win with a large hyperscaler, and has 3 Multi-Rail design wins, with initial customer shipments underway. Management described these as areas in which Nokia and Infinera had historically been underpenetrated.
The transmission mechanism is an expanded set of qualified suppliers. As Nokia converts design wins into reliable production, customers gain additional sourcing options. That can reduce incumbent pricing flexibility, increase competitive bidding, and raise the engineering and commercial effort needed to retain subsequent platform awards.
Cisco’s Acacia coherent optics and multi-rail line-system portfolio overlap directly with the categories Nokia discussed. Ciena also competes across coherent interconnects and optical transport. This is therefore a product-specific competitive read-through rather than a generic inference from Nokia’s AI positioning.
However, the call did not identify a displaced supplier or prove that an incumbent lost an existing contract. Some wins may represent additional capacity or customer diversification of supply. Nokia’s claimed 25% Multi-Rail density advantage also remains a management assertion rather than independently demonstrated superiority across all customer configurations.
The near-term impact is constrained by Nokia’s own supply limitations and the strength of overall demand. The more significant effect should emerge through 2027 production ramps and future procurement cycles.
For Ciena, the positive market read-through and negative competitive read-through coexist. The market can expand strongly while Nokia’s participation reduces the share of incremental spending available to incumbents. For Cisco, the competitive issue is relevant to optical growth assumptions but insufficient on its own to establish a negative consolidated earnings outlook.
CLOUD ROUTING AND DATA CENTER NETWORKING
AI NETWORKING SPENDING IS EXPANDING BEYOND ACCELERATOR BACK-END FABRICS (READ-THROUGH 6)
Affected companies: Arista Networks (ANET: United States), Cisco Systems (CSCO: United States), and Hewlett Packard Enterprise (HPE: United States), through Juniper routing. Directional impact: Positive for addressable demand. Magnitude: Moderate for cloud-focused networking exposure and smaller at the consolidated level for diversified Cisco and HPE.
Nokia’s IP Networks revenue increased 43%, compared with 16% in Q2, as earlier design wins converted into revenue. Management identified demand in front-end networking, data center interconnect, and scale-across connectivity, and disclosed a next-generation hyperscaler data center gateway win. It also cited telecommunications routing wins in Japan, Europe, and the United States.
The transmission mechanism is investment in network layers connecting users, applications, storage, cloud services, and geographically distributed computing resources. These purchases are distinct from the specialized back-end networks connecting accelerators inside a training cluster.
Arista’s cloud networking and interconnect exposure, Cisco’s routing and switching portfolio, and HPE’s Juniper routing business participate in this broader spending pool. The call supports a networking opportunity that is wider than accelerator switching alone.
The geographic evidence is also relevant. Although management associated substantial telecommunications transport investment with U.S. data center demand, routing awards extended across Japan and Europe. The opportunity is not confined to a single domestic hyperscaler construction cycle.
The competitive qualification is important. Nokia’s 2 additional hyperscaler design wins demonstrate that an expanding market is attracting credible supply. Management emphasized that individual design wins can represent separate product revenue streams. Customer relationships therefore do not necessarily guarantee participation in every subsequent platform.
The near-term catalyst is evidence that front-end, gateway, and interconnect spending is converting into revenue across vendors. The longer-duration shift is the broadening of AI networking expenditure across multiple layers of the network. The high-conviction conclusion is demand expansion, not a particular vendor’s future market share.
FIBER NETWORKS AND CONNECTIVITY INFRASTRUCTURE
DISTRIBUTED COMPUTE INCREASES THE ECONOMIC RELEVANCE OF INTERCITY NETWORKS (READ-THROUGH 7)
Affected company: Lumen Technologies (LUMN: United States). Directional impact: Positive for demand and strategic asset relevance. Magnitude: Moderate to high over several years, with more limited certainty around near-term cash generation.
Nokia described growing telecommunications investment in east-west traffic, long-haul transport, and data center interconnect. It specifically cited work with Zayo on an architecture for connecting distributed inference across data centers. Hotard explained that more distributed computing requires additional connectivity to meet latency, performance, security, and locality requirements.
Lumen’s backbone and private connectivity offerings address the same broad requirement. The transmission mechanism is greater demand for dedicated connectivity and capacity connecting geographically dispersed computing facilities. Existing routes, rights of way, network reach, and the ability to activate service on useful timelines become more valuable when customers need access to multiple computing locations.
The non-obvious implication is that compute scarcity can increase the value of networking. If customers cannot consolidate all required resources at a single site, connecting distributed resources may become an important way to improve utilization. Networking investment can therefore remain attractive even when individual data center projects face constraints.
The Nokia-Zayo relationship is not a Lumen contract. Zayo is a competitor, and its involvement demonstrates both market demand and competing supply. The positive read-through is to the economic relevance of Lumen’s infrastructure, not an assumed share of Nokia’s disclosed orders.
The near-term catalysts are customer commitments, service activation, and conversion of contracted capacity into revenue. The longer-duration benefit is improved utilization and monetization of network assets. Cash generation can lag because construction and equipment spending occur before services are activated.
For portfolio construction, this exposure differs from a conventional telecommunications recovery. The relevant driver is enterprise and cloud connectivity demand, not an acceleration in consumer mobile subscriptions or residential broadband spending.
PHYSICAL NETWORK EXPANSION SUPPORTS FIBER AND CONNECTIVITY DEMAND, BUT NOT IN DIRECT PROPORTION TO BANDWIDTH (READ-THROUGH 8)
Affected company: Corning (GLW: United States). Directional impact: Positive for Optical Communications. Magnitude: Moderate, with a predominantly multiyear transmission.
Nokia stated that distributed intelligence creates “more data centers in more locations,” requiring more optical and IP capacity. It also highlighted data center interconnect, long-haul transport, and Multi-Rail optical architectures.
The transmission mechanism is physical network expansion: additional locations, diverse routes, parallel fiber paths, and higher-density connectivity. Corning participates through fiber, cable, and connectivity products rather than Nokia’s coherent processing technology. Corning’s March 2026 product announcements specifically included high-density cable for campus and long-distance data center interconnection, confirming relevant product exposure.
The crucial limitation is that bandwidth growth does not translate directly into new fiber volume. Coherent upgrades can increase capacity over existing fiber, and improved density can reduce some physical requirements per unit of bandwidth. Nokia’s 800G shipment growth therefore cannot be applied proportionately to Corning revenue.
The stronger evidence is architectural rather than simply numerical. More computing locations require additional connections, while route diversity and parallel infrastructure can create demand that cannot be satisfied solely by upgrading electronics on an existing path.
The near-term catalysts are customer deployment schedules and orders for optical connectivity infrastructure. The longer-duration benefit is a larger physical network footprint supporting AI and cloud services. The call does not identify Corning as the supplier for Nokia’s specific deployments or establish a quantified earnings uplift.
ACCELERATED COMPUTING AND AI-RAN
LIVE-NETWORK VALIDATION EXPANDS NVIDIA’S TELECOMMUNICATIONS OPTION, WITHOUT YET JUSTIFYING A MATERIAL EARNINGS UPGRADE (READ-THROUGH 9)
Affected company: NVIDIA (NVDA: United States). Directional impact: Positive. Magnitude: Low for near-term consolidated earnings, potentially significant strategically over a multiyear horizon.
Nokia reported a T-Mobile live voice call using AI-RAN in a production network and an Elisa demonstration combining voice, mobile data, and AI workloads. Management cited more than 20% demonstrated spectral efficiency improvement and engagement with 19 customers. Nokia’s anyRAN software runs on NVIDIA’s Aerial RAN Computer.
The transmission mechanism is potential migration of radio processing toward accelerated computing platforms. Successful commercial adoption would extend NVIDIA hardware and software into infrastructure that historically relied more heavily on specialized proprietary processing.
Running radio and AI workloads on a common platform also creates a potential utilization benefit. Operators could support additional applications at distributed network locations rather than dedicating all computing resources exclusively to radio functions. NVIDIA’s October 21 announcement independently corroborated the operator activity.
The high-conviction positive is reduced technical risk, not established commercial economics. Production-network demonstrations show that the architecture can operate in real environments. They do not establish deployment scale, operator returns, recurring software revenue, or a contribution sufficient to alter NVIDIA’s consolidated earnings outlook.
The approximately 100% spectral efficiency improvement targeted for 2028 is a roadmap objective, not the current demonstrated result. Full economics remain dependent on hardware cost, energy consumption, processing utilization, real-time performance, and customer adoption.
The near-term catalysts are commercial commitments and conversion of trials into deployments. Because several milestones were announced before Nokia’s call, they should not be treated as entirely new information. The longer-duration implication is an expanded accelerated-computing platform opportunity in telecommunications.
An automatic negative conclusion for alternative radio vendors or processor suppliers is not supported. The call does not establish a universal architecture winner or the displacement of a named competitor.
WIRELESS BROADBAND EQUIPMENT AND CORPORATE TRANSACTIONS
INSEEGO GAINS TRANSFORMATIONAL SCALE, BUT REVENUE ACCRETION AND EQUITY VALUE CREATION ARE NOT EQUIVALENT (READ-THROUGH 10)
Affected company: Inseego (INSG: United States). Directional impact: Positive for revenue scale, customer access, and strategic positioning; uncertain for near-term EPS and free cash flow. Magnitude: High relative to Inseego’s existing business.
Nokia confirmed completion of the Fixed Wireless Access business sale to Inseego. Inseego’s October 1 closing announcement stated that the acquisition is expected to approximately double revenue and expand its carrier footprint across Europe, the Middle East, Asia, Oceania, and the Americas.
The transmission mechanism is direct: Inseego acquires products, customer relationships, engineering capabilities, and geographic reach that would otherwise require substantial organic investment. Nokia also agreed to refer suitable FWA opportunities, including opportunities associated with broader Nokia deployments. Those referrals provide commercial access, but are not guaranteed purchase commitments.
The ownership and financing structure qualifies the benefit. Nokia received approximately 1.9 million shares, representing approximately 11% ownership, and warrants for approximately 0.8 million additional shares. The closing announcement also identified Nokia’s USD 10 million investment and an additional USD 10 million engineering-support payment scheduled for October. These arrangements provide support and alignment, alongside dilution and execution obligations.
The acquired business also brings operating requirements. Approximately 250 people were identified as supporting the expanded platform, including personnel under transition arrangements. Integration, engineering, inventory, and customer support can absorb part of the revenue benefit. Approximately doubling revenue does not imply approximately doubling earnings.
Nokia’s discussion of reducing lower-margin optical customer-premises equipment should not be used as a direct profitability proxy for the FWA business sold to Inseego. Those are different product categories and reporting boundaries.
The transaction had already closed before Nokia’s earnings call, making confirmation less important than subsequent operating disclosure. The near-term catalysts are Inseego’s consolidated outlook, customer retention, integration costs, and working capital requirements. The longer-duration opportunity is a broader global wireless broadband platform. The decisive test is whether acquired scale produces sustainable margins and cash flow rather than higher revenue alone.
Report record
- Sector
- Information Technology
- Fiscal period end
- September 30, 2026
- Report date
- October 22, 2026
- Analysis
- 6669 words
- Read-throughs
- 3266 words
- Content fingerprint (PDF)
9dd79278f8d7- Content fingerprint (analysis)
6daf9acc02e4- Content fingerprint (read-throughs)
4e35409d18c3
Prepared from the company's earnings release and earnings call transcript. Figures as reported by the company. For information only. Not investment advice.
More from Nokia Corporation
No other reports yet.
More in Information Technology
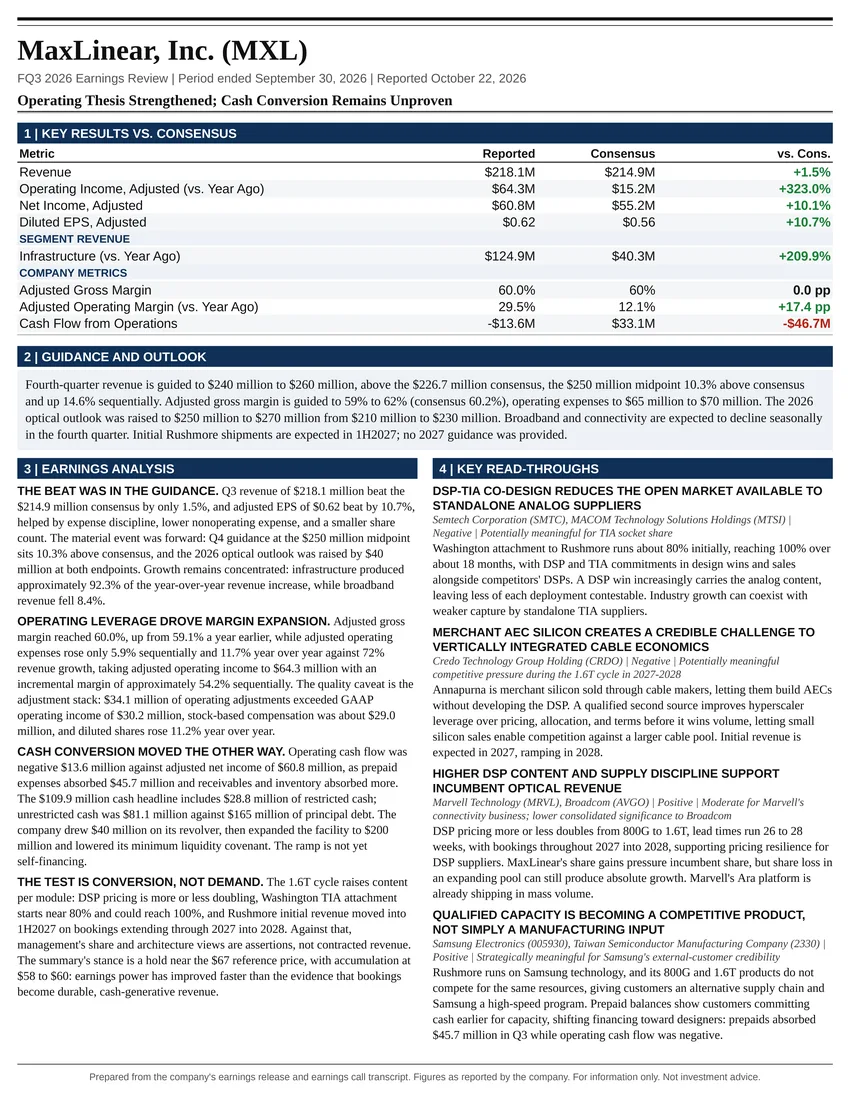
Operating Thesis Strengthened; Cash Conversion Remains Unproven
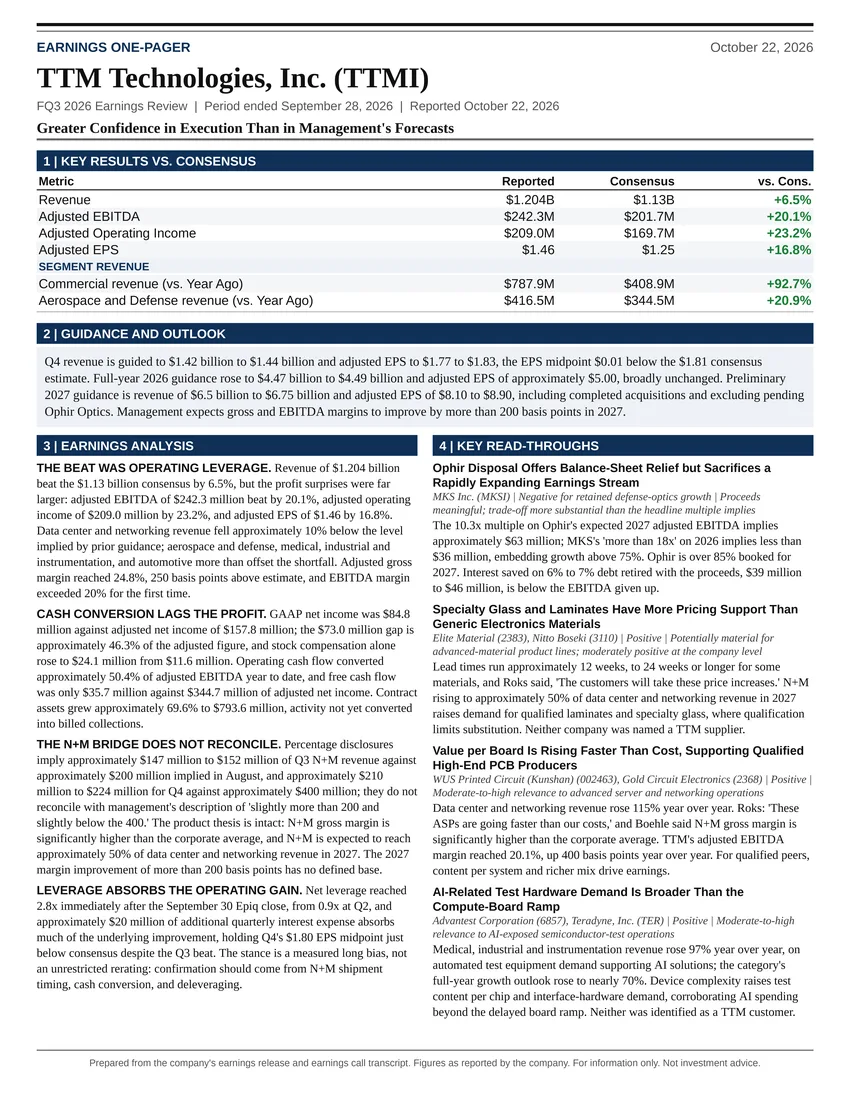
Greater Confidence in Execution Than in Management's Forecasts
All Information Technology reports
Nokia Corporation on the Atlas Peak ticker page
Follow @AtlasPeakRes on X for new earnings reports as they publish.