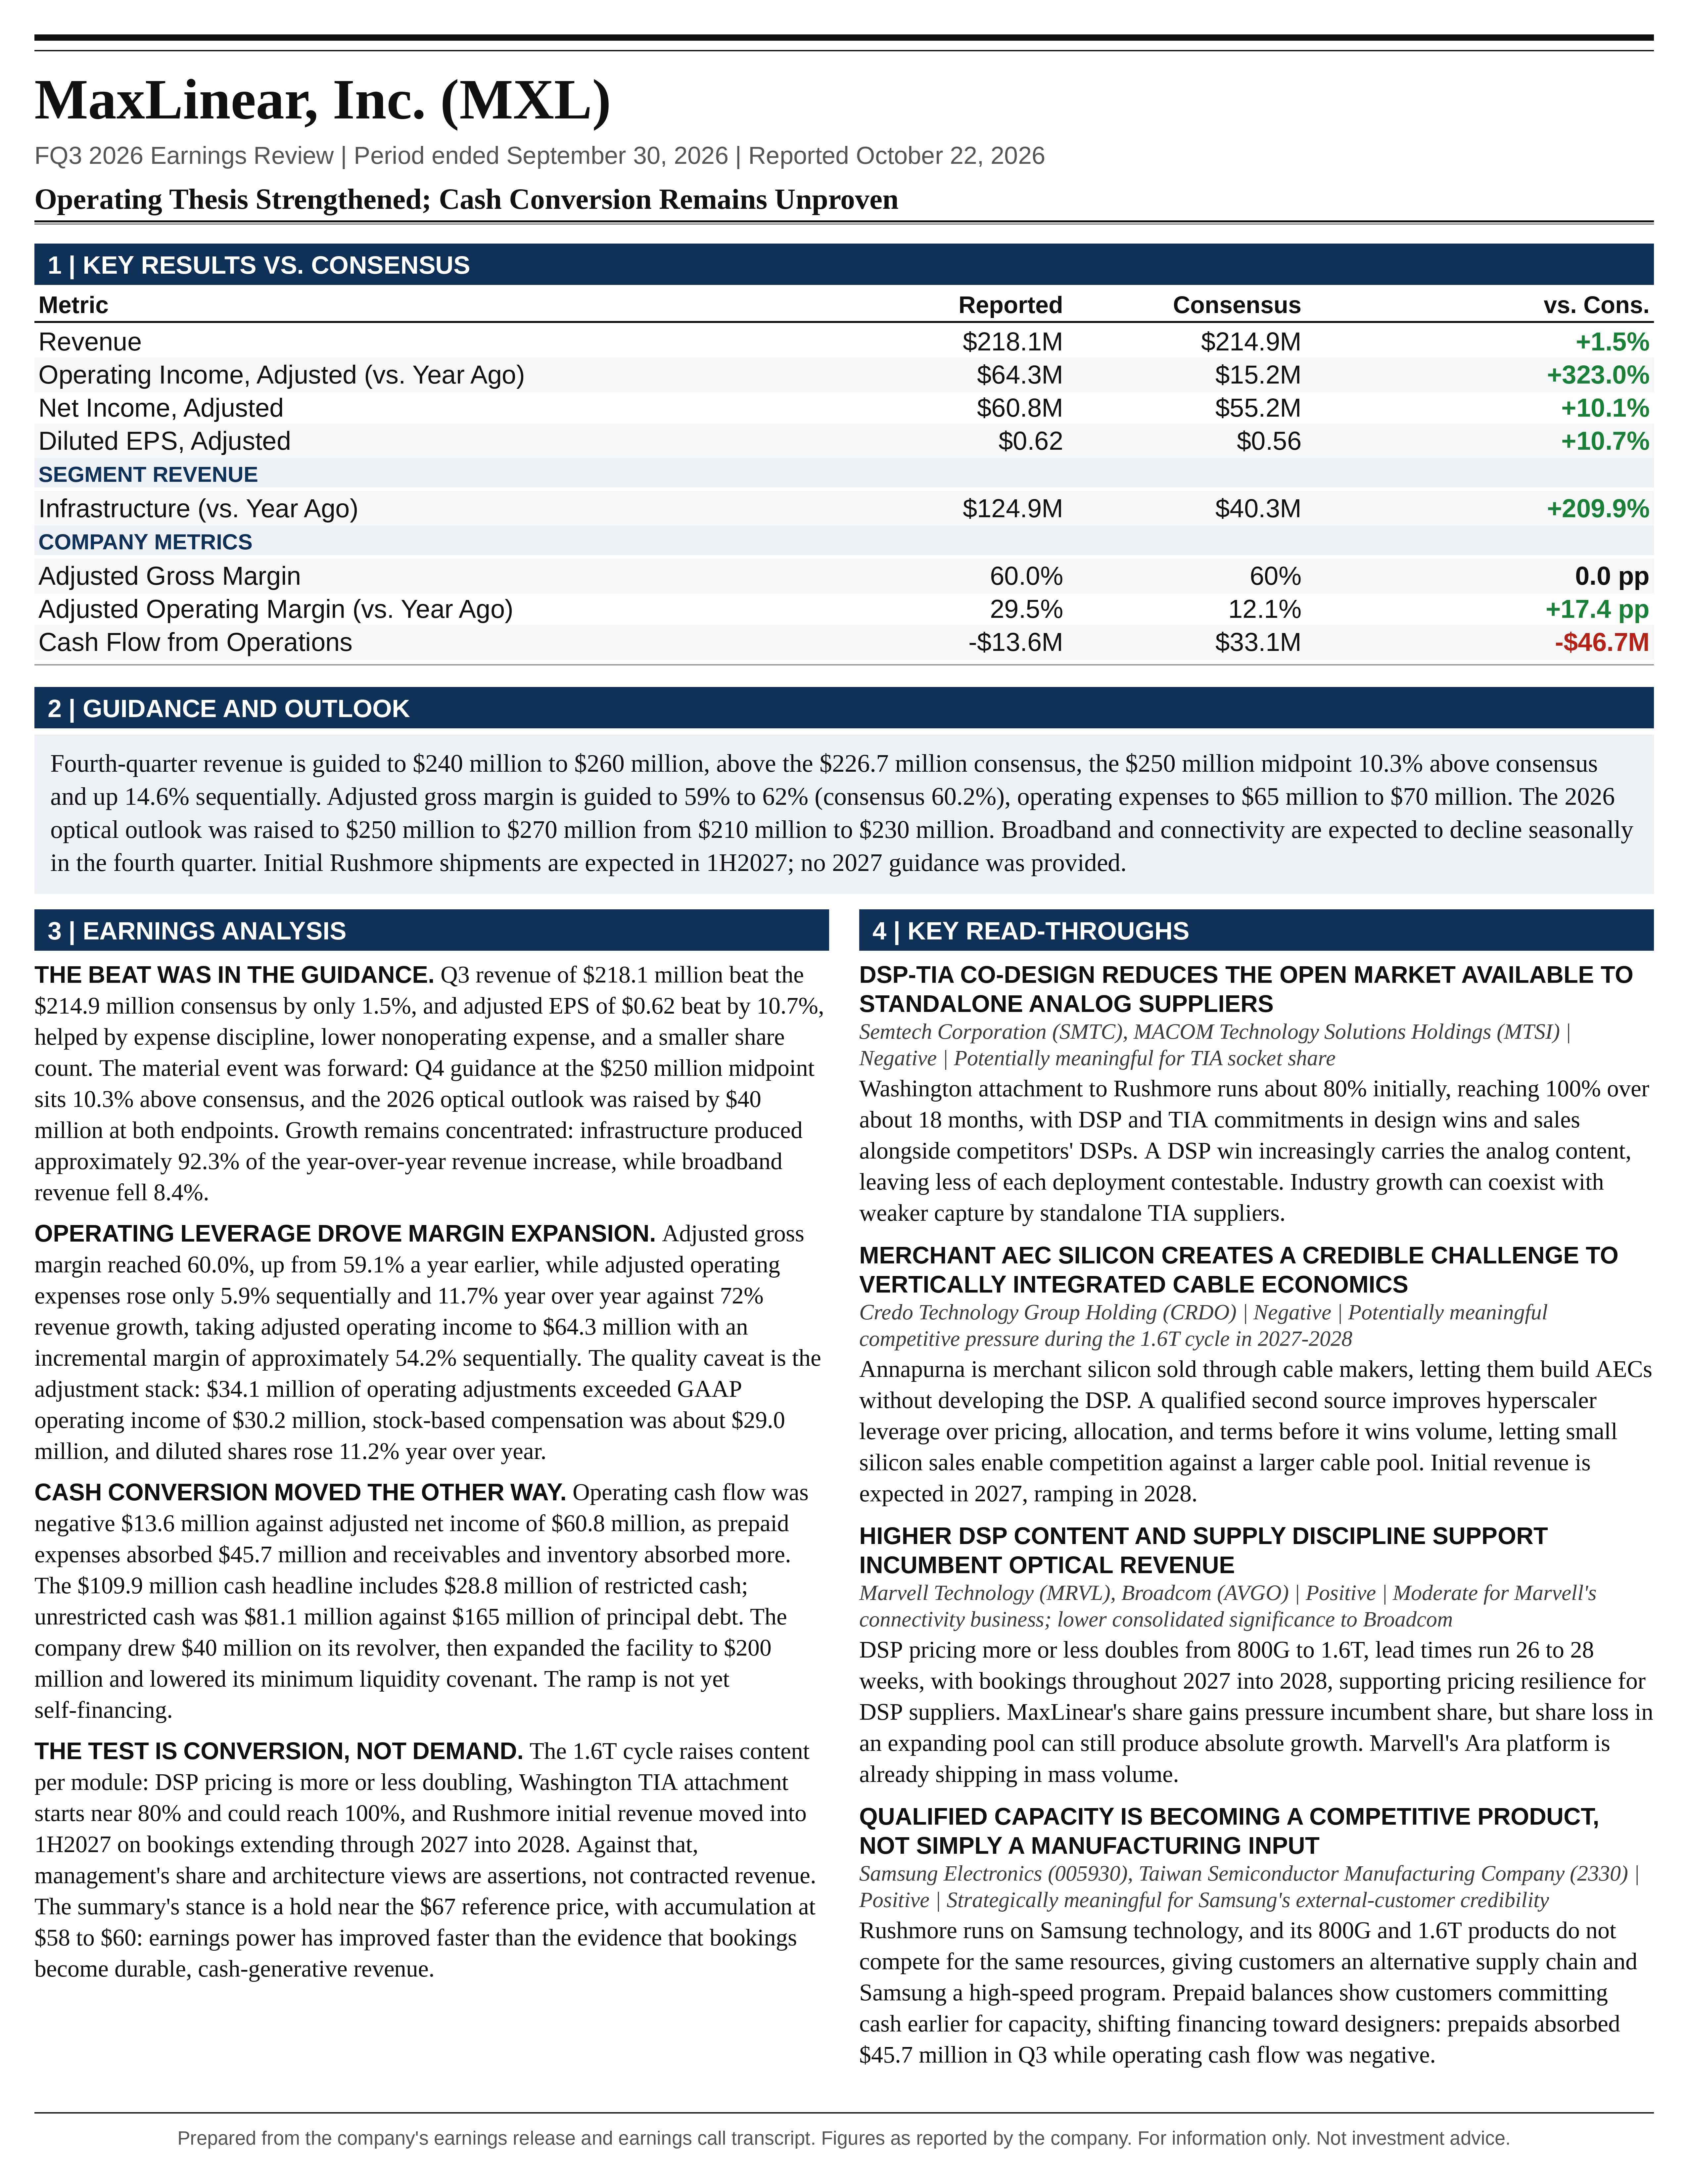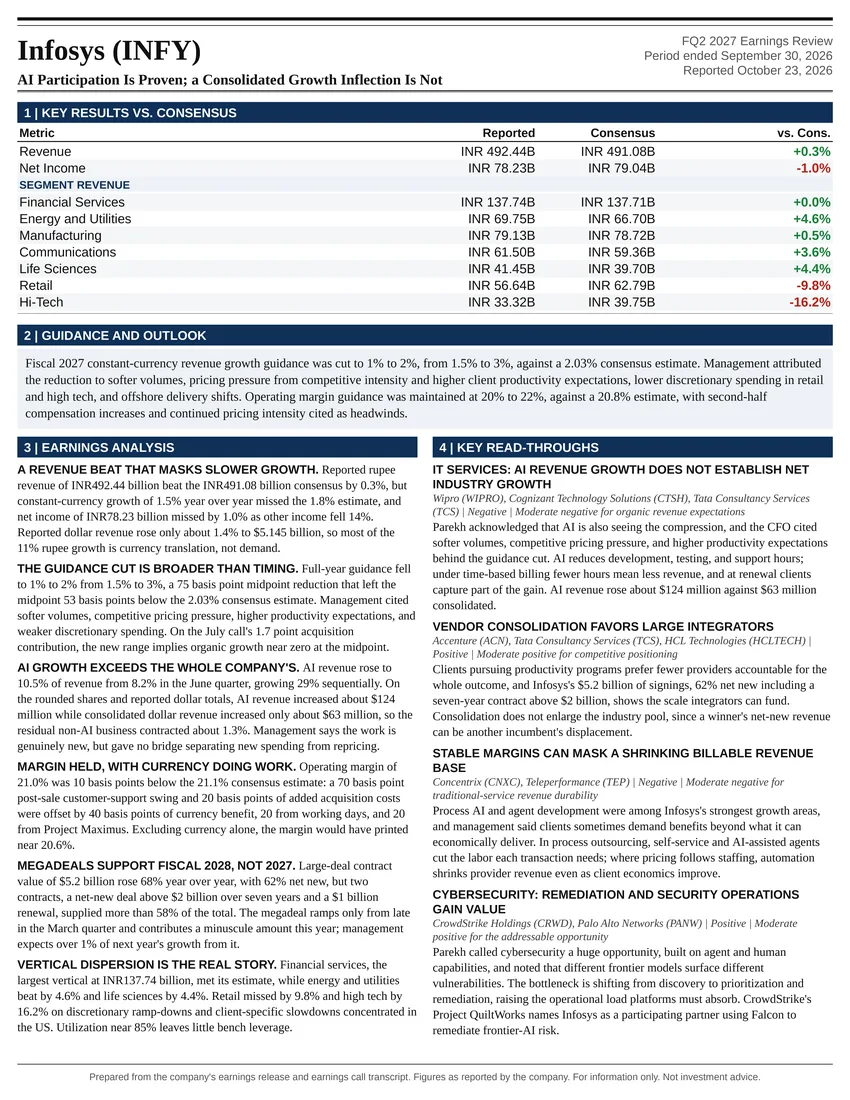
AI Participation Is Proven; a Consolidated Growth Inflection Is Not
Earnings Reports
MaxLinear, Inc. FQ3 2026 Earnings Report
MaxLinear, Inc. (MXL) FQ3 2026 earnings: Operating Thesis Strengthened; Cash Conversion Remains Unproven. Full earnings analysis, key read-throughs, and the one-page exhibit from Atlas Peak Research.
MaxLinear, Inc. (MXL)
Sector: Information Technology · FQ3 2026 · Period end September 30, 2026 · Reported October 22, 2026
MaxLinear’s Q3 2026 earnings call materially strengthened the operating thesis, with accelerating optical connectivity revenue, substantial operating leverage, another increase in the 2026 optical outlook, and earlier initial shipments anticipated for the 1.6T product cycle.
Download the one-page report (PDF)
View one-page exhibit
Download analysis (.md)
Download read-throughs (.md)
Post to X
One-Page Exhibit
Earnings Analysis
EXECUTIVE CALL SUMMARY: MaxLinear Inc. (10/22/26)
MaxLinear’s Q3 2026 earnings call materially strengthened the operating thesis, with accelerating optical connectivity revenue, substantial operating leverage, another increase in the 2026 optical outlook, and earlier initial shipments anticipated for the 1.6T product cycle. The appropriate investment distinction is between improving earnings power and the price paid for that improvement. An indicative HOLD stance near the Bloomberg notice’s $67 after-hours reference price, with selective accumulation around $58-$60 if operating milestones remain intact, provides a more balanced risk framework than an unrestricted momentum purchase. The principal unresolved issue is no longer whether MaxLinear can establish a meaningful optical business. It is whether rapidly growing bookings can be converted into durable, cash-generative revenue without excessive supplier financing requirements, dilution, or architectural displacement.
Revenue of $218.1 million increased 29.1% sequentially and 72.4% year over year. Adjusted operating margin reached 29.5%, compared with 22.3% in Q2 and 12.1% a year earlier. Q4 revenue guidance of $240 million-$260 million was substantially more important than the relatively modest Q3 revenue beat: the $250 million midpoint exceeded Bloomberg consensus by 10.3% and implies another 14.6% sequential increase. Management also raised its 2026 optical data center revenue outlook from $210 million-$230 million to $250 million-$270 million, an 18.2% increase at the midpoint. Rushmore’s initial revenue timing moved toward 1H2027, compared with the mid-2027 timing discussed at the September investor conference, although the larger ramp remains concentrated in 2H2027 and 2028.
The financial qualification is significant. Operating cash flow was negative $13.6 million despite adjusted net income of $60.8 million. Supplier-related prepayments were a major contributor, but receivables and inventory also absorbed cash. The $109.9 million cash figure cited on the call included $28.8 million of restricted cash, leaving $81.1 million of unrestricted cash and equivalents. The company borrowed $40 million during Q3, subsequently expanded its revolving credit facility, and reduced the facility’s minimum liquidity covenant. These actions support the production ramp, but they also demonstrate that the growth cycle is not yet self-financing.
The strategic qualification is equally important. Higher semiconductor content at 1.6T, Washington TIA attachment, and foundry diversification provide credible mechanisms for continued share gains. However, management’s longer-term market-share aspirations, AEC targets, and optical architecture forecasts are not equivalent to contracted revenue or independently established market forecasts. The call supports upward revisions to near-term earnings expectations and a stronger assessment of MaxLinear’s competitive relevance. It does not eliminate the need to discount execution, cash conversion, customer concentration, and technology-transition risks.
Q3 PERFORMANCE: ACCELERATION, NOT A BROAD-BASED RECOVERY
The October 22 earnings release confirms that Q3 revenue exceeded Bloomberg consensus of $214.9 million by approximately $3.2 million, or 1.5%. Revenue was also 1.4% above the $215 million midpoint of management’s July guidance, but remained below the $220 million upper endpoint. This was a solid execution quarter rather than an unusually large revenue surprise. Adjusted EPS of $0.62 exceeded consensus of $0.56 by 10.7%, reflecting stronger profit conversion than the revenue variance alone would suggest.
The growth trajectory nevertheless accelerated materially. Quarterly revenue increased from $137.2 million in Q1 to $168.8 million in Q2 and $218.1 million in Q3. Year-over-year growth accelerated from approximately 55% in Q2 to 72% in Q3. The Q4 midpoint would extend the progression to $250 million and produce approximately $774.1 million of full-year revenue, up 65.5% from $467.6 million in 2025. Across the Q4 guidance range, implied full-year growth is approximately 63.4%-67.7%. This is a substantial change in operating scale within a relatively short period.
The September 30 Form 10-Q provides a more precise view of the sources of growth than the rounded figures on the call. Infrastructure revenue was $124.9 million, up 209.6% from $40.3 million a year earlier, and represented 57.3% of total revenue. Its $84.6 million increase accounted for approximately 92.3% of the company’s $91.6 million year-over-year revenue increase. Infrastructure has therefore become the dominant determinant of consolidated growth, rather than simply the fastest-growing category within a balanced portfolio.
The other categories were more mixed. Broadband revenue of $53.3 million declined 8.4% year over year, despite improving sequentially from approximately $45 million. Connectivity revenue of $24.7 million increased 30.3% year over year, while industrial and multi-market revenue of $15.1 million increased 69.3%. Combined non-infrastructure revenue grew approximately 8.2% year over year. The headline growth rate consequently should not be interpreted as evidence that every legacy business has entered a comparable structural expansion.
Sequentially, infrastructure increased by approximately $40 million from the rounded Q2 figure of $85 million, accounting for roughly 81% of the consolidated revenue increase. Broadband contributed approximately $8 million, with much smaller changes elsewhere. This concentration is favorable for earnings because infrastructure products carry higher margins, but it also makes future earnings more sensitive to optical shipment timing and hyperscaler deployment schedules.
Infrastructure revenue must not be treated as interchangeable with optical DSP revenue. The category includes additional products and applications, and management did not disclose a clean quarterly optical revenue figure. The garbled optical exit-rate reference in the initial draft transcript does not support a reliable numerical calculation of Q4 optical sales or a precise annualized starting point for 2027.
PROFITABILITY: STRONG OPERATING LEVERAGE, WITH IMPORTANT ADJUSTMENTS
Adjusted gross margin reached 60.0%, compared with 59.5% in Q2 and 59.1% in Q3 2025. The improvement was favorable, but relatively modest compared with the change in operating profitability. Adjusted operating expenses increased 5.9% sequentially and 11.7% year over year, substantially less than revenue growth. As a percentage of revenue, adjusted operating expenses declined to 30.5% from 47.1% a year earlier.
Adjusted operating income increased to $64.3 million from $37.6 million in Q2 and $15.2 million in Q3 2025. Incremental adjusted operating margin was approximately 54.2% sequentially and 53.6% year over year. These figures demonstrate the economic significance of scaling a revenue base against a comparatively fixed engineering and corporate expense structure. Most of the operating margin expansion came from expense absorption, not a sudden change in product-level gross profitability.
The earnings beat can be reconciled against management’s July assumptions. At the prior guidance midpoints, revenue of $215 million, adjusted gross margin of 60%, operating expenses of $68.5 million, interest and other expense of $3.9 million, and taxes of $1 million implied adjusted net income of approximately $55.6 million and EPS of approximately $0.562. Actual gross profit was approximately $1.8 million higher, operating expenses were approximately $2.0 million lower, and interest and other expense was approximately $1.9 million lower. A $0.5 million higher tax provision partially offset those benefits. The diluted share count was also approximately 1.3% below the guided 99 million.
This bridge matters because the EPS surprise was not entirely a revenue-driven operating beat. Expense discipline contributed meaningfully, but so did lower-than-guided nonoperating expense and a smaller denominator. The Q4 outlook restores interest and other expense to a materially higher level, limiting the extent to which the Q3 benefit should be extrapolated.
GAAP operating profitability also improved decisively. Operating income was $30.2 million, or 13.9% of revenue, compared with a $4.2 million operating loss in Q2 and a $41.3 million operating loss a year earlier. Q3 therefore represented a stronger operating milestone than Q2’s return to positive GAAP EPS. Q2’s $1.8 million GAAP net income depended on an $8.3 million tax benefit despite an operating loss. Q3 generated positive operating income and pretax income before its much smaller tax benefit.
Nevertheless, the GAAP-to-adjusted gap remains economically material. Q3 operating profit adjustments totaled $34.1 million, exceeding reported GAAP operating income. Stock-based compensation and performance-based equity expense totaled approximately $29.0 million across cost of revenue and operating expenses, equivalent to 13.3% of revenue. These items may be noncash in the period, but they are recurring compensation costs rather than evidence of costless operating leverage.
The release states that a substantial portion of 2026 bonus awards is expected to be settled in common stock in Q1 2027. Adjusted diluted shares increased 11.2% year over year, while basic weighted-average shares increased 4.2%. Some diluted-share expansion reflects the sensitivity of equity awards to the share price and profitability, rather than only new issuance. Even so, the difference between approximately 401% adjusted net income growth and 343% adjusted EPS growth illustrates the importance of dilution.
GAAP expense improvement also benefited from lower restructuring and acquisition-related charges relative to the prior year. Adjusted expenses provide a cleaner view of underlying cost discipline, while GAAP results remain necessary for evaluating the full economic burden of compensation and legacy obligations.
Q4 GUIDANCE: A MEANINGFUL FORWARD RESET
The Q4 revenue range of $240 million-$260 million implies sequential growth of 10.1%-19.2%, with 14.6% at the midpoint. Against Bloomberg consensus of $226.7 million, the low endpoint is 5.9% higher and the midpoint is 10.3% higher. Relative to Q4 2025 revenue of approximately $136.4 million, the midpoint implies approximately 83.3% growth. The guidance therefore indicates further year-over-year acceleration even as sequential percentage growth moderates from Q3’s unusually strong rate.
This is a favorable initial Q4 outlook relative to consensus, not a revision to a previously issued formal Q4 revenue range. The directly comparable same-period guidance increase is the change in the 2026 optical outlook. Maintaining that distinction avoids confusing sequential changes in quarterly guidance with an upward revision to the same forecast period.
Management expects infrastructure to grow strongly, broadband and connectivity to decline seasonally, and industrial and multi-market revenue to increase. The consolidated outlook consequently requires another substantial infrastructure contribution. As an illustrative sensitivity, if combined non-infrastructure revenue declined 5% from Q3, infrastructure revenue would need to reach approximately $161.5 million to deliver the $250 million consolidated midpoint, representing approximately 29.3% sequential growth. This is not company guidance, but it demonstrates the magnitude of optical execution embedded in the outlook.
Adjusted gross margin guidance is 59%-62%, with a midpoint of 60.5%. That midpoint is 50 basis points above Q3 and 30 basis points above Bloomberg consensus. Adjusted operating expenses are expected to be $65 million-$70 million, with a midpoint of $67.5 million, only approximately $1 million above Q3 despite the implied $31.9 million revenue increase.
At the midpoints, adjusted operating income calculates to approximately $83.8 million and operating margin to 33.5%. The implied sequential incremental operating margin is approximately 60.9%. This is a highly profitable revenue expansion, but it also means that modest shipment or mix deviations will have a disproportionately large effect on earnings.
Using all disclosed assumptions, including $3.9 million of interest and other expense, $1.5 million of adjusted tax expense, and 99.7 million diluted shares, Q4 adjusted EPS calculates to approximately $0.79. Combining the least favorable endpoints produces approximately $0.66, while combining the most favorable endpoints produces approximately $0.91. These are analytical calculations, not an explicit company EPS range, and assume that the various guidance endpoints occur together.
The corresponding GAAP midpoint implies approximately $50.3 million of operating income and $0.48 of EPS. The calculated GAAP endpoint range is approximately $0.36-$0.61. The continuing gap between GAAP and adjusted earnings remains substantial even as both measures improve.
Tax assumptions warrant particular attention. The Q4 adjusted tax provision implies an effective rate of approximately 1.9% at the midpoint, compared with approximately 2.4% in Q3. Applying a 15% tax rate to the same Q4 pretax income would reduce adjusted EPS to approximately $0.68; a 20% rate would reduce it to approximately $0.64. Neither rate is a prediction of the company’s immediate cash tax burden. The sensitivity demonstrates why low-tax quarterly EPS should not automatically be capitalized as permanently normalized earnings.
The model is also sensitive to relatively small operating changes. At the Q4 midpoint share count, a 100-basis-point gross margin change affects quarterly EPS by approximately $0.025 before incremental taxes. A $10 million revenue change at a 60.5% gross margin affects EPS by approximately $0.061 before incremental operating expenses and taxes. Qualification delays, shipment timing, and pricing therefore have meaningful implications even without a change in the longer-term market opportunity.
OPTICAL OUTLOOK: HIGHER REVENUE, EARLIER SHIPMENTS, BUT NO FORMAL 2027 GUIDE
The 2026 optical revenue outlook increased to $250 million-$270 million from $210 million-$230 million on the July call. Both endpoints increased by $40 million, and the midpoint increased from $220 million to $260 million. The September 9 Citi conference still referenced the $220 million midpoint, making the October increase a genuine improvement over the latest located intervening management commentary.
The magnitude is economically significant. The revised optical midpoint equals approximately 33.6% of implied full-year consolidated revenue, although optical’s exit mix is likely higher than its annual average because the business has ramped during the year. The increase reflects more than a general industry recovery: management attributes the trajectory to Keystone production ramps, customer expansion, and market-share gains. The available disclosures do not separate the revenue contribution from units, prices, and share sufficiently to quantify each driver independently.
The most important timing change concerns Rushmore. At the September conference, management described expected market entry around mid-2027. On this call, Seendripu described “initial revenues actually in early ’27 and a stronger ramp in the second half.” In the follow-up discussion, he clarified that an initial design win should begin shipping in 1H2027, while acknowledging that exact quantities remain uncertain.
The investment implication is an earlier qualification-to-revenue transition, not proof that the entire 1.6T cycle has accelerated by a fixed number of quarters. Initial revenue can establish production readiness and support customer confidence without immediately becoming financially large. The larger revenue contribution still depends on broader qualifications and deployment ramps in 2H2027 and 2028.
Management explicitly declined to provide numerical 2027 revenue guidance. Litchfield stated, “I would expect to see us outgrow the market in 2027.” That is directionally constructive, but the analyst suggestions of more than $400 million, approximately doubling optical revenue, or ultimately reaching a $1 billion business remain external scenarios rather than adopted forecasts.
The distinctions are especially important because some questions referenced a competitor’s broad AI interconnect growth assumptions and a potential 2030 market size. Such figures may include different products, architectures, and revenue pools. Applying those growth rates directly to MaxLinear’s optical DSP business would create false comparability. The company’s expanding opportunity is credible; a mechanically derived long-range revenue target is not established by the call.
CONTENT EXPANSION AT 1.6T: THE STRONGEST ECONOMIC ARGUMENT
The 800G-to-1.6T transition offers MaxLinear potential growth through higher shipment volumes, higher revenue per deployed module, and share gains. Seendripu stated that “the ASP on the DSP is more or less doubling,” and added that Washington TIA content could lift the combined increase above 2x. This is a more concrete economic mechanism than a generic assertion that AI bandwidth demand is expanding.
However, the pricing argument was not entirely new to this quarter. At the September conference, management described industry 800G DSP pricing of approximately $35-$50 and 1.6T pricing of approximately $80-$100, with TIA content potentially taking the combined value above $100. The October call strengthened the assertion that the higher pricing is holding, while linking it more directly to design wins and attachment. The incremental information is greater confidence in realization, rather than the first disclosure of the pricing opportunity.
Doubling revenue per module is not the same as doubling revenue for a fixed amount of network bandwidth. A 1.6T module carries approximately 2x the bandwidth of an 800G module. At constant aggregate bandwidth, a transition to higher-speed ports can reduce the number of modules required. Sustained revenue growth therefore depends on increasing deployed bandwidth, network topology, semiconductor attachment, and share, rather than on speed migration alone.
Gross profit per deployment is also more important than nominal ASP. Higher-speed DSPs can entail higher development costs, different process economics, more demanding test requirements, and yield uncertainty. Management acknowledged cost increases across its manufacturing ecosystem and said only some had been passed through. The approximately 2x DSP price relationship is favorable, but the call did not provide product-level gross margins or enough cost information to establish how much of the content increase becomes incremental gross profit.
Washington adds a separate source of value. Management suggested approximately 80% attachment in the near term, potentially reaching 100% over approximately 18 months, with the possibility of exceeding that level through sales alongside competitors’ DSPs. An attachment figure above 100% should be interpreted as external platform penetration relative to MaxLinear’s own DSP base, not as a conventional customer attach rate.
The unit denominator also requires care. Washington is a 4-channel TIA, whereas an 8-lane 200G-per-lane implementation has a different device-count requirement. Attachment percentages cannot be translated directly into chip volumes without identifying whether management means module designs, complete receive-side content, or individual devices. The call did not define that denominator precisely enough to construct a detailed unit forecast.
MaxLinear’s April 30 Washington announcement provides supporting product evidence. It describes approximately 750 milliwatts of typical power consumption for 4 channels, compatibility with major PAM4 DSP vendors, and pad compatibility intended to simplify adoption. These features support both integrated Rushmore-Washington sales and standalone sales opportunities. They remain company product claims, not independently measured production economics.
That April announcement also anticipated Washington mass production in 2H2026, whereas both the July and October earnings calls anticipated initial revenue in 2027 and a more meaningful ramp in 2028. Manufacturing availability and recognized customer revenue are distinct milestones. The October call does not indicate a new delay relative to July, but the earlier product announcement should not be used to assume meaningful 2026 Washington sales.
COMPETITIVE POSITION: CREDIBLE SHARE GAINS, NOT AN UNCONTESTED MARKET
Management’s market-share commentary was unusually confident. Seendripu characterized the previously discussed 5%-7% share range as backward-looking and expressed confidence in reaching the teens over approximately 2 years. These statements suggest that internal customer activity has improved beyond earlier expectations. However, no current measured market share, defined denominator, or independent validation was provided.
The denominator problem is material. Share can refer to units, dollars, selected speed categories, merchant DSP revenue, or a broader optical connectivity market. An improving mix of higher-priced 1.6T products could increase revenue share faster than unit share. Conversely, rapid industry growth could allow substantial MaxLinear revenue growth without producing the same share increase. The share targets are useful indicators of management ambition, but not sufficient inputs for a precise market-share model.
Foundry diversification is a more tangible differentiator. MaxLinear’s March 12 product announcement identifies Rushmore as built in Samsung technology. On the call, management emphasized that its 800G and 1.6T products do not compete internally for identical manufacturing resources. For customers concerned about constrained advanced-node capacity, an alternative qualified supply chain can create value beyond modest differences in power or price.
That advantage should not be overstated. A product implemented at a different foundry is not equivalent to the same product being freely transferable between foundries. Qualification, yield, process reliability, packaging, and customer acceptance remain specific to the implemented design. The strategic benefit is diversification across product generations and suppliers, not unlimited fungibility of manufacturing capacity.
Competition is also already active at 1.6T. Marvell’s March 12 announcement stated that its Ara platform was shipping in mass volume and introduced additional use-case-specific DSPs, including transmit-retimed optics products. MaxLinear’s opportunity therefore rests on competitive displacement, additional sourcing, supply availability, and differentiated system economics within an established market. Rushmore is not entering an empty field.
Management’s statement that only a limited number of suppliers meet the relevant TIA performance and power requirements is potentially important, but remains a competitive assertion. The investment case is stronger when based on actual customer qualifications and shipments than on categorical claims about competitors’ technical limitations.
QUALIFICATION AND SUPPLY: DISTINCT BOTTLENECKS
The call identified separate constraints that should not be conflated. Wafer availability determines how much qualified product can ultimately be produced. Engineering and customer-support resources determine how many module and hyperscaler qualifications can proceed simultaneously.
Seendripu clarified that the qualification constraint was not a wafer-supply issue. Multiple module makers may target the same hyperscaler, while each qualification requires interoperability across switches, other silicon suppliers, and existing 800G infrastructure. His statement that “we’re constrained in how many we can activate at the same time” highlights an execution bottleneck within the company rather than simply an external manufacturing limitation.
This has direct implications for the financial model. Near-flat operating expense guidance creates strong operating leverage, but engineering capacity cannot be assumed to remain fixed indefinitely while customer and product complexity expand. Additional applications engineering, validation, firmware, or field-support investment could improve revenue conversion while moderating margin expansion. Maximizing near-term margins is not necessarily equivalent to maximizing the value of the qualification pipeline.
Supply visibility improved meaningfully. Litchfield stated that “we’re booking products throughout ’27 into 2028,” while optical lead times were approximately 26-28 weeks. Orders extending materially beyond quoted lead times indicate customer willingness to secure future capacity. They can improve production planning and strengthen the justification for supplier prepayments.
Backlog is nevertheless not identical to guaranteed revenue. The call did not quantify cancellation rights, customer deposits, take-or-pay provisions, or minimum purchase protections. Management’s rejection of double ordering was categorical, but the supporting evidence was primarily qualitative, including customer qualification discipline and supply-chain segregation.
Customer-specific qualifications can reduce the interchangeability of orders across suppliers, but they do not eliminate the risk of aggregate overordering, deployment delays, or rescheduling. The statement that long-term agreements are not widespread also limits the inference that extended bookings carry fully enforceable economic protection. Backlog quality should be assessed through shipment conversion, cancellation behavior, and cash collection rather than duration alone.
CASH FLOW AND LIQUIDITY: THE CENTRAL FINANCIAL RISK
Q3 operating cash flow of negative $13.6 million compared with positive $4.8 million in Q2 and positive $10.1 million a year earlier. It also fell approximately $46.7 million below Bloomberg consensus of positive $33.1 million. The miss was large relative to earnings and should not be treated as a secondary detail.
The cash flow statement identifies $45.7 million of cash absorption in prepaid expenses and other assets, $22.3 million in receivables, and $8.2 million in inventory. These uses were partly offset by noncash expenses and increases in operating liabilities. The prepaid-asset outflow is similar in magnitude to the consensus cash-flow miss, but the available forecast detail does not establish that it explains the entire variance.
Adding back the complete prepaid-and-other-assets outflow would produce approximately $32.1 million of operating cash flow. That sensitivity is useful for understanding the timing effect, but it is not a valid replacement for reported cash flow. The line includes more than wafer prepayments, and Litchfield explicitly stated, “I expect prepaids to continue to go up from here.” A requirement that persists while revenue grows remains an economic financing burden, even if it is associated with attractive future sales.
Using operating cash flow less purchases of property and equipment, analytically defined Q3 free cash flow was negative $19.5 million. Including $3.7 million of purchased intangible assets, cash flow after those investments was negative $23.2 million. These calculations are separate from any company-defined adjusted free-cash-flow measure. For the first 9 months, operating cash flow was negative $17.7 million despite adjusted net income of $114.5 million.
The working-capital metrics provide a mixed signal. Inventory days declined from 123 to 111, suggesting faster turnover, but inventory dollars still increased to $113.7 million from $105.5 million. Prepaid manufacturing commitments also sit outside conventional inventory-day calculations. Improving inventory days therefore does not establish a reduction in total supply-chain capital employed.
Days sales outstanding increased from 28 to 31, while receivables increased approximately 43.8%, faster than revenue. Part of the increase is normal during a rapid shipment ramp, and the filing reported no credit losses on customer receivables. Nevertheless, collection timing deserves attention because the company is financing production before customer cash is received.
The balance sheet further qualifies the headline liquidity figure. Total cash, equivalents, and restricted cash were $109.9 million, but unrestricted cash and equivalents were $81.1 million. Principal debt was $165 million, consisting of a $125 million term loan and $40 million drawn on the revolver. Net debt excluding restricted cash was therefore approximately $83.9 million.
Q3 financing included $40 million of revolver borrowings. Cash increased by only $16.1 million after operating and investing outflows and foreign-exchange effects. The increase in cash was therefore financing-driven, not evidence of improved internal cash generation.
The October 16 amendment increased revolving commitments from $130 million to $200 million and reduced the minimum liquidity covenant from $80 million to $60 million. Using September 30 cash and borrowing balances, the expanded facility implies approximately $241 million of gross pro forma liquidity before other facility utilization, covenant constraints, and subsequent activity. The calculation is $81.1 million of unrestricted cash plus approximately $160 million of undrawn commitments, not unrestricted cash plus the entire $200 million facility.
The amendment does not indicate a disclosed covenant breach. The company reported compliance at September 30. It does, however, show that management sought both additional financing capacity and greater flexibility in the required liquidity buffer. The revolver matures in March 2028 and the term loan in June 2028, overlapping the period when several new products are expected to reach more meaningful volume.
Supplier commitments are also substantial. The filing reports $273.0 million of inventory purchase obligations, including approximately $88.7 million scheduled for the remaining 3 months of 2026 and $184.3 million in 2027. These are procurement commitments, not amounts that should simply be added to debt, and they should not be double-counted against related prepayments. They nevertheless establish that the ramp involves meaningful committed capital.
Customer contract liabilities were only approximately $0.3 million at September 30. This does not reveal every commercial protection in backlog, but it indicates that recognized customer advances were not materially financing the upstream cash requirement. The core issue is the asymmetry between supplier commitments and customer cash receipts.
CUSTOMER DIVERSIFICATION: BETTER BILLING DIVERSITY, UNPROVEN END-DEMAND DIVERSITY
The absence of a customer representing at least 10% of quarterly revenue is confirmed by the filing and represents an improvement in reported customer concentration. It does not establish that ultimate hyperscaler demand is equally diversified. Multiple module makers and distributors can serve the same deployment program, leaving economic concentration substantially greater than direct billing concentration.
The filing states that 48% of Q3 revenue was sold through distributors, compared with 36% a year earlier. This can broaden access to customers and improve execution, but it also increases the importance of channel inventory and sell-through visibility. The disclosure is not evidence of channel stuffing; it is a reason to distinguish shipments into the channel from final deployment demand.
Geographic data require similar discipline. Approximately 89% of Q3 revenue was shipped to Asia, including 52% to Hong Kong and 12% to mainland China. These are shipment destinations, not a measure of ultimate Chinese hyperscaler exposure. The filing explicitly notes that products incorporated into systems in Asia can subsequently be sold into North America and other regions.
Management expects US data centers to become more important as 1.6T adoption progresses, but did not disclose current optical revenue by ultimate customer geography. The call’s references to NVIDIA and Google do not establish MaxLinear design wins at either company. They were used to characterize the timing of broader industry deployments.
Supplier concentration remains high despite the strategic diversification narrative. A supplier represented 52% of inventory purchases in Q3, compared with 34% a year earlier. Customer diversification, foundry diversification, and supplier concentration are different measures and can move in different directions simultaneously.
OPTICAL ARCHITECTURE RISK: THE PORTFOLIO HEDGE IS REAL BUT INCOMPLETE
Management expects fully retimed pluggables to coexist with linear and more integrated optical approaches. Seendripu’s personal 2030 view envisaged approximately 60%-70% pluggable penetration, approximately 20% NPO, and a smaller contribution from other architectures. He explicitly qualified the forecast: “That’s my personal view, not a market view.” It should not be treated as an independently established industry endpoint.
The technical categories also describe different dimensions. LPO and LRO concern the placement and extent of signal processing and retiming, while NPO and CPO concern optical integration and physical proximity to the switching or computing silicon. Their commercial labels do not necessarily form perfectly exclusive revenue categories. A credible market model must track the semiconductor functions retained in each implementation rather than allocating revenue by acronym alone.
MaxLinear’s TIA, driver, and electrical interconnect products reduce dependence on a single optical architecture. Washington can potentially participate where a full merchant optical DSP is absent. That is valuable strategic diversification, but it is not automatically a complete economic hedge. Capturing a smaller analog component opportunity may not fully offset losing a higher-value DSP position.
Management’s skepticism toward CPO requires an explicit counterweight. NVIDIA’s current silicon photonics product documentation describes Spectrum-X Ethernet Photonics ramping to full production and identifies an architecture that does not require DSP retimers. These are NVIDIA’s product claims rather than independent adoption measurements, but they demonstrate that CPO is an active commercial alternative, not merely a distant theoretical risk.
The relevant question is therefore not whether CPO eliminates all pluggable demand. It is how quickly particular network layers adopt architectures with different merchant semiconductor content, and whether MaxLinear wins sufficient analog, electrical, or remaining DSP content to offset the change. The call did not provide the revenue-per-link or margin data needed to establish that neutrality.
Big Sky’s 400G-per-lane and 3.2T roadmap provides evidence that MaxLinear intends to participate beyond the current transition. However, no sufficiently specific production schedule or revenue contribution was disclosed to justify including material Big Sky revenue in a near-term earnings forecast.
ADJACENT PRODUCTS: VALUABLE OPTIONALITY, WITH DIFFERENT MATURITY LEVELS
Annapurna extends the opportunity into active electrical cables and onboard retimers for short-reach AI connectivity. The strategy is to sell silicon through cable makers or related intermediaries, rather than recognize the revenue of an entire cable assembly. This distinction is essential when comparing potential revenue with vertically integrated AEC suppliers.
Management discussed a potential 20%-30% share in the 1.6T cycle over the next several years, while describing a strategy centered on 1 or 2 large US data centers. The denominator was not sufficiently defined to treat that figure as a forecast for 20%-30% of the entire global AEC market. It is more appropriately viewed as an aspiration within targeted programs and channels.
The specific question about the mix between onboard retimers and cable applications was not answered quantitatively. Initial Annapurna revenue remains expected in 2027, with a stronger volume ramp in 2028, consistent with the July call. The opportunity is strategically credible but should not be used to fill an aggressive 2027 revenue forecast without customer and shipment evidence.
RackCommander expands the company’s role into telemetry, monitoring, connectivity bridges, power control, and protection. These functions can increase content per rack and broaden customer relationships beyond high-speed data movement. However, the call did not disclose revenue, pricing, or an updated quantified design-win count. The July call had already identified USB bridge-controller wins at 2 major hyperscalers, so the strategic direction was not entirely new.
The XGS-PON control-plane opportunity is also distinct from high-bandwidth AI data-plane transport. The call’s reference to qualification completion and 2027 deployments is constructive, but qualification completion had already been discussed in July. The incremental emphasis was secure backlog and expected deployment timing, rather than a newly completed qualification milestone.
Panther’s expected 2026 revenue doubling was reiterated. The September conference described a prior-year revenue base of approximately $15 million-$20 million, implying an indicative 2026 scale of approximately $30 million-$40 million if that doubling is achieved. This is meaningful adjacent revenue, but remains smaller than the optical opportunity.
The 2027 wording became less specific. July commentary referred to the potential to nearly double again, and September commentary was similarly ambitious. The current call described the potential for “another meaningful increase in 2027.” This is not a formal guidance cut, but it provides less numerical support for carrying a further doubling into estimates.
Panther’s KV-cache and agentic-inference positioning is technically interesting, but storage compression and acceleration should not be equated with a direct expansion of GPU high-bandwidth memory. Benefits depend on workload compressibility, data movement, latency, caching policy, and system integration. The call did not provide benchmarks sufficient to quantify inference throughput or infrastructure savings.
Broadband and connectivity provide a secondary recovery mechanism through PON and Wi-Fi 7 deployments. Management expects broadband growth in 2027 despite Q4 seasonality. Given that Q3 broadband revenue remained below its prior-year level, the evidence supports a recovery and share-gain thesis more clearly than an established broad-based secular acceleration. Wireless infrastructure and edge AI remain longer-dated opportunities without quantified near-term contributions.
VALUATION AND EXPLICIT SCENARIOS
The Bloomberg notice reported an after-hours price of $67 on only 3,276 shares traded. That is an indicative event-time reference, not a sufficiently liquid observation from which to infer a definitive market assessment of the call.
At $67, using approximately 91 million shares outstanding at September 30, equity capitalization is approximately $6.1 billion. Adding $165 million of principal debt and subtracting $81.1 million of unrestricted cash produces an enterprise value of approximately $6.18 billion, excluding other debt-like adjustments. This is approximately 8.0x implied 2026 revenue.
The same price represents approximately 21.3x annualized Q4 midpoint adjusted EPS of approximately $3.14. That multiple appears more moderate than the revenue multiple, but the annualization embeds strong Q4 operating leverage and an unusually low tax rate. It is not a substitute for a full-year forecast.
The following 2027 cases are analytical assumptions, not management guidance or consensus. They separate optical revenue from all other revenue to avoid adding overlapping product opportunities to the same consolidated base. The valuation multiples are scenario assumptions rather than claims about current peer trading levels.
The base case, assigned a 50% probability, assumes $550 million of optical revenue and $600 million of other revenue, producing $1.15 billion of total revenue. This represents approximately 48.6% consolidated growth and approximately 111.5% optical growth relative to the respective 2026 midpoints. Assumptions of 62.5% adjusted gross margin, $295 million of operating expenses, $18 million of interest and other expense, a 10% tax rate, and 103 million diluted shares produce approximately $3.55 of adjusted EPS. A 22x multiple implies approximately $78 per share, or 16% above the reference price.
This base case requires more than passive participation in industry growth. It assumes continued 800G strength, meaningful Rushmore contribution, expanding TIA attachment, and growth in non-optical products. It also assumes that expense growth accelerates from the near-flat Q4 guide to support qualifications and product development.
The bull case, assigned a 25% probability, assumes $700 million of optical revenue and $650 million of other revenue, producing $1.35 billion of total revenue. A 64% gross margin, $320 million of operating expenses, $20 million of interest and other expense, a 10% tax rate, and 105 million diluted shares produce approximately $4.49 of adjusted EPS. A 26x multiple implies approximately $117, or 74% upside. This outcome requires strong 1.6T conversion, sustained pricing, successful supplier execution, and improving cash generation sufficient to preserve a premium valuation.
The bear case, assigned a 25% probability, assumes $375 million of optical revenue and $545 million of other revenue, producing $920 million of total revenue. A 59.5% gross margin, $285 million of operating expenses, $20 million of interest and other expense, a 10% tax rate, and 102 million diluted shares produce approximately $2.14 of adjusted EPS. A 16x multiple implies approximately $34, or 49% downside. Notably, this case still contains revenue growth. A sharp equity drawdown would not require business collapse if qualifications slip, cash conversion remains weak, and the market lowers the multiple applied to future earnings.
The probability-weighted value is approximately $77, implying approximately 15% upside from $67 over a 12-18-month framework. That expected return is positive but not overwhelming relative to the downside distribution, cash-flow uncertainty, and model sensitivity. At $60, the same framework implies approximately 28% expected upside, creating a more attractive entry asymmetry.
These probabilities and multiples are necessarily judgmental. The bear case is not a maximum-loss estimate and does not fully capture an extreme legal outcome or a severe industry downturn. Conversely, sustained execution beyond 2027 could justify a higher value than a near-term earnings framework captures.
CATALYSTS, INVALIDATION CRITERIA, AND PORTFOLIO IMPLICATIONS
The immediate catalyst is Q4 delivery against the $240 million-$260 million range, particularly the infrastructure contribution and the ability to sustain approximately 60%-plus gross margins. The next major catalyst is the company’s initial numerical 2027 outlook. That disclosure should clarify how much of the apparent optical opportunity is supported by firm shipment schedules rather than broad market expectations.
During 1H2027, the most important evidence will be commercial Rushmore shipments, Washington attachment, qualification breadth, and the conversion of prepayments into delivered product and customer cash. During 2H2027, the test shifts to the scale of the 1.6T ramp and whether incremental products contribute without requiring an unexpectedly large expense increase. The larger Annapurna and Washington volume opportunities remain more relevant to 2028 than to the immediate quarter.
Thesis invalidation would include initial Rushmore shipments moving beyond 1H2027 without a credible customer-driven explanation, deterioration in 800G demand before 1.6T becomes material, weakening DSP pricing, gross margins declining despite a richer infrastructure mix, or customer-order cancellations that reveal lower backlog quality than management’s commentary suggests.
Financial review triggers should include supplier prepayments and receivables continuing to outgrow revenue without subsequent cash conversion, rising revolver utilization, declining covenant-adjusted liquidity, and dilution materially exceeding the 103 million-105 million share assumptions used in the central and upside cases. A temporary working-capital build can be rational during rapid growth; a persistent dependence on external financing would require a lower valuation of reported earnings.
The Silicon Motion arbitration remains a separate material tail risk. The September 30 filing states that Silicon Motion seeks a termination fee, additional damages, fees, and costs. MaxLinear disputes liability. No material litigation loss contingency was accrued, and management stated that a reasonable loss estimate could not be made. The absence of an accrual is not evidence that adverse outcomes are impossible. This risk is particularly relevant when supplier commitments and growth financing already consume liquidity.
For portfolio construction, MaxLinear increasingly represents an AI infrastructure spending and high-speed interconnect exposure rather than a diversified communications-semiconductor recovery. A position can add smaller-company execution risk, semiconductor cyclicality, and AI-capex correlation to a portfolio already exposed to optical, networking, and accelerator suppliers. It should not be assumed to diversify a substantial existing AI hardware allocation.
An illustrative risk framework would limit initial exposure to approximately 0.5% of portfolio NAV and aggregate exposure to approximately 1.0% until cash conversion and 1.6T execution are better established. A 20% price-loss review or stop threshold would imply approximately $54 from the $67 reference, or approximately $48 from a $60 entry, subject to liquidity and gap risk. At a 1.0% weight, the modeled 49% bear-case decline would cost approximately 49 basis points of NAV, while a successfully executed 20% stop would cost approximately 20 basis points. Stops cannot cap losses through a discontinuous legal or earnings event.
The preferred exit discipline is thesis-based rather than dependent only on price. Exposure should be reduced if qualification milestones slip materially, cash funding requirements weaken expected returns, or the valuation reaches the bull-case range without corresponding improvement in earnings and cash generation. The call supports retaining exposure to improving fundamentals, but not allowing confidence in the market opportunity to substitute for evidence of economic realization.
SOURCE AND INTERPRETATION NOTES
Financial results and balance-sheet details are supported by MaxLinear’s October 22 earnings release and September 30 Form 10-Q. Prior guidance comparisons incorporate the July 23 release and call, the September 9 Citi conference, and the January 29 release for the 2025 baseline. Consensus and the indicative after-hours price are from the Bloomberg earnings notice. Product and competitive context incorporates MaxLinear’s 2026 product announcements, Marvell’s March 12 announcement, and NVIDIA’s silicon photonics documentation.
The initial draft transcript contains transcription errors in units, speaker labels, and selected numerical phrases. Financial tables take precedence where the release resolves an ambiguity. The analysis does not rely on the garbled optical exit-rate figure or the apparent “12 to 24-minute” market-share reference. Analyst hypotheticals are distinguished from management guidance, and management’s architecture and market-share claims are treated as assertions rather than independently verified outcomes.
COMPANY PARTICIPANTS
• Kishore Seendripu, Chairman, President and Chief Executive Officer. • Steve Litchfield, Chief Financial Officer and Chief Corporate Strategy Officer. • Leslie Green, Investor Relations.
RESEARCH ANALYST PARTICIPANTS
• Ananda Baruah, Loop Capital. • Christopher Rolland, Susquehanna. • Cody Acree, StoneX Financial. • Quinn Bolton, Needham & Company. • Sam Feldman, Exane BNP Paribas, participating for Karl Ackerman. • Tim Savageaux, Northland Capital Markets. • Tore Svanberg, Stifel. • Travis Poulin, Wells Fargo, participating for Joe Quatrochi.
Key Read-Throughs
KEY READ-THROUGHS FROM MAXLINEAR’S Q3 2026 EARNINGS CALL
MaxLinear’s results provide strong evidence that AI connectivity demand remains robust, but the more actionable implications concern the distribution of revenue, pricing power, and financing burdens across the supply chain. The increase in 2026 optical revenue guidance to $250 million-$270 million, bookings extending into 2028, approximately doubling DSP prices at 1.6T, and earlier initial Rushmore shipments support optical semiconductor and networking demand. However, MaxLinear’s expansion into TIAs and electrical interconnects introduces specific competitive threats, while supplier prepayments demonstrate that strong accounting earnings do not necessarily translate into strong cash generation. The highest-conviction conclusions favor scarce semiconductor capacity and differentiated connectivity products, while challenging assumptions of stable incumbent market shares and automatic margin expansion throughout the optical ecosystem. Impact assessments below distinguish business-line exposure from consolidated earnings materiality. Country labels identify equity listing markets.
OPTICAL AND ELECTRICAL INTERCONNECT SEMICONDUCTORS
DSP-TIA CO-DESIGN REDUCES THE OPEN MARKET AVAILABLE TO STANDALONE ANALOG SUPPLIERS (READ-THROUGH 1)
Affected companies: Semtech Corporation (SMTC: US); MACOM Technology Solutions Holdings (MTSI: US).
Directional impact and magnitude: Negative for prospective TIA socket share and pricing power. Potentially meaningful within competing 200G optical analog product lines, but a smaller and presently unquantifiable consolidated earnings impact. This is a competitive-share warning, not evidence that either company’s optical revenue must decline.
The strongest supporting evidence is management’s description of Washington attachment to Rushmore. Seendripu indicated approximately 80% attachment initially, potentially reaching 100% over approximately 18 months, with additional opportunities alongside competitors’ DSPs. He also confirmed commitments for both DSPs and TIAs in the relevant design wins. The economic significance is that a MaxLinear DSP win increasingly carries an associated analog-content win rather than leaving the TIA independently contestable.
Semtech’s FiberEdge 200G TIA portfolio and MACOM’s 200G optical receiver solutions establish direct product overlap. The transmission mechanism is straightforward: analog-digital co-optimization can improve power, signal integrity, qualification efficiency, and the total bill of materials. Once the integrated combination is qualified, substituting an independent TIA can require additional validation without offering sufficient system-level benefit. MaxLinear therefore gains a route to analog share through its DSP footprint rather than having to compete independently for every component.
The less obvious implication is that growth in the overall 1.6T market can coexist with weaker-than-expected revenue capture by incumbent analog suppliers. A model that assumes a stable merchant TIA share across every incremental DSP deployment would overstate the opportunity if MaxLinear’s attachment targets are realized. Washington’s compatibility with other DSP vendors adds a second competitive avenue beyond captive attachment.
Near-term trading catalyst: The next Semtech and MACOM earnings discussions could face greater scrutiny around 200G design wins, customer diversification, and the proportion of optical growth attributable to new sockets rather than industry expansion. The immediate effect is more likely to appear in expectations and valuation than in reported revenue because MaxLinear anticipates initial Washington revenue in 2027.
Longer-duration fundamental shift: The more important exposure is the 2027-2028 qualification and production cycle. Commercial success would move competition from individual component performance toward platform-level performance and support. Incumbent qualification depth and MACOM’s broader optical integration capabilities remain defenses. Management’s claim that only a limited number of suppliers meet the required benchmarks should not be interpreted as independent proof that either competitor’s technology is deficient.
MERCHANT AEC SILICON CREATES A CREDIBLE CHALLENGE TO VERTICALLY INTEGRATED CABLE ECONOMICS (READ-THROUGH 2)
Affected company: Credo Technology Group Holding (CRDO: US).
Directional impact and magnitude: Negative for the durability of exceptional AEC share and pricing power. Limited demonstrated near-term earnings impact, but potentially meaningful competitive pressure during the 1.6T cycle in 2027-2028.
Management explicitly identified Credo as the leading AEC supplier and described Annapurna as a silicon offering sold through cable makers or paddle-card manufacturers. Initial revenue is expected in 2027, followed by a stronger ramp in 2028. MaxLinear is concentrating its commercial effort on 1 or 2 large US data centers rather than attempting immediate market-wide coverage.
The transmission mechanism is ecosystem enablement. A competitive merchant DSP allows cable manufacturers to develop products without building the underlying high-speed signal-processing technology themselves. That can increase the number of commercially viable AEC suppliers and give hyperscalers an additional sourcing option. Even before an alternative wins substantial volume, a qualified second source can improve customer bargaining leverage over pricing, allocation, and commercial terms.
MaxLinear’s silicon revenue should not be compared directly with Credo’s cable revenue. A relatively small silicon sale can enable competition against a much larger finished-cable revenue pool. Consequently, Annapurna could become competitively relevant to Credo before it becomes a large reported revenue line for MaxLinear.
The call’s suggested 20%-30% share objective is not a reliable global AEC market-share forecast. Its denominator was unclear, and the surrounding discussion emphasized selected hyperscaler programs. The high-conviction conclusion is the emergence of a more credible alternative supply model, not the achievement of that particular percentage.
Near-term trading catalyst: Named customer qualifications, cable-manufacturer partnerships, or evidence that Annapurna has passed production-level interoperability testing would be more consequential than another broad addressable-market announcement. The call alone does not establish a lost Credo customer or justify a near-term revenue cut.
Longer-duration fundamental shift: Competition could gradually separate the economics of the DSP, cable assembly, and system-level support. Credo’s defenses remain substantial. Its current portfolio integrates cables, optical products, DSPs, silicon photonics, telemetry, and diagnostics. Its October product demonstrations included 1.6T AECs supported by the PILOT platform. A competing chip therefore does not automatically replicate Credo’s reliability, software, qualification history, or customer support. The appropriate negative read-through concerns future market power, not an assumption of rapid commoditization.
HIGHER DSP CONTENT AND SUPPLY DISCIPLINE SUPPORT INCUMBENT OPTICAL REVENUE, DESPITE MAXLINEAR’S SHARE GAINS (READ-THROUGH 3)
Affected companies: Marvell Technology (MRVL: US); Broadcom (AVGO: US).
Directional impact and magnitude: Positive for optical DSP revenue per module and near-term pricing resilience. Moderate potential significance to Marvell’s connectivity business; lower consolidated significance to Broadcom because of its substantially broader revenue base. MaxLinear’s share gains are an offset, not sufficient evidence of declining incumbent revenue.
Seendripu stated that “the ASP on the DSP is more or less doubling” as deployments move from 800G to 1.6T. Litchfield reported optical lead times of approximately 26-28 weeks and said customers were placing orders throughout 2027 and into 2028. Management also described manufacturing constraints and an ability to pass some ecosystem cost increases to customers.
These comments support a favorable combination of product mix and reduced price erosion. Marvell and Broadcom both have established high-speed optical DSP portfolios. As customers adopt higher-bandwidth modules, the semiconductor revenue associated with each module increases. Tight qualified supply reduces the incentive to compete principally through price and raises the value of delivery certainty, interoperability, and proven production capability.
The distinction between market growth and share is critical. MaxLinear expects to outgrow the market, which implies competitive pressure on incumbent share. However, declining percentage share in a rapidly expanding revenue pool can still produce substantial absolute growth. The call is therefore not a clean bearish read-through for Marvell simply because MaxLinear is performing well. Pricing, shipment volume, and share must be modeled separately.
Marvell’s March announcement stated that its Ara 1.6T platform was already shipping in mass volume. Broadcom has also introduced additional high-speed optical DSP products. These positions give incumbents production experience and customer relationships ahead of MaxLinear’s larger 2027 ramp. MaxLinear’s success establishes a stronger challenger, not an uncontested technological lead.
Near-term trading catalyst: The next optical semiconductor earnings cycle should provide confirmation through order visibility, 1.6T shipment mix, and pricing commentary. MaxLinear’s Q4 revenue midpoint, 10.3% above Bloomberg consensus, increases confidence in the direction of demand but cannot be translated proportionately into another supplier’s earnings surprise.
Longer-duration fundamental shift: The revenue opportunity expands as higher-speed products increase semiconductor content and network bandwidth grows. However, approximately doubling DSP revenue per module does not double revenue for a fixed quantity of deployed bandwidth: a 1.6T module carries approximately 2x the throughput of an 800G module. Sustainable growth still requires expanding bandwidth demand, favorable architecture mix, or share gains. Similarly, higher ASPs do not establish an equal increase in gross profit because advanced-node manufacturing, testing, and development costs also rise.
SEMICONDUCTOR FOUNDRIES AND SUPPLY-CHAIN FINANCING
QUALIFIED CAPACITY IS BECOMING A COMPETITIVE PRODUCT, NOT SIMPLY A MANUFACTURING INPUT (READ-THROUGH 4)
Affected companies: Samsung Electronics (005930: South Korea); Taiwan Semiconductor Manufacturing Company (2330: Taiwan). MaxLinear (MXL: US) illustrates the corresponding downstream financing burden.
Directional impact and magnitude: Positive for Samsung’s foundry franchise and for TSMC’s capacity-allocation and commercial leverage. Strategically meaningful for Samsung’s external-customer credibility, but small in direct consolidated earnings terms for both foundry groups. Negative for the cash-conversion assumptions applied to financially constrained fabless challengers.
The call connected supply diversity directly to competitive advantage. Management emphasized that its 800G and 1.6T products do not compete internally for the same manufacturing resources. MaxLinear’s product announcement identifies Rushmore as implemented in Samsung technology. The earnings call then brought initial Rushmore revenue toward 1H2027, with a stronger ramp in 2H2027.
For Samsung, the precise benefit is a commercially relevant high-speed connectivity program progressing toward production. A qualified alternative foundry can help customers secure supply that is difficult to obtain through the dominant manufacturing ecosystem. That raises the strategic value of Samsung’s process technology beyond a comparison based solely on nominal transistor density or wafer price. Successful volume production would provide a reference point for additional external customers with demanding mixed-signal and high-speed interface requirements.
This does not establish a broad reversal of foundry market share. A Samsung-based Rushmore design is not proof that the same chip can be freely transferred between foundries, nor does it establish comparative yields or profitability. The high-conviction positive is program-level validation and diversification value.
For TSMC, the call’s prepayment discussion provides evidence that customers are willing to commit cash earlier to secure supply. Management acknowledged TSMC in discussing prepaid balances but explicitly said that the balances included other items and suppliers. The full prepayment increase therefore cannot be assigned to TSMC.
The associated financial data are nevertheless revealing. MaxLinear’s prepaid expenses and other assets absorbed approximately $45.7 million of cash in Q3, while operating cash flow was negative $13.6 million. The company expanded its revolver by $70 million to $200 million. Litchfield stated, “I expect prepaids to continue to go up from here.”
The broader transmission mechanism is a shift of financing responsibility toward chip designers. Supplier commitments consume cash before finished products generate collections. Foundries obtain greater demand visibility and potentially more favorable funding arrangements, while customers bear more working-capital and demand-mismatch risk. A supplier prepayment is not immediate foundry revenue, but it can improve the economics and visibility of capacity allocation.
Near-term trading catalyst: Further wafer commitments, supplier-payment disclosures, and confirmed Rushmore production milestones. The financial benefit to the foundries is more likely to emerge through utilization and commercial terms than through a large revenue contribution from this customer alone.
Longer-duration fundamental shift: Procurement capability and balance-sheet capacity become more important sources of semiconductor competitive advantage. The negative cross-portfolio implication is that an AI-related earnings upgrade should not automatically receive a premium free-cash-flow multiple. MaxLinear demonstrates the risk, but the call does not establish that Marvell, Broadcom, or Credo have identical funding requirements.
OPTICAL COMPONENTS, MODULES, AND PRECISION MANUFACTURING
OVERLAPPING 800G AND 1.6T RAMPS SUPPORT VOLUME, BUT THE SUPPLY CHAIN WILL NOT SHARE THE ECONOMICS EQUALLY (READ-THROUGH 5)
Affected companies: Coherent (COHR: US); Lumentum Holdings (LITE: US); Fabrinet (FN: US); Eoptolink Technology (300502: China).
Directional impact and magnitude: Positive for high-speed optical demand and manufacturing throughput. Potentially material to the exposed optical businesses, with moderate consolidated relevance for diversified manufacturers. The positive volume conclusion is stronger than any claim of automatic margin expansion.
MaxLinear increased its 2026 optical outlook by $40 million at both endpoints, to $250 million-$270 million. Management described continued 800G growth alongside the introduction of 1.6T revenue in 2027, with a larger 1.6T contribution in 2028. The important implication is an overlapping deployment cycle rather than a simple replacement of existing 800G demand by a new generation.
For Coherent and Eoptolink, more high-speed module deployments support transceiver demand and manufacturing utilization. Their public product work establishes relevant exposure: Coherent has demonstrated a 1.6T module using Marvell’s Ara DSP, while Eoptolink has described transceiver development using Broadcom’s Taurus platform. These are independently identified ecosystem relationships, not evidence that either company is the unnamed customer behind MaxLinear’s current design wins.
For Lumentum, the transmission mechanism is the adoption of higher-performance optical sources. Its 200G EML products are explicitly designed to support 1.6T modules using 8 optical lanes. The move toward 200G-per-lane deployments supports the relevant laser product mix and qualification pipeline. The exact benefit depends on the balance of EML, silicon-photonics, and other implementations, rather than simply the aggregate number of terabits deployed.
For Fabrinet, the benefit is increased demand for complex optical packaging, assembly, integration, and testing across its customer programs. The business can participate through manufacturing throughput without needing to own the winning merchant DSP architecture. However, MaxLinear’s call does not identify a specific Fabrinet program or establish that its customer mix exactly matches MaxLinear’s ramp.
The important negative qualification is component bargaining power. Approximately doubling DSP ASPs and adding TIA content increase the semiconductor value embedded in each module. Module vendors may pass those costs through, absorb part of them, or offset them through other design efficiencies. Strong industry revenue therefore does not establish that module gross margins expand proportionately. For contract manufacturers, revenue associated with more expensive purchased components can also behave differently from value-added manufacturing profit.
Management’s assertion that DSP capacity is a major bottleneck should not be generalized into a conclusion that lasers or other optical components are abundant throughout the industry. It describes MaxLinear’s assessment of the constraints affecting its business. It supports a positive demand read-through for Lumentum and Coherent, but does not independently establish their supply tightness, price increases, or margin outlook.
Near-term trading catalyst: Optical supplier earnings and order commentary should test whether 800G remains durable while 1.6T ramps. The strongest confirmation would combine higher shipment expectations with stable or improving gross profit, rather than revenue growth driven principally by more expensive component pass-through.
Longer-duration fundamental shift: The overlapping product cycles can support a broader installed base and sustained demand for manufacturing capacity. Nevertheless, shipment destinations, module-maker headquarters, and ultimate hyperscaler demand are different exposures. Management’s expectation that US data centers adopt 1.6T earlier than Chinese counterparts does not imply that Chinese module manufacturers necessarily lose revenue. The call did not disclose sufficient customer geography to support that conclusion, and supplier-specific export eligibility remains a separate consideration.
AI NETWORKING SYSTEMS AND CLOUD INFRASTRUCTURE
A BROADER QUALIFIED OPTICS ECOSYSTEM SUPPORTS OPEN ETHERNET DEPLOYMENTS AND REDUCES SYSTEM-LEVEL SOURCING RISK (READ-THROUGH 6)
Affected companies: Arista Networks (ANET: US); Broadcom (AVGO: US).
Directional impact and magnitude: Positive for the execution of 800G and 1.6T Ethernet networking roadmaps. Moderate strategic relevance to Arista’s AI networking opportunity and positive but less material consolidated relevance to Broadcom. This is deployment-risk reduction and demand corroboration, not a disclosed incremental customer order.
The call’s strongest supporting evidence is the combination of earlier Rushmore shipments, widening module-maker engagement, and qualification work spanning switches, competing silicon, and existing 800G infrastructure. Seendripu explained that multiple module makers target the same data centers and that qualification requires interoperability across several technology generations. He also emphasized that the immediate qualification constraint was internal support capacity, not wafer availability.
The transmission mechanism is system readiness. A high-bandwidth switch platform has limited commercial value if customers cannot source enough qualified optics to populate it reliably. Additional qualified DSP and module combinations can increase supplier choice, reduce dependence on a narrow component source, and improve the ability to deploy a complete network rather than isolated switching hardware.
Arista’s announced 7060XE7 roadmap provides a concrete product alignment. Its 1.6T air-cooled platforms were scheduled for Q4 2026, followed by liquid-cooled and additional 800G configurations in Q1 2027. Arista also publicly identifies Broadcom’s Tomahawk 6 switching silicon in this platform ecosystem. MaxLinear’s progressing 1.6T qualifications are therefore consistent with the timing of commercially relevant Ethernet infrastructure, even though no direct Arista-MaxLinear supply relationship was disclosed.
The less obvious benefit is architectural flexibility. Arista’s platform documentation supports multiple optical implementations, including LPO, while MaxLinear is expanding beyond full optical DSPs into TIAs and other interfaces. The ecosystem can consequently improve even when the semiconductor content of a particular link changes. That favors system vendors capable of supporting several qualified architectures rather than relying on a single optical implementation.
This distinction also limits the bullish read-through for standalone DSP suppliers. Management’s personal 2030 forecast of predominantly pluggable optics does not establish that every pluggable retains a full DSP. Arista’s LPO support and NVIDIA’s commercial CPO development demonstrate that signal-processing content remains architecture-dependent. Networking bandwidth growth is more certain than the exact allocation of semiconductor revenue per link.
Near-term trading catalyst: Arista’s next AI networking outlook, progress against its Q4 2026 and Q1 2027 platform schedule, and evidence of broader optical availability. Additional qualified suppliers can support deployment confidence, but an initial component shipment should not be treated as proof of immediate large-scale network installation.
Longer-duration fundamental shift: A more diverse and interoperable merchant ecosystem strengthens the commercial viability of open Ethernet fabrics. The benefit flows through customer choice, sourcing resilience, and platform flexibility. It does not establish that Arista has taken share from NVIDIA or that a named hyperscaler has selected MaxLinear. The higher-conviction portfolio conclusion is that networking-system exposure can benefit from expanding connectivity options without requiring a single merchant DSP architecture to dominate.
Report record
- Sector
- Information Technology
- Fiscal period end
- September 30, 2026
- Report date
- October 22, 2026
- Analysis
- 6726 words
- Read-throughs
- 2918 words
- Content fingerprint (PDF)
e501ce69b4bc- Content fingerprint (analysis)
d153750af39e- Content fingerprint (read-throughs)
89531e6aa4af
Prepared from the company's earnings release and earnings call transcript. Figures as reported by the company. For information only. Not investment advice.
More from MaxLinear, Inc.
No other reports yet.
More in Information Technology
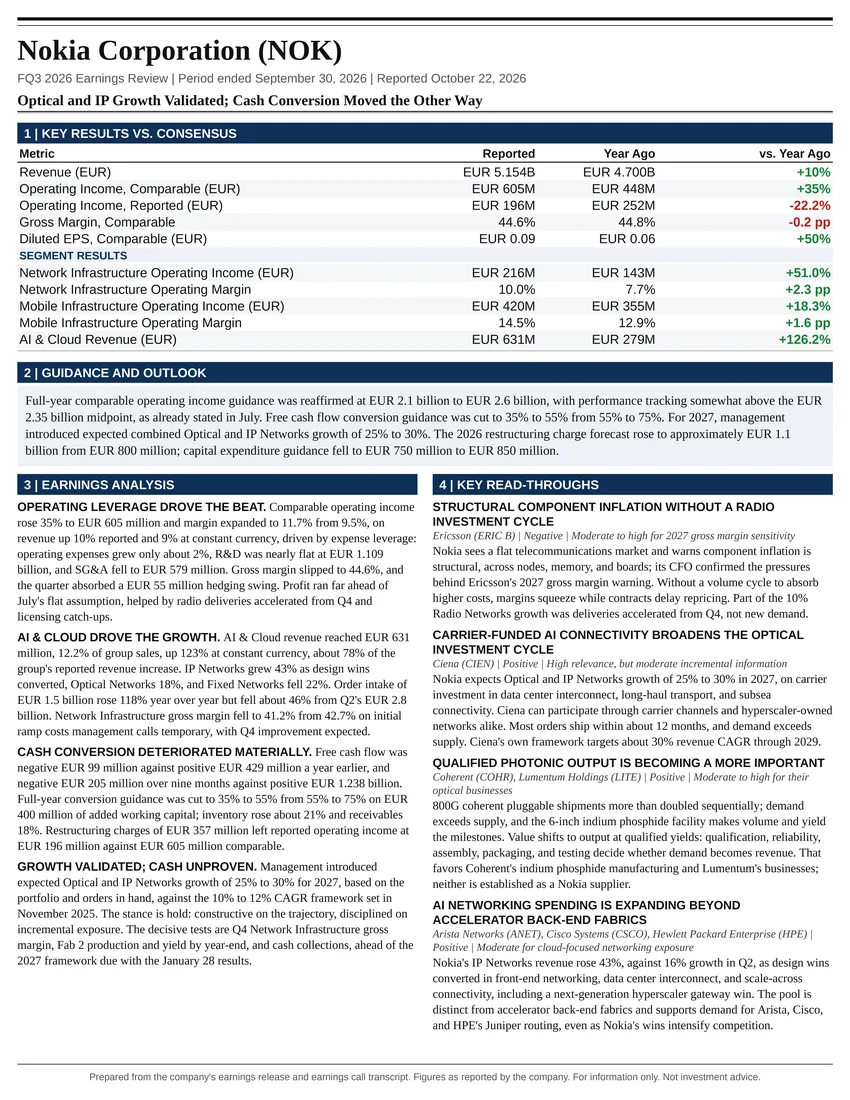
Optical and IP Growth Validated; Cash Conversion Moved the Other Way
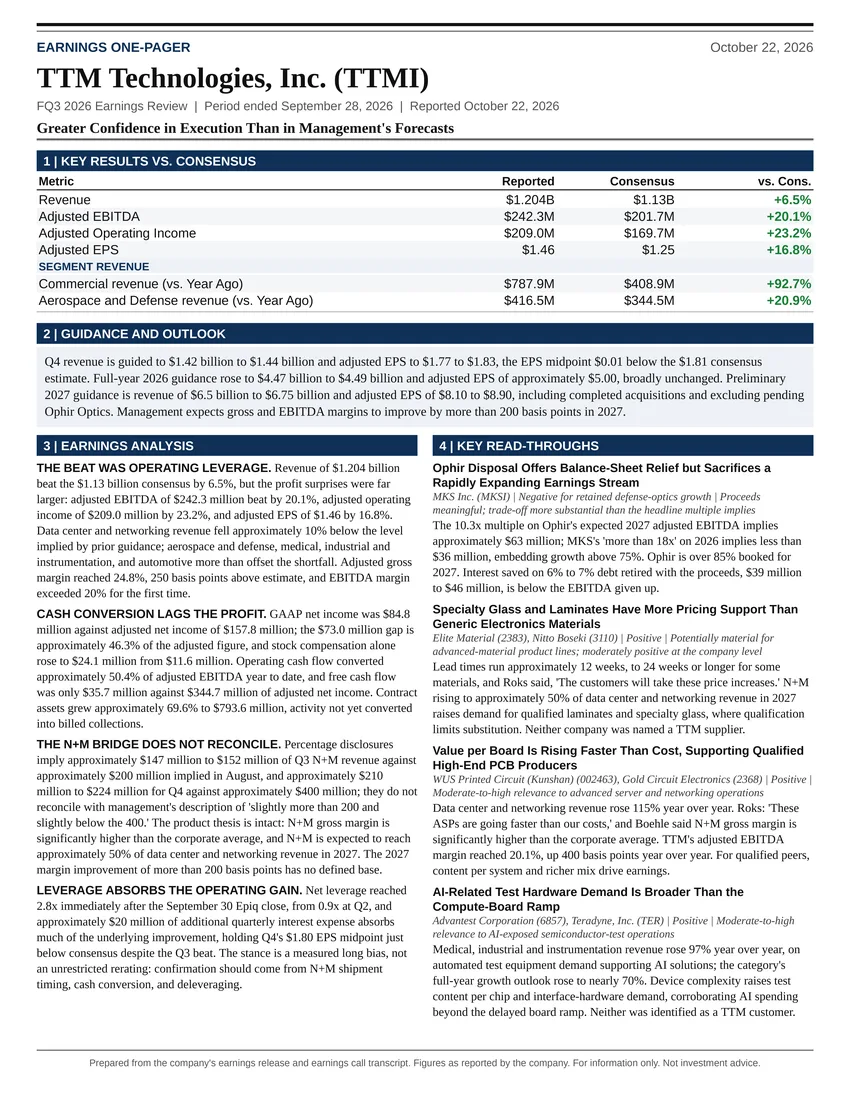
Greater Confidence in Execution Than in Management's Forecasts
All Information Technology reports
Follow @AtlasPeakRes on X for new earnings reports as they publish.