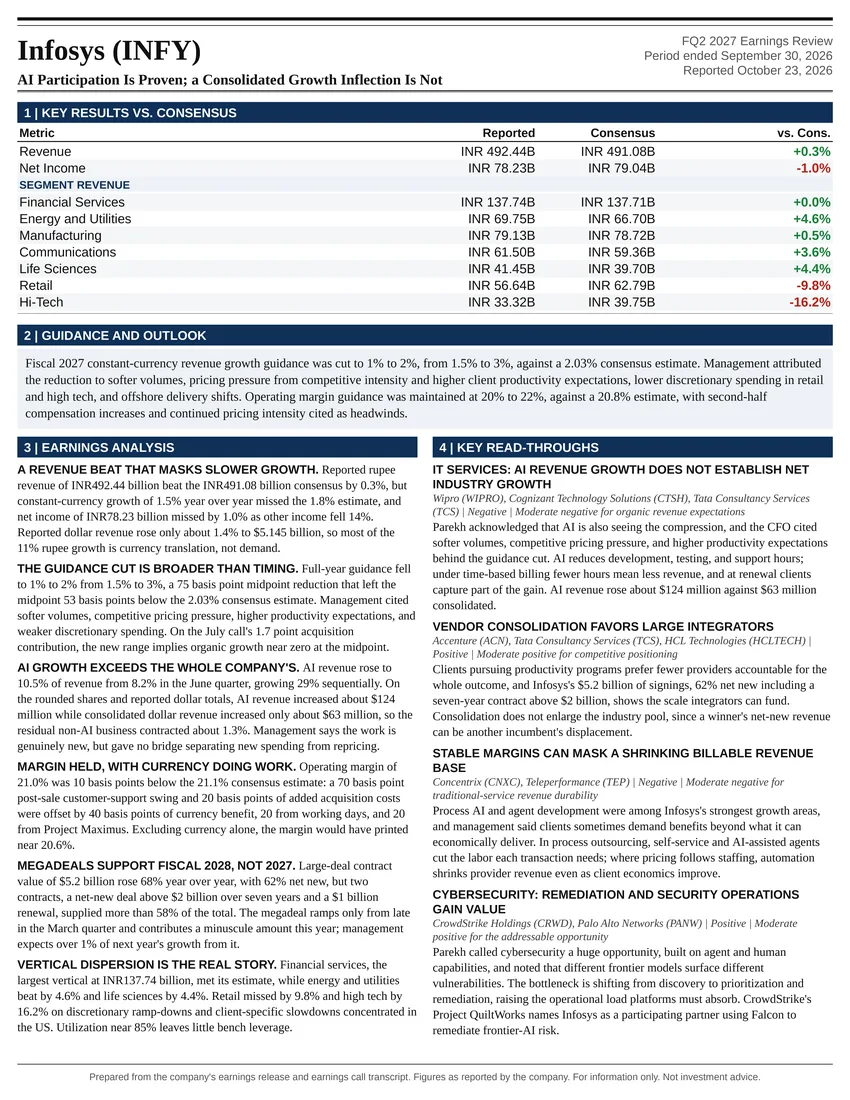
AI Participation Is Proven; a Consolidated Growth Inflection Is Not
Earnings Reports
TTM Technologies, Inc. FQ3 2026 Earnings Report
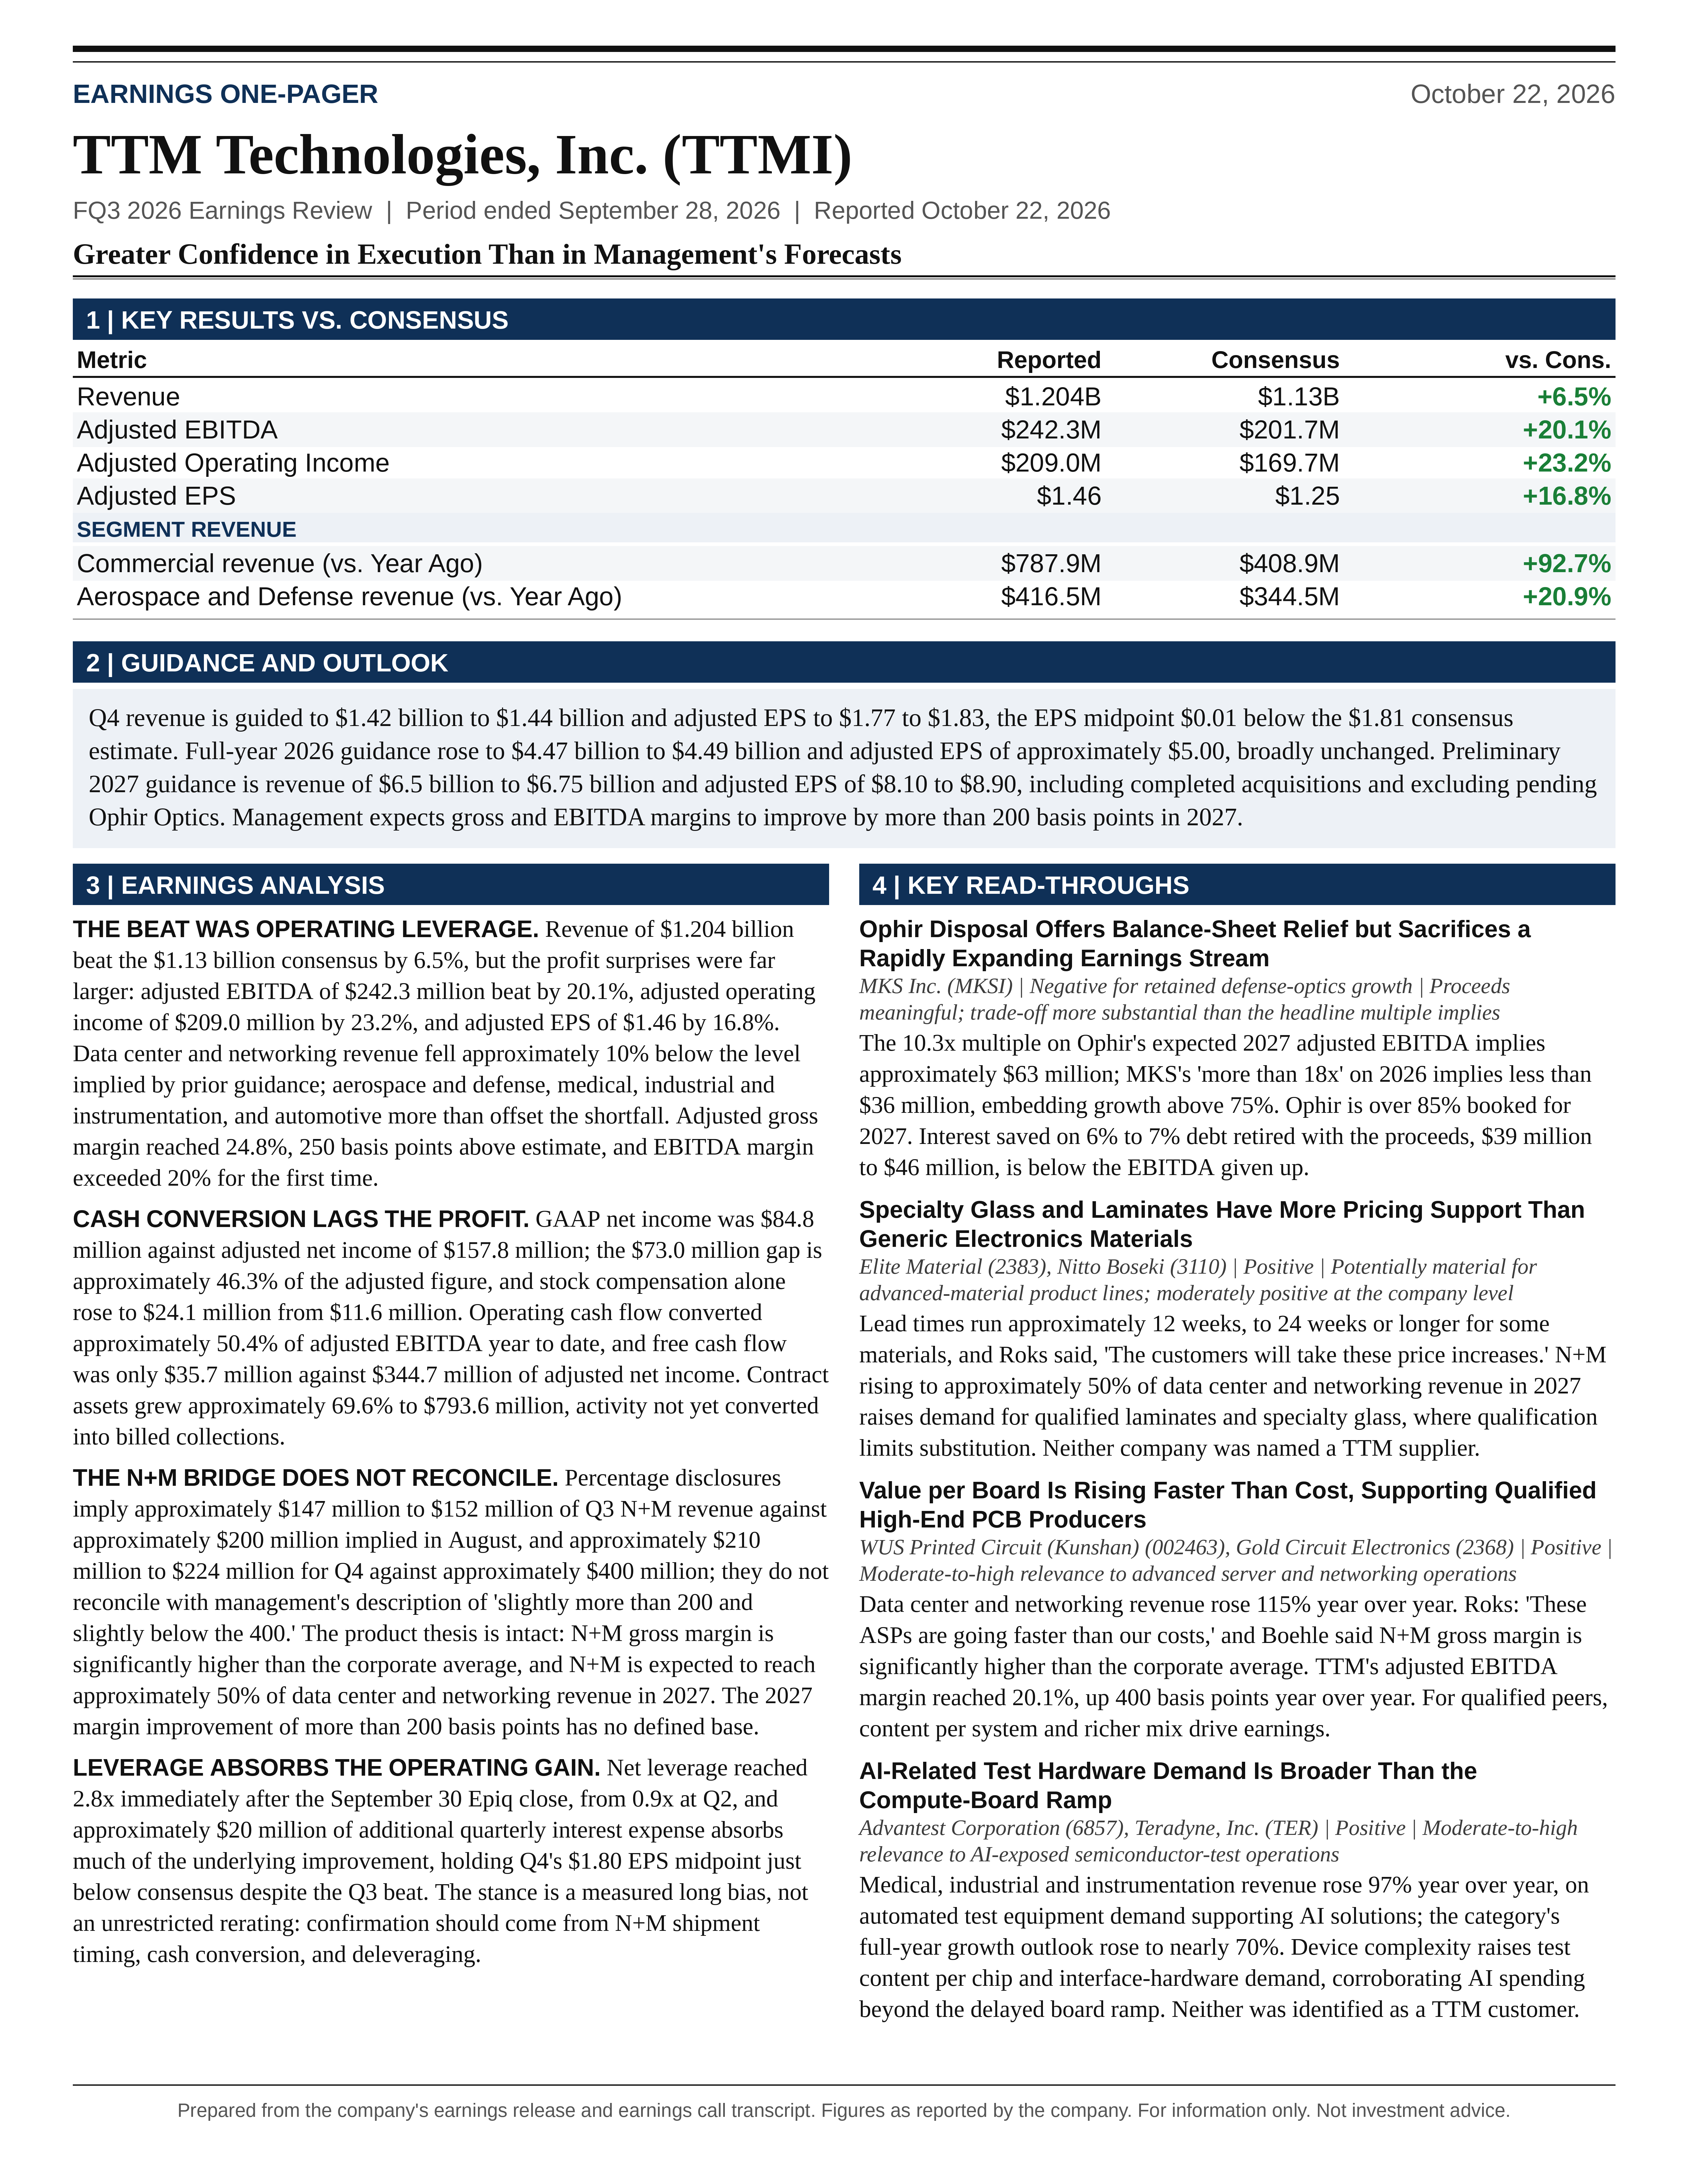
TTM Technologies, Inc. (TTMI) FQ3 2026 earnings: Greater Confidence in Execution Than in Management's Forecasts. Full earnings analysis, key read-throughs, and the one-page exhibit from Atlas Peak Research.
TTM Technologies, Inc. (TTMI)
Sector: Information Technology · FQ3 2026 · Period end September 28, 2026 · Reported October 22, 2026
TTM’s Q3 2026 results support a constructive investment view, but the quarter warrants greater confidence in operating execution than in the precision of management’s product-level forecasts and capital-allocation assumptions.
Download the one-page report (PDF)
View one-page exhibit
Download analysis (.md)
Download read-throughs (.md)
Post to X
One-Page Exhibit
Earnings Analysis
EXECUTIVE CALL SUMMARY: TTM Technologies, Inc. (10/22/26)
TTM’s Q3 2026 results support a constructive investment view, but the quarter warrants greater confidence in operating execution than in the precision of management’s product-level forecasts and capital-allocation assumptions. Revenue of $1.204 billion increased 60% year over year, adjusted EBITDA doubled to $242.3 million, and adjusted EPS increased 118% to $1.46. The company delivered substantial margin expansion despite data center and networking revenue falling approximately 10% below the level implied by its prior guidance. Aerospace and defense, medical, industrial and instrumentation, and automotive collectively more than offset that shortfall. This breadth is economically important: the quarter demonstrated that earnings improvement was not dependent exclusively on the anticipated N+M interconnect ramp.
The most consequential disclosure was preliminary 2027 guidance of $6.5 billion to $6.75 billion in revenue and $8.10 to $8.90 in adjusted EPS. The midpoints imply approximately 48% revenue growth and 70% EPS growth versus the updated 2026 outlook. These projections include completed acquisitions and their financing costs but exclude pending acquisitions, including Ophir Optics. The outlook materially exceeds the growth trajectory discussed on the preceding call, when management reiterated 15% to 20% organic revenue growth for 2027 and 2028. Nevertheless, the comparison is not fully like-for-like because the new outlook includes acquired businesses, and management did not provide a reliable organic-growth reconciliation.
The principal counterweight is that the strong Q3 beat did not translate into a comparably stronger near-term consolidated earnings outlook. Q4 revenue guidance is essentially unchanged from the level implied by the previous annual forecast, and its $1.80 adjusted EPS midpoint is slightly below the supplied $1.81 consensus estimate. Full-year adjusted EPS guidance of approximately $5.00 is also broadly unchanged from the previous expectation that earnings would approach $5.00. Acquisition financing, including approximately $20 million of additional quarterly interest expense, absorbs a significant portion of the underlying operating improvement.
The balance sheet is materially more leveraged than the call’s forward-looking emphasis on leverage below 2.0x might suggest. The earnings release disclosed net leverage of 2.8x immediately following the September 30 Epiq acquisition, compared with 0.9x at Q2. Meanwhile, year-to-date free cash flow was only $35.7 million despite $344.7 million of adjusted net income. Strong prospective cash generation is therefore essential to the investment thesis, not merely an incremental benefit.
At the $98.00 premarket reference price in the supplied earnings notice, the shares trade at approximately 11.5x the 2027 adjusted EPS midpoint, compared with 19.6x the 2026 midpoint. That valuation is attractive if the new earnings trajectory converts into sustainable cash flow. It is less compelling if the forecast depends on unusually favorable pricing, accelerated customer ordering, or continued balance-sheet expansion. The appropriate stance is a measured long bias rather than an unrestricted rerating thesis. Confirmation of N+M shipment timing, cash conversion, and deleveraging should determine whether exposure is increased.
QUARTERLY PERFORMANCE AND THE QUALITY OF THE BEAT
Revenue exceeded the supplied Bloomberg consensus estimate of $1.13 billion by approximately $73.9 million, or 6.5%. It exceeded the $1.12 billion midpoint of management’s August guidance by $83.9 million, or 7.5%, and exceeded the $1.14 billion upper bound by 5.6%. Adjusted EPS exceeded consensus by $0.21, or 16.8%, and exceeded management’s $1.24 guidance midpoint by $0.22, or 17.7%. Adjusted EBITDA exceeded the $201.7 million consensus estimate by approximately 20.1%, while adjusted operating income of $209.0 million exceeded the $169.7 million estimate by 23.2%.
The larger profit surprises relative to the revenue surprise indicate that the quarter was principally an operating-leverage and mix event rather than simply a shipment-volume beat. Adjusted gross margin reached 24.8%, versus 21.5% a year earlier and 21.9% in Q2. It also exceeded the supplied 22.3% consensus estimate by 250 basis points. Adjusted operating margin increased to 17.4%, versus 12.3% a year earlier and 13.8% in Q2. Adjusted EBITDA margin reached 20.1%, versus 16.1% a year earlier and 16.6% sequentially.
The sequential progression is particularly strong. Revenue increased approximately 19.9% from Q2, while adjusted EBITDA increased approximately 45.3% and adjusted EPS increased approximately 47.5%. Incremental adjusted EBITDA margin was approximately 37.8% on the sequential revenue increase and 26.9% on the year-over-year increase. The sequential figure should not be treated as a sustainable contribution margin because it includes mix changes, production improvements, and potentially premium orders. Nevertheless, it demonstrates substantial earnings sensitivity to higher factory utilization and richer product content.
Expense leverage was also meaningful. Adjusted selling and marketing expense increased to $23.2 million from $20.5 million, but declined to 1.9% of revenue from 2.7%. Adjusted general and administrative expense increased to $57.3 million from $42.1 million, but declined to 4.8% of revenue from 5.6%. Combined, these categories contributed approximately 160 basis points of year-over-year operating leverage. Gross-margin improvement contributed most of the remaining operating-margin expansion.
The reporting segments corroborate the improvement. Commercial segment revenue increased to $787.9 million from $408.9 million, while segment operating income increased to $166.3 million from $60.0 million. Segment operating margin consequently increased to approximately 21.1% from 14.7%. Aerospace and defense segment revenue increased to $416.5 million from $344.5 million, with segment operating income increasing to $77.0 million from $56.0 million and margin increasing to approximately 18.5% from 16.3%. These segment measures exclude corporate allocations and other reconciling items and should not be equated with consolidated GAAP or adjusted operating margin.
Epiq closed on September 30, after the September 28 fiscal quarter-end. Its operating contribution therefore does not explain the Q3 earnings acceleration. That distinction strengthens the conclusion that the quarter’s principal profit improvement occurred within the pre-existing operating platform, although the separate contribution from the completed Swiss acquisition was not quantified.
END-MARKET PERFORMANCE: THE CONSOLIDATED BEAT MASKED A DIFFERENT MIX
The end-market composition of the quarter differed materially from the previous forecast. Applying the disclosed rounded market percentages to consolidated revenue produces approximate Q3 revenue of $494 million for data center and networking, $409 million for aerospace and defense, $217 million for medical, industrial and instrumentation, and $84 million for automotive. These are derived estimates rather than separately reported dollar figures.
The preceding call anticipated Q3 revenue shares of 49% for data center and networking, 32% for aerospace and defense, 13% for medical, industrial and instrumentation, and 6% for automotive. Applied to the prior $1.12 billion consolidated midpoint, those assumptions implied approximately $549 million, $358 million, $146 million, and $67 million, respectively. The resulting bridge indicates an approximately $55 million data center and networking shortfall, offset by approximately $51 million of aerospace and defense outperformance, $71 million of medical, industrial and instrumentation outperformance, and $17 million of automotive outperformance. Rounding limits precision, but the direction is clear.
This mix bridge explains why the quarter should not be characterized simply as an AI-board shipment beat. The strongest surprise relative to prior expectations was outside the data center and networking category. At the same time, some instrumentation demand is linked to AI semiconductor testing, so the revenue diversification is greater than the underlying economic-demand diversification.
The distinction between end markets and reporting segments is also important. The aerospace and defense reporting segment generated $416.5 million, whereas the rounded aerospace and defense end-market percentage implies approximately $409 million. These classifications should not be substituted for each other. Historical reporting-segment comparisons in the current release were recast to incorporate RF and Specialty Components within aerospace and defense.
N+M: ATTRACTIVE ECONOMICS, BUT A MATERIAL FORECAST RECONCILIATION PROBLEM
N+M remains the central driver of the potential structural earnings upgrade. Management described its advanced asymmetrical interconnect offering as capturing substantially more value within customers’ data center and networking architectures. Roks stated, “These ASPs are going faster than our costs,” and emphasized that the relevant comparison concerns the value delivered rather than a simple material-cost markup. Boehle added, “Our gross margin on that N+M product is significantly higher than our corporate average.”
The economic implication is favorable. A product that combines higher content per system with above-average gross margin can increase revenue and profitability even without proportional growth in customer system volumes. Early customer engagement, manufacturing complexity, qualification requirements, and the difficulty of maintaining yields at advanced specifications can support differentiation. Management’s reference to approximately a factor of 4 in value or complexity should not, however, be interpreted as a universal 4x revenue uplift across the existing business, a 4x margin increase, or a guaranteed expansion in addressable market.
Execution commentary was reassuring. Roks stated, “There are no technical issues. Ramp is going well. Yield numbers are where they should be.” Of the initial 3 major programs, 2 were progressing well and 1 had shifted because of the customer’s schedule. The delayed program is expected to ramp during the latter part of Q4 and reach full production in Q1 2027. Management also described an eventual opportunity set of approximately 5 to 10 programs.
The numerical disclosures were substantially less reassuring. On the August call, management explicitly discussed approximately $600 million of N+M revenue in the second half of 2026, with approximately 1/3 in Q3 and 2/3 in Q4. That implied approximately $200 million and $400 million, respectively. On the current call, management instead described N+M as approximately 30% to 31% of roughly $490 million of Q3 data center and networking revenue, implying approximately $147 million to $152 million. It described Q4 N+M as approximately 30% to 32% of approximately $700 million, implying approximately $210 million to $224 million.
Those percentages imply a Q3 shortfall of approximately 24% to 27% and a Q4 forecast reduction of approximately 44% to 48% relative to the previous product-level expectations. They do not reconcile with the subsequent description of revenue as “slightly more than 200 and slightly below the 400.” The repeated percentage disclosures suggest a materially different shipment profile, but the initial-draft nature of the transcript and contradictory spoken figures prevent a definitive product-revenue conclusion.
This discrepancy matters because the N+M ramp supports both the margin-expansion thesis and the additional capacity commitment. Customer scheduling can explain delayed revenue without implying technical failure, but it does not eliminate the financial consequences of delayed absorption, deferred cash collection, or capacity installed before demand arrives. Management also acknowledged some Q3 pull-forward activity, reinforcing the need to evaluate the ramp over multiple quarters rather than extrapolating isolated shipment periods.
For 2027, management expects N+M to represent approximately 50% of data center and networking revenue. That is an important mix objective, but the company did not disclose a corresponding 2027 end-market revenue forecast. A reliable absolute N+M revenue target therefore cannot be derived directly from the call. The percentage also should not be confused with 50% of total company revenue.
The fundamental product thesis remains intact, but the shipment bridge is unresolved. The next material confirmation point is whether the delayed program reaches full production in Q1 2027 and whether the company provides consistent quarterly N+M revenue and mix disclosures.
AEROSPACE AND DEFENSE: STRONGER VISIBILITY AND IMPROVING ECONOMICS
Aerospace and defense revenue increased 21% year over year, accelerating from 14% growth in Q2. The end market represented 34% of consolidated Q3 revenue and is expected to represent approximately 31% in Q4. The declining percentage does not indicate weakening defense demand; it primarily reflects the faster expansion expected in data center and networking.
Management raised its full-year aerospace and defense growth expectation to approximately 20%, including acquisitions, or approximately 18% organically. The previous call anticipated growth in the low-to-mid-teens. The organic figure establishes that the improvement is not simply acquisition-driven.
Bookings and backlog provide meaningful support. Aerospace and defense book-to-bill was approximately 1.6x, compared with 1.3x in Q2. Program backlog reached a record $2.0 billion, compared with approximately $1.7 billion at Q2 and just under $1.5 billion a year earlier. Management stated that approximately 65% of projected 2027 aerospace and defense revenue was already visible.
The disclosed bookings span naval radar, maritime surveillance, Golden Dome, and restricted programs. Roks characterized restricted programs as “incredibly sticky and very difficult for competitors to try and displace.” Qualification requirements, security restrictions, incumbent engineering knowledge, and platform-specific integration can create substantial switching costs. The resulting revenue durability supports a valuation premium to undifferentiated PCB manufacturing.
Backlog visibility nevertheless should not be interpreted as guaranteed timing or margin. Defense programs remain exposed to appropriations, contract modifications, production scheduling, customer acceptance, and funding priorities. The call did not disclose the funded portion of backlog, cancellation provisions, or the profitability of the new awards. Golden Dome should therefore be valued through actual bookings and subsequent revenue conversion rather than through the scale of the overall policy initiative.
Approximately 50% of aerospace and defense activity is already described as “up the chain,” encompassing sensing and communications rather than conventional PCB production alone. Epiq and the proposed Ophir acquisition deepen that exposure. This can increase content per platform and customer integration, but also introduces greater systems-engineering responsibility, software requirements, qualification costs, and potential competition with customers or partners at higher levels of the supply chain.
MEDICAL, INDUSTRIAL AND INSTRUMENTATION: THE MOST IMPORTANT POSITIVE SURPRISE
Medical, industrial and instrumentation revenue increased 97% year over year, compared with 33% growth in Q2. The category represented 18% of Q3 revenue, versus the previously expected 13%. Management increased its 2026 growth outlook to nearly 70%, compared with 35% to 40% on the preceding call.
The composition of this growth matters. Management cited price adjustments that better capture technology value and demand for automated test equipment supporting AI. The earnings presentation additionally identified increased quick-turn premium orders. These disclosures support both a structural explanation, involving higher-value products, and a potentially less recurring explanation, involving urgency-related pricing.
Premium orders can generate attractive incremental margins, but their profitability should not automatically be capitalized as permanent. Customer scheduling urgency can normalize, premium lead-time economics can fade, and unusually high utilization can invite competitive capacity additions. The absence of a bridge separating unit volumes, ordinary pricing, premium orders, and acquisition effects limits the ability to estimate a normalized growth rate.
The Q4 outlook implies approximately $200 million of revenue, based on 14% of the consolidated midpoint. That would be approximately 8% below the derived Q3 level, despite management expecting approximately 90% year-over-year growth. The sequential decline suggests that the exceptional Q3 result should not be extrapolated mechanically.
The Swiss acquisition broadens the medical portfolio through specialty medtech and audiology exposure. Longer qualification cycles and embedded customer relationships can support revenue durability. However, the AI-related instrumentation component means this category is not a pure defensive healthcare counterweight to data center spending.
AUTOMOTIVE: A SMALLER BUT POSITIVE CHANGE IN EXPECTATIONS
Automotive revenue increased 11% year over year and represented 7% of Q3 revenue. Management now expects mid-single-digit growth for 2026, versus a previous expectation of a mid-single-digit decline. The change represents approximately a 10-percentage-point improvement in directional growth expectations.
The strategy remains selective rather than volume-led. Management is prioritizing higher-value products with acceptable margins and sees share opportunities as competitors reduce participation. This is favorable if growth reflects profitable program selection rather than a return to lower-return commodity business.
The improvement also indicates progress against the material-availability issues discussed on the previous call. However, automotive remains too small to offset a substantial data center slowdown. Its principal investment contribution is incremental utilization, broader customer exposure, and evidence that operating execution is improving across the portfolio.
Q4 AND FULL-YEAR 2026 GUIDANCE: STRONG ABSOLUTE GROWTH, LIMITED INCREMENTAL UPGRADE
Q4 revenue guidance of $1.42 billion to $1.44 billion implies approximately 18.8% sequential growth at the midpoint. Against reported Q4 2025 revenue of $774.3 million, the midpoint implies approximately 84.7% year-over-year growth. Adjusted EPS guidance of $1.77 to $1.83 implies approximately 23.3% sequential growth and approximately 157% year-over-year growth at the midpoint.
Those growth rates are substantial, but the expectations comparison is more restrained. The revenue midpoint matches the supplied $1.43 billion consensus estimate, while the EPS midpoint is $0.01 below consensus. The prior annual revenue outlook of approximately $4.4 billion, less reported first-half revenue of $1.850 billion and the prior Q3 midpoint of $1.12 billion, already implied approximately $1.43 billion for Q4. The new Q4 revenue outlook is therefore essentially unchanged on that basis.
The annual revenue increase to $4.47 billion to $4.49 billion largely incorporates the Q3 beat. It does not indicate a similarly sized incremental improvement in the Q4 outlook. This distinction is important when assessing why a strong reported quarter might not produce a favorable immediate share-price response.
The EPS bridge is less favorable. The previous expectation that full-year EPS would approach $5.00, less reported first-half EPS of $1.74 and the prior Q3 midpoint of $1.24, implied approximately $2.02 for Q4. The current midpoint is $1.80. Because the prior annual language was approximate rather than a precise range, this is an indicative comparison rather than a formal $0.22 guidance cut. Nevertheless, it demonstrates how the Q3 upside is being offset by a lower implied subsequent-quarter earnings contribution.
Financing explains much of the difference. Q4 interest expense is expected to reach approximately $33.9 million, compared with approximately $12.1 million on the adjusted basis discussed for Q3. Boehle stated that the additional debt increases interest expense by approximately $20 million per quarter. At an illustrative 17% tax rate and the guided Q4 share count, that represents approximately $0.15 of quarterly EPS, or approximately $0.62 annualized. Acquisition operating contributions offset part of that burden, but the financing cost is economically meaningful.
The implied Q4 margin trajectory remains favorable. Using the $1.80 EPS midpoint, 107.8 million diluted shares, the disclosed nonoperating assumptions, and a 17% tax-rate midpoint implies adjusted operating margin of approximately 18.8% and adjusted gross margin of approximately 26.5%. An approximate reconstruction consistent with the company’s EBITDA definition implies adjusted EBITDA margin near 21.5%. These are derived estimates, not explicit margin guidance. Across the stated 15% to 19% tax range, the approximate EBITDA margin implication is 21.1% to 21.9%.
The expected Q4 mix is demanding. Data center and networking revenue of approximately $701 million would increase roughly 42% sequentially and account for approximately 92% of the consolidated sequential revenue increase, using the rounded market shares. Consequently, Q4 execution becomes much more dependent on data center shipment conversion than the diversified Q3 beat initially suggests.
Full-year revenue of approximately $4.48 billion implies growth of approximately 54.1% against the verified $2.906 billion reported for 2025. The call’s reference to approximately 48% growth for 2026 does not reconcile with those reported dollar amounts. The approximately 48% figure does reconcile with the 2027 midpoint relative to the current 2026 midpoint.
2027 GUIDANCE: A LARGE UPGRADE, BUT NOT A FULLY RECONCILED ORGANIC FORECAST
The 2027 revenue range implies approximately 45% to 51% growth against the 2026 midpoint. The adjusted EPS range implies approximately 62% to 78% growth. At the midpoints, adjusted net income would be approximately $918.9 million, based on 108.1 million diluted shares, representing an adjusted net margin of approximately 13.9%.
The prior call reiterated 15% to 20% organic revenue growth for 2027 and 2028. Applied illustratively to the then-current $4.4 billion 2026 outlook, that trajectory suggested approximately $5.06 billion to $5.28 billion of 2027 revenue before acquisition effects. The new $6.625 billion midpoint is materially higher. However, the new forecast includes Epiq and GS Swiss, and no sufficiently detailed acquisition bridge was supplied to calculate the revised organic growth rate precisely.
The magnitude of the new annual growth rate should also be viewed against the exit run rate. Annualizing the Q4 2026 midpoints produces approximately $5.72 billion of revenue and $7.20 of adjusted EPS. The 2027 midpoints are approximately 15.8% and 18.1% above those annualized figures. This does not make the forecast conservative, because seasonality, acquisition timing, and program ramps matter. It does show that a meaningful portion of the headline annual growth reflects the strong expected exit rate from 2026 rather than requiring 48% growth from the Q4 operating level.
Management expects N+M mix to increase and stated that gross margin and EBITDA margin would improve by more than 200 basis points in the next year. The comparison base was not explicitly defined. Applying that statement directly to Q3’s 20.1% EBITDA margin would imply more than 22.1%, but that interpretation is not established. A comparison with estimated full-year 2026 margin, approximately 19% under the Q4 reconstruction, would imply a 2027 margin above approximately 21%. The distinction is material to valuation.
The outlook has significant operating sensitivity. At $6.625 billion of revenue, a 100-basis-point difference in operating margin corresponds to approximately $66 million of pretax earnings, or approximately $0.51 per share after an illustrative 17% tax rate. A 10% revenue shortfall, assuming a 30% decremental operating margin and the same tax rate, would reduce EPS by approximately $1.53. These sensitivities illustrate how modest deviations in product mix, utilization, or customer timing could move earnings outside the preliminary range.
The guided share count increases only modestly from approximately 107.5 million for 2026 to 108.1 million for 2027. The projected EPS expansion is therefore an operating and financial-performance assumption, not a buyback-driven result.
The forecast also excludes pending Ophir, ILFA, and Merlin transactions. Roks nevertheless referred during Q&A to approximately $500 million of acquisition revenue while discussing a set of acquisitions that included Ophir. That comment cannot be reconciled with the formal forecast perimeter and should not be used to calculate an organic-growth rate or to assume Ophir is already embedded.
BOOKINGS AND BACKLOG: STRONG SIGNALS, NOT EQUIVALENT TO SECURED CASH FLOW
The official release reported consolidated book-to-bill of 2.13x, compared with 1.49x in Q2 and approximately 1.15x a year earlier. Commercial book-to-bill reached approximately 2.5x, while aerospace and defense reached approximately 1.6x. These ratios support the assertion that demand is outpacing current shipments.
The 90-day backlog increased to approximately $1.3 billion from $901 million in Q2 and approximately $610 million a year earlier. That provides substantial near-term shipment visibility. It is also explicitly subject to cancellation. The 90-day backlog and the $2.0 billion defense program backlog measure different horizons and can overlap; they should not be added into a single revenue-coverage figure.
Longer material lead times create a more nuanced interpretation of high bookings. Customers may place orders earlier to secure capacity and critical materials. Such behavior improves supplier visibility but can also inflate book-to-bill relative to final consumption and increase the risk of subsequent rescheduling. The disclosures do not establish double ordering, but neither do they justify treating the full order acceleration as immediate incremental end demand.
The strongest confirmation would be continued shipment conversion without deteriorating receivable collection, excessive contract-asset growth, or rising cancellations. Backlog growth alone is insufficient when the business is simultaneously undertaking substantial capacity expansion and debt-funded acquisitions.
MATERIALS, PRICING AND CAPACITY EXECUTION
Management described material lead times of approximately 12 weeks, extending to 24 weeks or longer for certain inputs. Copper-clad laminates and specialized glass materials remain important constraints. Aerospace and defense supply conditions were characterized as stable, while data center and networking supply management remains an ongoing task.
Pricing commentary was favorable. Roks stated, “The customers will take these price increases.” The company appears able to pass through higher material costs, while advanced product complexity supports additional value-based pricing. The combination can protect gross profit dollars and potentially expand margins.
Pass-through capability is not equivalent to immunity from supply-chain risk. Pricing adjustments can lag purchases, materials can constrain shipment timing even when customers accept higher prices, and higher-cost inventory can consume cash before revenue is collected. More complex boards also expose the company to yield losses and rework costs that may not be recoverable through contractual pricing.
Penang remains an important operational milestone. The company continues to expect the facility to approach breakeven in Q4, broadly consistent with the prior discussion of late-Q3 or Q4 progress. Reduced startup losses contribute to consolidated margin improvement, while the facility adds geographic flexibility and advanced interconnect capacity. Breakeven, however, is an intermediate milestone rather than evidence of a mature return on invested capital.
The additional $400 million capacity program is primarily directed toward N+M and is expected to begin in Q4 2026, continue into early 2028, and primarily support 2028 production. The October 12 announcement specified expansion across 4 Chinese facilities and Penang. The program is incremental to a previously disclosed $1.2 billion commercial capacity commitment through 2029.
The broader capital-investment envelope should not be reduced to a single unqualified $1.6 billion or $1.7 billion figure. Earlier disclosures separately discussed aerospace and defense investment, Syracuse, and the planned Eau Claire innovation center, while the call used differing descriptions of the previous investment base. The cleanest conclusion is that the incremental $400 million is a further commercial commitment on top of an already substantial multiyear investment program.
Brownfield expansion reduces construction complexity, leverages existing labor and process infrastructure, and can shorten the interval between equipment installation and revenue. It does not eliminate demand risk, equipment obsolescence, qualification delays, or underutilization. The call did not establish that customers have provided take-or-pay commitments, minimum-volume guarantees, or capital contributions against the additional spending.
The innovation center’s focus on mSAP, SAP, passives, and embedded optics supports the longer-term objective of remaining relevant as interconnect density and architecture evolve. These initiatives should be treated as strategic development spending rather than near-term revenue already secured by the current backlog.
EPIQ: STRATEGICALLY COHERENT, FINANCIALLY MORE DEMANDING
Epiq adds software-defined radios, RF products, and radiation-tolerant space-computing capabilities that complement TTM’s sensing and communications portfolio. The strategic rationale is credible: combining processing, RF technology, and interconnect capabilities can increase content per defense platform and move the company closer to integrated mission subsystems.
The financial terms require a more demanding assessment. The $1.1 billion purchase was financed through incremental term loans and previously issued 6.750% senior notes. TTM’s September 30 completion announcement explicitly stated that Epiq is expected to be moderately dilutive to adjusted EPS in 2027 and accretive in 2028. Immediate EBITDA accretion should therefore not be confused with immediate per-share value creation.
The August announcement cited a 17.4x multiple of expected 2027 adjusted EBITDA including $9 million of run-rate synergies. That implies approximately $63 million of EBITDA including synergies, or approximately $54 million before those synergies, and an approximate purchase multiple of 20.3x before synergies. The transaction consequently relies on growth, integration benefits, and strategic value rather than a low acquisition multiple.
The earlier transaction announcement anticipated closing leverage of approximately 2.3x. The current earnings release reported 2.8x after completion. The disclosed figures do not provide a complete reconciliation of the difference, including financing and other transaction activity. Nonetheless, the actual starting point for deleveraging is more demanding than the earlier transaction framing.
Boehle’s statement that “this will be the end of the big stuff for a while” is therefore an important capital-allocation signal. A pause in major acquisitions would allow cash generation to support capacity investment, integration, and debt reduction rather than repeatedly extending the funding requirement.
OPHIR OPTICS: A COMPELLING STRATEGIC FIT WITH A LARGE EMBEDDED GROWTH ASSUMPTION
The proposed $650 million Ophir Optics acquisition adds precision infrared thermal-imaging and laser-optics capabilities in Israel and Romania. Combined with Epiq processing and TTM’s RF and radar activities, the business could support smaller, integrated sensing subsystems for unmanned and counter-unmanned platforms, surveillance, reconnaissance, and electronic warfare. Industrial laser-optics applications provide an additional adjacency.
The strategic logic does not automatically establish the magnitude or timing of synergies. Optical sensing systems also require detectors, calibration, software, thermal management, qualification, and customer-specific integration. Management’s sensor-agnostic approach increases flexibility, but it does not establish complete internal ownership of every critical component.
The buyer and seller announcements reveal the central underwriting issue. TTM cited approximately 10.3x expected 2027 adjusted EBITDA before synergies. MKS cited more than 18x projected 2026 adjusted EBITDA. At the $650 million purchase price, those descriptions imply approximately $63 million of 2027 EBITDA versus less than approximately $36 million for 2026, assuming comparable definitions and transaction scope. The implied increase exceeds approximately 75%.
The acquisition is therefore inexpensive only relative to a substantially higher future earnings base. The quoted multiple does not establish a low valuation on current profitability.
Roks addressed the growth assumption by stating that “Ophir is over 85% booked” for 2027. That provides useful demand support, but revenue bookings do not directly secure EBITDA. Margin conversion depends on product mix, labor and material costs, manufacturing execution, and the operating costs required after separation from MKS.
The transaction is expected to close in Q2 2027, with management suggesting a contribution primarily in the second half. It remains subject to regulatory approvals and other conditions. The acquired perimeter excludes MKS’s Ophir Instruments laser-characterization business and the Ophir brand. Revenue, technology, and synergy assumptions should therefore remain confined to the actual optics business being purchased.
Ophir is expected to be immediately accretive to adjusted EBITDA margin and adjusted EPS, unlike Epiq’s initially dilutive EPS profile. That distinction is favorable. However, acquisition accretion is not synonymous with an adequate return on invested capital, particularly when the purchase price is justified by a rapid step-up in target earnings.
CASH FLOW, WORKING CAPITAL AND EARNINGS QUALITY
Operating cash flow increased only 9.1% year over year to $154.7 million, compared with approximately 100% growth in adjusted EBITDA. Operating cash flow represented 12.9% of revenue, down from 18.8% a year earlier, and approximately 63.8% of adjusted EBITDA, down from approximately 117.3%. The prior-year conversion rate was unusually strong, but the current deterioration remains relevant.
Quarterly free cash flow increased approximately 75.7% to $74.8 million. Approximately $19.3 million of the $32.2 million improvement came from lower net capital expenditure, which declined to $79.9 million from $99.2 million. The remainder reflected operating cash-flow growth. The free-cash-flow improvement should therefore not be attributed entirely to improved underlying cash conversion.
The year-to-date figures are more revealing. Operating cash flow was $272.9 million, net capital expenditure was $237.1 million, and free cash flow was $35.7 million. Free cash flow represented approximately 10.4% of adjusted net income. Operating cash flow converted approximately 50.4% of adjusted EBITDA.
Working-capital expansion explains part of the pressure. Accounts receivable and contract assets totaled approximately $1.63 billion at quarter-end, versus approximately $1.03 billion at year-end 2025. Contract assets alone increased approximately 69.6% to $793.6 million. Sequentially, combined receivables and contract assets increased approximately 23.8%, faster than revenue growth of approximately 19.9%.
Accounts payable provided substantial financing support, increasing to approximately $1.03 billion from $543.5 million at year-end. A simplified comparison of receivables, contract assets, inventory, payables, and contract liabilities indicates approximately $96 million of additional net operating working capital from Q2 to Q3. This is not a cash-flow-statement reconciliation because acquisition effects, currency, and other movements are not separately removed. It nevertheless illustrates the scale of the funding requirement associated with growth.
Contract assets are not equivalent to overdue receivables or evidence of improper revenue recognition. They do, however, represent recognized economic activity that has not yet converted into billed cash collection. Sustained growth in this balance requires close attention to billing milestones, customer acceptance, and eventual conversion.
The GAAP-to-adjusted earnings gap also widened materially. GAAP net income was $84.8 million, compared with adjusted net income of $157.8 million. The $73.0 million difference represents approximately 46.3% of adjusted net income, versus approximately 25.2% a year earlier.
Stock-based compensation increased to $24.1 million from $11.6 million. Intangible amortization was approximately $9.2 million, and the reconciliation included acquisition-related expenses, derivative and currency adjustments, and an $18.7 million tax adjustment. These categories have different economic characteristics. Stock compensation is a recurring ownership cost, acquisition expenses can recur under an active acquisition strategy, and amortization relates to purchased assets whose cash cost is excluded from adjusted EPS.
The GAAP tax rate was approximately 40.2%, versus the 19.5% adjusted rate discussed on the call. This helps explain why GAAP EPS increased only modestly sequentially, from $0.77 to $0.79, despite substantial operating improvement. The adjusted tax rate was itself above the prior-year 15% and above the previous Q3 guidance range of 13% to 17%, making the operating earnings beat more notable.
The correct interpretation is neither that adjusted earnings are invalid nor that the adjustments are economically irrelevant. Operating profitability improved substantially, but the valuation case must also account for cash conversion, recurring compensation costs, acquisition spending, and higher debt service.
LEVERAGE AND THE SELF-FUNDING CLAIM
The September 28 balance sheet showed approximately $876 million of cash and approximately $1.644 billion of carrying-value debt. Those figures precede the September 30 Epiq closing and cannot be used alone to characterize the post-acquisition capital structure.
The earnings release’s 2.8x pro forma net-leverage disclosure is the more relevant immediate reference. Management expects leverage to fall within approximately 1.5x to 2.0x by the anticipated Ophir closing. Achieving that outcome while adding another $650 million acquisition and expanding capital spending requires substantial earnings growth, cash generation, or both.
Leverage can decline because EBITDA increases even if net debt does not fall meaningfully. That is financially helpful, but less robust than deleveraging through retained cash. Both net debt and the EBITDA denominator should therefore be monitored.
Management emphasized that organic investment is expected to be funded from operating cash flow without incremental borrowing needs, and that no additional capital-markets access is currently planned. The statements reduce concern about an imminent equity issuance or new external financing requirement. They do not imply a debt-free funding model, since existing borrowings and available facilities remain central to the acquisition strategy.
The central financial test is whether operating cash generation can cover working-capital requirements, cash taxes, higher interest expense, and growth capital expenditure while leaving sufficient residual cash to reduce debt. Positive quarterly free cash flow is encouraging, but the year-to-date record does not yet establish that capacity at the required scale.
DISCLOSURE PRECISION AND MANAGEMENT CREDIBILITY
The disclosures contain several inconsistencies that should be resolved before assigning high confidence to detailed forecasts. The most important are the N+M percentage-versus-dollar contradiction and the acquisition-revenue discussion that appears to include pending Ophir despite formal guidance excluding it.
The investor presentation also contains a narrower 2027 EPS range of $8.25 to $8.75 on its summary slide, whereas the earnings release and CFO’s prepared remarks consistently state $8.10 to $8.90. Both ranges have an $8.50 midpoint, but the formal release and prepared guidance establish the appropriate range.
Other inconsistencies include the spoken 2026 growth rate, differing descriptions of the previous capital-investment base, and presentation-versus-release classifications of certain derivative and acquisition adjustments. The latter classifications reconcile to the same overall adjusted earnings totals, but they complicate interpretation of individual adjustment categories.
These issues do not negate the verified operating results. They do increase the importance of distinguishing reported results, formal guidance, management aspirations, and derived estimates. A strong operating quarter can coexist with inadequate precision in communicating the forward financial model.
INVESTMENT IMPLICATIONS AND VALUATION SCENARIOS
TTM is increasingly exposed to higher-value interconnect technology and integrated defense electronics rather than conventional PCB volumes alone. If N+M sustains superior gross margins and defense subsystems increase recurring platform content, the company could justify a higher valuation than a commodity manufacturing model.
The principal constraint is that richer product mix is arriving alongside higher capital intensity, acquisition complexity, leverage, and working-capital requirements. A durable rerating requires evidence that the higher margins translate into free cash flow after the investment necessary to sustain them.
The $98.00 price in the supplied notice is a thinly traded premarket reference, not a verified subsequent trading price. At that reference, the shares trade at approximately 11.0x to 12.1x the 2027 adjusted EPS range. The reported 4.1% decline despite the Q3 beat is consistent with concern about the unchanged near-term earnings trajectory, financing burden, or N+M timing, but the actual cause of the price move cannot be established from the notice.
An illustrative base case, assigned a 50% probability over approximately 12 to 18 months, assumes revenue near the $6.625 billion midpoint, adjusted EPS of $8.50, successful execution of the delayed program, and improving but still investment-heavy cash conversion. A 15x adjusted EPS multiple produces a value of $127.50, approximately 30% above the reference price. The multiple is a scenario assumption rather than an asserted peer-group average.
An illustrative bull case, assigned a 25% probability, assumes revenue of approximately $7.1 billion to $7.3 billion including successful pending-acquisition execution, stronger N+M conversion, adjusted EPS near $10.00, and clear evidence of deleveraging. A 17x multiple produces a value of approximately $170, or approximately 73% upside. This outcome requires both earnings outperformance and increased confidence in durability.
An illustrative bear case, assigned a 25% probability, assumes revenue of approximately $5.7 billion to $6.0 billion, further customer-program delays, weaker premium pricing, underabsorbed capacity, and adjusted EPS near $6.00. A 10x multiple produces a value of approximately $60, or approximately 39% downside. The risk is not simply slower growth; it is simultaneous earnings disappointment and multiple compression while leverage remains elevated.
The probability-weighted value is approximately $121, implying approximately 24% expected appreciation from the reference price before transaction costs or financing. The outcome distribution is favorable but asymmetric enough on the downside to argue against a large initial position.
A conditional initial allocation of approximately 0.5% to 1.0% of portfolio NAV is consistent with that uncertainty. At a $98 reference entry, a 15% price-based risk threshold would be approximately $83.30, implying planned NAV risk of approximately 7.5 to 15 basis points before gaps and slippage. The bear-case loss on a 1.0% position would be approximately 39 basis points, materially above that planned stop budget. Position size should therefore be governed by event-gap risk as well as the stop level.
Portfolio exposure should be classified primarily as AI infrastructure and advanced-electronics operating leverage, supplemented by defense demand. The instrumentation category adds further AI-cycle exposure, while the Chinese manufacturing footprint introduces geopolitical and trade-policy sensitivity. Defense backlog improves diversification but does not neutralize correlation with semiconductor capital spending, hyperscaler investment, or growth-equity risk. Actual marginal portfolio concentration cannot be quantified without holdings data.
CATALYSTS, REVIEW TRIGGERS AND EXIT CONDITIONS
The immediate catalyst is Q4 execution against approximately $1.43 billion of revenue and $1.80 of adjusted EPS, particularly the anticipated increase in data center and networking shipments. Penang’s progress toward breakeven is another near-term operating checkpoint.
The Q4 earnings call is the next major forecast-quality catalyst. Management indicated that additional 2027 detail would be provided then. The most consequential disclosures would be a consistent N+M revenue bridge, organic-versus-acquired growth, an explicit margin comparison base, annual capital expenditure, and free-cash-flow expectations.
Q1 2027 should establish whether the delayed major N+M program reaches full production. Q2 2027 introduces the anticipated Ophir closing, subject to approvals, together with an opportunity to verify the target’s booked-revenue conversion, earnings trajectory, and post-close leverage. The additional capacity program primarily supports 2028, creating a longer-dated catalyst rather than a near-term earnings solution.
The operating thesis would be impaired by further N+M delays beyond Q1 2027, a reduction in the formal 2027 outlook, failure to deliver the promised margin progression, or evidence that higher ASPs predominantly reflect temporary urgency rather than durable value capture. The financial thesis would be impaired by persistent contract-asset expansion without cash conversion, dependence on additional debt to fund supposedly self-funded expansion, or leverage materially above management’s target at the Ophir closing.
Position reduction would also be appropriate if the valuation reaches the base-case range without corresponding improvement in cash conversion and forecast reliability. Conversely, an increase in exposure would require evidence that the earnings trajectory is becoming less dependent on favorable assumptions, not merely a higher share price or another strong bookings quarter.
The overall conclusion is that Q3 materially strengthened the evidence for TTM’s operating transformation, while simultaneously increasing the importance of financial discipline. The opportunity lies in converting advanced-interconnect and defense-system growth into durable cash earnings. The principal risk is that the market capitalizes the projected earnings before shipment timing, capital requirements, and debt reduction have been demonstrated.
SOURCE BASIS
Reported financial results and formal guidance are supported by TTM’s October 22 earnings release and presentation, with historical comparisons from the August 5 Q2 release and call and the February 4 full-year 2025 release. Acquisition and investment terms are supported by TTM’s August 17 and September 30 Epiq announcements, October 12 capacity announcement, and the October 19 TTM and MKS Ophir announcements. Current-call quotations are from the supplied initial-draft transcript. Consensus comparisons and the premarket reference price are from the supplied Bloomberg earnings notice.
COMPANY EMPLOYEES ON THE CALL
• Edwin Roks, President, Chief Executive Officer and Director. • Daniel L. Boehle, Executive Vice President and Chief Financial Officer. • Sean Hannan, Vice President, Investor Relations.
RESEARCH ANALYSTS ON THE CALL
• Steven Fox, Fox Advisors. • William Stein, Truist. • Mike Crawford, B. Riley Securities. • Ruben Roy, Stifel. • Jim Ricchiuti, Needham & Company.
Key Read-Throughs
KEY READ-THROUGHS FROM TTM TECHNOLOGIES’ Q3 2026 EARNINGS CALL
TTM’s results indicate that AI infrastructure spending is generating increasingly valuable demand for advanced interconnects, specialized materials, semiconductor-test hardware, and manufacturing equipment. The strongest incremental signal is not simply higher shipment volume: customers are accepting higher prices for greater technical complexity, while suppliers are committing additional capital against multiyear demand. Defense bookings separately support continued expansion in radar and infrared sensing. The negative implications are concentrated in capital allocation and competitive economics. MKS is selling an optics business whose projected earnings growth is substantially stronger than its headline disposal multiple suggests, while TTM’s additional capacity will eventually compete with the scarcity premiums supporting advanced-PCB profitability. These conclusions do not establish the identity of TTM’s unnamed AI customers, confirm equipment awards to particular vendors, or justify treating its exceptional growth rates as forecasts for the entire supply chain.
ELECTRONICS EQUIPMENT AND CAPITAL ALLOCATION
OPHIR DISPOSAL OFFERS MKS BALANCE-SHEET RELIEF BUT SACRIFICES A RAPIDLY EXPANDING EARNINGS STREAM (READ-THROUGH 1)
Affected company: MKS Inc. (MKSI: United States).
Directional impact and magnitude: Positive for balance-sheet flexibility, but negative for retained defense-optics growth. The $650 million gross proceeds are meaningful; the earnings trade-off is more substantial than a simple “sale at more than 18x EBITDA” interpretation implies. Net EPS accretion cannot be established from the disclosed information.
Supporting evidence: TTM described the purchase price as approximately 10.3x Ophir’s expected 2027 adjusted EBITDA, excluding synergies. MKS’s transaction announcement described the same consideration as more than 18x expected 2026 adjusted EBITDA. On the call, Roks stated that “Ophir is over 85% booked” for 2027.
Transmission mechanism: The buyer’s multiple implies approximately $63 million of annual 2027 EBITDA, whereas the seller’s multiple implies less than approximately $36 million for 2026. Assuming comparable definitions and business scope, the transaction therefore embeds more than approximately 75% EBITDA growth. MKS is monetizing a business that appears considerably less expensive on prospective earnings than on current earnings.
The proceeds create the opportunity to reduce debt and interest expense, but the company also relinquishes the target’s future operating earnings and cash generation. Illustratively, deploying the entire $650 million against debt costing 6% to 7% would save approximately $39 million to $46 million of annual interest, below the buyer’s approximately $63 million annual EBITDA forecast. That comparison is not an EPS calculation: taxes, depreciation, transaction costs, net proceeds, and the actual debt retired remain necessary inputs. It nevertheless demonstrates why deleveraging and earnings accretion should not be treated as interchangeable.
Timing and catalyst: The transaction was announced before the earnings call. The incremental information is the target’s booking coverage and the explanation for the sharply different forward multiples. Regulatory approvals and the expected Q2 2027 closing are the principal transaction catalysts. The full annualized earnings opportunity cost becomes more visible after closing; 2027’s reported effect depends on timing.
Cross-portfolio implication: This is a transfer of defense-optics exposure from MKS toward TTM, not evidence that MKS retains that growth opportunity after receiving the proceeds. The sale excludes Ophir Instruments’ laser-characterization business and the Ophir brand.
ADVANCED-PCB CAPITAL SPENDING SUPPORTS MKS’S RETAINED EQUIPMENT AND CHEMISTRY BUSINESSES (READ-THROUGH 2)
Affected company: MKS Inc. (MKSI: United States).
Directional impact and magnitude: Positive, with moderate significance for the relevant electronics-and-packaging businesses. The call strengthens the addressable-demand outlook but does not establish a specific MKS order or quantify incremental consolidated earnings.
Supporting evidence: TTM discussed an additional $400 million investment beginning in Q4 2026 and continuing into early 2028, primarily supporting 2028 revenue production. Roks described the spending as predominantly N+M-related and emphasized, “It’s a lot of equipment.” The disclosed expansion covers existing facilities in China and Penang, Malaysia.
Transmission mechanism: Advanced PCB production requires precise drilling, plating, chemical processing, and control of increasingly demanding interconnect geometries. MKS retains ESI’s laser-drilling systems and Atotech’s plating equipment and process chemistries. Equipment installation provides an initial revenue opportunity; subsequent production creates recurring chemistry, service, and consumables demand.
The brownfield approach is particularly relevant. Expansion within operating facilities can move equipment procurement ahead of the revenue ultimately generated by the added capacity. Consequently, suppliers to PCB manufacturers can experience order support before the manufacturers recognize the associated 2028 product revenue.
The technical mix also matters. Greater process complexity can increase equipment and chemistry content per unit of productive capacity. The read-through is therefore stronger than a generic inference that higher PCB square footage requires more machinery.
Timing and catalyst: Equipment-order opportunities are concentrated in late 2026 and 2027, followed by production-linked consumables demand as capacity ramps. The $400 million commitment was already announced before the call; the call reinforced its equipment intensity, funding framework, and intended production timing.
Relationship qualification: MKS’s product exposure is verified, but TTM did not identify the equipment vendors receiving this spending. No specific portion of the $400 million should be assigned to MKS. The positive equipment read-through is separate from, and does not negate, the negative opportunity cost of selling Ophir.
ADVANCED ELECTRONIC MATERIALS
SPECIALTY GLASS AND HIGH-PERFORMANCE LAMINATES HAVE MORE PRICING SUPPORT THAN GENERIC ELECTRONICS MATERIALS (READ-THROUGH 3)
Affected companies: Elite Material Co., Ltd. (2383: Taiwan); Nitto Boseki Co., Ltd. (3110: Japan).
Directional impact and magnitude: Positive, potentially material for advanced-material product lines and moderately positive at the company level. The evidence supports pricing resilience and favorable mix more strongly than it supports a precise volume or EPS upgrade.
Supporting evidence: Asked specifically about copper-clad laminates and T-glass, Roks described lead times of approximately 12 weeks, extending to 24 weeks or longer for some materials. He acknowledged rising costs and stated, “The customers will take these price increases.” TTM also expects N+M to increase from approximately 30% of data center and networking revenue to approximately 50% in 2027.
Transmission mechanism: Elite Material supplies high-performance laminates and prepregs used in demanding high-speed and high-layer-count electronics. Nitto Boseki supplies specialized electronic glass, including low-dielectric products and low-thermal-expansion T-glass. Greater signal-integrity, dimensional-stability, and processing requirements increase the importance of qualified materials and reduce the practicality of switching to cheaper substitutes.
TTM’s ability to pass higher material costs downstream is important for upstream suppliers. It reduces the immediate pressure on the PCB manufacturer to resist price increases solely to protect its own margins. The economic chain is consistent with specialized-material suppliers retaining pricing power while qualified PCB manufacturers preserve profitability through higher-value products.
The distinction between glass types is critical. T-glass primarily addresses low thermal expansion and mechanical requirements in advanced package substrates; low-dielectric glass addresses transmission-loss requirements. The call supports tightness in specialized electronic materials, not the proposition that every AI board uses the same glass composition.
Timing and catalyst: Pricing, allocation, and order-visibility effects are near-term, spanning late 2026 and 2027. Qualification intensity and the migration toward more demanding materials are longer-duration drivers. Suppliers’ own price realization, advanced-product mix, and capacity additions are the relevant earnings checkpoints.
Relationship qualification: Neither company was named as a TTM supplier on the call. This is an industry-demand and product-positioning read-through, not confirmation of a direct purchasing relationship. Elevated lead times can also encourage precautionary ordering, so bookings should not be equated automatically with end consumption.
ADVANCED PCB MANUFACTURING
VALUE PER BOARD IS RISING FASTER THAN COST, SUPPORTING QUALIFIED HIGH-END PCB PRODUCERS (READ-THROUGH 4)
Affected companies: WUS Printed Circuit (Kunshan) Co., Ltd. (002463: China); Gold Circuit Electronics Ltd. (2368: Taiwan).
Directional impact and magnitude: Positive, with moderate-to-high relevance to advanced server and networking operations. The implication is strongest for product mix and operating leverage, rather than an assumption that peers will reproduce TTM’s exact margins.
Supporting evidence: Data center and networking revenue increased 115% year over year. Roks stated, “These ASPs are going faster than our costs,” linking the difference to board complexity and greater value captured within customer architectures. Boehle said N+M gross margin is “significantly higher than our corporate average.” TTM’s consolidated adjusted EBITDA margin reached 20.1%, increasing 400 basis points year over year.
Transmission mechanism: WUS and Gold Circuit have verified exposure to demanding data center, server, and networking PCBs. As those systems require higher layer counts, tighter impedance control, more complex interconnects, and higher-performance materials, technically qualified suppliers can increase revenue content per system without equivalent growth in physical unit volumes.
The important distinction is between component inflation and genuine value capture. Pure cost pass-through increases revenue without necessarily improving margin. TTM explicitly described selling prices advancing faster than costs, suggesting that technical capability and manufacturing execution are being monetized.
For peers with comparable exposure, this supports a more favorable earnings framework than one based solely on server shipment growth. Higher content per system, richer product mix, and better utilization can reinforce each other. TTM’s strong margins despite its data center revenue falling below prior expectations also indicate that profitability is not determined exclusively by the timing of the newest product ramp.
Timing and catalyst: Near-term relevance centers on peers’ subsequent results, pricing commentary, advanced-product mix, and yields. The longer-duration benefit depends on maintaining qualification and manufacturing capability as customer architectures evolve.
Competitive qualification: TTM’s N+M offering should not be assumed to be technologically identical to every peer’s advanced-PCB portfolio. Nor does TTM’s growth prove peer market-share gains. The high-conviction conclusion is that the profit opportunity for qualified high-end manufacturing is expanding; the division of that opportunity remains company-specific.
BROWNFIELD EXPANSION WEAKENS THE CASE FOR PERMANENT ADVANCED-PCB SCARCITY PREMIUMS (READ-THROUGH 5)
Affected companies: WUS Printed Circuit (Kunshan) Co., Ltd. (002463: China); Gold Circuit Electronics Ltd. (2368: Taiwan).
Directional impact and magnitude: Negative for long-duration scarcity-based valuation assumptions, with moderate competitive significance and limited immediate earnings impact. The call does not establish imminent oversupply.
Supporting evidence: TTM committed an additional $400 million primarily to N+M capacity, on top of substantial previously disclosed investment. Roks emphasized the ability to expand close to existing plants and stated that brownfield additions allow the company to follow the market “much, much more accurately.” Management also acknowledged that major customers use multiple suppliers.
Transmission mechanism: Higher profitability is attracting additional qualified capacity. Expansion within existing manufacturing networks can occur faster and with less execution risk than entirely new greenfield projects. As that capacity qualifies and becomes available, customers gain sourcing alternatives and negotiating flexibility.
For incumbent high-end PCB manufacturers, the consequence is an increased requirement to keep investing simply to preserve competitive position. Even if revenue continues to grow, capital intensity can rise and the permanence of exceptional margins becomes less certain. A valuation that assumes both sustained scarcity pricing and limited reinvestment needs is therefore harder to defend.
The geographic signal matters. TTM’s expansion includes China as well as Malaysia. A US-listed manufacturer’s growth strategy is therefore adding competition within Asian production ecosystems rather than representing a straightforward migration of advanced capacity away from China. Corporate domicile is an unreliable proxy for manufacturing exposure.
Timing and catalyst: The competitive effect is primarily a 2028-and-beyond issue, aligned with TTM’s intended revenue-production period. Near-term share prices can still react to peers’ capital-spending announcements, but a current earnings downgrade would require evidence that industry supply is overtaking demand.
Cross-portfolio implication: Equipment and materials suppliers can benefit during the investment phase even as additional capacity gradually reduces manufacturers’ bargaining power. A portfolio holding both groups should not assume that their margin cycles remain positively aligned indefinitely.
SEMICONDUCTOR TEST AND INSTRUMENTATION
AI-RELATED TEST HARDWARE DEMAND IS BROADER THAN THE COMPUTE-BOARD RAMP (READ-THROUGH 6)
Affected companies: Advantest Corporation (6857: Japan); Teradyne, Inc. (TER: United States).
Directional impact and magnitude: Positive, with moderate-to-high relevance to AI-exposed semiconductor-test operations. This is a strong demand corroboration signal, not support for applying TTM’s 97% category growth directly to either company.
Supporting evidence: TTM’s medical, industrial and instrumentation revenue increased 97% year over year. Management specifically identified “demand strength in instrumentation for automated test equipment supporting AI solutions.” The full-year growth outlook for that broad category increased to nearly 70%, and the earnings presentation identified increased quick-turn premium orders.
Transmission mechanism: More advanced AI processors and networking devices require increasingly demanding electrical testing and test interfaces. Growth in production, device complexity, and test requirements supports tester capacity and associated interface hardware. Advantest and Teradyne have verified exposure to AI-related semiconductor testing, making TTM’s instrumentation commentary economically relevant.
The less obvious implication concerns recurring and application-specific content. Test demand is not limited to new tester installations. Product transitions can require new interface boards, configurations, and other supporting hardware even when parts of the installed test base remain in service. TTM’s combination of strong demand and premium orders is consistent with customers prioritizing timely qualification and production readiness.
The signal is also broader than the particular N+M program that shifted. Instrumentation substantially exceeded TTM’s prior expectations even as data center and networking revenue fell short. That divergence argues against interpreting the delayed board program as evidence of a generalized interruption in AI-related capital spending.
Timing and catalyst: Near-term relevance lies in order conversion and guidance for late 2026 and 2027. Longer-duration support comes from device complexity and test content per chip or system.
Limitations: The category also includes medical and industrial products, and part of its growth reflects pricing. TTM did not identify Advantest or Teradyne as customers. Higher board costs can raise tester manufacturers’ inputs, but the call’s dominant signal is strong demand rather than an established negative margin effect for the test vendors.
DEFENSE RADAR AND INFRARED SENSING
SPY-6 BOOKINGS PROVIDE A PROGRAM-SPECIFIC POSITIVE READ-THROUGH FOR RTX (READ-THROUGH 7)
Affected company: RTX Corporation (RTX: United States).
Directional impact and magnitude: Positive, moderately meaningful for the relevant Raytheon radar operations but modest for consolidated RTX. This is stronger as evidence of production continuity than as a standalone EPS-upgrade catalyst.
Supporting evidence: TTM specifically identified SPY-6 radar bookings during Q3. Aerospace and defense book-to-bill was approximately 1.6x, program backlog reached $2.0 billion, and management reported visibility into approximately 65% of projected 2027 aerospace and defense revenue. Organic defense growth for 2026 is expected to reach approximately 18%.
Transmission mechanism: Raytheon is the verified SPY-6 prime contractor. Orders at a technically specialized participant in the radar supply chain provide independent evidence that program activity is translating into procurement beyond the prime contractor’s headline backlog. Greater component and subsystem availability supports production scheduling and eventual delivery of complete radar systems.
This is particularly relevant when defense companies face the challenge of converting large order books into shipments. Supplier-level order strength is not proof that every bottleneck has been removed, but it supports the operational credibility of the production ramp.
RTX’s previously announced investment in radar capacity and its stated objective of doubling SPY-6 output by 2028 provide a consistent program context. The TTM call is corroboration of that trajectory, not a new award to RTX.
Timing and catalyst: The fundamental effect is concentrated across 2027 and 2028. Near-term checkpoints are Raytheon delivery cadence, backlog conversion, and program execution rather than a large immediate reaction to TTM’s results.
Attribution boundary: TTM’s entire $2.0 billion defense backlog cannot be assigned to RTX. Golden Dome and restricted-program references do not identify the relevant prime contractors. The SPY-6 reference is the cleanest named-program transmission mechanism in the call.
INFRARED CONTENT AND MULTISENSOR INTEGRATION SUPPORT TELEDYNE’S DEFENSE-IMAGING FRANCHISE (READ-THROUGH 8)
Affected company: Teledyne Technologies Incorporated (TDY: United States).
Directional impact and magnitude: Positive, with moderate relevance to defense-oriented thermal imaging and a smaller consolidated impact. The strongest conclusion concerns demand durability and content per platform, not an immediate revenue revision.
Supporting evidence: Roks stated that Ophir was more than 85% booked for 2027 and described combining infrared optics with RF radar and processing to create compact mission subsystems for unmanned and counter-unmanned aerial systems. He emphasized that “optics and processing are the key differentiators in any optical sensing system.”
Transmission mechanism: Teledyne’s FLIR businesses supply infrared sensors, camera modules, optics, software, and integrated imaging systems used in unmanned platforms, counter-drone systems, surveillance, and other defense applications. Greater deployment of unmanned systems and greater emphasis on detecting them increase the potential quantity of sensing hardware deployed. More demanding identification and tracking requirements also increase the value of the sensing content carried by each platform.
The important read-through is that radar and infrared sensing are complementary rather than mutually exclusive. Radar supports detection and tracking, while optical and thermal channels support classification, identification, and engagement decisions. Architectures that combine modalities can expand total sensor content rather than merely shift spending from 1 sensor type to another.
Ophir’s booking coverage provides evidence of committed demand within the optical supply chain, strengthening the case that this is more than an acquisition narrative. It does not establish Teledyne’s booking coverage or justify applying Ophir’s projected growth rate to FLIR.
Timing and catalyst: The fundamental opportunity extends through 2027 and beyond as programs move from design and qualification into production. Teledyne’s own defense-imaging orders, backlog conversion, and OEM module demand are the relevant near-term checkpoints.
Competitive qualification: TTM’s move into integrated sensing also creates additional competitive capability over time. However, acquiring optics and processing does not immediately reproduce Teledyne’s detector technology, manufacturing scale, software, and qualified system portfolio. The current high-conviction read-through is positive demand validation, not an established loss of Teledyne market share or a confirmed supplier relationship with TTM.
Report record
- Sector
- Information Technology
- Fiscal period end
- September 28, 2026
- Report date
- October 22, 2026
- Analysis
- 6736 words
- Read-throughs
- 2850 words
- Content fingerprint (PDF)
4a1b50d8622b- Content fingerprint (analysis)
1690e54a007d- Content fingerprint (read-throughs)
36eb595a84e4
Prepared from the company's earnings release and earnings call transcript. Figures as reported by the company. For information only. Not investment advice.
More from TTM Technologies, Inc.
No other reports yet.
All TTM Technologies, Inc. reports
More in Information Technology
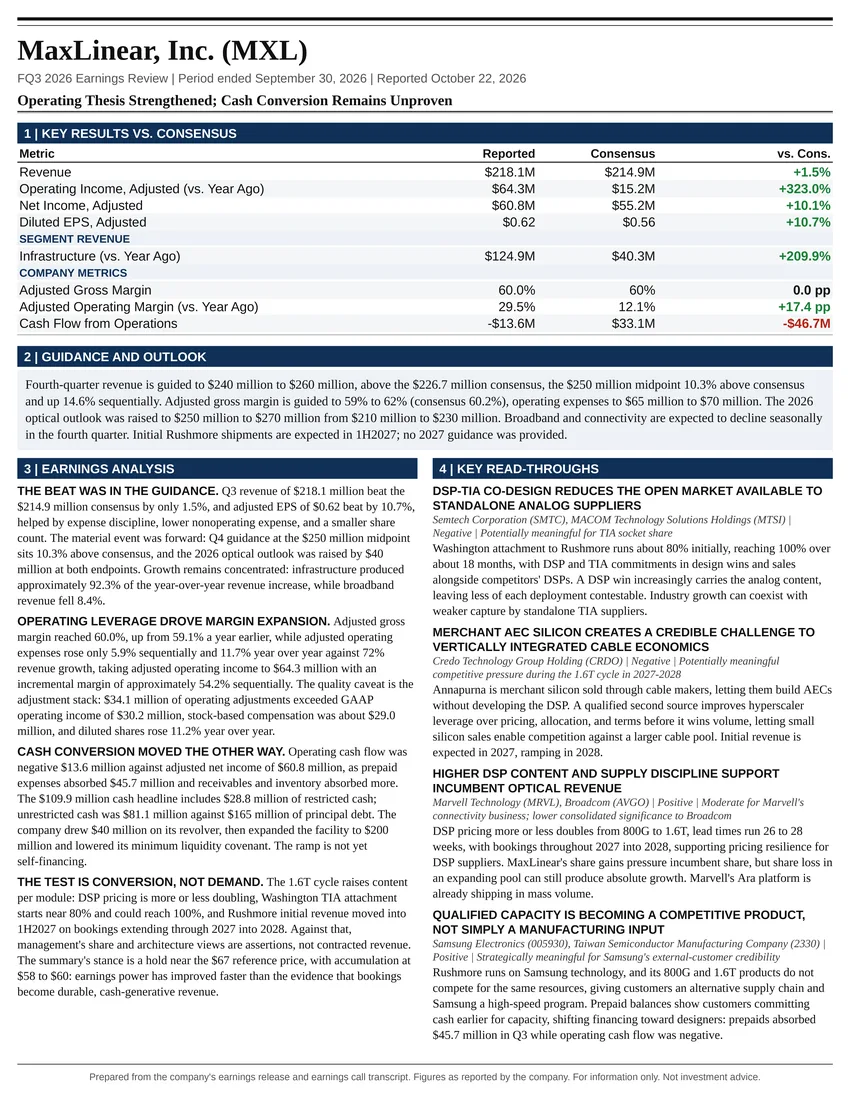
Operating Thesis Strengthened; Cash Conversion Remains Unproven
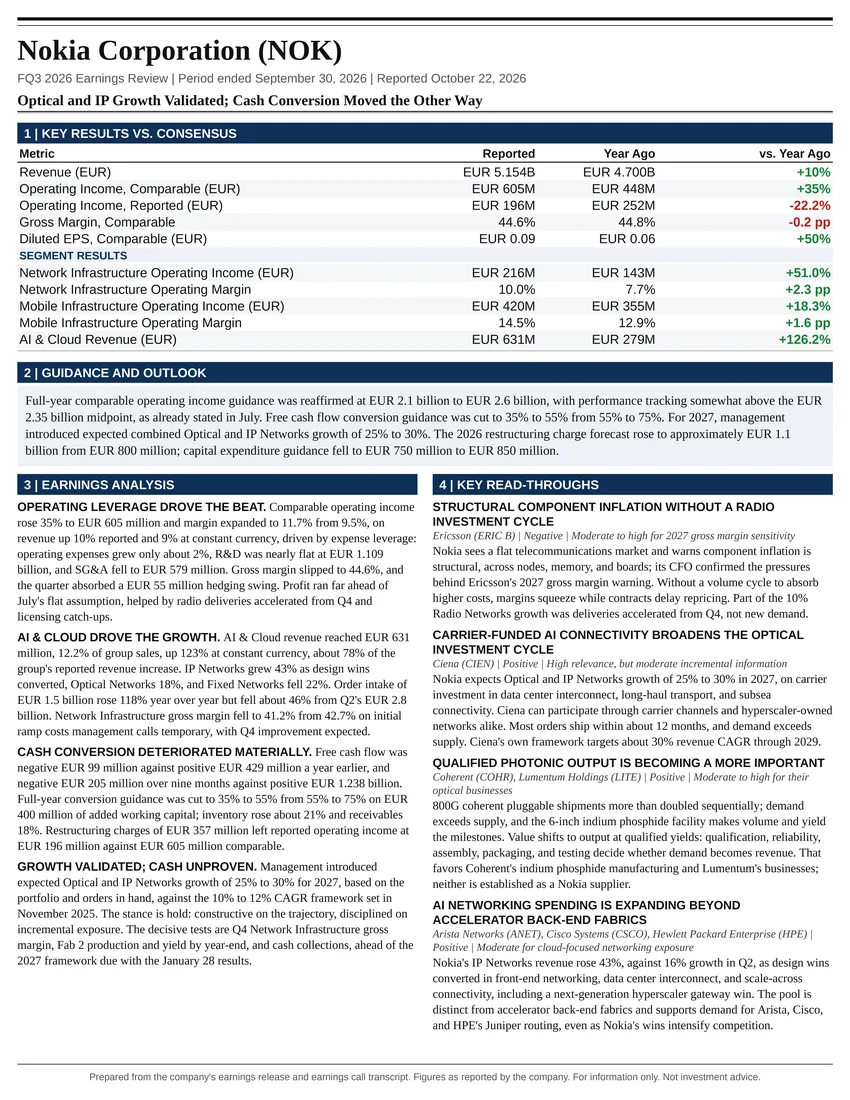
Optical and IP Growth Validated; Cash Conversion Moved the Other Way
All Information Technology reports
Follow @AtlasPeakRes on X for new earnings reports as they publish.