Operating Thesis Strengthened; Cash Conversion Remains Unproven
Earnings Reports
Infosys FQ2 2027 Earnings Report
Infosys (INFY) FQ2 2027 earnings: AI Participation Is Proven; a Consolidated Growth Inflection Is Not. Full earnings analysis, key read-throughs, and the one-page exhibit from Atlas Peak Research.
Infosys (INFY)
Sector: Information Technology · FQ2 2027 · Period end September 30, 2026 · Reported October 23, 2026
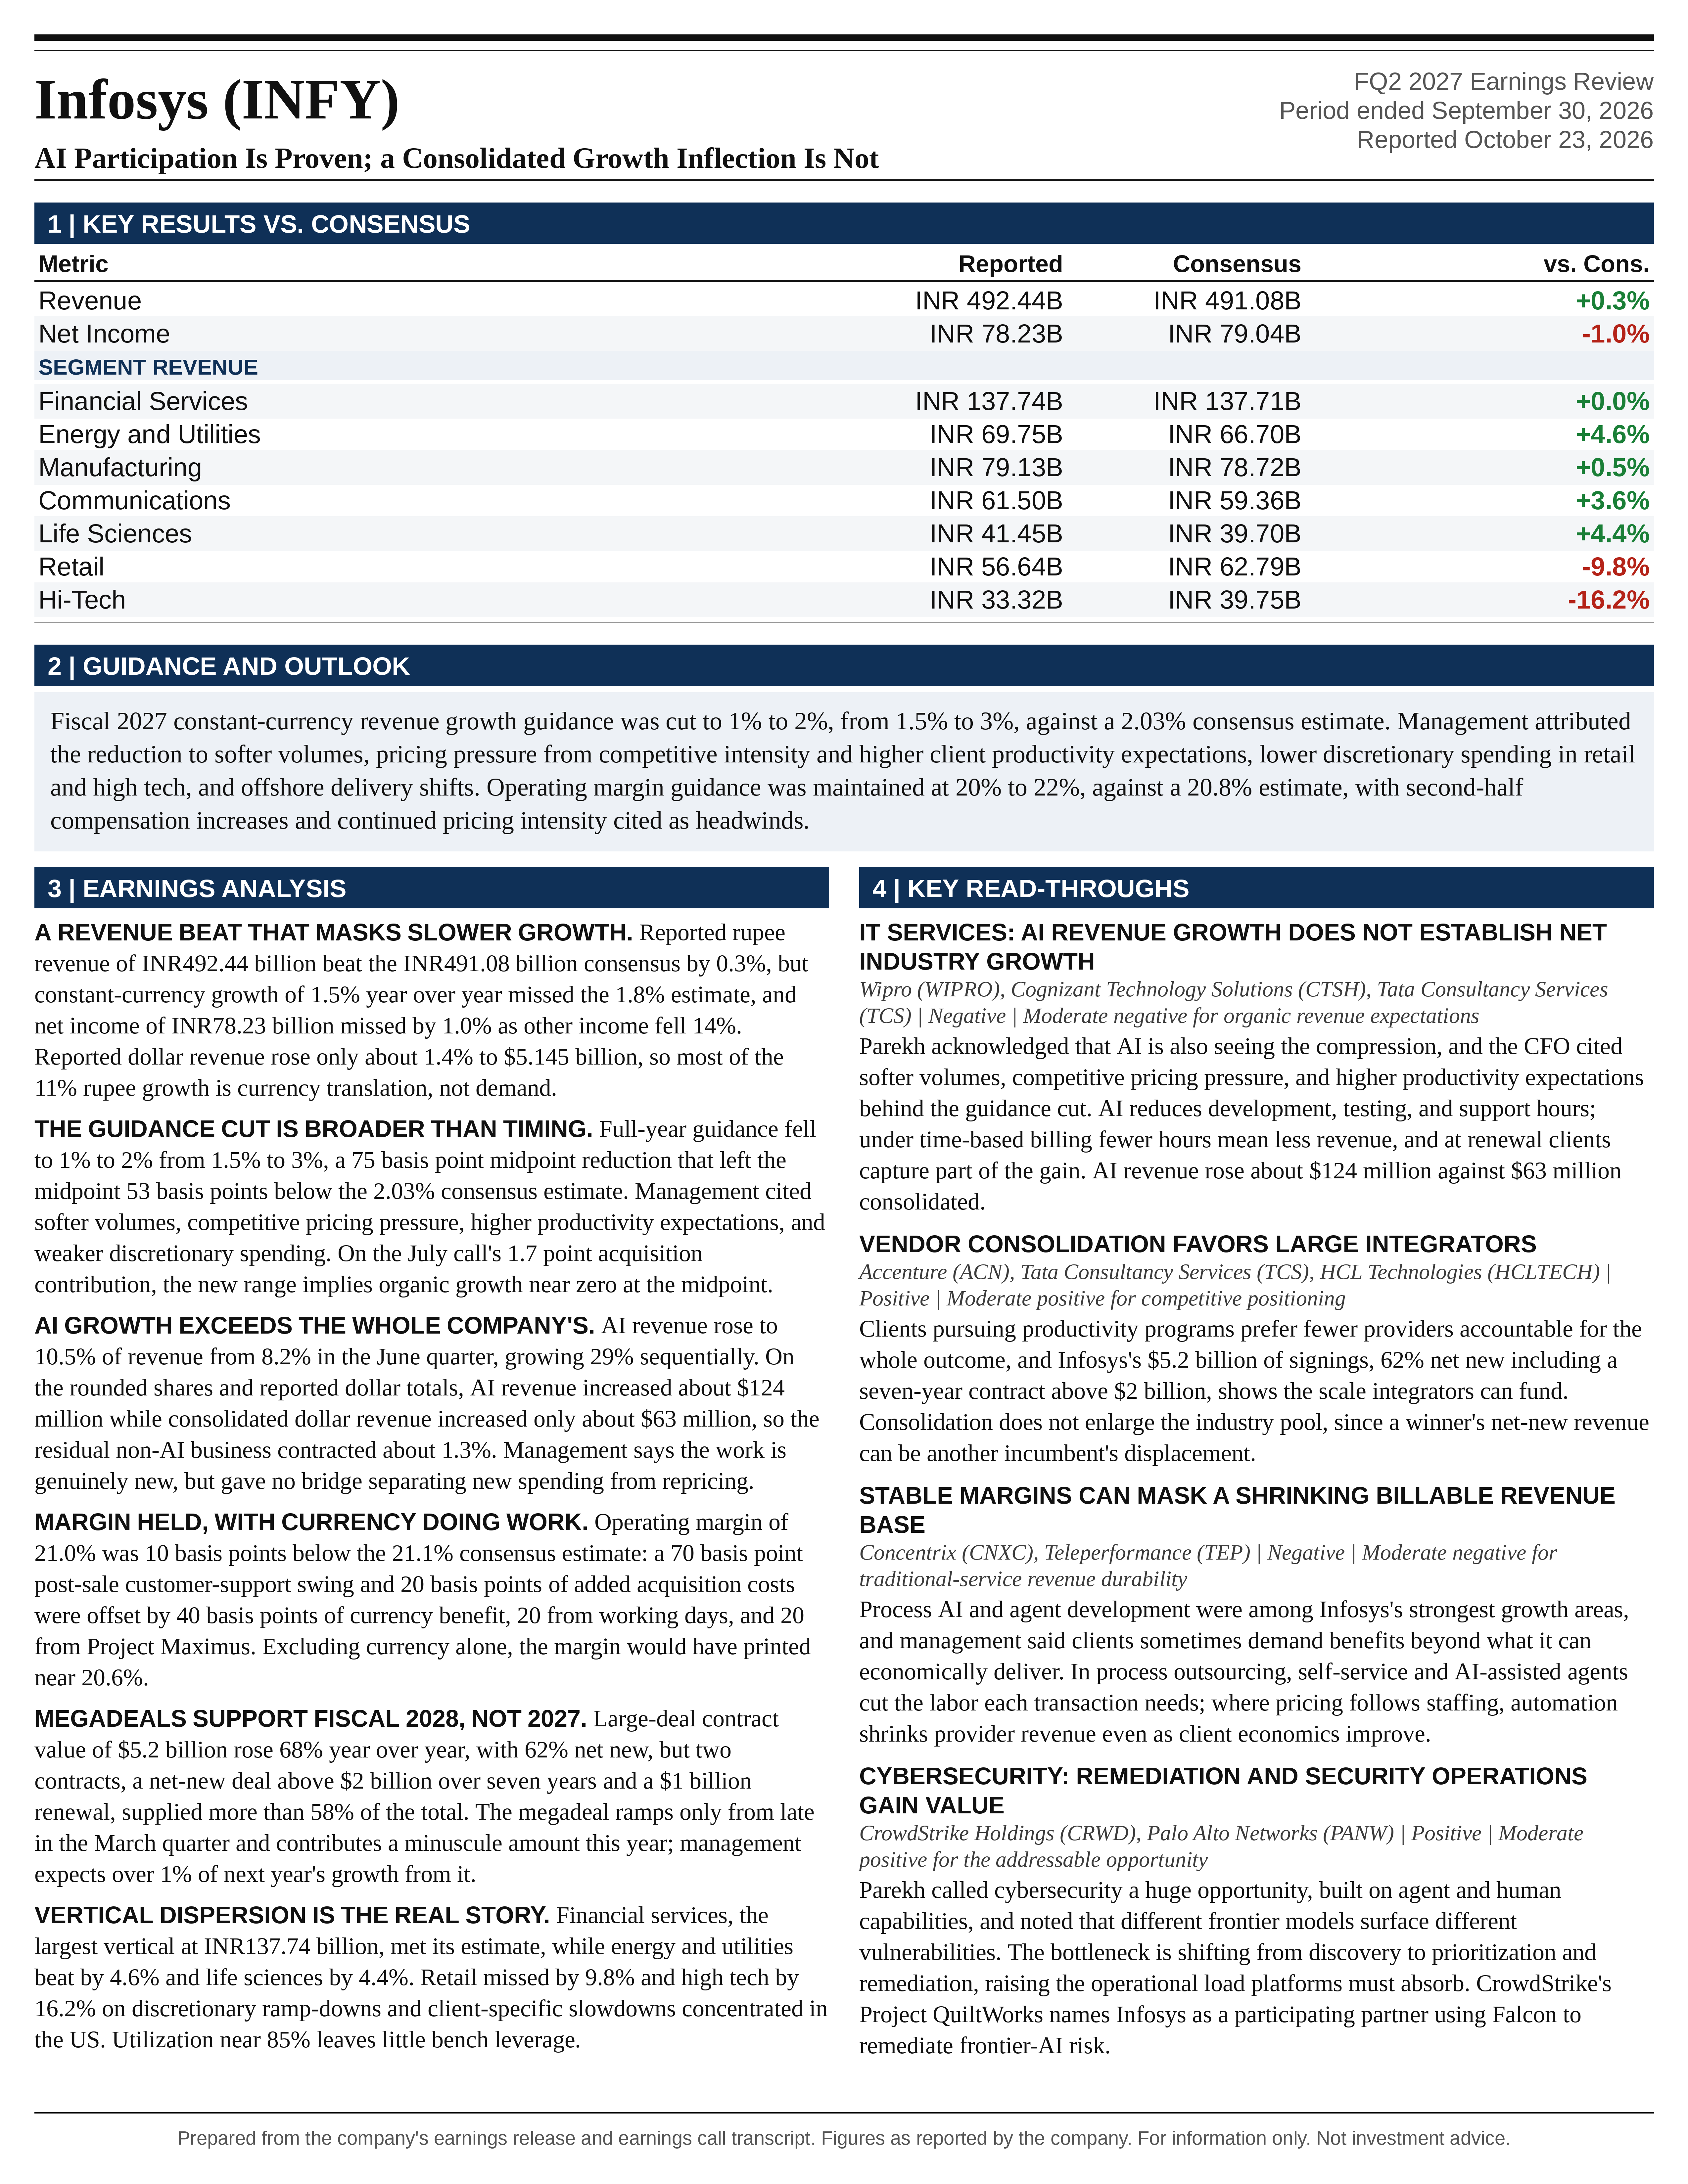
Infosys’s Q2 FY27 results support a neutral investment stance with a negative near-term earnings-revision bias. The quarter demonstrated substantial growth in AI-related services, unusually strong large-deal bookings, and continued operating-margin resilience.
Download the one-page report (PDF)
View one-page exhibit
Download analysis (.md)
Download read-throughs (.md)
Post to X
One-Page Exhibit
Earnings Analysis
EXECUTIVE CALL SUMMARY: Infosys Ltd (10/23/26)
Infosys’s Q2 FY27 results support a neutral investment stance with a negative near-term earnings-revision bias. The quarter demonstrated substantial growth in AI-related services, unusually strong large-deal bookings, and continued operating-margin resilience. However, these positives did not prevent another reduction in full-year revenue guidance. The central investment issue is no longer whether Infosys can generate AI revenue. It is whether that revenue can expand sufficiently, with attractive economics, to offset pricing concessions, productivity-driven reductions in traditional work, offshore delivery mix changes, and selective client spending.
Revenue increased 1.5% year over year and 1.2% sequentially in constant currency. AI represented 10.5% of revenue, versus 8.2% in Q1, and management reported 29% sequential AI revenue growth. Large-deal total contract value reached $5.2 billion, including a net-new contract exceeding $2 billion over 7 years and a $1 billion renewal. Operating margin was 21.0%, unchanged year over year but approximately 10 basis points below Q1’s 21.1%. Net income of INR78.23 billion missed Bloomberg consensus by approximately 1.0%, despite reported rupee revenue exceeding consensus by approximately 0.3%.
The FY27 constant-currency revenue-growth forecast was reduced to 1%-2% from 1.5%-3%. The midpoint declined by 75 basis points, from 2.25% to 1.5%. This was a substantive downgrade, not merely a narrowing of uncertainty. The lower end moved below the previous downside case, while the upper end fell by 100 basis points. Management maintained its 20%-22% operating-margin guidance, indicating that commercial discipline and cost management remain effective, but not establishing that quarterly margins will remain at 21%.
The most consequential management statement was the explicit acknowledgment that AI is simultaneously generating and compressing revenue. Salil Parekh stated, “There’s AI which is also seeing the compression.” Jayesh Sanghrajka was similarly direct: “Our Q2 has been softer and our volume continues to remain softer.” These statements place the guidance reduction in an operating context that is more important than the strength of the AI revenue percentage alone.
The earnings-driven conclusion is that Infosys remains a cash-generative services franchise with credible AI capabilities and improving visibility into selected FY28 revenue streams, but a broad organic growth recovery has not been established. The $2 billion-plus contract strengthens the FY28 outlook rather than repairing FY27. A growth-led valuation rerating requires evidence that AI expansion is producing incremental consolidated revenue and operating profit, rather than principally changing the classification and delivery economics of an otherwise slow-growing business.
REPORTED PERFORMANCE, CONSENSUS AND HISTORICAL COMPARISON
Q2 revenue was INR492.44 billion, compared with Bloomberg consensus of INR491.08 billion. The INR1.36 billion positive variance represents a 0.28% beat. Net income of INR78.23 billion was INR0.81 billion below the INR79.04 billion estimate, a 1.02% miss. Constant-currency revenue growth of 1.5% year over year was 30 basis points below the 1.8% consensus estimate, while the 21.0% operating margin was 10 basis points below Bloomberg’s 21.1% estimate. The combination indicates a modest reported-currency revenue beat but weaker underlying growth and slightly weaker profitability.
Consensus sources should not be blended. CNBC-TV18’s separate poll expected 1.4% sequential constant-currency growth and a 21.3% operating margin, compared with actual results of 1.2% and 21.0%. Its EBIT estimate was INR104.70 billion, versus reported EBIT of INR103.30 billion. That represents an approximately 1.3% EBIT miss against that specific poll. Bloomberg’s margin expectation was lower, so the apparent size of the profitability disappointment depends on the estimate population.
Reported revenue increased approximately 10.7% from INR444.90 billion in Q2 FY26, rounded to 11% in the Bloomberg notice. This substantially exceeded the 1.5% constant-currency increase. Reported dollar revenue of $5.145 billion rose only approximately 1.4% from $5.076 billion a year earlier. The large difference between rupee and constant-currency growth therefore primarily reflects currency translation rather than a comparable acceleration in client demand.
Historical operating comparisons are less favorable than the rupee growth headline suggests. Infosys’s October 16, 2025 earnings release reported Q2 FY26 constant-currency growth of 2.9% year over year and 2.2% sequentially. Current-quarter growth was lower by 140 basis points and 100 basis points, respectively. Relative to Q1 FY27, sequential constant-currency growth improved from 1.0% to 1.2%, but year-over-year growth slowed from 2.4% to 1.5%. The business achieved a modest sequential improvement without reversing the broader annual deceleration.
Sequentially, rupee revenue increased approximately 2.1%, EBIT increased approximately 1.6%, and net income increased approximately 0.7%. Profit growth therefore lagged revenue growth at both the operating and net-income levels. Net margin was approximately 15.9%, compared with approximately 16.6% a year earlier using reported rupee revenue and profit, a decline of approximately 67 basis points. Stable operating margin should not be interpreted as stable earnings conversion below the operating line.
Other income declined 14% year over year to INR8.48 billion, providing a partial explanation for net income growing more slowly than revenue. A complete attribution between tax, finance costs, investment income and other items requires reconciled financial statements. The quarter does not support attributing the entire net-margin decline to the core delivery business.
GUIDANCE: THE DOWNGRADE IS BROADER THAN A SINGLE CLIENT OR TIMING ISSUE
The published FY27 revenue-growth guidance sequence was 1.5%-3.5% initially, 1.5%-3% following Q1, and 1%-2% following Q2. The current midpoint is 100 basis points below the initial midpoint and 75 basis points below July’s midpoint. Acquisition assumptions changed during the year, so the initial-to-current comparison is a comparison of published forecasts rather than a clean measure of like-for-like organic deterioration.
The latest midpoint reduction is significant for growth expectations but much smaller for absolute revenue. Moving from 2.25% growth to 1.5% growth reduces the implied annual revenue level by approximately 0.73%, assuming the same prior-year revenue base. It does not imply a 33% reduction in revenue, even though the expected growth rate itself declined by approximately 33%. The direct earnings effect of the revenue revision is consequently modest if margins remain unchanged. The larger equity risk is that the revision signals a lower sustainable growth trajectory and creates further operating-leverage pressure.
Bloomberg consensus anticipated FY27 growth of 2.03%. The new upper end of 2% is only marginally below that estimate, but the new midpoint is 53 basis points below it. This distinction matters. The forecast does not place the entire range dramatically below consensus, but it shifts the central operating outcome downward and removes much of the previous upside range.
Management identified several overlapping causes: softer volumes, lower discretionary spending in retail and high tech, competitive pricing pressure, higher client productivity expectations, offshore delivery shifts, and refusal to accept contracts below return thresholds. The explanation was not limited to delayed contract starts or a temporary administrative disruption. It describes both demand weakness and pressure on the revenue realized from a given amount of work.
The approximately 2 percentage points of annual growth pressure associated with offshoring and the European manufacturing client should not be treated as newly discovered Q2 headwinds. The July call had already discussed approximately 0.75%-1% of offshore-related pressure and slightly more than 1% associated with the manufacturing client and related commercial decisions. These factors explain why the reported growth profile is subdued, but they do not independently explain the latest 75-basis-point midpoint reduction. The incremental deterioration is more closely associated with weaker-than-expected volumes, pricing and discretionary activity.
An acquisition-adjusted perspective is important. The July earnings-call transcript stated that FY27 guidance included approximately 1.7 percentage points of contribution from recently closed acquisitions. If that contribution remains unchanged in the revised October forecast, the new 1%-2% range would correspond approximately to organic growth of negative 0.7% to positive 0.3%, with a midpoint near negative 0.2%. The comparable July midpoint would have been approximately positive 0.55%. This is a conditional analytical bridge, not a newly disclosed organic forecast, because the October press conference did not provide an updated acquisition contribution.
The quarterly growth profile also constrains the H2 interpretation. Q1 and Q2 year-over-year constant-currency growth of 2.4% and 1.5% imply approximately 2% H1 growth under roughly equal quarterly weighting. With broadly similar prior-year H1 and H2 revenue bases, full-year guidance of 1%-2% implies approximately flat to 2% H2 year-over-year growth, with an illustrative midpoint near 1%. Exact calculations require consistent constant-currency base-period revenues. Nevertheless, the direction is clear: the guidance does not imply a pronounced H2 acceleration.
December-quarter furloughs remain an unresolved variable. The question was raised directly, but management did not quantify expected intensity relative to last year or provide a specific quarterly growth trajectory. The revised annual range should therefore not be interpreted as confirmation that seasonal disruption has been fully de-risked.
AI REVENUE: STRONG EXPANSION, BUT NET INCREMENTALITY REMAINS THE CENTRAL QUESTION
AI revenue increased from 8.2% to 10.5% of total revenue, a 230-basis-point sequential mix increase. Applying those rounded percentages to reported dollar revenue implies approximately $540 million of AI-related revenue in Q2, versus approximately $417 million in Q1. The resulting increase is approximately $124 million, compared with only $63 million of growth in consolidated dollar revenue.
The residual non-AI revenue category consequently declined from approximately $4.665 billion to $4.605 billion, or approximately 1.3% sequentially. These calculations use rounded revenue shares and reported-dollar totals. They are not an organic or constant-currency segment bridge, and the implied AI growth rate differs slightly from management’s 29% because of rounding or measurement basis. The directional conclusion is nevertheless robust: AI-associated growth exceeded the entire consolidated revenue increase, while the residual revenue category contracted.
This decomposition explains why a strong AI growth rate can coexist with a revenue-guidance cut. AI is becoming material, but the remaining 89.5% of revenue still dominates consolidated results. At the current mix, a 1% decline in non-AI revenue requires approximately 8.5% AI growth merely to keep total revenue unchanged, assuming stable classification and consistent currency measurement. The AI business can continue growing rapidly while consolidated revenue remains subdued.
Management argued that the AI revenue represents genuinely new activity. Parekh stated, “There’s a lot of new work that we’re doing,” citing AI-enabled modernization as an example. The company classifies AI revenue within its 6 strategic service areas rather than describing every contract containing AI tools as AI revenue. This is a more meaningful framework than an indiscriminate AI label, but it does not fully resolve incrementality.
Several economic outcomes remain possible within the reported AI category. A modernization engagement can be new revenue to Infosys but funded by savings from another Infosys contract. It can represent a competitive displacement of another provider rather than an increase in the client’s overall technology budget. It can substitute for a modernization project that would otherwise have been delivered with traditional tools. It can also be genuinely incremental work that would not have been commercially feasible without AI. The call did not quantify the proportions.
The relevant disclosure gap is therefore a consolidated revenue bridge separating new client spending, competitive share gains, replacement of existing work, repricing of retained work and changes in classification. Without that bridge, AI revenue is evidence of commercial relevance and execution capability, but not a complete measure of incremental economic value.
Management also cautioned against extrapolating 29% sequential growth indefinitely. Parekh acknowledged that the business remains relatively small and that “There’ll be some volatility.” Compounding 29% quarterly growth would imply approximately 177% annual growth. That is a mathematical illustration, not a defensible medium-term forecast.
A question referenced AI reaching 50% of revenue within 2-3 years, but management did not explicitly reaffirm that timetable in its response. The economics of such a mix target depend heavily on the denominator. With consolidated revenue unchanged, moving from 10.5% to 50% would require approximately 68% annual AI growth over 3 years or 118% over 2 years. If non-AI revenue instead remained unchanged, AI revenue would need to expand approximately 8.5 times, and consolidated revenue would rise approximately 79%. A 50% mix outcome can therefore signify very different business trajectories and should not be treated as a standalone valuation objective.
AI ECONOMICS, COMPETITIVE POSITION AND THE PRODUCTIVITY DEBATE
Infosys’s positioning is that of an enterprise AI integrator rather than a frontier-model developer. Topaz Fabric provides access to 15 models, including open-weight and proprietary models, with an emphasis on token-cost optimization, interoperability and enterprise deployment. The potential competitive advantage lies in domain expertise, access to client systems, data integration, modernization capability, governance and delivery accountability.
This positioning reduces dependence on any particular model architecture and allows Infosys to benefit from improvements across the model ecosystem. It also avoids the capital intensity of developing frontier models. However, model partnerships alone are not an exclusive competitive advantage. Other services firms, software vendors and client engineering teams can access many of the same models. Differentiation must be demonstrated through implementation outcomes, reusable assets, execution speed and superior economics.
The call did not establish that AI work carries higher margins than traditional services. Parekh stated, “We first don’t disclose the margin externally separately on the AI versus the other type of projects.” Repeated expressions of comfort with AI value realization do not substitute for profitability disclosure. AI revenue can incorporate attractive consulting and intellectual-property economics, but it can also include expensive specialist labor, inference costs, third-party components and competitive implementation work.
The scale of the AI business limits its immediate ability to absorb margin pressure elsewhere. Illustratively, if AI work earned a margin 5 percentage points above non-AI work, its 10.5% revenue weight would contribute approximately 53 basis points to consolidated margin relative to an otherwise identical portfolio. Conversely, a 100-basis-point margin deterioration across the non-AI business would reduce consolidated margin by approximately 90 basis points. These are sensitivities, not estimates of actual segment margins.
Management’s assertion that AI-driven productivity compression is finite deserves particular scrutiny. Parekh stated, “Because once you finish with all the work that you’re doing through productivity, it’s done.” That argument is plausible for a defined contract undergoing a specific automation transition. It is less persuasive as a general industry proposition. Model capabilities, inference costs, client expectations and competitive benchmarks continue evolving. Productivity requirements can be reset at successive renewals rather than disappearing after an initial adjustment.
The more defensible positive thesis is that new workloads, greater technology adoption and value-based pricing eventually exceed the revenue lost through automation. That outcome is possible, but it depends on demand creation and commercial execution rather than the automatic exhaustion of productivity pressure. The call supplied evidence of strong AI demand but no quantified timing for the crossover.
LARGE DEALS: A MATERIAL FY28 SUPPORT, WITH CONCENTRATION AND CONVERSION RISKS
Large-deal TCV of $5.2 billion increased approximately 68% year over year and 44% sequentially from Q1’s $3.6 billion. Net-new business represented 62%, implying approximately $3.224 billion of net-new TCV. This compares with approximately $2.196 billion in Q1, based on a 61% net-new share, and approximately $2.077 billion in Q2 FY26, based on a 67% share. Net-new TCV therefore increased approximately 47% sequentially and 55% year over year.
These are strong commercial results. However, the quarter was concentrated in a small number of unusually large contracts. The contract exceeding $2 billion and the $1 billion renewal together represented more than 58% of total large-deal TCV. The net-new megadeal alone represented more than 62% of net-new TCV. Excluding the 2 megadeals leaves less than approximately $2.2 billion of other large-deal bookings.
Concentration does not diminish the significance of the wins, but it changes the interpretation of momentum. The quarter demonstrates the ability to originate and secure transformative engagements. It does not establish that broad-based booking velocity has permanently increased to a $5.2 billion quarterly run rate.
Management clearly explained the mismatch between bookings and FY27 guidance. Sanghrajka stated that the net-new contract would ramp “from later part of Q4” and provide “a very minuscule amount of benefit” in FY27. Most of the associated contribution is expected in FY28. The guidance reduction is consequently compatible with strong bookings because revenue recognition is delayed.
The 7-year contract exceeding $2 billion has a simple average annual value above approximately $286 million. Against an annualized company revenue base near $20.6 billion, that is approximately 1.4% of revenue. Management’s expectation of roughly 1 percentage point or more of FY28 growth contribution is therefore reasonable in order of magnitude. The calculation does not establish the actual billing schedule, ramp profile, contractual minimums, transition costs or profitability.
The $1 billion renewal has a different economic meaning. It preserves an existing revenue stream and may provide scope expansion or better strategic positioning, but its full TCV should not be modeled as incremental revenue. Similarly, net-new TCV is new to Infosys, not necessarily new industry spending. Vendor consolidation can generate share gains for Infosys while clients reduce aggregate technology-service expenditures.
The CFO also noted that guidance already assumed a historical average of approximately $3 billion in quarterly large-deal signings. Treating all $5.2 billion as upside to previously expected revenue would double-count normal bookings. The appropriate modeling focus is incremental annual contract value above the prior baseline, adjusted for transition timing, displaced revenue and execution risk.
Operating-profit conversion remains less certain than revenue conversion. A large transformation can require upfront staffing, knowledge transfer, technology investment or parallel delivery. Contractual productivity commitments may also intensify over time. The call did not disclose customer identity, sector, detailed margin progression or cash requirements for the megadeals. The FY28 revenue contribution is more visible than its near-term earnings contribution.
MARGIN RESILIENCE: REAL, BUT DEPENDENT ON OFFSETS
The 21.0% operating margin is a meaningful positive given weak revenue growth, continued AI investment and competitive pressure. It demonstrates that Infosys has retained the ability to manage its delivery structure and reject uneconomic work. Parekh’s statement that the company “will only take on the contracts where it meets our economic guidelines” provides an important counterweight to concerns that AI competition will inevitably lead to indiscriminate price cutting.
The detailed margin bridge also reveals why “stable” should not be interpreted as unchanged underlying economics. Management identified 70 basis points of sequential pressure from post-sale customer support and 20 basis points from an additional month of acquisition-related costs, including amortization. Offsets were 40 basis points from currency, 20 basis points from additional working days and 20 basis points from Project Maximus.
The cited headwinds total 90 basis points and the tailwinds total 80 basis points, implying a 10-basis-point sequential decline. This reconciles with the movement from Q1’s published 21.1% margin to Q2’s 21.0%, despite the draft transcript’s repeated characterization of margins as flat.
The 70-basis-point customer-support item is a change between quarters involving a prior-period reversal and a current-period charge. It should not be treated as a 70-basis-point standalone Q2 expense that can simply be added back to produce a normalized margin. The transcript does not provide the gross amounts necessary for that calculation.
Currency supplied 40 basis points of support. Holding everything else unchanged, removing that benefit would have reduced the quarter’s margin to approximately 20.6%. This is a sensitivity rather than a reported adjusted measure, but it illustrates the importance of exchange rates to the result. The working-day benefit is also not a permanent structural improvement. Project Maximus appears to provide more durable operational support, although recurring savings should not be assumed to compound indefinitely without limits.
H2 will face compensation increases and continued pricing intensity. The July call had already indicated salary increases for most employees effective October, with the remaining increases effective January 2027. These are therefore known seasonal headwinds rather than newly emerging surprises. The October call did not quantify their margin impact or provide an offset schedule sufficient to demonstrate that 21% will be maintained each quarter.
The unchanged 20%-22% annual guidance is reassuring but broad. With H1 margin near 21% and broadly similar revenue weighting between halves, an H2 margin near 19% could still be consistent with the full-year lower end. That is not a forecast. It demonstrates that maintaining annual guidance does not constitute a commitment to maintaining the current quarterly margin.
Margin sensitivities are significant relative to the revenue-guidance revision. A 50-basis-point change in margin equals approximately 2.4% of operating profit at a 21% starting margin. Combining the approximately 0.73% reduction in the implied revenue level with a hypothetical 50-basis-point margin decline would reduce operating profit by approximately 3.1%, holding other assumptions unchanged. The earnings debate is therefore at least as sensitive to margin execution as to the latest headline growth revision.
VERTICAL PERFORMANCE: THE AGGREGATE CONCEALS MATERIAL DISPERSION
Financial services remained the largest business at INR137.74 billion, approximately 28.0% of revenue. Reported growth was 12% year over year, and revenue was essentially in line with the INR137.71 billion consensus estimate. Management described good strength and discretionary activity in the vertical. Financial services provides scale and relative stability, but the quarter did not deliver a meaningful segment-level upside surprise.
Energy and utilities revenue was INR69.75 billion, up 17% and approximately 4.6% above consensus. The business represented approximately 14.2% of revenue and was among the clearest positive contributors. Manufacturing generated INR79.13 billion, approximately 16.1% of revenue, with 7.7% reported growth and a modest 0.5% consensus beat. Management’s positive manufacturing commentary should be considered alongside the previously disclosed European client headwind. Without segment-level constant-currency data, reported rupee growth cannot independently establish the strength of underlying demand.
Retail was materially weaker. Revenue of INR56.64 billion increased only 0.4% year over year and missed consensus by approximately 9.8%. High-tech revenue of INR33.32 billion declined 10% and missed consensus by approximately 16.2%. Together, these businesses represented approximately 18.3% of revenue and fell approximately INR12.58 billion short of their listed consensus estimates. These are substantial shortfalls relative to the small consolidated revenue beat.
Management attributed the weakness to discretionary ramp-downs and client-specific slowdowns, with particular exposure to the US. Retail also faced a lower third-party revenue component than in preceding quarters. That distinction matters because reductions in third-party pass-through revenue can depress revenue without equivalent damage to gross profit. The call did not quantify the pass-through effect, so the retail shortfall cannot be classified entirely as lost labor demand or entirely as benign mix.
Communications revenue increased 14% to INR61.50 billion and exceeded consensus by approximately 3.6%. Life sciences increased 45% to INR41.45 billion and exceeded consensus by approximately 4.4%. The life-sciences result is notable, but acquisition contribution must be separated before interpreting it as organic acceleration. The current call did not provide that bridge.
All these segment growth rates are reported in rupees, not constant currency. They should not be directly compared with the company’s 1.5% constant-currency growth rate as though they shared the same measurement basis. The listed segment estimates also do not form a complete, necessarily consistent consolidated consensus model. The appropriate conclusion is that positive performance in several verticals offset pronounced weakness in retail and high tech, not that the overall revenue beat demonstrates broad demand strength.
GEOGRAPHY, OFFSHORING AND CLIENT BUDGETS
Management described North America as softer, with Europe and other markets performing better. The weakness was associated partly with discretionary spending and individual clients rather than a uniform deterioration across every vertical. Nevertheless, North American exposure remains a significant risk because weakness in a small number of large clients can materially affect revenue and utilization.
The discussion of India clarified the distinction between revenue mix and absolute revenue. Management stated that Indian revenue increased and identified seasonal tax-return-related activity as a contributor. A declining geographic share would not necessarily indicate declining absolute revenue. The seasonal nature of this work also limits its usefulness as evidence of a structural domestic-growth acceleration.
Offshoring is economically ambiguous. Shifting delivery toward India reduces revenue per unit of work because billing rates are lower, but can improve or preserve margin through lower delivery costs. It can also reduce exposure to immigration constraints and expensive onsite staffing. Consequently, offshore-driven revenue deflation is not automatically equivalent to a deterioration in project profitability. However, it still reduces the nominal revenue base unless additional work offsets the lower realization.
Management’s comments on client budgets were appropriately restrained. Discussing cybersecurity spending, Parekh stated that overall budgets would not increase “disproportionately.” This limits the inference that every new AI or security requirement will create an equivalent increase in enterprise technology budgets. A material portion of AI adoption may be funded by reallocating spending or capturing productivity savings elsewhere.
WORKFORCE, UTILIZATION AND DELIVERY ECONOMICS
Management reported approximately 4,000 net employee additions, while contemporaneous results coverage specified 4,480. Infosys hired approximately 8,000 graduates during the quarter and retained its full-year target of approximately 20,000, with more than half already recruited during H1. This supports confidence in future delivery requirements, but graduate hiring should not be confused with net workforce expansion.
Attrition was 12.7%, modestly below approximately 13% in Q1. Management estimated annual departures at roughly 45,000 employees. Graduate hiring therefore covers only part of replacement demand before considering lateral hiring, changing skill requirements or growth. The hiring target is compatible with limited revenue growth because it serves replacement, cost-pyramid and capability-building objectives as well as expansion.
Utilization near 85% provides limited remaining scope for margin improvement through higher deployment rates. Q1 utilization excluding trainees was 84.9%, meaning this lever is already close to management’s stated optimum. Future efficiency gains must increasingly come from staffing mix, automation, delivery design, subcontractor management and commercial terms rather than a large reduction in the bench.
The 6-8 month training period for graduates creates a timing mismatch between hiring expense and productive deployment. Current hiring can support early-2027 demand and the FY28 megadeal ramp, but carries near-term costs and execution risk if demand conversion disappoints. AI also changes the appropriate staffing pyramid: a lower-cost graduate base is beneficial only if training and tooling allow those employees to deliver the required work.
Employee-benefit expense increased 8.7% year over year to INR254.83 billion, below reported rupee revenue growth. This supports the evidence of cost discipline. However, selling and marketing expense increased 12% and administrative expense increased 17%, indicating that investment and overhead pressures remained present. Employee expense represented approximately 51.7% of revenue. A 1% increase in that expense base, absent revenue or efficiency offsets, would reduce operating margin by approximately 52 basis points.
The CFO rejected the inference that rising subcontractor expense necessarily reflects an AI skills shortage. Technical subcontracting remained approximately 8%-9% of revenue, broadly consistent with historical levels. Absolute spending can rise while the expense ratio remains stable. The call therefore does not establish that AI delivery is becoming disproportionately dependent on costly external specialists.
The 6,000-person specialized staffing initiative remained a multiyear objective, without a disclosed current completion count. Statements that training, certification and recruitment are progressing should not be treated as evidence that the full target is already staffed or billable.
CYBERSECURITY AND GCCs: CREDIBLE OPPORTUNITIES, LIMITED QUANTIFIED CONTRIBUTION
Cybersecurity is a plausible source of recurring AI-related demand. Better offensive capabilities can increase the need for vulnerability discovery, application remediation, monitoring and incident response. Infosys described a combination of agents, human expertise and frontier-model partnerships, supported by its earlier Australian cybersecurity acquisition.
The investment opportunity should not be equated mechanically with Y2K. Cybersecurity lacks a comparable universal remediation deadline, and client responses will vary by risk exposure, regulation and existing architecture. Demand can be durable, but spending can also be episodic or financed through reductions elsewhere. The call supplied no incremental revenue target, backlog, margin disclosure or budget conversion rate for this opportunity.
The question concerning an alleged eMudhra incident did not establish an Infosys breach or a verified exposure. Parekh said that he lacked sufficient specific information to comment. No conclusion about security failure, customer liability or provider migration can be drawn from that exchange.
Global capability centers present a separate opportunity and competitive risk. Infosys can help clients build, modernize or operate AI-enabled GCCs, generating consulting, implementation, recruitment and managed-services revenue. It may also benefit when clients struggle to scale their own facilities and reconsider outsourcing. Conversely, successful captive operations can reduce the share of work available to external providers.
Management did not answer the question about proximity to a $1 billion GCC revenue milestone or quantify the associated upfront investment. Potential personnel transfers, software takeovers and transition commitments could affect cash flow and returns. The GCC discussion therefore supports strategic relevance and pipeline optionality, but not a defensible standalone earnings contribution.
FREE CASH FLOW, DIVIDENDS AND CAPITAL ALLOCATION
Cash generation remains a major support for the investment case, but the source discrepancy should be preserved. The draft opening remarks cite quarterly free cash flow of $922 million. The Bloomberg earnings notice and contemporaneous reporting quote the CFO at $928 million, equivalent to 113.3% of net profit. The $6 million difference is not material to the investment conclusion, but remains unreconciled. The $928 million figure provides the provisional basis for the following comparisons.
Free cash flow of $928 million was approximately 2.8% below Q1’s $955 million and 15.7% below Q2 FY26’s $1.101 billion. Conversion declined from 116.5% of net profit in Q1 and 131.1% a year earlier to 113.3%. H1 free cash flow was approximately $1.883 billion, versus $1.985 billion in H1 FY26, a decline of approximately 5.1%.
Cash generation is consequently strong in absolute terms and relative to accounting profit, but it is not improving on these comparisons. The distinction matters because the call repeatedly emphasized the strength of the cash-generation model. Current cash flow supports earnings quality and shareholder distributions; it does not independently demonstrate acceleration in the underlying business.
Quarterly free cash flow represented approximately 18.0% of dollar revenue. However, the current cash-flow statement, capital-expenditure reconciliation and working-capital movements were not independently reconciled. The relative contribution from collections, tax payments, contract balances and capital spending therefore remains unresolved. Conversion above 100% should not automatically be extrapolated as a permanent run rate.
The INR26 interim dividend increased 4% from the INR25 payment cited in the transcript. The appropriate same-season comparison is the INR23 interim dividend announced in October 2025, implying approximately 13.0% year-over-year growth. The transcript’s movement between “last year” and “last quarter” creates an avoidable ambiguity; the historical issuer release establishes the prior interim amount.
The policy to return 85% of free cash flow over 5 years through dividends and buybacks is a cumulative framework, not a requirement to distribute 85% every quarter. Increasing the dividend while lowering revenue guidance is therefore not inherently inconsistent. It reflects cash generation and an established capital-return policy rather than a newly improved growth outlook.
The policy also does not mean that only 15% of cash generation is available for all investment. Operating investments are already reflected in operating cash flow, while capital expenditure is generally reflected in the company’s free-cash-flow measure. Acquisition spending, retained cash and the timing of buybacks require separate consideration. Capital returns can support total shareholder return, but they do not establish a valuation floor.
MANAGEMENT CREDIBILITY AND DISCLOSURE QUALITY
Management was candid about softer volumes, pricing pressure and the limited FY27 contribution from the megadeal. The reconciliation between strong bookings and weaker near-term guidance was economically coherent. Maintaining commercial return thresholds, rather than accepting every contract to protect revenue growth, is also a meaningful positive for long-term value creation.
The weaker part of the discussion was the repeated substitution of confidence in AI growth for a quantified explanation of the net effect on consolidated revenue. Questions about the duration of deflation, incremental spending, AI profitability and the relationship between hiring and productivity often received strategic rather than numerical answers. This does not establish that the strategy is ineffective, but it limits confidence in the timing and magnitude of the earnings recovery.
Several claims remain unverified at the level required for valuation: broad market-share gains, the duration of productivity compression, the eventual AI/non-AI revenue crossover, superior AI margins, the GCC revenue milestone and the scale of cybersecurity monetization. The call supports these as strategic possibilities, not as fully quantified forecast inputs.
The evidence also contains accounting and consensus inconsistencies. Actual cost of sales of INR339.43 billion plus operating expenses of INR49.71 billion implies EBIT of INR103.30 billion, consistent with reported results. The separate total-cost figure of INR390.29 billion does not equal those expense categories. Likewise, the listed Bloomberg cost-of-sales and operating-expense estimates imply a margin inconsistent with the separately quoted 21.1% margin consensus. Different accounting scopes or contributor populations may be involved. Combining these figures into a synthetic earnings bridge would create false precision.
SCENARIO FRAMEWORK AND INVESTMENT IMPLICATIONS
A base case with a 55% probability assumes FY27 constant-currency growth of 1%-1.5% and operating margin of 20.5%-21.0%. AI continues expanding, but much of its contribution offsets traditional-service pressure. The megadeal ramps substantially as indicated, supporting FY28 growth of approximately 3%-4%, with operating margin around 21%. This outcome supports a resilient cash-generative franchise, but not a return to a structurally high-growth services valuation.
A bull case with a 25% probability assumes FY27 growth near 2% and operating margin of 21%-21.5%. Retail and high-tech weakness proves concentrated rather than contagious, AI revenue remains genuinely incremental, and the net-new megadeal converts without material transition disruption. Additional large deals support FY28 growth of approximately 6%-7%, with margin of 21.5%-22%. The key condition is not merely a higher AI revenue share, but a clear acceleration in consolidated organic growth and operating profit.
A bear case with a 20% probability assumes FY27 growth of 0%-0.5%, below current guidance, and operating margin of 20%-20.5%. Pricing pressure broadens, productivity concessions recur, and hiring or transition costs precede delayed revenue. FY28 growth ranges from negative 2% to flat, with margin of 19.5%-20.5%. Under this outcome, strong reported AI growth fails to prevent contraction elsewhere, and the business increasingly resembles a mature services platform undergoing structural revenue compression.
These probabilities and ranges are analytical scenarios, not management guidance or consensus forecasts. They describe operating outcomes rather than share-price returns. Stock-return estimates require a verified valuation starting point, forward earnings, capital structure and currency assumptions.
The near-term investment risk is that a low-growth business loses valuation support before the FY28 revenue benefits become visible. The countervailing risk to a short position is that cash returns, disciplined margins and a relatively identifiable megadeal ramp provide meaningful fundamental support. The quarter is therefore more compelling as evidence for continued earnings scrutiny than as a standalone basis for an aggressive directional trade.
A new high-conviction long position is not justified solely by the 29% AI growth rate or $5.2 billion TCV. The relevant entry conditions are stabilization of full-year guidance, positive organic revenue progression, evidence that non-AI contraction is moderating, and acceptable margin conversion from large contracts. An earnings-only assessment supports no incremental allocation until those conditions and valuation are jointly satisfactory. It does not establish an executable price target or price-based stop-loss.
The principal catalysts are identifiable. Q3 FY27 will test the combination of December furloughs, October salary increases and continued pricing pressure. Q4 FY27 will test the January compensation tranche and the initial megadeal ramp. FY28 guidance and the June 2027 quarter will provide the clearest assessment of whether the contract is delivering the expected growth contribution and whether AI revenue is lifting consolidated performance.
A constructive thesis would be invalidated by a further guidance cut, persistent organic contraction despite rising AI mix, a sustained margin below the 20% annual guidance floor, or a material delay in the megadeal’s revenue conversion. A bearish thesis would be invalidated by sustained organic acceleration, stable or improving margins without increasing dependence on currency benefits, and repeatable net-new deal conversion beyond the current concentrated bookings.
Portfolio exposure should be classified primarily as enterprise technology spending, global services pricing and delivery-efficiency risk, with additional sensitivity to North American clients, financial services and the rupee. Infosys should not be treated as economically equivalent to AI semiconductor, infrastructure or proprietary software exposure. Its AI opportunity is substantial, but it operates alongside direct pressure on the traditional labor-based revenue model.
The decisive conclusion from this quarter is that Infosys has demonstrated participation in the AI opportunity, but not yet a consolidated growth inflection. Cash generation and commercial discipline preserve investment relevance. The next stage of value creation depends on translating AI adoption and large-deal commitments into incremental, durable revenue and operating profit rather than merely defending the existing earnings base.
COMPANY PARTICIPANTS
• Salil Parekh, Chief Executive Officer and Managing Director. • Jayesh Sanghrajka, Chief Financial Officer. • Rishi Basu, Media Relations and press-conference moderator. • Unidentified speaker or speakers, names and titles not established in the draft transcript.
RESEARCH ANALYSTS AND OTHER QUESTIONERS
The event was a media press conference rather than a conventional sell-side analyst call. The affiliations below follow the transcript; participants should not all be characterized as investment research analysts.
• Meghna Sen, CNBC-TV18; journalist. • Mansee Dave, ET Now; journalist. • Chandra R. Srikanth, Moneycontrol; editor. • Haripriya Suresh, Reuters; listed as an analyst in the transcript. • Beena Parmar, The Economic Times; listed as an analyst in the transcript. • Shilpa Phadnis, The Times of India; listed as an analyst in the transcript. • Poulomi Chatterjee, The Financial Express; listed as an analyst in the transcript. • Uma Kannan, Deccan Herald; listed as an analyst in the transcript. • Jas Bardia, Mint; listed as an analyst in the transcript. • Sanjana B, Hindu BusinessLine; listed as an analyst in the transcript. • Rukmini Rao, Fortune India; identified in the moderator’s introduction and closing acknowledgment, with inconsistent speaker labeling in the draft. • Pooja Patil, BW Businessworld; listed as an analyst in the transcript. • Unidentified participants, affiliations not disclosed.
Key Read-Throughs
KEY READ-THROUGHS FROM INFOSYS Q2 FY27 EARNINGS
Infosys’s results indicate that enterprise AI adoption is accelerating without producing a comparable expansion in aggregate technology-services spending. AI revenue grew 29% sequentially and large-deal bookings reached $5.2 billion, yet full-year constant-currency growth guidance fell to 1%-2% from 1.5%-3%. The broader implication is a redistribution of technology spending and economic value: clients are capturing productivity savings, selected providers are consolidating supplier relationships, and security requirements are attracting investment, while traditional labor-based revenue faces compression. The most actionable conclusions concern services pricing, contract economics and customer operating costs, rather than a generalized positive or negative view on all AI-exposed equities. Directional assessments below describe incremental fundamental effects, not assumed share-price reactions or evidence that those effects remain unpriced.
IT SERVICES: AI REVENUE GROWTH DOES NOT ESTABLISH NET INDUSTRY GROWTH (READ-THROUGH 1)
Affected companies: Wipro (WIPRO: India), Cognizant Technology Solutions (CTSH: United States), and Tata Consultancy Services (TCS: India).
Directional impact and magnitude: Moderate negative for organic revenue expectations and the durability of traditional services growth. Potentially material over successive contract renewals, but less immediately negative for margins where delivery costs can be reduced alongside billing.
The clearest supporting commentary was Parekh’s acknowledgment that “There’s AI which is also seeing the compression.” Sanghrajka added, “Our Q2 has been softer and our volume continues to remain softer,” and identified competitive pricing pressure and higher customer productivity expectations. These statements accompanied a 75-basis-point reduction in the full-year growth-guidance midpoint despite AI reaching 10.5% of revenue.
The transmission mechanism is a reduction in revenue per unit of client activity. AI reduces development, testing, maintenance and support hours. Clients then seek lower prices, smaller delivery teams or contractual productivity commitments. Under time-based billing, fewer hours directly reduce revenue. Under fixed-price contracts, the provider can initially retain efficiency gains, but competitive rebidding and renewals allow clients to capture part of those savings. New AI implementation work must therefore offset erosion in the existing portfolio before consolidated revenue accelerates.
The scale of that hurdle is significant. Using Infosys’s rounded AI revenue shares and reported dollar revenue, AI-associated revenue increased approximately $124 million sequentially while consolidated revenue increased only approximately $63 million. The residual non-AI category declined approximately 1.3%. This is not an organic revenue bridge, because classification and currency effects remain unresolved, but it demonstrates why gross AI growth is an insufficient indicator of net growth.
Wipro and Cognizant are exposed through large application-services, operations and outsourcing portfolios. TCS faces the same client procurement logic, although scale and offshore delivery capabilities provide important offsets. None of these companies should automatically receive an earnings upgrade merely because AI bookings or AI-associated revenue increase.
The near-term trading catalyst is heightened scrutiny of pricing, organic growth and renewal economics in the next reporting cycles. The longer-duration risk is lower revenue generated from an otherwise stable client workload. Importantly, offshoring and automation can preserve profit while depressing revenue, so the call supports caution on growth-led valuation assumptions more strongly than an immediate sector-wide margin-collapse thesis.
IT SERVICES: VENDOR CONSOLIDATION FAVORS LARGE INTEGRATORS, NOT NECESSARILY THE INDUSTRY REVENUE POOL (READ-THROUGH 2)
Affected companies: Accenture (ACN: Ireland), Tata Consultancy Services (TCS: India), and HCL Technologies (HCLTECH: India).
Directional impact and magnitude: Moderate positive for competitive positioning and access to large transformation programs over 12-36 months. Limited immediate earnings benefit from this specific announcement.
Infosys reported $5.2 billion of large-deal TCV, with 62% net new, including a net-new contract exceeding $2 billion over 7 years. Management emphasized that some large transformations were developed proactively with clients rather than won through conventional requests for proposals. Parekh also stated that almost all large deals included an AI component, with some representing AI-led business transformations.
The relevant competitive advantage is the ability to combine consulting, engineering, infrastructure, operations, security and commercial accountability within a large engagement. Clients pursuing productivity improvements often prefer fewer providers with responsibility for the overall outcome. Large integrators can fund transitions, redeploy staff across service lines, absorb delivery complexity and spread investments in reusable tooling across a broader revenue base.
Accenture benefits from the combination of executive-level transformation relationships and managed-services delivery. TCS and HCL Technologies benefit from global delivery scale and the ability to combine application, infrastructure and operating-model changes. The call reinforces the importance of these capabilities relative to a narrower proposition based primarily on supplying development capacity. Accenture’s own latest results also described broad-based growth, underscoring that Infosys’s downgrade should not be treated as evidence of identical performance across competitors.
However, consolidation does not create an equivalent increase in the industry’s revenue pool. A client can award a large contract to a selected provider while reducing total supplier spending. Net-new revenue to the winner may represent displacement of another incumbent. The Infosys customer was not identified, so no loss should be attributed to Accenture, TCS, HCL Technologies or any other named competitor.
Timing is equally important. Sanghrajka said the net-new megadeal would ramp from the latter part of Q4 and contribute only a “very minuscule amount” in FY27. This is evidence against treating strong bookings as an immediate earnings catalyst. Near-term market attention should focus on net-new annual revenue, transition costs and commencement dates rather than headline TCV. The longer-duration positive is a more concentrated provider landscape in which integrated firms can gain share even while industry growth remains modest.
DIGITAL ENGINEERING: RETAIL AND HIGH-TECH WEAKNESS CHALLENGE A BROAD DISCRETIONARY RECOVERY (READ-THROUGH 3)
Affected company: EPAM Systems (EPAM: United States).
Directional impact and magnitude: Moderate negative for the breadth of the demand-recovery thesis, particularly over the next 2-4 quarters. Insufficient evidence for a specific earnings miss or for deterioration across every EPAM vertical.
Infosys’s retail revenue increased only 0.4% year over year in rupees, while high-tech revenue declined 10%. Both materially missed the supplied consensus estimates. Management attributed the weakness to discretionary ramp-downs and client-specific slowdowns, with particular exposure to the US. These are reported rupee growth rates and should not be directly imposed on a US-dollar peer model.
The read-through to EPAM is more specific than a generic negative view on technology spending. EPAM’s digital-engineering business serves software, high-tech, consumer and retail clients whose projects can depend on discretionary product development, customer-experience investment and modernization budgets. When clients narrow project scope or postpone new releases, the impact reaches engineering providers through slower project starts, reduced team sizes and weaker utilization.
AI creates an additional pressure point. Faster coding can improve delivery economics, but clients can also demand fewer engineering hours or shorter engagements. Providers must convert productivity into larger scopes, new workloads or value-based pricing to avoid losing revenue. Strong client investment in AI infrastructure does not necessarily translate into stronger spending on every outsourced software-development program.
The geographic and vertical distinctions are important. Infosys described better conditions in financial services, energy and utilities, and selected manufacturing activities, while Europe and other markets were stronger than North America. Consequently, the most relevant portfolio distinction is discretionary US retail and technology exposure versus more resilient financial-services, regulatory and infrastructure-related work.
This is an adverse incremental signal, not confirmation of company-wide deterioration at EPAM. EPAM’s latest reported quarter delivered 3.4% organic constant-currency growth and an expanding non-GAAP operating margin. Those results demonstrate that engineering differentiation and execution can offset weaker pockets of demand.
The near-term catalyst is whether subsequent EPAM commentary confirms broader project delays, particularly in software/high-tech and consumer-related work. The longer-duration issue is the ability to capture value from AI-assisted engineering rather than being paid primarily for the labor that AI eliminates. The Infosys call argues against assuming that an industry-wide discretionary rebound is already underway.
BUSINESS-PROCESS OUTSOURCING: STABLE MARGINS CAN MASK A SHRINKING BILLABLE REVENUE BASE (READ-THROUGH 4)
Affected companies: Concentrix (CNXC: United States) and TP, formerly branded Teleperformance (TEP: France).
Directional impact and magnitude: Moderate negative for traditional-service revenue durability over 12-36 months. The immediate earnings implication is smaller and more conditional because automation and offshoring can protect margins.
Infosys identified process AI and agent development among its strongest growth areas while acknowledging productivity-related revenue compression. Parekh stated that clients sometimes request productivity benefits greater than Infosys can economically deliver, leading the company to reject those contracts. This is a direct warning that customers are negotiating over the allocation of AI savings rather than allowing providers to retain all the benefits.
The transmission to customer-experience and business-process outsourcing is through the economics of individual transactions. Self-service, automated resolution and AI-assisted employees reduce the human labor required for customer interactions and back-office processes. Where pricing depends on staffing, handling time or human-assisted transaction volumes, successful automation can reduce the provider’s revenue even while improving the customer’s service economics.
The contract structure determines the outcome. A provider paid for business outcomes can retain part of the value created by automation. A provider paid primarily for labor capacity is more directly exposed to revenue compression. AI deployment revenue can offset that pressure, but it should not automatically be assumed to exceed the erosion of the installed service base.
Contemporaneous company results reinforce this distinction without establishing an earnings-collapse thesis. Concentrix’s latest quarter showed a 0.5% constant-currency revenue decline while its non-GAAP operating margin increased 30 basis points to 12.6%. TP reported a 1.7% like-for-like H1 revenue decline with a stable 13.6% recurring EBITA margin, and specifically identified accelerating offshoring as a revenue headwind. TP also cited Trust & Safety weakness, so its decline cannot be attributed entirely to AI.
The near-term trading implication is that margin resilience should not, by itself, be interpreted as evidence that legacy revenue has stabilized. The relevant catalysts are renewal pricing, organic growth, the share of outcome-based business and the extent to which new services replace lost traditional work.
The longer-duration negative concerns the revenue base and terminal growth assumptions, not necessarily current cash generation. These companies can remain profitable and cash-generative while the revenue attached to a given client process declines. Conversely, successful migration to outcome-based contracts would weaken the negative read-through. This makes indiscriminate short exposure less compelling than scrutiny of contract mix and organic growth.
CYBERSECURITY: AI INCREASES THE VALUE OF REMEDIATION AND SECURITY OPERATIONS, NOT JUST VULNERABILITY DISCOVERY (READ-THROUGH 5)
Affected companies: CrowdStrike Holdings (CRWD: United States) and Palo Alto Networks (PANW: United States).
Directional impact and magnitude: Moderate positive for the addressable opportunity and channel relevance over 12-24 months. Small incremental near-term earnings signal because Infosys disclosed no associated software bookings or spending commitments.
Parekh described cybersecurity as “a huge opportunity for Infosys” and emphasized the need for combined agent-based and human capabilities. He also noted that different frontier models uncover different application-layer vulnerabilities. The important implication is that AI can increase both the quantity of discovered weaknesses and the difficulty of prioritizing and remediating them.
The economic bottleneck is not necessarily discovering another vulnerability. It is determining exploitability, connecting findings with asset and identity context, applying compensating controls, and executing remediation without disrupting production systems. Platforms integrated into security operations can benefit from this expansion in operational complexity.
CrowdStrike has a directly identifiable distribution connection. Its Project QuiltWorks announcement names Infosys among participating partners and describes the use of the Falcon platform to assess, prioritize and continuously remediate frontier-AI risk. That provides a concrete mechanism through which Infosys’s expanding security work can support platform adoption and associated services. It does not establish that every Infosys security engagement generates incremental CrowdStrike revenue.
Palo Alto Networks also has an established operational relationship with Infosys. Its published customer material describes Infosys using Cortex XSOAR to automate and orchestrate cyber-defense operations. The read-through is positive for security orchestration and integrated security operations as the volume and complexity of AI-related findings increase. The historical relationship should not be mistaken for a newly disclosed Q2 contract or a quantified current-quarter order.
The budget qualification is crucial. Parekh said overall client budgets would not increase “disproportionately.” Security can gain priority by taking spending from other technology initiatives rather than through an unrestricted expansion in total IT budgets. This favors suppliers with a demonstrable role in operational risk reduction, but does not imply that every cybersecurity product category benefits equally.
The near-term catalyst is evidence of funded platform expansions, deployments and customer commitments in vendor results. The longer-duration positive is a recurring need to secure changing applications, models and agents. The call supports that structural mechanism more strongly than a short-lived breach-related trading thesis. It provides no basis for treating the question about an alleged eMudhra incident as evidence of an Infosys security breach.
BANKING AND GLOBAL CAPABILITY CENTERS: THE CUSTOMER MAY CAPTURE MORE DURABLE VALUE THAN THE IMPLEMENTATION PROVIDER (READ-THROUGH 6)
Affected companies: Truist Financial (TFC: United States), positively; Infosys (INFY: India), positively during implementation but with a qualification on the duration of associated service revenue.
Directional impact and magnitude: Low immediate impact on Truist’s consolidated earnings, with a potentially meaningful positive effect on technology and operating efficiency over 2-3 years. No quantified earnings benefit can be established from the disclosed information.
The call highlighted strong financial-services demand and increasing work on AI-enabled GCCs. Parekh referred to a recently announced engagement with a large financial-services client and described the ability to build or transform centers around different recruitment, training and staffing models.
Infosys’s October 19 announcement identifies Truist as a relevant, directly disclosed customer. It describes an AI-first GCC in Hyderabad, the consolidation of capabilities previously delivered through multiple supplier relationships, and the onboarding of more than 1,000 colleagues. Crucially, it also states that Infosys will help build, scale and transition a self-sustaining center designed to reduce third-party dependency. There is no basis for identifying this engagement as the separate $2 billion-plus megadeal discussed on the call.
For Truist, the mechanism is a combination of delivery-location economics, reduced supplier fragmentation, internal ownership of technology capabilities and greater control over data and operating processes. AI can amplify these benefits through faster development, improved workflow automation and lower manual processing requirements. The relevant financial transmission is through noninterest expense, technology productivity and potentially better execution, not higher loan demand or net interest income.
The non-obvious implication is that a growing GCC pipeline is not necessarily equivalent to a permanently expanding outsourced-services annuity. A build-operate-transfer model can produce substantial implementation revenue while enabling the customer to internalize more work later. Infosys can benefit from initial transformation and continuing specialist services, but the revenue duration depends on the contractual perimeter and the eventual division between captive and outsourced activity.
The announcement also describes consolidation of multiple supplier relationships. That creates competitive risk for displaced providers, but their identities are not disclosed. No loss should be attributed to a named competitor without additional evidence.
The near-term trading catalyst is limited because the collaboration was announced before the earnings call. Upfront transition and hiring costs can precede savings. The longer-duration positive for Truist is the potential to obtain a structurally more efficient technology operating model, while the cross-portfolio implication is that enterprise customers may retain a substantial share of AI’s economic benefits. Strong transformation spending can therefore coexist with pressure on the long-term revenue intensity of the services industry.
Report record
- Sector
- Information Technology
- Industry
- IT Services
- Fiscal period end
- September 30, 2026
- Report date
- October 23, 2026
- Analysis
- 6183 words
- Read-throughs
- 2503 words
- Content fingerprint (PDF)
978e3dd8b08e- Content fingerprint (analysis)
cc734dba43af- Content fingerprint (read-throughs)
6b48a6379ce1
Prepared from the company's earnings release and earnings call transcript. Figures as reported by the company. For information only. Not investment advice.
More from Infosys
No other reports yet.
More in Information Technology
Optical and IP Growth Validated; Cash Conversion Moved the Other Way
Greater Confidence in Execution Than in Management's Forecasts
All Information Technology reports
Follow @AtlasPeakRes on X for new earnings reports as they publish.