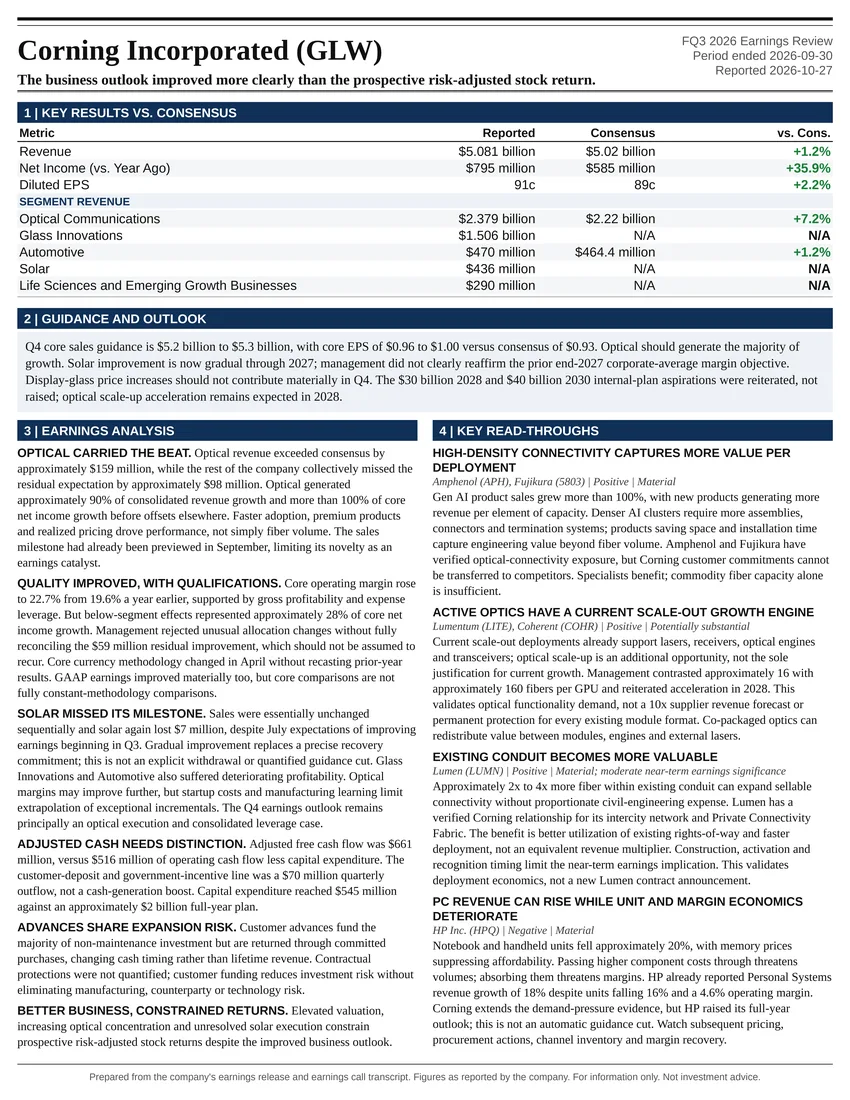
The business outlook improved more clearly than the prospective risk-adjusted stock return.
Earnings Reports
SK Hynix Inc FQ3 2026 Earnings Report
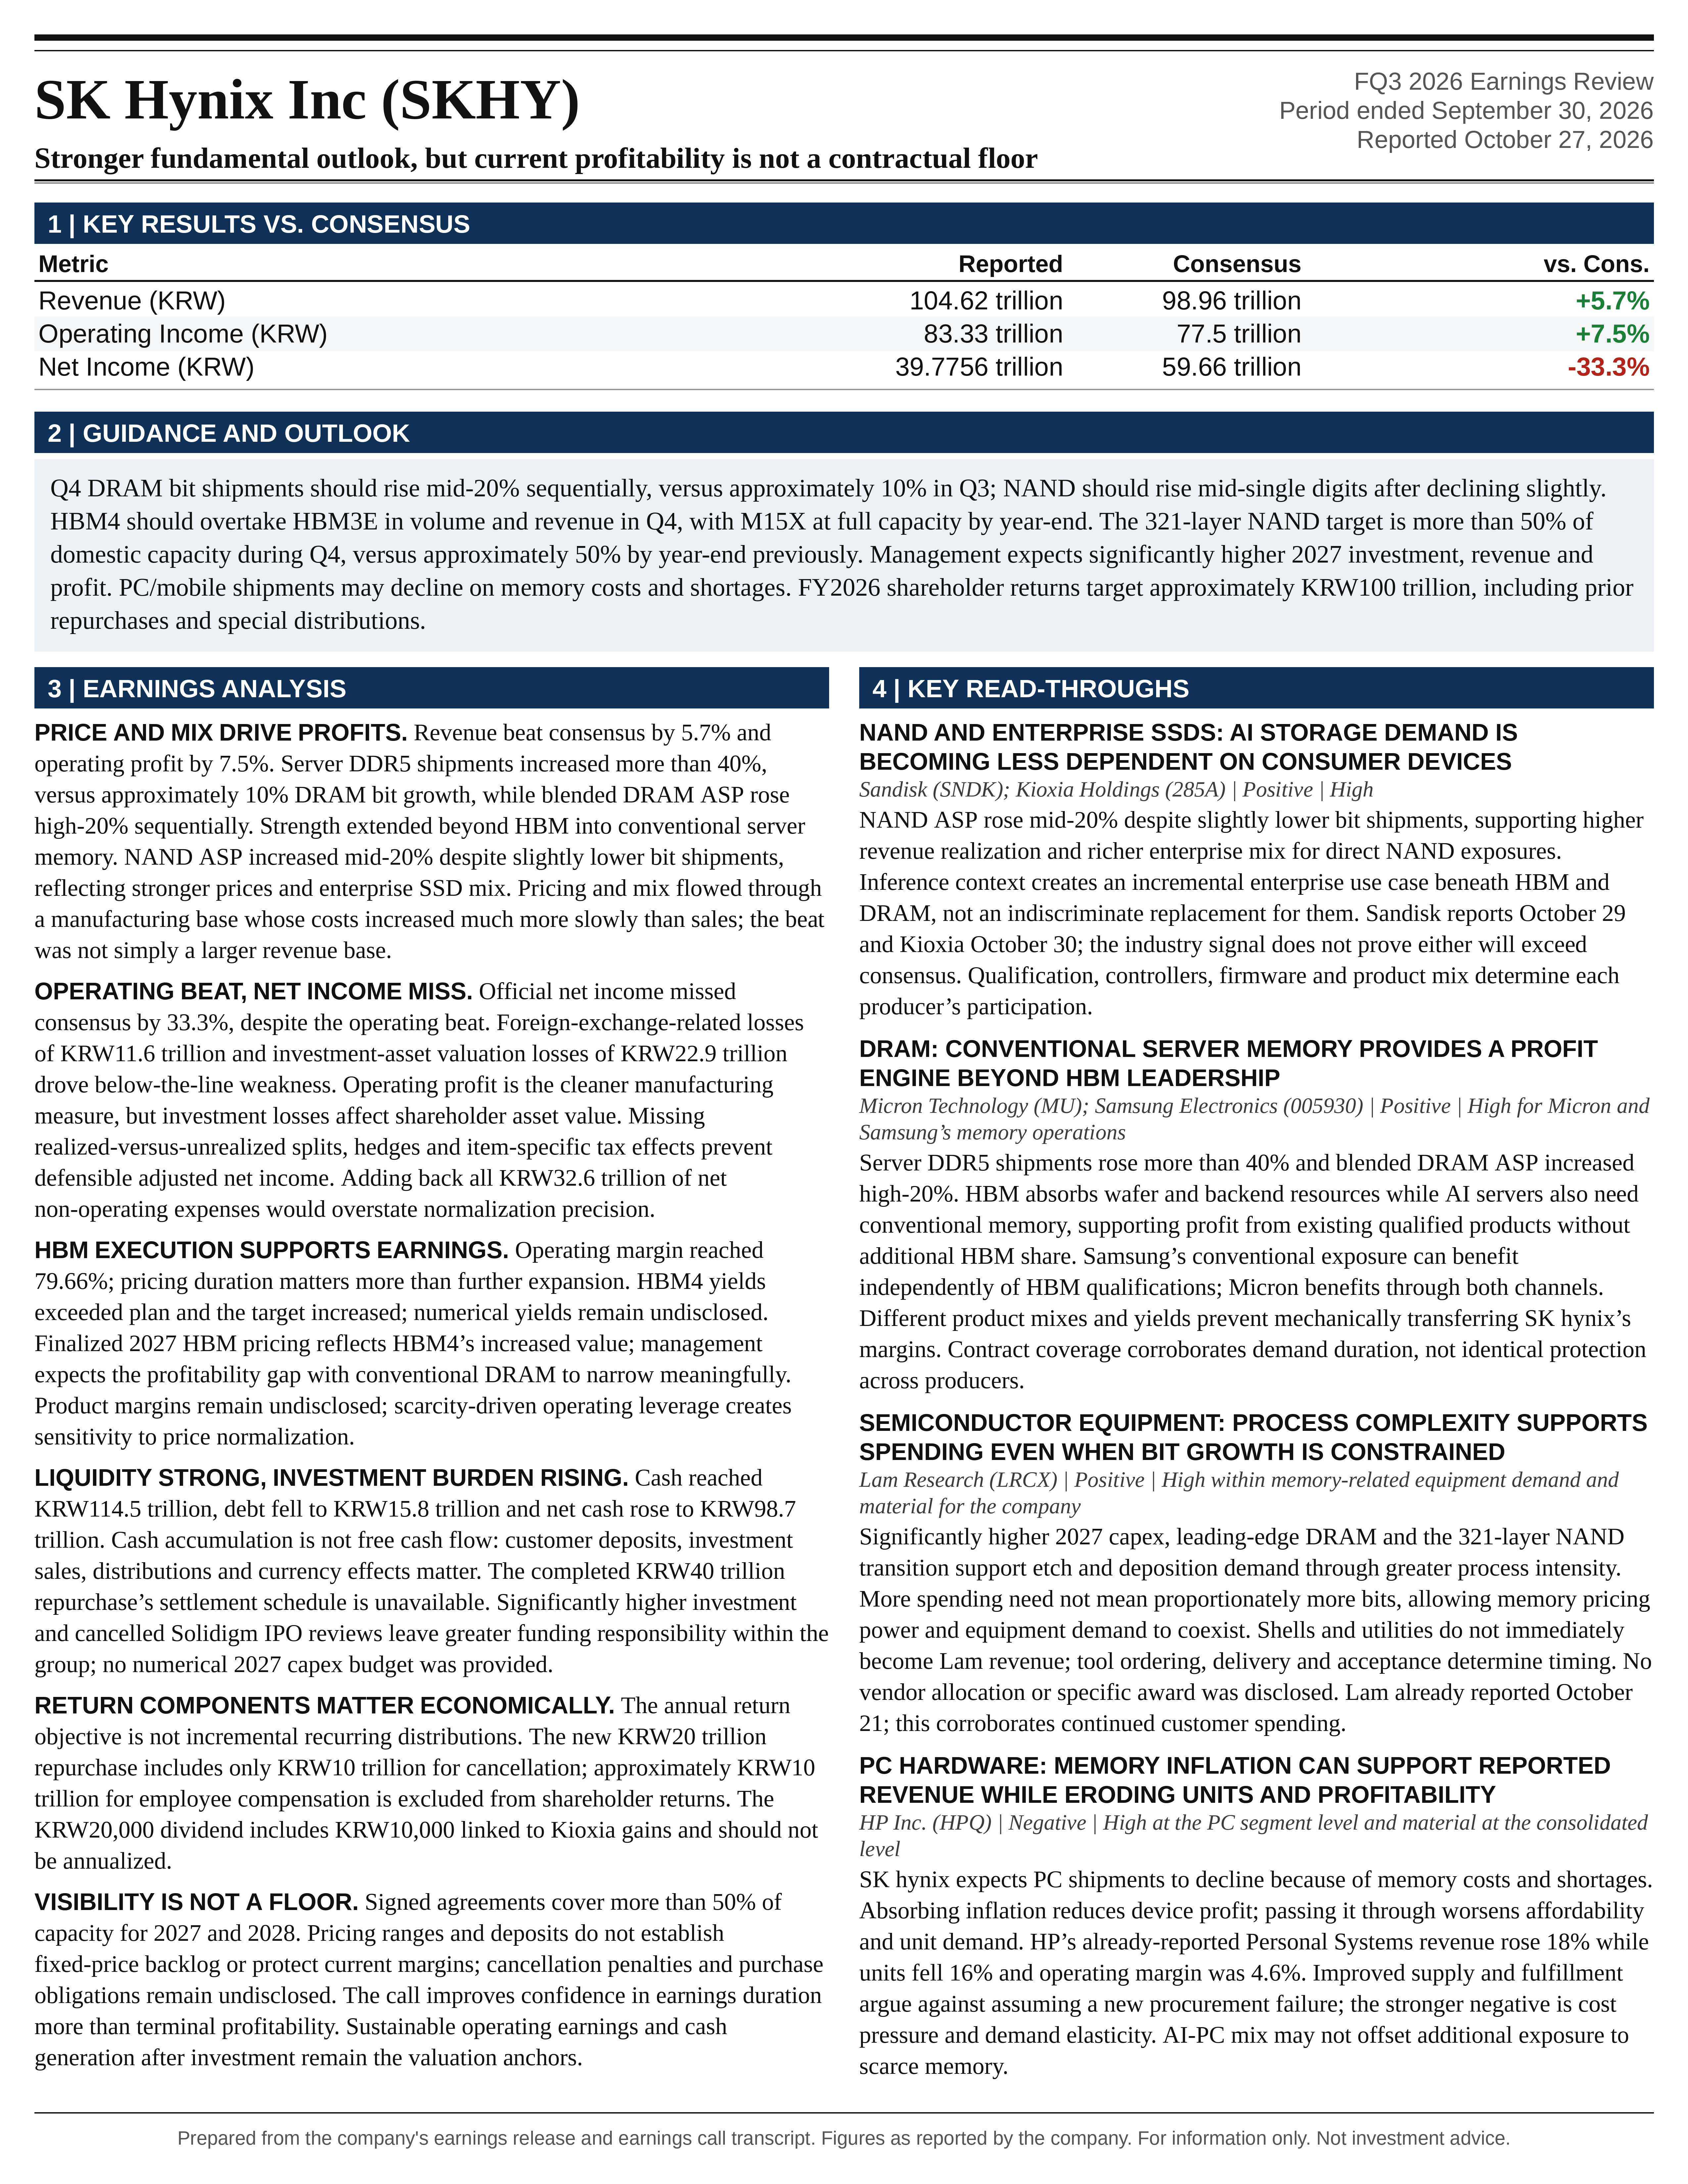
SK Hynix Inc (SKHY) FQ3 2026 earnings: Stronger fundamental outlook, but current profitability is not a contractual floor. Full earnings analysis, key read-throughs, and the one-page exhibit from Atlas Peak Research.
SK Hynix Inc (SKHY)
Sector: Information Technology · FQ3 2026 · Period end September 30, 2026 · Reported October 27, 2026
SK hynix’s Q3 2026 earnings call materially strengthened the case for sustained earnings growth, but the most important development was improved demand visibility rather than the magnitude of the quarterly profit beat.
Download the one-page report (PDF)
View one-page exhibit
Download analysis (.md)
Download read-throughs (.md)
Post to X
One-Page Exhibit
Earnings Analysis
EXECUTIVE CALL SUMMARY: SK hynix Inc. (10/27/26)
SK hynix’s Q3 2026 earnings call materially strengthened the case for sustained earnings growth, but the most important development was improved demand visibility rather than the magnitude of the quarterly profit beat. Revenue exceeded Bloomberg consensus by 5.7%, operating profit exceeded consensus by 7.5%, and management outlined another substantial shipment increase for Q4. More consequentially, signed long-term agreements now cover more than 50% of production capacity for 2027 and 2028, while signed commitments and customer purchasing discussions collectively support management’s description of DRAM and HBM volumes as “effectively sold out” through 2029. These disclosures support a lower discount for earnings volatility, but they do not establish that all capacity is contractually committed or that current margins are protected.
The operating outlook is constructive. HBM4 is progressing from initial shipments into a meaningful production ramp, conventional server DRAM remains exceptionally strong, and enterprise SSDs are benefiting from both higher prices and a richer product mix. Management expects Q4 DRAM bit shipments to increase by a mid-20% rate sequentially, versus approximately 10% in Q3, while NAND bit shipments should increase by a mid-single-digit rate after declining slightly in Q3. Finalized 2027 HBM pricing, improving yields, and a larger HBM4 contribution provide additional earnings support. The principal counterweight is an operating margin already approaching 80%, which makes the duration of pricing strength more important than further margin expansion.
Capital allocation also improved materially. The approximately KRW100 trillion FY2026 shareholder-return objective addresses concerns that the earnings windfall would be retained indefinitely or absorbed entirely by capacity expansion. However, this is a total annual objective, not KRW100 trillion of incremental distributions following the call. It includes previously announced repurchases and nonrecurring distributions associated with Kioxia investment gains. The cancellation of Solidigm’s IPO review avoids raising equity on terms management considers unattractive, but it also leaves SK hynix with greater responsibility for financing Solidigm’s growth.
The investment conclusion is a stronger fundamental outlook without sufficient evidence for a price-insensitive purchase. The call supports greater confidence in near-term earnings and a potentially more durable business model, but it does not justify treating current profitability as a contractual floor. Valuation should be anchored to sustainable operating earnings and cash generation after the forthcoming investment increase, rather than annualized peak margins, reported net income distorted by investment valuations, or the headline shareholder-return amount.
SOURCE RECONCILIATION AND INTERPRETATION
The supplied transcript is an initial draft dated 10/27/26; SK hynix’s official Q3 release is dated 10/28/26. The heading retains the supplied transcript’s call date. The official release reports revenue of KRW104.6155 trillion, operating profit of KRW83.3338 trillion, and net income of KRW39.7756 trillion. These figures corroborate the transcript’s rounded operating results and approximately KRW39.8 trillion net income. The supplied Bloomberg notice instead reports net income of KRW39.53 trillion. That KRW0.2456 trillion difference remains unresolved and should not be silently treated as rounding.
The distinction does not change the investment conclusion. Against Bloomberg net-income consensus of KRW59.66 trillion, the notice implies a 33.7% miss, while the official release implies a 33.3% miss. The operating business substantially exceeded expectations, but reported earnings available below the operating line were much weaker than expected. The figures remain preliminary and subject to external review.
Several technical terms are garbled in the draft. The official release identifies the longer-term NAND technology as HBF, or High Bandwidth Flash, rather than the inconsistent “HPF” and “HPS” references. Several Q&A answers are attributed only to an unidentified speaker. Those statements are therefore attributed to management rather than assigned to a specific executive.
QUARTERLY PERFORMANCE AND THE QUALITY OF THE OPERATING BEAT
Revenue of KRW104.62 trillion increased 32% sequentially and 328% year over year. Operating profit of KRW83.33 trillion increased 38% sequentially and 632% year over year. Relative to Bloomberg consensus, revenue exceeded expectations by approximately KRW5.66 trillion and operating profit by KRW5.83 trillion. The operating-profit surprise was therefore not simply a function of a larger revenue base; profitability also exceeded the level implied by consensus.
Using the detailed figures, operating margin was 79.66%, compared with 76.33% in Q2 and approximately 78.31% implied by Bloomberg’s revenue and operating-profit estimates. The sequential improvement was approximately 3.33 percentage points, while the margin beat was approximately 1.34 percentage points. These calculations explain why management’s reported 3-percentage-point improvement is consistent with rounded headline margins of 80% and 76%.
The historical progression is exceptional. Official releases show revenue increasing from KRW32.83 trillion in Q4 2025 to KRW52.58 trillion in Q1 2026, KRW79.32 trillion in Q2, and KRW104.62 trillion in Q3. Operating profit increased from KRW19.17 trillion to KRW37.61 trillion, KRW60.54 trillion, and KRW83.33 trillion over the same periods. Operating margin consequently rose from approximately 58% to 72%, 76%, and 80%. Revenue and operating profit for the first 9 months of 2026 totaled approximately KRW236.51 trillion and KRW181.49 trillion, respectively.
Sequential percentage growth slowed from 51% to 32% for revenue and from 61% to 38% for operating profit between Q2 and Q3. This should not be interpreted mechanically as a deterioration in demand. The absolute operating-profit increase was approximately KRW22.79 trillion in Q3, almost identical to the KRW22.93 trillion increase in Q2. Growth is occurring against a rapidly expanding denominator.
Operating leverage remained unusually strong. Revenue increased by KRW25.30 trillion sequentially, while operating profit increased by KRW22.79 trillion, implying an approximately 90.1% incremental operating margin. Aggregate operating costs, calculated as revenue less operating profit, increased only 13.3%, from approximately KRW18.78 trillion to KRW21.28 trillion. This is consistent with substantial pricing and mix benefits flowing through a manufacturing base whose costs increased much more slowly than sales.
The distinction between structural improvement and scarcity-driven profitability remains important. Higher-value products, process migration, yield improvement, and manufacturing execution can support a structurally better earnings profile. However, a 90% incremental operating margin also demonstrates how much of the current earnings acceleration depends on revenue realization rather than proportionate increases in physical output. The same mechanism creates sensitivity to eventual price normalization.
DRAM bit shipments increased approximately 10% sequentially, which management described as “as planned.” Server DDR5 shipments increased more than 40%, substantially faster than overall DRAM shipments. This indicates that the quarter’s strength extended beyond HBM into conventional server memory. The category is benefiting from both AI-related content growth and the allocation of production resources toward higher-value applications.
DRAM average selling prices increased by a high-20% rate sequentially. That blended increase includes stronger conventional DRAM prices and a higher contribution from HBM4. It should not be interpreted as an equivalent increase in like-for-like commodity DRAM contract prices. The interaction of approximately 10% bit growth and a high-20% ASP increase implies roughly 40% revenue growth before currency and other reconciliation effects for the relevant DRAM population. No precise product revenue bridge can be established because segment weights and currency effects were not disclosed.
NAND followed a different pattern. Bit shipments declined slightly, while ASP increased by a mid-20% rate, reflecting stronger prices and an expanded enterprise SSD mix. The quarter therefore demonstrates substantial value capture without NAND volume growth. It does not establish whether lower shipments reflected production changes, inventory movements, customer qualification timing, or deliberate allocation across product categories beyond management’s stated emphasis on higher-value products.
NON-OPERATING LOSSES AND EARNINGS NORMALIZATION
The net-income miss should be separated from the operating beat, but not dismissed. Management disclosed KRW11.6 trillion of foreign-exchange-related net losses and KRW22.9 trillion of investment-asset valuation losses. These items totaled KRW34.5 trillion, compared with aggregate net non-operating expenses of KRW32.6 trillion, implying approximately KRW1.9 trillion of offsetting net income elsewhere below operating profit.
Net non-operating expenses absorbed approximately 39% of operating profit, reducing pretax income to approximately KRW50.7 trillion. Official net income of KRW39.78 trillion implies an effective tax rate of approximately 21.5%, subject to the rounding of pretax income. The resulting 38% net margin was less than half the operating margin.
The historical comparison illustrates why reported net income is a poor standalone measure of the underlying memory franchise. Q2 net income was KRW93.92 trillion, exceeding both revenue and operating profit. Q3 net income fell approximately 57.7% sequentially even as operating profit increased approximately 37.6%. The reversal reflects the importance of below-the-line items, not an operating downturn.
Operating profit is therefore the cleaner measure of current manufacturing performance. Nevertheless, investment losses affect the economic value of assets owned by shareholders, and foreign-exchange losses may include financially relevant exposures. The call does not provide the realized-versus-unrealized split, relevant hedges, asset-level attribution, or item-specific tax effects needed to construct a defensible adjusted net-income figure. Adding back the entire KRW32.6 trillion without those details would overstate the precision of normalized earnings.
The company also faced adverse operating translation effects from the stronger Korean won. Those effects should be distinguished from the separately disclosed foreign-exchange losses below operating profit. The currency sensitivity of operating revenue, balance-sheet assets, liabilities, and investments cannot be consolidated into a reliable single sensitivity from the call alone.
Q4 GUIDANCE AND CHANGES FROM PREVIOUS DISCLOSURES
The most important near-term guide is the expected mid-20% sequential increase in Q4 DRAM bit shipments. This represents a substantial acceleration from approximately 10% in Q3. Management attributed the increase to simultaneous expansion of 1c-process production and higher HBM4 output through M15X. The company is therefore approaching Q4 with a more significant volume contribution than in the latest quarter, when price and mix were especially important.
Using 25% solely as an illustrative interpretation of “mid-20%,” unchanged blended ASP would produce approximately 25% DRAM revenue growth before currency effects. A further 10% ASP increase would produce approximately 37.5% growth because volume and price compound. Conversely, a 10% ASP decline would still leave revenue approximately 12.5% higher. These are sensitivities, not management revenue guidance.
NAND bit shipments are expected to increase by a mid-single-digit rate. Using 5% illustratively, unchanged ASP would produce approximately 5% revenue growth, while a further 10% ASP increase would produce approximately 15.5%. The company did not provide a numerical Q4 ASP forecast, consolidated revenue range, or operating-margin target. A precise consolidated earnings forecast cannot be inferred from the shipment guidance alone.
The official Q2 release provides several useful same-period comparisons. It had already disclosed that HBM4 mass shipments began in Q2 and that production would ramp during the second half. Q3’s description of full-scale production and shipments should therefore be understood as a scaling milestone, not the first commercial shipment of HBM4. The new Q4 crossover expectation, under which HBM4 should exceed HBM3E in both shipment volume and revenue, makes the commercialization trajectory substantially more concrete.
The Q2 release also stated that HBM4E samples had been shipped in the first half. The current call specifies Q2 and confirms that qualification remains aligned with customer schedules. This is evidence of continued execution, not a demonstrated acceleration in the commercial timetable.
For NAND, the Q2 release targeted approximately 50% of domestic production capacity on the 321-layer process by year-end. The current call targets more than 50% during Q4. This is a modest strengthening of the stated mix objective rather than a fundamentally new manufacturing plan. The denominator is domestic capacity, not necessarily the entire consolidated NAND production base.
M15X acceleration and investment ahead of the Yongin Phase 1 cleanroom opening in early 2027 were also discussed in Q2. The current call adds a year-end target for M15X to reach full capacity and confirms significantly higher 2027 investment. The Yongin commentary is consistent with the earlier expansion direction; it does not, by itself, establish a new acceleration against the previously disclosed early-2027 cleanroom timetable.
Management expects 2027 revenue and profit to reach a “significantly higher level,” but provided no numerical financial range. It also expects achievable industry growth of a mid-20% rate for DRAM and a high-10% rate for NAND, similar to 2026. These are supply-constrained industry volume expectations, not SK hynix revenue guidance or a quantified forecast of unconstrained end-market demand.
LONG-TERM AGREEMENTS: THE MOST IMPORTANT STRUCTURAL DEVELOPMENT
The strongest incremental disclosure was the expansion and clarification of long-term agreements. The official Q2 release identified agreements with approximately 10 customers. The current call identifies 14 key customers, including major global cloud service providers, and discloses that contracted volumes exceed 50% of total capacity for 2027 and 2028. The increase in customer count is meaningful, but it does not establish a proportional increase in contracted revenue because customer sizes and commitments are undisclosed.
The distinction between contractual commitments and commercial visibility is essential. Management stated that “our DRAM and HBM volume for the next 3 years through 2029 are effectively sold out,” but explicitly based that conclusion on both signed LTA volumes and demand under discussion. The firm contractual disclosure is more than 50% capacity coverage for 2027 and 2028. The broader 2029 statement includes purchasing plans that management considers highly likely to materialize.
Consequently, “effectively sold out” is not equivalent to a legally enforceable, fixed-price backlog covering all output through 2029. It is a strong demand signal with incomplete disclosure of commitment quality. Treating the entire production base as guaranteed revenue would overstate the evidence.
The contracts generally operate over 5 years, and some customers are discussing extensions. Their pricing is designed to reflect market conditions within an agreed range. Management also disclosed “safeguards such as deposits.” These features plausibly improve production planning, customer commitment, and capital-allocation discipline relative to short-duration transactional demand. Confidence in that directional benefit is high; confidence in the extent of downside earnings protection is materially lower.
Critical terms remain undisclosed. These include deposit size, refundability, cancellation penalties, minimum purchase obligations, delivery deferral rights, product substitution, price-reset frequency, floor and ceiling levels, and remedies if customer requirements change. Deposits are not necessarily equivalent to take-or-pay obligations. An agreed pricing range may protect downside and preserve upside, but it may also limit upside participation or require future renegotiation.
The contracts should also be evaluated at the customer level. A 5-year commitment from a strongly capitalized hyperscaler is economically different from a commitment dependent on future financing or project completion. Management’s statement that it evaluates customer financial health and funding capability is constructive, but no counterparty concentration or credit-support schedule was provided.
The remaining non-LTA capacity creates flexibility to capture improving prices and allocate output to new products. It also retains exposure to market clearing conditions. The business model is becoming more contracted, not fully insulated from the memory cycle.
The principal valuation implication is therefore a potential reduction in earnings uncertainty, rather than elimination of cyclicality. A higher multiple becomes more defensible if LTAs demonstrably stabilize cash generation through weaker market conditions. The existence of contracts alone does not establish that outcome.
HBM4, PRICING, AND THE NEXT COMPETITIVE PHASE
HBM4 execution was a central operational strength. Management stated that production was proceeding without disruption, yields had exceeded the original plan, and the yield target had been increased. It also emphasized that backend yield refers to “the entire process, not just individual steps like bump, stack, or KGSD test.” This distinction matters because commercial output depends on end-to-end yield rather than selectively reported process yields.
If sustained, stronger end-to-end yields increase saleable output, reduce the loss of costly stacked components, and improve utilization of constrained packaging resources. They can therefore create both volume and margin benefits. However, no numerical yield data or comparable competitor measurements were disclosed. The claim of industry-leading yield remains a management assertion, while the upward revision to the internal target is a more concrete execution indicator.
The expected Q4 crossover of HBM4 over HBM3E in both shipment volume and revenue indicates that HBM4 is becoming the primary growth engine within HBM. Revenue crossover alone could reflect a price premium; shipment crossover also indicates meaningful physical scale. The disclosure does not necessarily establish that HBM4 exceeds 50% of all HBM shipments if other generations remain material.
Management has finalized 2027 HBM volume and price negotiations with major customers and stated that pricing reflects the increased value of HBM4. It expects the profitability gap between HBM and conventional DRAM to “narrow meaningfully.” A reasonable interpretation, with medium confidence, is that unusually strong conventional DRAM pricing has created an opportunity-cost gap that 2027 HBM repricing and manufacturing improvement should help close. Product-level margins were not disclosed, so the current ranking and magnitude of that gap cannot be established precisely.
The relevant economic measure is not simply HBM selling price per bit. HBM consumes production resources through larger die requirements, stacking, testing, packaging, base dies, and potential yield losses. The allocation decision depends on return per constrained wafer and backend resource, not only gross margin percentage. Higher HBM4 prices are particularly valuable if they compensate for these incremental resource demands rather than merely accompany higher product complexity.
Custom HBM provides a potential extension of competitive differentiation. Deeper optimization around customer systems and workloads can increase switching costs and strengthen co-development relationships. It can also increase engineering expense, qualification complexity, customer concentration, and the risk of customer-specific designs becoming stranded. The call confirms ongoing projects but provides no design-win economics, development-cost recovery, or volume commitments sufficient to value custom HBM separately.
LOWER STACK HEIGHT: A REAL ECONOMIC TRADE-OFF
Management characterized customer interest in shorter HBM stacks as a response to supply scarcity: customers want to build more accelerators and systems from limited memory resources. That interpretation is plausible, but it is not the only possible explanation. Stack changes can also reflect system cost, thermal characteristics, bandwidth-to-capacity requirements, product segmentation, and changes in workload architecture.
The arithmetic is important. Moving from 12-high to 8-high reduces the number of memory dies per cube by 33.3%. Maintaining identical capacity per cube would require a 50% increase in capacity per die. Management stated only that higher die density can offset a substantial portion of the reduction; it did not disclose the density assumptions required to quantify the net capacity change.
At unchanged die density and aggregate delivered bit volume, an 8-high configuration would require 50% more cubes than a 12-high configuration. That increases base-die requirements and the number of units moving through relevant backend processes, even though each stack contains fewer memory dies. The bottleneck can therefore shift rather than disappear.
Profitability depends on the balance among pricing, yield, packaging throughput, base-die costs, and capacity per delivered cube. Lower stacks might improve some yield characteristics while increasing other costs per bit. Neither a proportional earnings decline nor a cost-free transition follows from stack height alone.
Management stated that customer volume requirements exceed twice current supply capability. This supports the near-term case that freed resources can be redeployed, but the requirement figure is not equivalent to firm incremental orders. In constrained markets, requested allocations can contain precautionary demand. The strongest validation would be sustained purchase commitments as availability improves, rather than continued reliance on unconstrained customer requests.
NAND AND THE EMERGING CONTEXT-MEMORY OPPORTUNITY
NAND’s strategic positioning improved during the call because management connected current enterprise SSD strength with a specific architectural use case: storing and reusing inference context. This is more differentiated than a general claim that AI increases storage demand. The opportunity arises when economically useful KV-cache data exceeds the capacity that can be retained entirely in HBM or DRAM.
The company described a tiered architecture that allocates data among HBM, DRAM, and SSDs according to access frequency and reuse value. SALT-KV evaluates the usefulness and storage cost of cached context, while CMM Hybrid combines SSD capacity with prediction and preloading into DRAM. The intended economic benefit is to retain more reusable context without paying HBM economics for every byte.
SK hynix’s October 2026 OCP disclosures corroborate system demonstrations involving CXL hybrid memory, SSD-based KV-cache storage, and preloading into DRAM. This provides evidence beyond a conceptual roadmap. Nevertheless, demonstrations and proof-of-concept deployments do not establish broad production adoption, recurring software revenue, or material current earnings.
The technical limitations are significant. SSDs cannot replace HBM indiscriminately for latency-sensitive access. Performance depends on cache-hit rates, prefetch accuracy, transfer bandwidth, scheduling, workload locality, endurance, and the frequency with which cached data is rewritten. A system can store substantially more context while still failing to meet latency requirements if access patterns are poorly predicted.
KV-cache demand also varies with model architecture, token count, concurrency, precision, and the number of key-value heads. Quantization, cache compression, eviction policies, and more efficient attention architectures can reduce storage requirements per unit of work. Conversely, lower serving costs can increase the volume of inference and economically viable context lengths. The net demand effect is therefore a function of both technical efficiency and usage elasticity.
The investment opportunity is not that every byte moved from HBM becomes an equally profitable byte in NAND. NAND has different pricing and margin economics. The stronger thesis is that SK hynix can participate across several tiers and capture growth in the total memory hierarchy even as workload allocation changes.
Near-term earnings should remain anchored to enterprise SSD shipments, product qualification, customer mix, and the 321-layer ramp. HBF and advanced tiering should be treated as longer-duration opportunities until production schedules, customer commitments, and unit economics become clearer. The call supports strategic relevance, not a separately quantified near-term revenue stream.
Solidigm remains important within this strategy because of its enterprise storage capabilities and high-capacity product positioning. However, the transcript does not disclose standalone Solidigm revenue, profitability, cash requirements, or returns on planned manufacturing investment. The value of retaining full ownership cannot be quantified from the call.
AI DEMAND DURABILITY: SUPPORTIVE EVIDENCE, INCOMPLETE PROOF
Management presented several arguments for continued AI investment: expanding paid adoption, strong cloud growth, larger order backlogs, increased enterprise commitments, sovereign investment, and broader participation outside the largest technology companies. These arguments support the existence of genuine underlying demand and make the investment cycle more diversified than a framework based on a small group of hyperscalers alone.
The quantitative claims require careful interpretation. Management cited cloud revenue growth of 30%-80% and backlog expansion of 2-5 times, but did not identify the full customer set, comparison periods, or AI-specific contribution. Cloud revenue is not equivalent to AI revenue, and booked demand is not equivalent to realized cash flow or attractive project returns.
The statement that customers’ AI sales and cash flow “will only improve” is particularly strong. It should be treated as management’s outlook rather than an established trajectory. Revenue can grow while returns on capital weaken if depreciation, financing costs, inference costs, or infrastructure requirements rise faster than monetization.
Management also cited expectations for more than 60% growth in global CSP capital expenditure in 2027 and more than 100% growth in secured power capacity. These are third-party estimates relayed by the company, not independently established customer guidance. Secured power capacity should not be equated with energized, usable capacity available for deployed servers during the same period.
The diversification argument is directionally credible but does not eliminate correlated risk. Sovereign projects, enterprise infrastructure, and hyperscaler investment can share semiconductor suppliers, electricity constraints, financing conditions, and expectations about AI economics. A broader customer base reduces dependence on individual investment decisions while leaving exposure to common technological and financial factors.
The call’s acknowledgement that PC and mobile shipments may decline because of memory costs and shortages is also important. Memory pricing is already generating demand destruction in some end markets. AI can more than offset that pressure, but the business mix is becoming increasingly dependent on data-center economics. This strengthens growth exposure while concentrating the source of marginal demand.
SUPPLY THROUGH 2030 AND CAPITAL DISCIPLINE
Management expects supply constraints to persist through 2030, citing leading-edge manufacturing complexity and long construction lead times. These are credible sources of friction, particularly when HBM growth increases resource intensity and process migration produces less incremental bit output than in earlier generations.
The statement should nevertheless be interpreted as a strategic forecast, not a supply guarantee. A multiyear period of tightness can contain significant pricing corrections. Aggregate shortages can coexist with oversupply in particular products, stack configurations, customer platforms, or technology nodes. Yield improvement, customer redesign, competing capacity additions, and weaker demand can also alter market balance faster than new fab construction alone would suggest.
Management’s response to overproduction concerns was appropriately focused on the distinction between infrastructure and output: “more investment or more fabs does not necessarily mean more supply.” Accelerating shell construction while opening cleanrooms and installing equipment in stages creates flexibility. It reduces the risk that long lead times prevent participation in demand growth while retaining some control over the timing of productive capacity.
That flexibility is valuable but not costless. Shell construction, supporting infrastructure, equipment commitments, engineering resources, and customer qualification can absorb capital before commercial demand is fully realized. Delaying tool installation can protect near-term supply discipline while still lowering returns on capital already invested.
The 2027 capex increase therefore has competing implications. It supports output growth and technological competitiveness, but it also increases the importance of customer commitment quality and future cash conversion. The call does not provide a numerical 2027 investment budget, a complete 2026 cash-capex bridge, or project-level return thresholds. Those omissions prevent a reliable forecast of post-investment cash available for distributions.
Depreciation and amortization of KRW4.3 trillion were relatively small compared with EBITDA of KRW87.7 trillion. The approximate 84% EBITDA margin is impressive, but current depreciation reflects the historical installed asset base rather than the full economic burden of the next expansion phase. EBITDA should not be treated as sustainable distributable cash without accounting for replacement investment, growth capex, taxes, and working capital.
BALANCE SHEET AND CASH CONVERSION
Cash and cash equivalents increased by KRW26.5 trillion to KRW114.5 trillion, while interest-bearing debt declined by KRW2.8 trillion to KRW15.8 trillion. Net cash consequently increased by KRW29.3 trillion to KRW98.7 trillion. This provides substantial financing flexibility and materially reduces immediate balance-sheet risk.
The longer trajectory reinforces that improvement. Official disclosures show net cash of approximately KRW35 trillion at Q1-end, KRW69.4 trillion at Q2-end, and KRW98.7 trillion at Q3-end. The company has therefore accumulated considerable liquidity while continuing to invest and reduce debt.
However, the change in cash is not equivalent to free cash flow. Operating cash generation, capital expenditure, investment sales, customer deposits, financing, distributions, and currency effects all affect the balance. The timing of the completed KRW40 trillion repurchase is also important because completion occurred after quarter-end, and the call does not provide the settlement schedule needed to bridge September-end cash to the current balance.
Customer deposits deserve particular attention. They can strengthen liquidity and reduce financing needs, but they also represent obligations associated with future deliveries. An increase in customer funding can improve reported cash generation without representing an equivalent increase in earned economic profit.
The balance sheet supports the feasibility of substantial shareholder returns and investment. It does not independently establish that approximately KRW100 trillion of annual distributions will remain sustainable through a weaker pricing environment.
SHAREHOLDER RETURNS: SUBSTANTIAL, BUT THE COMPONENTS MATTER
The FY2026 plan comprises approximately KRW100 trillion of shareholder returns, including at least KRW30 trillion of cash dividends and at least KRW60 trillion of share repurchases and cancellations. Those minimum components total KRW90 trillion, but they are explicitly lower bounds within an approximate overall objective. Their arithmetic does not establish an error in the headline target.
The previously announced KRW40 trillion repurchase is included in the annual plan. Management stated that purchases had been completed and cancellation would follow. The current board authorization adds KRW20 trillion of repurchases, but only KRW10 trillion is designated for cancellation. The remaining approximately KRW10 trillion is intended for executive and employee compensation and is excluded from the company’s shareholder-return calculation.
This distinction is economically material. The quarter’s announced cash outlay of KRW14 trillion in dividends plus KRW20 trillion in repurchases totals KRW34 trillion, but management correctly identifies only KRW24 trillion as shareholder returns. Shares acquired for compensation do not create the same permanent reduction in the share base as cancelled shares.
The compensation-related purchases also warrant separate scrutiny. They are a significant use of cash, but the purchase amount is not necessarily equal to current-period compensation expense. The call does not disclose the vesting schedule, award obligations, accounting treatment, or future share delivery needed to assess their full economic impact.
The Q3 dividend is KRW20,000 per share, comprising KRW10,000 linked to operating performance and KRW10,000 associated with Kioxia investment gains. Given the approximately KRW14 trillion total, the components are approximately KRW7 trillion each. The dividend implies roughly 700 million eligible shares, but this is a calculation from rounded disclosures, not a verified diluted share count.
The special dividend should not be annualized as recurring income. Management intends to distribute most of the Kioxia gains, with the remaining portion included in the year-end dividend after results are finalized. The total realized gain, associated taxes, cash proceeds, and remaining investment exposure were not fully reconciled in the call.
The commitment to return more than 50% of free cash flow is positive, but it does not provide a numerical free-cash-flow forecast. An approximately KRW100 trillion distribution objective and a payout ratio above 50% do not prove KRW200 trillion of annual free cash flow. Special investment distributions, timing, and the company’s precise FCF definition must be reconciled before deriving such a figure.
Management stated that the share price is “undervalued, not adequately reflecting our earnings and cash flow.” That explains the preference for cancellation, but it is not independent valuation evidence. Buybacks create value when executed below sustainable intrinsic value; they can destroy value when peak-cycle earnings are mistaken for a permanent earnings base.
SOLIDIGM IPO CANCELLATION
The decision to discontinue both pre-IPO and IPO reviews has competing implications. It avoids issuing ownership in a strategically relevant storage business at a valuation management considers unattractive and preserves SK hynix’s full participation in potential enterprise SSD growth. It also demonstrates willingness to defer a financing transaction rather than proceed solely to complete a previously considered plan.
However, the original rationale was to reduce SK hynix’s investment burden and increase capacity for shareholder returns. With that financing route suspended, a greater share of the funding requirement remains within the consolidated group unless alternative arrangements are secured. Given the scale of net cash, this is not an immediate financing concern, but it becomes more relevant alongside rising 2027 capex.
The appropriate conclusion is not that cancellation is inherently value-accretive. Its value depends on Solidigm’s prospective returns, the price at which external equity could have been issued, and the opportunity cost of internal capital. None of those variables was quantified sufficiently to establish a net valuation benefit.
LONGER-TERM DRAM TECHNOLOGY STRATEGY
Management’s decision to extend the 6F² platform before transitioning to 4F² or 3D DRAM reflects a commercially disciplined approach to technology migration. The company emphasized process maturity, manufacturing reliability, yield, and cost rather than treating the earliest introduction of a smaller cell structure as an objective in itself.
At an identical feature-size reference, moving from 6F² to 4F² reduces nominal cell area by 33.3%, equivalent to 50% more cells per unit of cell-array area. That does not translate directly into 50% more saleable bits per wafer. Peripheral circuitry, manufacturing complexity, reliability, process cost, and yield determine realized economics.
The near-term benefit of extending a proven platform is lower transition risk during a period when available capacity is highly valuable. The longer-term risk is that competitors commercialize a more scalable structure with superior cost or density. Management’s explanation is economically coherent, but the absence of dated commercialization milestones means the roadmap remains difficult to benchmark.
MARKET REACTION AND WHAT WAS ALREADY EXPECTED
The supplied Bloomberg notice reports a share-price increase of more than 8%, alongside a gain of more than 8% in Samsung Electronics and a 6% increase in the Kospi. The reaction was therefore not purely company-specific. Broad improvement in risk appetite and the AI trade contributed materially, and the available figures do not support a precise calculation of SK hynix’s abnormal return.
Investor commentary in the notice suggests that the approximately KRW100 trillion return package broadly met already elevated expectations. Strong earnings were also widely anticipated. The more differentiated information was the extension of demand visibility and the clearer description of contractual coverage.
This matters for the investment thesis. Repeating that profit and cash returns are unusually large does not establish incremental upside. Sustained outperformance requires evidence that earnings remain high for longer than expected, that HBM repricing improves economics, or that shareholder distributions exceed what is already reflected in valuation.
The reported recommendation distribution of 47 buys, 1 hold, and 0 sells indicates strongly positive sell-side sentiment. It is not proof of investor positioning, but it suggests limited visible analytical dissent. Against that backdrop, modest disappointments in pricing, contract conversion, or capex-adjusted cash flow could matter disproportionately.
VALUATION, SCENARIOS, AND INVESTMENT IMPLICATIONS
The central valuation question is whether SK hynix is becoming a more durable supplier of differentiated, contracted infrastructure components or remains primarily a cyclical producer experiencing an exceptional scarcity-driven earnings peak. The call supports movement toward the former, but it does not establish completion of that transition.
Annualizing Q3 produces approximately KRW418.46 trillion of revenue and KRW333.34 trillion of operating profit. Those figures describe the current quarterly pace, not a forecast. The sensitivity to margins remains substantial: at the same revenue level, a 60% operating margin would produce annualized operating profit of approximately KRW251.08 trillion, 24.7% below the Q3 annualized level despite still representing very high profitability.
At the quarterly level, every 10-percentage-point change in operating margin at current revenue equates to approximately KRW10.46 trillion of operating profit. Alternatively, a 10% revenue decline with unchanged absolute operating costs would reduce operating profit by approximately 12.6%. These sensitivities illustrate why stable physical demand can coexist with meaningful earnings volatility.
A useful 12-18-month scenario framework assigns a 50% probability to a base case in which HBM4 execution remains strong, contracted demand converts into shipments, and higher output offsets some margin normalization. Illustratively, a quarterly revenue level 25% above Q3 at a 72% operating margin would produce approximately KRW94.15 trillion of operating profit, 13.0% above Q3. This is a conditional operating scenario, not company guidance or a calendar-year forecast.
A 25% probability bull case assumes continued conventional memory tightness, successful HBM repricing, strong production execution, and no material delay in customer deployments. An illustrative quarterly revenue level 45% above Q3 at an 80% operating margin would produce approximately KRW121.35 trillion of operating profit, 45.6% above Q3. The key requirement is that expanded supply is absorbed without materially weakening realized pricing.
A 25% probability bear case assumes that customer deployment delays, lower requested memory content, competing supply, or price normalization outweigh volume growth. An illustrative quarterly revenue level 10% below Q3 at a 55% operating margin would produce approximately KRW51.78 trillion of operating profit, 37.9% below Q3. This scenario would not require the collapse of AI demand; a change in the balance between investment, deployment, and memory pricing could be sufficient.
The probabilities are analytical judgments with low-to-medium confidence because contract protections, product margins, customer concentration, and future investment requirements are incompletely disclosed. The scenarios describe operating outcomes, not equity returns. Valuation multiples, cash distributions, currency, and the entry price would determine shareholder returns.
The appropriate investment stance is to retain a constructive fundamental view while requiring valuation discipline for additional exposure. A standalone buy rating, price target, entry level, or position size cannot be established responsibly from the supplied materials because a verified current valuation, forward cash-flow reconciliation, and portfolio exposure set are absent.
Portfolio risk should nevertheless be classified explicitly. SK hynix adds exposure to AI infrastructure spending, memory pricing, Korean equities, currency translation, and long-duration capital investment. Its returns are likely to share important drivers with accelerator suppliers, other memory manufacturers, advanced packaging businesses, and semiconductor equipment companies. Contracted customer relationships may reduce company-specific demand volatility without reducing common AI-capex factor exposure.
CATALYSTS, MONITORING PRIORITIES, AND THESIS INVALIDATION
The immediate Q4 catalysts are delivery of the mid-20% DRAM shipment increase, the HBM4 crossover, M15X’s year-end capacity milestone, and the increase in 321-layer NAND mix above 50% of domestic capacity. These operating milestones should be evaluated together with ASP realization. Shipment growth accompanied by weaker pricing or adverse product economics would be less valuable than the headline volume result suggests.
The next financial catalysts are completion of announced share cancellations, disclosure of the remaining Kioxia-related special dividend, and a clearer 2027 capex and cash-flow framework. For 2027, the most important operating evidence will be realized HBM profitability under finalized contracts, the pace of Yongin ramp-up, and conversion of customer discussions into binding orders.
The principal thesis-invalidating developments would be cancellation or deferral of committed purchases without adequate economic protection; rising inventories despite stated excess demand; weaker HBM4 yields or customer qualification delays; conventional DRAM price declines that overwhelm HBM repricing; materially lower memory content per accelerator without offsetting system growth; or a sustained decline in cash generation after investment and compensation-related share purchases.
A further warning would be an expanding divergence between reported demand visibility and cash realization. Longer contract terms are valuable only if customers can fund deployments, receive usable capacity, and pay on economically attractive terms. The company’s strongest evidence of structural improvement will be resilient returns through a less favorable pricing environment, not simply another record during the current shortage.
The call therefore improves confidence in earnings duration more than it resolves terminal profitability. The most compelling investment case combines HBM execution, broader server-memory strength, credible customer commitments, disciplined production expansion, and tangible cash returns. The principal risk is capitalizing today’s exceptional scarcity economics as though they were permanently guaranteed.
SOURCE BASIS
The analysis uses the supplied Q3 2026 initial draft earnings-call transcript and Bloomberg earnings notice; SK hynix’s official Q3 2026 financial-results release dated October 28, 2026; its Q2 release dated July 29, 2026; its Q1 release dated April 23, 2026; and its October 2026 OCP Global Summit technology disclosures. Prior-guidance comparisons are limited to statements recoverable from those official releases and the current call. A complete independently verified prior-quarter call transcript was unavailable, so unconfirmed prior shipment and capex figures have not been treated as established guidance.
COMPANY EMPLOYEES ON THE CALL
• Kwak Noh Jung, President and Chief Executive Officer. • Woo Hyun Kim, Vice President, Chief Financial Officer and Head of Finance. • Seong Hwan Park, Head of Investor Relations. • Park Joon-duk, Head of DRAM Marketing. • Song Chang-Seok, Head of NAND Marketing. • Kim Ki-Tae, Head of HBM Sales and Marketing.
Several management answers were attributed to an unidentified speaker in the draft transcript and cannot be assigned reliably to a named employee.
RESEARCH ANALYSTS ON THE CALL
• Peter Lee, Citigroup. • Sunwoo Kim, Meritz Securities. • Junhee Lee, Goldman Sachs, identified by the operator during the LTA question. • Simon Woo, Bank of America. • Ye-Hyun Kwon, J.P. Morgan. • Dong-Hee Han, SK Securities. • Youngjun Kim, Mirae Asset Securities. • Young-ho Ryu, NH Investment & Securities.
Key Read-Throughs
KEY READ-THROUGHS FROM SK HYNIX’S Q3 2026 EARNINGS CALL
The strongest cross-market implication is a redistribution of economic value toward memory manufacturers and the equipment suppliers that enable their expansion, with offsetting pressure on hardware buyers and cloud infrastructure economics. The call indicates that scarcity extends beyond HBM into conventional server DRAM and enterprise NAND, while customer commitments are lengthening faster than qualified production capacity can expand. The most actionable near-term signals concern Sandisk and Kioxia ahead of their October 29 and October 30 results, respectively, and Microsoft’s October 28 reporting of infrastructure spending and cash conversion. Longer-duration implications favor advanced memory manufacturing, EUV lithography, and TSMC’s increasing logic content within HBM. These are high-conviction assessments of specific economic channels, not predictions that every affected stock will outperform or underperform. Magnitudes refer to business exposure rather than forecast share-price changes.
DRAM: CONVENTIONAL SERVER MEMORY PROVIDES A PROFIT ENGINE BEYOND HBM LEADERSHIP (READ-THROUGH 1)
Affected companies: Micron Technology (MU: United States); Samsung Electronics (005930: South Korea). Direction: positive. Magnitude: high for Micron and Samsung’s memory operations; positive but less direct at Samsung’s consolidated level because its other businesses have different economics.
Call evidence: SK hynix reported approximately 10% sequential DRAM bit growth, more than 40% growth in server DDR5 shipments, and a high-20% increase in blended DRAM ASP. Management attributed pricing strength to both conventional DRAM and a larger HBM4 contribution. It also expects 2027 HBM pricing to narrow the profitability gap with conventional DRAM, suggesting that the current profit opportunity is not confined to the most technically differentiated HBM products.
The transmission mechanism is industry-wide pricing and capacity allocation. HBM consumes substantial wafer and backend resources, while AI servers also require conventional DRAM. When conventional server demand expands faster than available supply, producers can earn substantial incremental profit from existing qualified products without first gaining additional HBM share. This is particularly important for evaluating Samsung: its conventional memory exposure can generate significant earnings benefits independently of the timing and profitability of individual HBM qualifications. Micron benefits through both conventional DRAM and HBM rather than depending on a single product transition.
The less obvious implication is that superior HBM positioning and superior near-term memory profitability need not be identical investment exposures. Scarcity in conventional DRAM can temporarily produce exceptionally attractive returns on manufacturing resources. The call therefore weakens an overly narrow framework that ranks all memory equities solely by HBM market share. It does not establish that Micron or Samsung will reproduce SK hynix’s ASP growth or operating margin, which incorporate different product mixes, customer agreements, costs, and yields.
Contract coverage adds support to the duration argument. SK hynix has signed agreements covering more than 50% of capacity for 2027 and 2028, with additional customer purchasing discussions supporting its broader “effectively sold out” characterization through 2029. This corroborates Micron’s already-disclosed emphasis on strategic customer agreements, rather than revealing a previously unknown business model. It does not establish identical contractual protections across producers.
Near-term catalyst: late-2026 pricing commentary, server-memory shipment realization, and customer-contract disclosures. Micron had already reported on September 30, while Samsung had already issued preliminary Q3 earnings guidance on October 8. The incremental information is therefore principally about earnings durability and future product economics, not discovery of an unreported industry profit surge. Longer term, the positive read-through depends on committed demand absorbing additional supply without substantial price concessions.
NAND AND ENTERPRISE SSDs: AI STORAGE DEMAND IS BECOMING LESS DEPENDENT ON CONSUMER DEVICES (READ-THROUGH 2)
Affected companies: Sandisk (SNDK: United States); Kioxia Holdings (285A: Japan). Direction: positive. Magnitude: high because NAND is central to both businesses; the enterprise SSD opportunity remains dependent on each company’s qualifications, controllers, firmware, and product mix.
Call evidence: SK hynix’s NAND ASP increased by a mid-20% rate despite slightly lower bit shipments. Management plans mid-single-digit sequential bit growth in Q4 and more than 50% of domestic production capacity on its 321-layer process. It also stated that SSDs are already being used in some AI systems to offload KV cache and expects their role to expand into a shared “context memory tier.”
The immediate transmission mechanism is higher NAND revenue realization and a richer enterprise mix. The important signal is that strong earnings can be generated even without rapid bit-volume growth. This is favorable for producers operating within constrained qualified capacity, because the marginal benefit of higher prices can exceed the contribution from additional low-value shipments. Sandisk and Kioxia are direct NAND exposures, rather than generic storage proxies.
The longer-duration mechanism is more distinctive. Agentic workloads and reusable context create a reason to retain data that would otherwise be recomputed, discarded, or held exclusively in more expensive memory. SSDs can supply capacity beneath HBM and DRAM, increasing NAND’s role in inference infrastructure. This broadens the demand base beyond smartphones, PCs, and traditional storage replacement cycles.
The high-conviction conclusion is that inference adds an incremental enterprise NAND use case. It is not that SSDs replace HBM indiscriminately or that every additional byte stored generates an equivalent profit contribution. Access latency, endurance, cache reuse, prefetch accuracy, and software integration determine whether an SSD-based architecture improves service economics. SK hynix’s technology demonstrations do not establish a design win for Sandisk or Kioxia, but the underlying storage requirement is relevant to their qualified enterprise portfolios.
Near-term catalysts are unusually clear: Sandisk’s fiscal Q1 2027 results on October 29 and Kioxia’s fiscal Q2 2026 results on October 30. SK hynix’s commentary provides a positive industry pricing and demand signal immediately before those releases. It does not prove that either company will exceed consensus, particularly where strong pricing is already embedded in guidance.
The principal counterweight is future supply. Kioxia and Sandisk announced anticipated investment exceeding $31 billion in Japan through 2032, contingent on government support. That expansion should not be treated as immediately available capacity, but it prevents treating shortages through 2030 as guaranteed. Their shared Japanese manufacturing footprint also means that owning both companies provides less production and geographic diversification than the separate listings might suggest.
PC HARDWARE: MEMORY INFLATION CAN SUPPORT REPORTED REVENUE WHILE ERODING UNITS AND PROFITABILITY (READ-THROUGH 3)
Affected company: HP Inc. (HPQ: United States). Direction: negative for Personal Systems margins and unit demand. Magnitude: high at the PC segment level and material at the consolidated level, partly moderated by Printing and mitigation actions.
Call evidence: SK hynix explicitly expects PC and mobile shipments to decline because of “cost burdens from rising memory prices and supply shortages.” The company is simultaneously prioritizing server-oriented DRAM and enterprise SSDs, while committing substantial future capacity to long-term customer agreements.
The transmission mechanism has 2 distinct branches. If HP absorbs higher memory and storage costs, gross profit per device declines. If those costs are passed through, selling prices rise but affordability worsens, increasing the risk of delayed purchases, lower specifications, or substitution toward less expensive devices. Strong nominal revenue can therefore coexist with weaker physical demand and deteriorating operating economics.
HP’s already-reported fiscal Q3 results demonstrate this distinction. Personal Systems revenue increased 18% year over year, while total units declined 16% and operating margin was 4.6%. SK hynix’s call corroborates the persistence of the underlying cost-and-volume pressure; it is not a prediction of those completed results. At a 4.6% operating margin, an illustrative 100-basis-point margin decline would reduce segment operating profit by approximately 22% at unchanged revenue. This demonstrates sensitivity, not a forecast of an additional margin decline.
The non-consensus risk is that AI-PC mix improvement may not offset the economics of more expensive memory. Premium products can support selling prices, but additional memory content also increases dollar exposure to scarce components. A richer mix is beneficial only if pricing and customer willingness to pay exceed the associated cost increase.
The shortage conclusion must also be company-specific. HP previously reported improved memory supply and higher fulfillment rates. That counterevidence argues against assuming an immediate inability to ship. The stronger negative read-through is continued input-cost pressure and demand elasticity, not a proven new procurement failure.
Near-term catalyst: HP’s fiscal Q4 2026 results and subsequent fiscal 2027 commentary on units, pricing, Personal Systems margins, and inventory. Longer term, sustained allocation of memory capacity toward AI infrastructure could leave price-sensitive consumer hardware facing a persistently higher cost base. This is a direct cross-portfolio offset to the positive memory-producer exposure.
CLOUD INFRASTRUCTURE: HIGHER CAPEX CAN REFLECT COMPONENT INFLATION RATHER THAN PROPORTIONATE COMPUTE EXPANSION (READ-THROUGH 4)
Affected company: Microsoft (MSFT: United States). Direction: negative for the cost of adding infrastructure and cash conversion, all else equal. Magnitude: material for incremental investment economics; less immediate and less certain for consolidated EPS.
Call evidence: SK hynix reported high-20% DRAM ASP growth, mid-20% NAND ASP growth, and finalized 2027 HBM negotiations that reflect increased HBM4 product value. Management also cited expectations for more than 60% growth in global CSP capex in 2027, while acknowledging persistent memory shortages.
The key transmission mechanism is that higher supplier prices increase the capital required to deploy a given hardware configuration. Microsoft purchases that exposure directly or through accelerators, servers, and storage systems. A larger capex budget therefore need not translate into an equivalent increase in installed compute, usable memory capacity, or revenue-generating infrastructure. Memory suppliers can capture more economic value even while cloud providers continue to grow rapidly.
This channel is already visible in Microsoft’s own disclosures. Its July earnings call stated that quarterly capital expenditures of approximately $41 billion included higher component pricing. Cash paid for property and equipment was $35.8 billion, while operating cash flow was $55.4 billion and free cash flow was $19.6 billion. SK hynix’s subsequent pricing commentary supports persistence of the cost pressure, rather than introducing an entirely new risk.
The accounting timing matters. Higher purchased equipment costs first affect cash investment and the capitalized asset base. Depreciation affects earnings over time. Finance leases introduce a different cash-payment schedule and should not be treated as identical to current cash purchases. Consequently, near-term EPS resilience would not disprove deterioration in the cash cost of expanding capacity.
Long-term memory commitments can improve supply security but reduce procurement flexibility. Deposits may also transfer some financing burden toward buyers. However, SK hynix did not identify Microsoft as a party to a specific deposit-bearing agreement, so no company-specific prepayment obligation can be inferred.
The immediate catalyst is Microsoft’s October 28 fiscal Q1 2027 earnings release. The most informative comparison is between capital spending, deployed capacity, Azure growth, and cash conversion. An increase in nominal investment without a commensurate increase in usable capacity would reinforce the negative read-through.
This is not a high-conviction bearish conclusion on Microsoft’s total earnings. Better utilization, faster revenue growth, improved hardware performance, and lower inference cost per unit can offset higher component prices. The high-conviction conclusion is narrower: supplier pricing creates an additional investment hurdle, and rising AI capex should not automatically be interpreted as proportionate growth in physical infrastructure or economic returns.
SEMICONDUCTOR EQUIPMENT: PROCESS COMPLEXITY SUPPORTS SPENDING EVEN WHEN BIT GROWTH IS CONSTRAINED (READ-THROUGH 5)
Affected company: Lam Research (LRCX: United States). Direction: positive. Magnitude: high within memory-related equipment demand and material for the company, although the call does not quantify Lam’s share of SK hynix’s spending.
Call evidence: SK hynix expects 2027 capex to “increase significantly” and is accelerating leading-edge DRAM production, the 321-layer NAND transition, and new-fab infrastructure. Management emphasized that “more investment or more fabs does not necessarily mean more supply,” because increasingly complex processes and high-performance products require more resources while incremental bit output becomes harder to obtain.
The transmission mechanism is greater manufacturing investment per unit of productive memory capacity. Lam’s etch and deposition exposure benefits from more demanding structures, additional process requirements, and technology conversions. Increasing NAND layer counts and more complex DRAM manufacturing can support equipment spending without requiring a proportionate increase in wafer starts or industry bit shipments.
This distinction creates an important cross-sector asymmetry. Memory suppliers can remain supply-constrained and retain pricing power while equipment suppliers receive higher spending. A conventional framework in which rising equipment investment immediately signals damaging memory oversupply is therefore incomplete. More of the investment may be required merely to maintain technological competitiveness and produce the next generation economically.
The magnitude is meaningful, but the revenue timing cannot be assigned directly from the capex headline. Shell construction and utility infrastructure do not immediately become Lam revenue. Tools must be ordered, delivered, installed, and, where required, accepted. Some equipment supporting Q4 memory output will already have been ordered or shipped. The current 321-layer production ramp is therefore partly validation of earlier investment, not necessarily a new order catalyst.
Lam reported its September quarter on October 21, before this call. SK hynix’s commentary corroborates the customer spending environment underlying Lam’s already-reported performance and strengthens the case for continued 2027 demand. It should not be presented as a new forecast of an already-completed Lam quarter.
Near-term catalysts are incremental equipment orders, delivery schedules, and customer technology-conversion plans through late 2026 and 2027. The longer-duration positive is rising process intensity. The main risk is that customers complete buildings but defer equipment installation, which SK hynix explicitly retains the flexibility to do. No specific tool award or vendor allocation was disclosed.
LITHOGRAPHY: EXTENDING THE EXISTING DRAM CELL PLATFORM REINFORCES EUV’S RELEVANCE (READ-THROUGH 6)
Affected company: ASML Holding (ASML: Netherlands). Direction: positive. Magnitude: high for advanced-memory lithography demand and moderate at the consolidated level, where logic customers remain important.
Call evidence: SK hynix plans to maximize the useful life of its existing 6F² DRAM platform through “EUV-based scaling and process innovation” before transitioning to 4F² or 3D DRAM when those alternatives are technologically and economically ready. The company is also expanding its 1c process and expects significantly higher investment in 2027.
The transmission mechanism is continued demand for advanced lithography to extend a qualified manufacturing platform. A delayed transition to a radically different cell structure does not imply delayed technological spending. It can instead require further patterning sophistication, tighter process control, and investment in tools and productivity upgrades that allow the incumbent platform to remain competitive.
The less obvious implication is that process migration can support ASML even when the memory industry is cautious about committing to an unproven architecture. SK hynix is choosing to invest in a known platform with established reliability and yields rather than wait for a more disruptive technology. That is supportive of the durability of advanced lithography demand.
The call does not specify EUV layer counts, scanner orders, system models, or High-NA adoption. It therefore supports ASML’s broad advanced-memory exposure, not a quantified High-NA revenue forecast or a particular equipment order.
ASML had already reported on October 14 that planned supply for 2027 and 2028 would not fully meet customer demand. SK hynix’s investment and scaling commentary provides customer-side corroboration of that outlook. The immediate effect is greater confidence in demand duration and order conversion rather than evidence that ASML can ship above its own production constraints.
Near-term catalysts are memory-related order conversion, upgrades, and confirmed installation schedules into 2027. The longer-duration benefit is continued lithography intensity as conventional DRAM scaling becomes more difficult. The cross-portfolio constraint is that scarce equipment can support ASML’s demand visibility while also delaying customers’ physical capacity expansion. Equipment demand, equipment shipments, and memory bit output should not be assumed to grow simultaneously.
FOUNDRY AND ADVANCED PACKAGING: HBM4 CREATES ADDITIONAL LOGIC CONTENT FOR TSMC (READ-THROUGH 7)
Affected company: Taiwan Semiconductor Manufacturing Company (2330: Taiwan). Direction: positive. Magnitude: modest for near-term consolidated revenue, but strategically meaningful within the AI manufacturing chain.
Call evidence: SK hynix expects HBM4 to overtake HBM3E in shipment volume and revenue during Q4 and is working with customers on custom HBM. Management also stated that supplying the same bit volume with shorter stacks requires more cubes, increasing requirements for base dies and backend processing.
The supplier relationship is established independently of the earnings call. SK hynix has publicly identified TSMC’s advanced logic processes as the basis for its base dies beginning with HBM4. The earnings call therefore moves that relationship further from a development roadmap toward meaningful production scale.
The direct transmission mechanism is foundry content inside the memory stack. TSMC participates not only in the accelerator or CPU but also in logic supporting HBM. As HBM4 replaces HBM3E, the relevant revenue opportunity grows through generation mix, even before assuming additional accelerator units. Custom HBM can deepen this relationship by embedding more customer-specific functionality in the memory subsystem.
Shorter stacks create a further, conditional content opportunity. At unchanged die density and aggregate delivered bit volume, moving from 12-high to 8-high requires 50% more cubes and corresponding base dies. That arithmetic does not establish a 50% increase in TSMC revenue: higher memory density, different die sizes, foundry yields, pricing, and customer allocations can change the outcome. The high-conviction conclusion is that lower stack height does not automatically reduce foundry or backend requirements in proportion to the number of stacked memory dies.
Near-term catalysts are the Q4 HBM4 crossover and the 2027 production ramp. Longer term, custom base dies increase the integration of logic, memory, and packaging and can strengthen TSMC’s role across successive platform generations.
The cross-portfolio implication is that multiple memory suppliers do not necessarily eliminate common foundry and packaging bottlenecks. Diversification across memory equities can coexist with shared dependence on the same logic-manufacturing ecosystem. This is a positive content opportunity for TSMC, but also a source of correlated execution risk across the AI supply chain.
AI ACCELERATORS: HBM4 EXECUTION REDUCES A SPECIFIC PLATFORM-RAMP RISK WITHOUT PROVING MORE GPU UNITS (READ-THROUGH 8)
Affected company: NVIDIA (NVDA: United States). Direction: positive for platform supply readiness. Magnitude: potentially high for the relevant product ramp, but not directly quantifiable at the consolidated earnings level.
Call evidence: SK hynix stated that HBM4 production is proceeding without disruption, yields have exceeded the original plan, and 12-high shipments are progressing according to agreed customer schedules. M15X is being accelerated toward full capacity by year-end, and HBM4 should exceed HBM3E in both shipment volume and revenue during Q4.
The NVIDIA relationship is supported by SK hynix’s public disclosures linking HBM4 and SOCAMM2 with the Vera Rubin platform. Better qualified output from a key memory supplier reduces the probability that memory availability becomes the binding constraint on assembling and shipping complete accelerator systems.
The transmission mechanism is delivery reliability rather than automatic demand creation. An accelerator cannot be monetized as a complete product without the required memory and packaging. Higher end-to-end HBM yields increase saleable output from constrained resources and can reduce schedule risk for the associated platform. This is more useful evidence than a generic statement that AI demand remains strong.
The call is not sufficient to translate SK hynix’s DRAM shipment growth into NVIDIA GPU-unit growth. The DRAM figure includes conventional products, HBM capacity per accelerator changes across generations, and lower-stack configurations alter the relationship among bits, cubes, and systems. Customer allocation is also undisclosed. Memory-bit growth is therefore not a reliable standalone GPU shipment estimator.
The positive supply signal has an offsetting cost implication. SK hynix expects higher HBM4 value realization and has finalized 2027 pricing with major customers. More reliable memory availability can help NVIDIA ship systems while simultaneously increasing component costs. The net margin effect depends on NVIDIA’s system pricing, product mix, procurement terms, and the extent to which higher hardware costs are passed to customers.
Near-term catalysts are Q4 2026 delivery milestones and evidence that HBM4 availability translates into complete system shipments. Longer term, deeper collaboration on custom memory can strengthen platform performance and supply coordination. The remaining risks are outside the narrow improvement demonstrated here: logic availability, advanced packaging, networking, power, cooling, and customer deployment readiness. SK hynix’s call reduces a specific memory-ramp risk; it does not validate the entire AI infrastructure delivery chain.
Report record
- Sector
- Information Technology
- Industry
- Semiconductors & Semiconductor Equipment
- Fiscal period end
- September 30, 2026
- Report date
- October 27, 2026
- Analysis
- 6442 words
- Read-throughs
- 3275 words
- Content fingerprint (PDF)
9639751d721f- Content fingerprint (analysis)
3ea57e2166f6- Content fingerprint (read-throughs)
81a7e49b3a86
Prepared from the company's earnings release and earnings call transcript. Figures as reported by the company. For information only. Not investment advice.
More from SK Hynix Inc
No other reports yet.
More in Information Technology
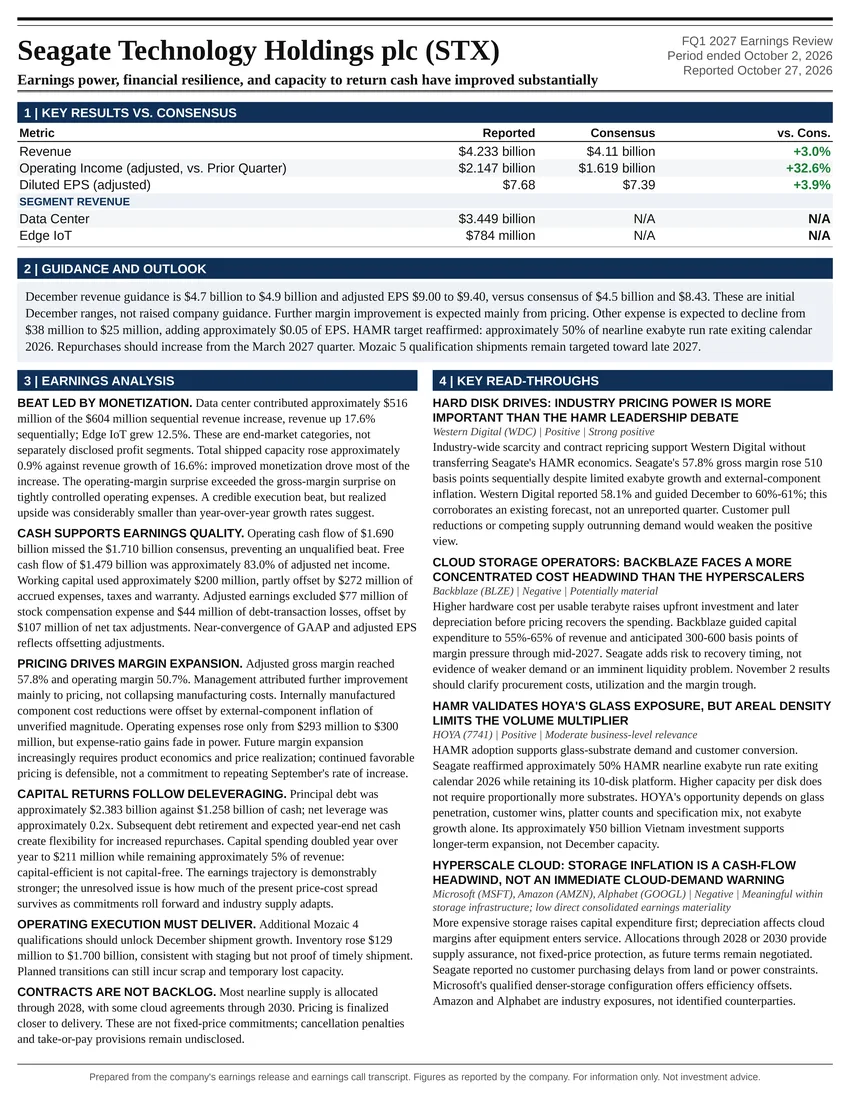
Earnings power, financial resilience, and capacity to return cash have improved substantially
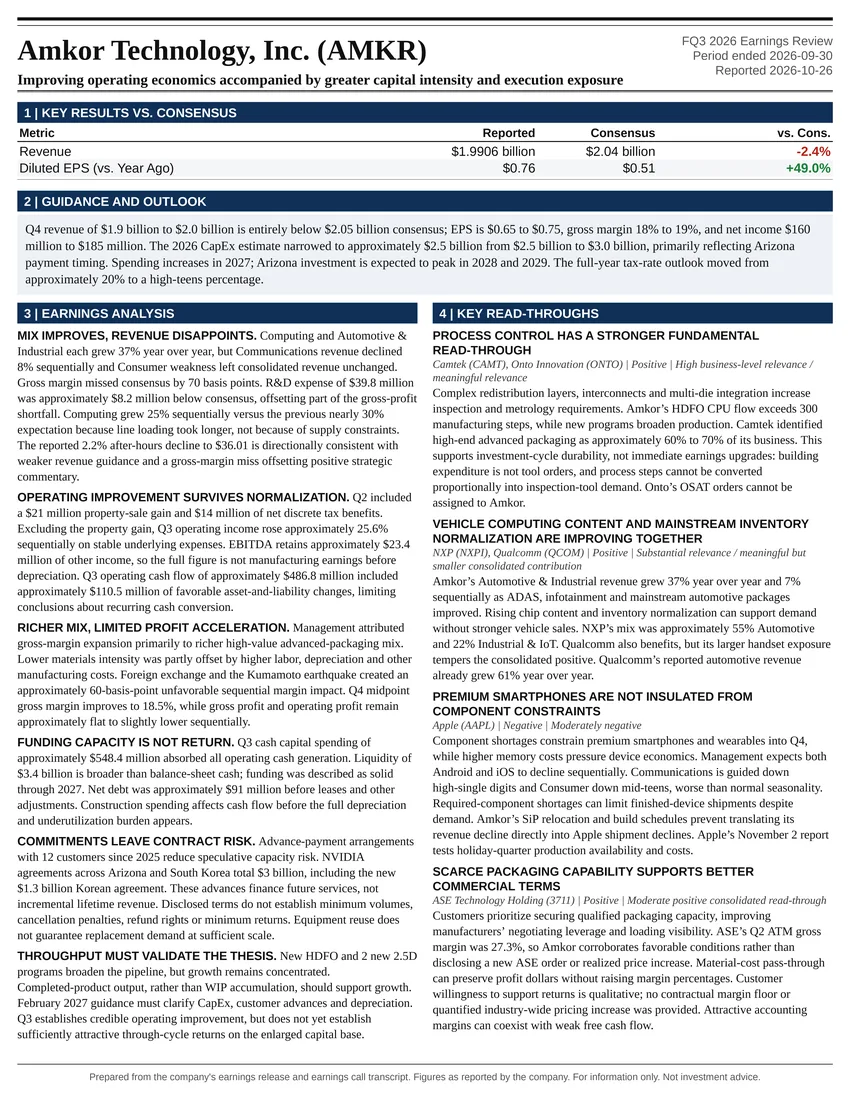
Improving operating economics accompanied by greater capital intensity and execution exposure
All Information Technology reports
Follow @AtlasPeakRes on X for new earnings reports as they publish.