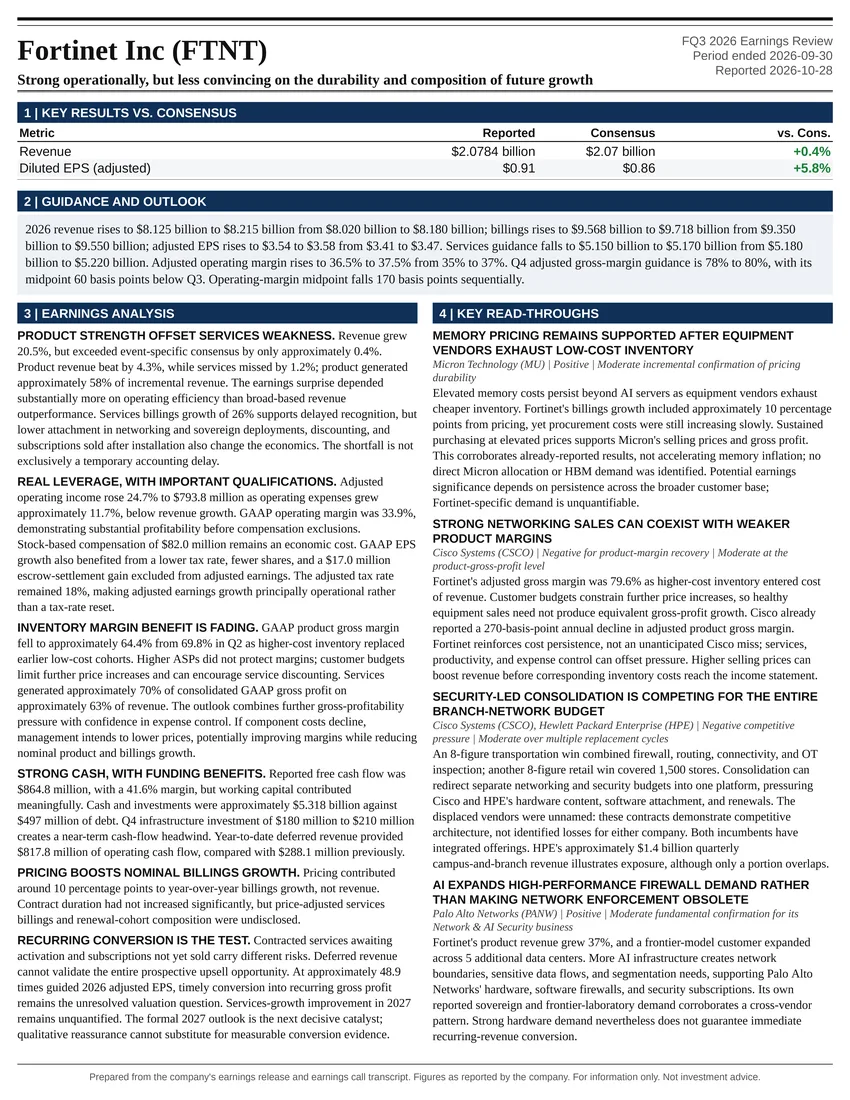
Strong operationally, but less convincing on the durability and composition of future growth
Earnings Reports
Universal Display Corporation FQ3 2026 Earnings Report
Universal Display Corporation (OLED) FQ3 2026 earnings: Financial resilience, but not yet a high-confidence earnings inflection. Full earnings analysis, key read-throughs, and the one-page exhibit from Atlas Peak Research.
Universal Display Corporation (OLED)
Sector: Information Technology · FQ3 2026 · Period end September 30, 2026 · Reported October 28, 2026
Universal Display’s third-quarter results support a cautious, neutral investment stance. OLED adoption continues to broaden, material shipment volumes improved, and the company retains substantial financial flexibility. However, the quarter did not establish a durable recovery in underlying profitability.
Download the one-page report (PDF)
View one-page exhibit
Download analysis (.md)
Download read-throughs (.md)
Post to X
One-Page Exhibit
Earnings Analysis
EXECUTIVE CALL SUMMARY: Universal Display Corporation (10/28/26)
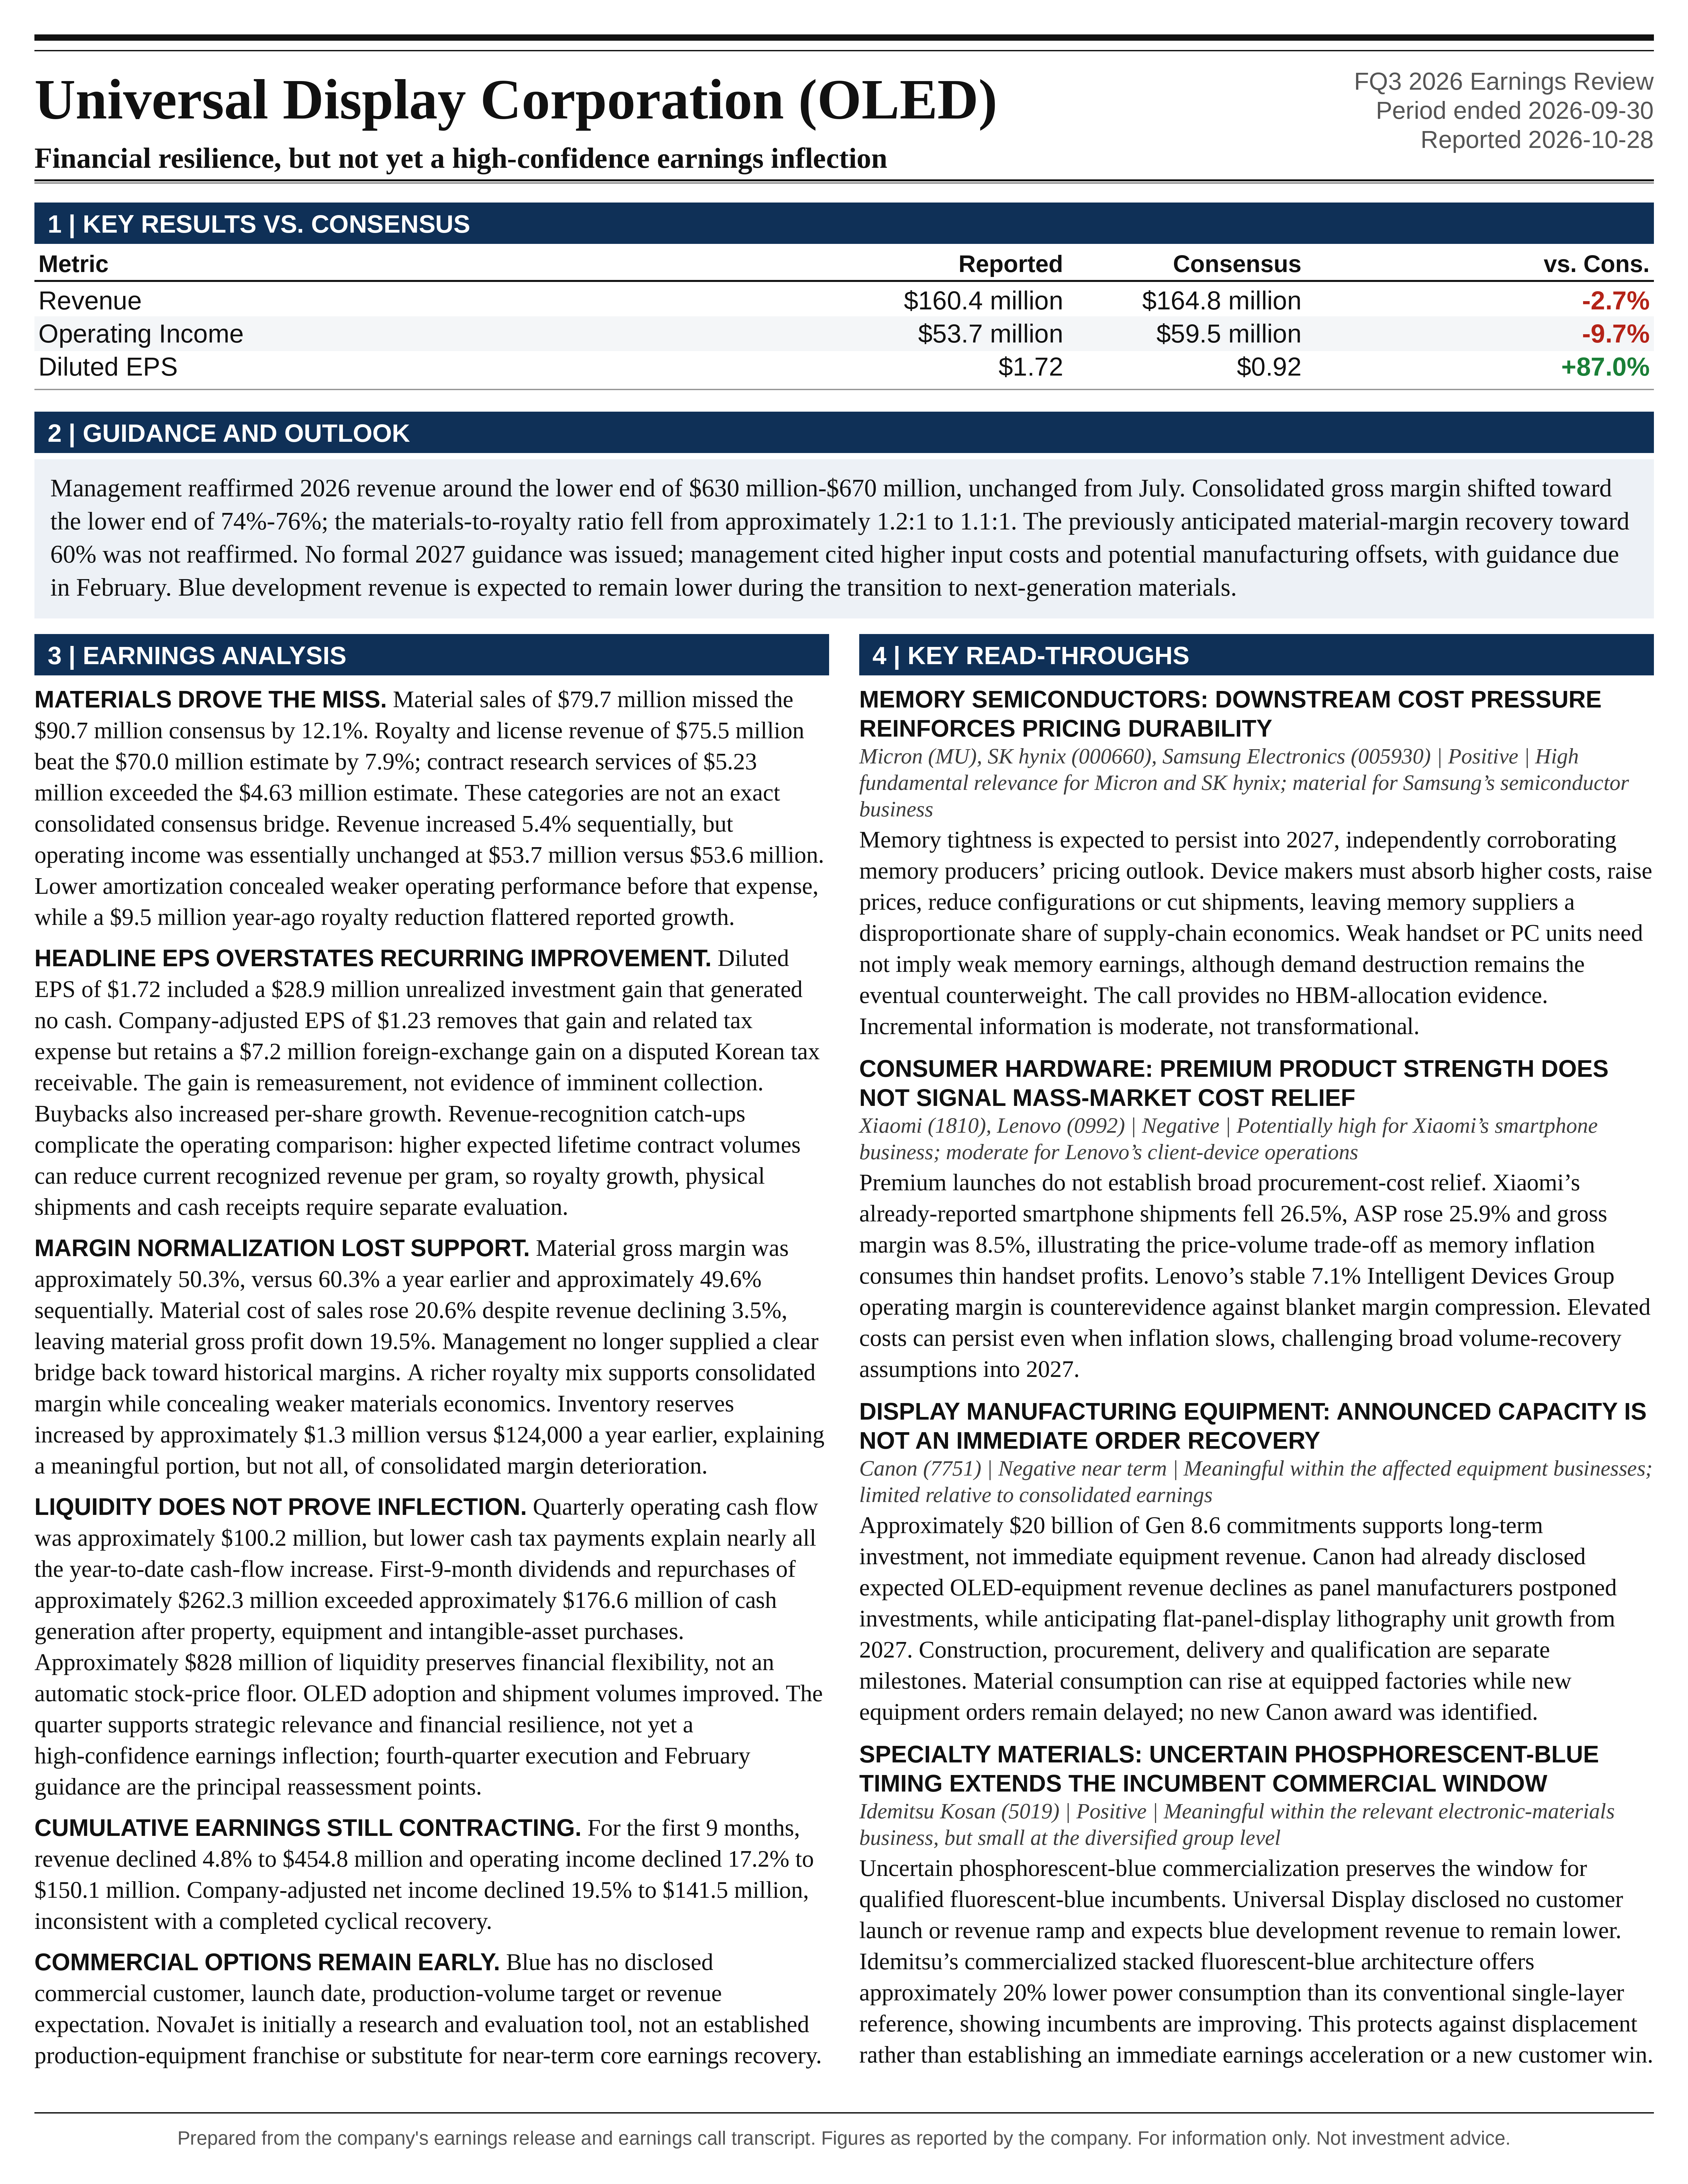
Universal Display’s third-quarter results support a cautious, neutral investment stance. OLED adoption continues to broaden, material shipment volumes improved, and the company retains substantial financial flexibility. However, the quarter did not establish a durable recovery in underlying profitability. Revenue and operating income missed Bloomberg consensus, material gross margin remained approximately 50% for a second consecutive quarter, and management introduced a more explicitly adverse margin outlook for 2027. The headline increase in diluted EPS to $1.72 substantially overstates the improvement in recurring earnings because it includes a large unrealized investment gain and a favorable foreign-exchange remeasurement.
Revenue of $160.4 million increased 14.9% year over year but missed consensus by 2.7%. Operating income of $53.7 million increased 24.5% but missed consensus by 9.7%. The apparent operating recovery requires qualification: the prior-year quarter included a $9.5 million reduction in royalty revenue, while the current quarter experienced an unfavorable $4.8 million year-over-year change in cumulative revenue-recognition adjustments. Removing these disclosed accounting effects from both periods, while holding expenses unchanged, produces approximately 10.9% revenue growth and 11.4% operating-income growth. That represents genuine improvement, but substantially less acceleration than the reported figures suggest.
The most consequential change in the call was not the revenue outlook, which remained consistent with July, but the reduced confidence in margin normalization. Management maintained its expectation that 2026 revenue would finish around the lower end of $630 million to $670 million. It also shifted expected consolidated gross margin toward the lower end of 74%-76%, lowered the expected materials-to-royalty revenue ratio from approximately 1.2:1 to 1.1:1, and declined to reaffirm the previously anticipated recovery in material gross margin toward 60%. For 2027, the CFO stated that “there are a number of pressures that we are facing on the gross margin side,” including higher input costs.
The positive investment case remains rooted in larger OLED display area, expanding IT penetration, customer capacity investment, and the possibility of commercial adoption of phosphorescent blue and additional proprietary technologies. The negative case is that these opportunities are arriving more slowly than expected while customer mix, manufacturing costs, and revenue-recognition estimates dilute their near-term earnings contribution. The quarter therefore strengthens the distinction between a credible long-term technology franchise and an insufficiently demonstrated near-term earnings acceleration.
QUARTERLY PERFORMANCE AND THE QUALITY OF THE RECOVERY
The revenue shortfall was concentrated in materials. Material sales of $79.7 million were 12.1% below the $90.7 million Bloomberg consensus estimate. Royalty and license revenue of $75.5 million exceeded the $70.0 million estimate by 7.9%, while contract research services revenue of $5.23 million exceeded the $4.63 million estimate by 12.9%. The stronger royalty and services results partially offset an approximately $11.0 million materials shortfall. These category-level estimates should not be treated as an exact consolidated bridge because their sum differs modestly from the separately reported total-revenue consensus.
The earnings disappointment was more pronounced than the revenue disappointment. Reported financial statements imply a consolidated gross margin of approximately 73.1%, compared with the 75.3% Bloomberg estimate. Actual operating margin was 33.5%, compared with approximately 36.1% implied by consensus revenue and operating income. Applying the consensus gross margin to consensus revenue produces expected gross profit of approximately $124.1 million, versus actual gross profit of $117.4 million. Operating expenses were modestly below the corresponding implied consensus level, but this was insufficient to offset the gross-profit shortfall. The gross-margin consensus was based on only 2 estimates, making its precision less robust than a broadly populated consensus measure.
Sequential performance was less encouraging than the year-over-year comparison. Revenue increased 5.4% from $152.2 million in the second quarter, but operating income was essentially unchanged at $53.7 million versus $53.6 million. Gross profit increased only approximately $2.0 million, while operating expenses increased approximately $1.9 million. The revenue recovery therefore produced almost no incremental operating profit.
The sequential result also benefited from lower amortization. Amortization of acquired technology and other intangible assets fell to $3.4 million from $5.7 million in the second quarter. Operating income before this amortization declined from approximately $59.4 million to $57.1 million. This is not a substitute for GAAP operating income, but it demonstrates that flat reported operating profit concealed a weaker result before an accounting expense that declined following the completion of BASF patent-portfolio amortization in June 2026.
The longer historical comparison remains restrained. Third-quarter revenue was slightly below the $161.6 million generated in the third quarter of 2024, while operating income remained approximately 20% below that period’s $67.0 million. The current quarter is therefore better characterized as a recovery from a depressed comparison than a new earnings peak. For the first 9 months of 2026, revenue declined 4.8% to $454.8 million, operating income declined 17.2% to $150.1 million, and company-adjusted net income declined 19.5% to $141.5 million. These cumulative figures remain more consistent with an earnings contraction than with a completed cyclical recovery.
REVENUE RECOGNITION, VOLUME, AND CUSTOMER MIX
The royalty result was strong, but the comparison was unusually favorable. Royalty and license revenue increased 41.6% from $53.3 million to $75.5 million. Adding back the prior-year $9.5 million out-of-period reduction raises the comparison base to $62.8 million, reducing the growth rate to approximately 20.2%. That remains a meaningful increase and supports management’s assertion that higher material volumes and customer mix contributed positively. It does not support treating the entire reported 42% increase as a recurring demand-growth rate.
The quarterly filing provides an important distinction between the $4.8 million year-over-year adjustment swing and the actual adjustment recorded this quarter. The current quarter included a $3.5 million reduction in revenue from cumulative catch-up adjustments, compared with a $1.3 million increase in the prior-year quarter. Excluding these adjustments and the separate prior-year out-of-period item produces revenue of approximately $163.9 million versus $147.8 million. On the same analytical basis, operating income would be approximately $57.2 million versus $51.3 million, with operating margins of approximately 34.9% and 34.7%, respectively. The accounting-adjusted comparison indicates moderate growth with broadly stable operating profitability, not a substantial underlying margin expansion.
These catch-up adjustments should not be interpreted as ordinary changes in customer purchase prices. Certain revenue streams are recognized using estimated per-unit economics over the remaining lives of customer contracts. Changes in expected lifetime shipment volumes or product mix can alter the amount of revenue allocated to units already delivered. The current filing states that the negative quarterly adjustment reflected product-mix changes and higher anticipated demand under certain contracts. Higher expected future volumes can therefore reduce current recognized revenue per gram, even while improving the physical demand outlook.
The reverse mechanism was visible earlier in 2026. The second-quarter release attributed a favorable royalty adjustment partly to lower anticipated demand over the remaining lives of certain contracts, which increased the estimated average royalty and license fee per gram. Consequently, favorable royalty accounting can coexist with weaker demand expectations, and unfavorable accounting can coexist with stronger expectations. Reported royalty growth, material revenue, physical shipment volume, and contract cash receipts must therefore be evaluated separately.
Management’s pricing explanation was relatively specific. Millard stated that “customers that have more volume you would expect to have better pricing,” and attributed the remaining divergence between volume growth and revenue growth to customer mix after accounting for catch-up adjustments. On the July call, management had also stated that contractual ASPs were generally consistent and that nothing unusual had occurred on pricing. The evidence therefore supports deterioration in blended realization rather than a demonstrated broad-based repricing of existing contracts. Economically, however, a persistent shift toward lower-priced customers can still constrain revenue and margins even without explicit price concessions.
The geographic disclosures show that growth was uneven. Revenue attributed to China increased approximately 63% to $52.4 million, while South Korean revenue declined approximately 1.8% to $101.3 million. China represented approximately 32.7% of quarterly revenue. These figures describe customer geography, not final consumer demand, and cannot establish which specific customers caused the margin changes. They nevertheless demonstrate that the recovery was not uniform across the customer base.
Customer concentration remains material. The quarterly filing identifies customers representing 45%, 23%, and 14% of revenue, or 82% collectively. Expanding end-market applications therefore does not yet imply a comparably diversified direct-customer base. A small number of panel manufacturers retain substantial influence over shipment timing, product qualification, contract economics, and the distribution of growth.
MATERIAL MARGINS AND THE FAILURE OF EXPECTED NORMALIZATION
Material gross margin was approximately 50.3%, compared with 60.3% a year earlier and approximately 49.6% in the second quarter. Material revenue declined 3.5% year over year, but material cost of sales increased 20.6%, from $32.8 million to $39.6 million. Material gross profit consequently declined 19.5%, from $49.8 million to $40.1 million. This is the clearest evidence that higher physical shipment volumes did not translate into stronger materials profitability.
The magnitude of the deterioration is economically significant. At a 60% material gross margin, current-quarter material revenue would have generated approximately $47.8 million of gross profit, about $7.7 million above the reported result. This is a sensitivity rather than a recoverable earnings forecast, because recognized revenue, product mix, customer mix, and manufacturing costs can all change. Nevertheless, the gap exceeds the approximately $5.8 million operating-income shortfall against consensus.
The current call materially weakened the previous recovery narrative. In July, management had stated that material gross margins were expected to move back toward historical levels of approximately 60% during the remainder of 2026. Brian Lee directly challenged that expectation after the second consecutive quarter near 50%. Millard responded that there had been “a little bit of an evolution” in customer and product mix and redirected attention to the consolidated gross-margin range. No renewed timing commitment for a return to 60% was provided. This was not an explicit declaration that 50% is the permanent margin structure, but the earlier near-term recovery expectation was no longer supported by a clear operating bridge.
The consolidated margin remained relatively high because royalties represented a larger share of revenue. Royalty and license fees increased from approximately 38.2% of revenue to 47.1%. This revenue carries very little directly associated cost of sales, although the intellectual property requires substantial ongoing research, patent, and commercialization spending elsewhere in the income statement. A more royalty-heavy revenue mix can therefore support consolidated gross margin while concealing deterioration in the materials business.
The revised annual materials-to-royalty ratio makes the consolidated margin outlook particularly noteworthy. The move from approximately 1.2:1 to 1.1:1 implies a higher royalty proportion, which would ordinarily be favorable to consolidated gross margin if underlying category economics were unchanged. Yet management still directed expectations toward the bottom of the 74%-76% range. The adverse manufacturing and product/customer economics are therefore meaningful enough to outweigh at least part of this favorable revenue composition.
The filing also identifies an expense omitted from the call’s headline margin explanation. Inventory reserves increased by approximately $1.3 million in the quarter, compared with $124,000 a year earlier, reflecting changes in estimated net realizable value. Those provisions represented approximately 81 basis points and 9 basis points of consolidated revenue, respectively. Excluding the disclosed provisions from both periods would produce consolidated gross margins of approximately 74.0% and 74.7%. Inventory provisioning therefore explains a meaningful portion, but not all, of the year-over-year consolidated margin deterioration.
The inventory evidence warrants monitoring rather than an immediate conclusion of widespread obsolescence. Total inventory declined to $236.9 million from $249.6 million at June 30 and $240.9 million at year-end 2025. However, finished goods increased approximately 18% from year-end to $85.6 million, while raw materials declined. The relevant risk is therefore the composition and commercial usability of inventory, not simply its aggregate balance. No disclosure establishes that the reserve relates specifically to phosphorescent blue.
Operating-expense discipline was mixed. Research and development expense was essentially unchanged year over year at $36.3 million, while selling, general and administrative expense increased approximately 15.8% to $20.9 million. Patent costs also increased. Lower amortization partially offset these increases. The resulting expense profile indicates continued investment and some administrative cost growth rather than a broad restructuring-driven earnings recovery.
EPS QUALITY, INVESTMENT GAINS, AND TAX EXPOSURE
GAAP net income increased approximately 79% to $78.9 million, while diluted EPS increased approximately 87% to $1.72. The largest driver was a $28.9 million unrealized gain on a UDC Ventures investment. The quarterly filing attributes this gain to an observable price change in an orderly transaction, rather than a realized sale. The mark provides evidence of increased investment value, but it did not generate cash and should not be capitalized as recurring operating earnings.
The company’s adjusted presentation removes the investment gain and $6.1 million of related tax expense, producing adjusted net income of $56.2 million and adjusted EPS of $1.23. The resulting approximately $0.50 per-share adjustment explains most of the difference between GAAP and adjusted EPS. Company-adjusted EPS increased approximately 34% from $0.92, but this remains an incomplete measure of recurring performance.
The adjusted result still includes a $7.2 million foreign-exchange gain on a Korean won-denominated tax receivable. Applying the company’s disclosed 21.2% adjustment tax-rate assumption to that gain implies an after-tax contribution of approximately $5.7 million, or $0.12 per diluted share. Removing it from company-adjusted earnings produces an analytical EPS measure of approximately $1.10. This is not a company-reported metric or a fully normalized earnings figure, but it is a more conservative reference for recurring quarterly earnings than either $1.72 or $1.23.
The foreign-exchange comparison was particularly favorable because the same receivable generated a $1.9 million loss in the prior-year quarter. The year-over-year pretax swing was therefore approximately $9.1 million. The filing also discloses a $2.0 million release of a deferred-tax valuation allowance associated with the investment appreciation. These items reinforce the need to distinguish operating improvement from changes in asset values, currencies, and tax accounting.
The income statement reconciles the apparently large gap between operating profit and net income. Operating income of $53.7 million was supplemented by $8.2 million of net interest income and $37.3 million of other income, producing pretax income of $99.2 million. Tax expense of $20.2 million resulted in the reported 20.4% effective tax rate and $78.9 million of net income. The call’s reference to approximately $37 million of other income did not include the separate interest-income line.
The Korean tax receivable is also a substantive valuation and cash-realization issue. The filing reports a $57.5 million long-term receivable and an associated $15.7 million U.S. tax payable that would become relevant upon recovery and amended returns. A September 2025 Korean Supreme Court decision changed the legal interpretation underpinning the dispute. Management continues to believe recovery is more likely than not, but a scheduled July 2026 hearing was postponed without a specified replacement date. The foreign-exchange gain is therefore a remeasurement of a disputed asset, not evidence that collection has become imminent. The receivable should not be valued as immediately available cash, and its gross amount should not be treated as an equivalent future net cash receipt.
Buybacks also increased EPS growth relative to net-income growth. Weighted-average diluted shares declined approximately 4.0% year over year to 45.8 million, providing approximately 4.1% per-share accretion at unchanged earnings. This is a real shareholder benefit, but it is a capital-allocation effect rather than evidence of stronger product economics. Lower investment balances and bond yields simultaneously reduced quarterly interest income from $10.0 million to $8.2 million, partially offsetting the benefit.
2026 GUIDANCE: UNCHANGED REVENUE EXPECTATIONS, LOWER MARGIN CONFIDENCE
The guidance history establishes that the revenue outlook was maintained this quarter rather than newly reduced. On February 19, management initially guided 2026 revenue to $650 million-$700 million. On April 30, the range was reduced to $630 million-$670 million. On July 30, management shifted expectations toward the lower end of that range. The October call maintained the July position.
Using $630 million as an analytical reference, rather than a formal point forecast, expected revenue is approximately 6.7% below the original $675 million midpoint and 3.2% below 2025 revenue of $650.6 million. The unchanged October language therefore represents stability after earlier reductions, not a restoration of the original growth outlook.
The required fourth-quarter revenue can be calculated directly. With $454.8 million recognized through September, reaching $630 million requires $175.2 million in the fourth quarter. That would represent sequential growth of approximately 9.2%, compared with 5.4% sequential growth in the third quarter. However, it would be only approximately 1.3% above the $172.9 million achieved in the fourth quarter of 2025. The seasonal requirement is meaningful, but the year-over-year hurdle is not unusually aggressive.
Management attributed the expected fourth-quarter increase to continuing production for second-half product launches and advance material buying for products launching in the first quarter of 2027. Millard stated, “We do believe it is achievable, and that is our plan at this point.” This is an expression of confidence, not a statement that the target is fully covered by noncancelable orders. The analyst’s question about minimal downside risk was not answered with backlog, shipment commitments, utilization data, or quantified end-market sell-through.
The timing explanation also matters for 2027. Material purchases associated with early-2027 launches can support fourth-quarter 2026 revenue without establishing a stronger first-quarter 2027 shipment run rate. Purchasing ahead of product launches is normal, but a seasonal improvement should not automatically be annualized as a structural demand acceleration.
The annual gross-margin target provides less assurance of a fourth-quarter rebound than its headline range suggests. Through September, gross profit was $338.8 million on $454.8 million of revenue, equivalent to approximately 74.5%. At $630 million of full-year revenue, achieving exactly 74% annual gross margin requires fourth-quarter gross margin of only approximately 72.7%. Achieving 75% would require approximately 76.3%. Accordingly, management can deliver the lower end of annual gross-margin guidance even if fourth-quarter consolidated margin remains below the third-quarter level. The revised guidance does not require material gross margin to return toward 60%.
2027 OUTLOOK AND OPERATING SENSITIVITY
No formal 2027 financial guidance was issued. Management indicated that guidance would be provided in February and cited third-party expectations for approximately mid-single-digit growth in OLED display area. This is an industry-area forecast, not a Universal Display revenue forecast. Revenue conversion depends on customer share, material loading, product architecture, pricing, utilization, qualification timing, and revenue-recognition estimates.
The call’s 2027 margin language was more explicitly cautious than July’s discussion. Millard identified “higher input costs that we do expect to materialize next year,” while describing scale efficiencies and manufacturing-process improvements as potential offsets. The July call had specifically identified iridium as an important input and discussed process optimization with PPG. No quantitative cost bridge, contractual pass-through mechanism, or timetable for productivity benefits was provided on the current call.
The combination of modest industry growth and higher costs creates a risk that revenue recovery will not translate into comparable earnings growth. At a $630 million annual revenue base, a 100-basis-point change in consolidated gross margin changes pretax earnings by approximately $6.3 million before any expense response. Using a 21.2% tax assumption and the current diluted share count, the equivalent EPS sensitivity is approximately $0.11. A 300-basis-point margin swing therefore has an approximately $0.33 annual EPS effect, enough to materially change the investment interpretation of a mid-single-digit revenue recovery.
An illustrative 2027 base case, assigned a judgmental 55% probability, assumes revenue of $660 million, gross margin of 73%, and operating expenses of $262 million. This produces operating income of approximately $220 million and an operating margin of 33.3%. The assumptions reflect moderate OLED-area growth, incomplete margin recovery, continued investment, and no material earnings contribution from newly commercialized blue or equipment platforms.
An illustrative bull case, assigned a 25% probability, assumes revenue of $710 million, gross margin of 75%, and operating expenses of $270 million. Operating income would be approximately $263 million, with a 37.0% margin. This requires stronger capacity utilization, better revenue conversion from new applications, and a more successful manufacturing-cost offset. Customer-specific blue commercialization would strengthen the longer-term valuation case, but the call does not justify making substantial blue revenue a necessary assumption in the base forecast.
An illustrative bear case, assigned a 20% probability, assumes revenue of $600 million, gross margin of 70%, and operating expenses of $260 million. Operating income would fall to approximately $160 million, with a 26.7% margin. This outcome reflects weaker consumer-device demand, continued unfavorable realization, and input-cost inflation that productivity improvements fail to absorb. These scenarios are analytical sensitivities, not management guidance or consensus forecasts. Their central implication is that gross-margin execution is at least as important as industry-area growth to the 2027 earnings outcome.
FOLDABLES, IT, TVS, AND AUTOMOTIVE
Foldables provide a credible route to higher OLED content without requiring equivalent growth in smartphone unit shipments. Management cited Omdia’s forecast of 45 million foldable smartphones in 2030 versus 18 million in 2025, implying approximately 20.1% annualized unit growth. With nearly 2-3 times the display area of a conventional smartphone, foldables can increase material demand even when they replace an existing OLED handset rather than create an incremental handset sale.
The incremental economics should nevertheless be framed correctly. Replacing a conventional OLED phone with a foldable offering 2-3 times the area adds approximately 1-2 conventional-phone equivalents of display area, rather than making the entire foldable display incremental. Actual material revenue also depends on architecture, emitter loading, manufacturing yield, and contracted pricing. Display area is a useful demand indicator, but not a complete revenue model.
Management’s description of Apple’s iPhone Duo launch was an important qualitative endorsement of the category. However, initial allocations selling out and deliveries extending into 2027 demonstrate demand relative to limited initial supply, not the eventual size or profitability of the market. The call supplied no shipment quantities, manufacturing yields, customer-specific material contribution, or quantified incremental revenue. Simultaneous launches from Samsung, Xiaomi, and Huawei support broader ecosystem participation, but competitive product activity alone does not establish realized industry profitability.
IT remains the largest quantified medium-term adoption opportunity discussed. Management cited Omdia’s projection of 89 million OLED notebooks, tablets, and monitors in 2030 versus 27 million in 2025, equivalent to approximately 26.9% annualized growth. These products generally offer substantially greater display area than smartphones, making the potential materials opportunity larger than the unit-growth figures alone suggest. However, the forecast combines heterogeneous applications with different architectures, replacement cycles, price sensitivities, and qualification requirements.
The approximately $20 billion of cited Gen 8.6 capacity commitments provides evidence of industry investment, but committed capacity is not equivalent to economically utilized capacity. Revenue realization depends on installation, process qualification, yield improvement, utilization, and final-device demand. Management’s July commentary already stated that contributions from the early capacity ramps were included in 2026 guidance. The current call therefore does not establish that these investments represent an additional, previously unmodeled near-term revenue catalyst.
Higher memory costs create a countervailing force. More expensive device bills of materials can reduce shipment volumes, delay upgrades, or constrain premium display adoption. The call explicitly extended these concerns into 2027. The important investment distinction is that long-term OLED capacity investment can remain rational while near-term emitter demand and profitability remain weak. Announced capital expenditure and current material earnings need not move together.
The TV opportunity is similarly dependent on unit economics rather than premium positioning alone. Management highlighted lower-cost SE architectures from LG Display as a means of broadening OLED’s addressable market. Lower panel prices could increase adoption, but any benefit to Universal Display depends on the emitter content and economics of the new architecture relative to the premium products it complements or replaces. The call did not quantify that content. Higher TV unit penetration should therefore not be translated mechanically into proportional material-revenue growth.
Automotive offers longer-duration diversification and potentially attractive display-area growth, but no near-term revenue or design-win targets were disclosed. Qualification cycles, operating lifetime, temperature requirements, and production-program timing limit the usefulness of automotive announcements as immediate earnings catalysts. The reference to 10 years of OLED lighting in Audi production vehicles demonstrates commercial longevity, not a newly established revenue inflection.
PHOSPHORESCENT BLUE: STRATEGIC VALUE WITHOUT A COMMERCIAL TIMETABLE
The blue program remains potentially transformative, but the quarter did not resolve the central investment question of when meaningful commercial revenue begins. Management reported progress in efficiency, color, lifetime, and manufacturability and described work across a broader set of materials and device architectures. No commercial customer, committed launch date, production-volume target, or revenue expectation was disclosed.
Abramson’s response was notably open-ended: “we’re very excited about the future, and it’s still a story to be told.” This language supports continued strategic commitment but does not establish proximity to production. Improvements in individual technical metrics are insufficient without simultaneous achievement of customer-specific requirements for color, efficiency, operational lifetime, stability, reproducibility, and manufacturing compatibility.
The absence of meaningful development revenue prompted a direct challenge from Mehdi Hosseini. Abramson explained that customers still had materials under evaluation and that lower sales reflected “the continued strategic transition as we advance the next generation of phosphorescent blue materials.” He added that “we do expect the blue revenue to remain lower during this time period.” This is a consequential near-term statement: low development revenue is not being presented as a temporary billing anomaly immediately preceding a disclosed ramp.
The explanation is compatible with continued customer engagement. Small quantities of material can support extensive testing, and sample revenue is an imperfect measure of technical progress. However, a transition to next-generation materials can also require further evaluation and qualification. The call does not establish whether commercialization is constrained primarily by customer product timing, remaining technical requirements, or both. The appropriate conclusion is continued development with uncertain monetization timing, not either imminent commercial success or abandonment.
Blue should therefore remain outside the near-term base-case earnings contribution until customer qualification and production timing become concrete. Its strategic value is real, but repeated shifts toward new material generations increase the importance of milestone-based valuation. The most informative evidence would be a named commercial platform, defined production timing, and measurable shipments beyond development quantities.
OLEDX, PSF, AND AI-ENABLED MATERIAL DISCOVERY
OLEDX addresses a different efficiency constraint from phosphorescent emission. Abramson summarized the distinction directly: “phosphorescence creates the photons, and OLEDX helps make every photon count.” Phosphorescent materials improve the conversion of electrical excitation into generated light, whereas OLEDX is intended to improve the extraction and delivery of that light to the viewer. The technologies are therefore potentially complementary rather than substitutes.
Improved light extraction could support higher brightness at unchanged power, lower power at unchanged brightness, or a combination of performance improvements. It could also reduce the current density needed for a given brightness, potentially easing lifetime constraints. These are relevant customer benefits, particularly in battery-powered devices and higher-performance displays. However, the call disclosed no quantified extraction improvement, production yield, manufacturing cost, customer qualification, or commercialization timetable.
The monetization mechanism also remains unspecified. OLEDX could create value through licensing, proprietary materials, broader customer integration, or stronger differentiation of Universal Display’s existing portfolio. The call does not establish which route will dominate. Technical efficiency should not automatically be converted into higher material revenue per panel. Nor should improved efficiency automatically be assumed to reduce emitter demand, because material loading is not simply proportional to electrical power consumption.
Management’s discussion of phosphorescent-sensitized fluorescence, or PSF, was more directly relevant to protecting existing economics. In response to Martin Yang’s question about the transition from emitter to sensitizer, Abramson said that the technology currently appeared to occupy “the same range of doping percentage and revenue to us” as pure phosphorescence. This is a constructive indication that the company may preserve economic participation as display architectures evolve.
The qualification is that PSF remains early in adoption. Similar doping percentages do not independently establish equivalent pricing, margin, intellectual-property protection, or lifetime revenue per panel. The statement supports continuity of potential content in the specific architectures under discussion, not a guaranteed uplift. It also does not establish that all alternative fluorescence-based architectures require Universal Display’s materials.
The AI discovery platform is strategically useful but commercially unproven at the disclosed scale. Management described a virtual library exceeding 1 billion molecular designs, approximately 50 million computationally evaluated candidates, hundreds of promising molecular cores, and synthesized candidates contributing leads to the blue program. These figures show a broader search capability, not a measured conversion rate into qualified products.
The financially relevant milestones are shorter development cycles, fewer unsuccessful synthesis and testing iterations, better simultaneous performance across customer specifications, and eventual product qualification. Research and development expense remaining approximately flat year over year may be consistent with improved productivity, but the call does not establish a causal relationship. Computational throughput should not be treated as evidence that the commercialization bottleneck has been removed.
NOVAJET, UVJC, ADESIS, AND VENTURE INVESTMENTS
NovaJet represents a meaningful commercialization milestone for UVJC, but management defined the initial product more narrowly than the term commercial launch might imply. Abramson described “a small footprint tool that will enable researchers and technologists to work with the technology.” The immediate opportunity is therefore an evaluation and development platform rather than an established high-volume production-equipment franchise.
The pivot from the earlier OVJP approach toward applications including semiconductor packaging, photovoltaics, solid-state batteries, organic electronics, and life sciences broadens the technology’s potential relevance. It also introduces multiple qualification pathways, distinct customer requirements, and differing competitive environments. A broad list of addressable markets is not equivalent to a validated commercial funnel.
The question about an equipment partner, reorders, and the next milestones was not answered with customer names, order quantities, backlog, partner economics, or production adoption criteria. The next value-creating evidence would be paid placements, repeat orders, demonstrated process performance, application-specific qualification, and a credible manufacturing and service model. Until then, NovaJet is appropriately treated as an early-stage option with development costs, not a substitute for near-term core earnings recovery.
Adesis delivered a tangible but modest improvement. Revenue increased approximately 43% to $5.2 million, and the filing attributes the increase to stronger specialty-manufacturing demand. However, first-9-month revenue remained approximately 20% below the prior-year period. The quarter therefore indicates a rebound from a weak comparison rather than a proven sustained growth trajectory. At approximately 3.3% of consolidated revenue, Adesis remains too small to offset a material deterioration in the core OLED business.
UDC Ventures has strategic value through access to technology, relationships, and potential financial returns. The filing reports approximately $73.0 million of minority equity investments without readily determinable fair values and $2.0 million of convertible notes, alongside management’s description of approximately $80 million under management. The quarter’s $28.9 million appreciation was concentrated in a single investment. This can create shareholder value, but valuation gains should be separated from operating earnings and subjected to appropriate realization, liquidity, and tax considerations.
CASH FLOW, BALANCE SHEET, AND CAPITAL ALLOCATION
Cash generation was strong and provides an important counterweight to the margin concerns. The cash-flow statements imply third-quarter operating cash flow of approximately $100.2 million, compared with $97.2 million a year earlier. Deducting cash purchases of property and equipment produces an analytical quarterly free-cash-flow measure of approximately $95.9 million, versus $84.3 million. This demonstrates substantial cash conversion despite weaker materials profitability.
The cumulative cash-flow improvement requires qualification. Operating cash flow increased approximately 30% to $234.1 million in the first 9 months, while net cash taxes paid declined from approximately $54.0 million to $3.2 million. The $50.8 million tax-payment difference was nearly as large as the $54.4 million increase in operating cash flow. Collections, customer payments, and inventory movements also affected conversion. The year-to-date cash-flow acceleration should therefore not be extrapolated as a comparable increase in recurring earnings power.
Operating cash flow less property and equipment purchases was approximately $216.6 million for the first 9 months. Deducting the additional $40.0 million purchase of intangible assets produces approximately $176.6 million before dividends and repurchases. This broader investment-adjusted measure is relevant because acquiring intellectual property is an economic use of cash even though it is excluded from a conventional operating-cash-flow-minus-capex calculation.
Cash dividends and share repurchases consumed approximately $262.3 million over the same period, exceeding both measures. The company can support this through its balance sheet, but the repurchase pace was not fully funded by contemporaneous cash generation after all disclosed investment spending. Capital returns should consequently be evaluated alongside the decline in liquid financial resources rather than solely as evidence of excess recurring cash flow.
Management’s approximately $828 million liquidity figure is supported by $93.4 million of cash and cash equivalents, $340.0 million of short-term investments, and $394.6 million of long-term U.S. government bonds. It excludes the separate minority venture investments. Liquid financial resources declined from approximately $955.4 million at year-end 2025 but remain substantial, equivalent to approximately $18.3 per September 30 outstanding common share. This is financial flexibility, not an automatic stock-price floor.
The company repurchased approximately 963,000 shares for $78.8 million during the quarter, implying an average purchase price of approximately $81.8. This compares with approximately $90.7 in the second quarter. Purchasing more shares at lower prices improves capital-allocation efficiency if the shares are below intrinsic value, but management’s purchase price does not establish that value. The $0.50 quarterly dividend represents a $2.00 annualized rate, subject to future board approval.
INVESTMENT IMPLICATIONS, CATALYSTS, AND RISK CONTROLS
The call does not justify underwriting Universal Display as a near-term blue-commercialization or rapid margin-recovery trade. The stronger long-term formulation is a highly concentrated materials and intellectual-property franchise benefiting from increasing OLED display area, with substantial liquidity and several technically credible growth options. The weaker near-term formulation is a business experiencing blended realization pressure and uncertain manufacturing economics while several future opportunities remain insufficiently commercialized.
The principal valuation risk is applying a high recurring-earnings multiple to $1.72 of quarterly GAAP EPS or assuming that $1.23 of adjusted EPS fully excludes non-operating benefits. Conversely, the principal risk to an overly bearish interpretation is ignoring the real volume recovery, approximately 20% royalty growth after correcting the prior-year out-of-period item, substantial cash generation, and the ability to retire shares while funding development.
Valuation should separate the core operating franchise, liquid financial assets, venture holdings, the disputed tax receivable, and emerging technology options. An enterprise-value approach should also exclude investment income from operating earnings when separately recognizing financial assets. Otherwise, the same financial resources can be counted through both earnings and asset value. Blue, OLEDX, and NovaJet warrant milestone-dependent value rather than the capitalization of undisclosed revenue streams.
The immediate catalyst is fourth-quarter execution. Revenue near $175.2 million would support the approximately $630 million annual reference point, but the composition of that revenue and the associated material gross margin will be more informative than the revenue total alone. A result achieved through favorable royalty adjustments or unusually concentrated purchasing would carry a different implication from a broad-based increase in material shipments with improved margins.
The next major scheduled catalyst is February 2027 guidance. The critical disclosures will be the relationship between industry-area growth and company revenue, the magnitude of input-cost inflation, the timing of manufacturing offsets, and whether material gross-margin recovery can be supported by measurable operating assumptions. A quantified margin bridge would be more valuable than another broad reaffirmation of OLED’s long-term adoption trajectory.
The positive investment case would strengthen with sustained shipment growth, stabilization in revenue realization, reduced dependence on catch-up adjustments, and material margins recovering above the approximately 50% level. It would strengthen further with customer-specific commercial milestones for blue or repeat paid adoption of NovaJet. The case would weaken with a fourth-quarter revenue shortfall, persistent reserve charges, increasing finished-goods exposure without corresponding shipments, or 2027 guidance showing little earnings growth despite expanding OLED area.
Portfolio exposure should be treated primarily as consumer-electronics, display-adoption, Asian manufacturing, and technology-commercialization risk. The large cash balance reduces financing risk but does not remove earnings or valuation volatility. The position would not necessarily diversify an existing portfolio of premium-device and display-supply-chain exposures. Memory inflation also creates a potentially adverse linkage: conditions favorable to memory suppliers can simultaneously constrain device demand and OLED content adoption.
The appropriate call-driven action is to avoid adding exposure solely on the reported EPS increase. No incremental risk allocation is supported by the earnings headline alone. A price-based entry, target, stop-loss, and maximum-loss budget require a separately established valuation and portfolio risk framework. The fundamental reassessment points are the fourth-quarter revenue and margin result, February’s 2027 guidance, and verifiable customer commercialization milestones. The quarter supports continued strategic relevance and financial resilience, but not yet a high-confidence earnings inflection.
COMPANY EMPLOYEES ON THE CALL
• Steve Abramson, President and Chief Executive Officer. • Brian Millard, Chief Financial Officer and Treasurer. • Darice Liu, Senior Director of Investor Relations.
RESEARCH ANALYSTS ON THE CALL
• Brian Lee, Goldman Sachs. • Mehdi Hosseini, SIG, Susquehanna International Group. • Martin Yang, Oppenheimer & Company.
Key Read-Throughs
KEY READ-THROUGHS FROM UNIVERSAL DISPLAY’S THIRD-QUARTER 2026 EARNINGS CALL
Universal Display’s results indicate an increasingly bifurcated electronics cycle: scarce memory retains pricing power, premium display applications continue attracting investment, and mass-market device economics remain constrained. The strongest cross-company implications concern the persistence of memory inflation, the distinction between OLED capacity announcements and equipment revenue, and the advantages accruing to established suppliers of commercially qualified display technologies. Higher OLED shipment volumes did not prevent Universal Display’s materials revenue from declining or its materials gross margin from remaining near 50%. Consequently, expanding display area should not be treated as evidence of improving profitability throughout the supply chain. The implications below distinguish incremental information from developments already reflected in peer disclosures. Country labels identify principal operating headquarters rather than necessarily the incorporation or listing jurisdiction.
MEMORY SEMICONDUCTORS: DOWNSTREAM COST PRESSURE REINFORCES PRICING DURABILITY (READ-THROUGH 1)
Affected companies: Micron Technology (MU: United States), SK hynix (000660: South Korea), and Samsung Electronics (005930: South Korea). Direction: positive for memory pricing and earnings durability. Magnitude: high fundamental relevance for Micron and SK hynix, and material for Samsung’s semiconductor business; the incremental information content of this particular call is moderate rather than transformational.
The supporting commentary was unusually explicit about duration. CFO Brian Millard described “the memory environment expected to continue to be tight and challenging into 2027.” Management also connected elevated component costs with uncertainty in the consumer-electronics outlook. This is confirmation from a supplier outside the memory industry that scarcity is affecting downstream customer planning, rather than merely appearing in memory manufacturers’ own demand narratives.
The transmission mechanism is sustained pricing leverage in memory procurement. Device manufacturers facing limited supply must accept higher component costs, reduce memory configurations, raise product prices, adjust shipment volumes, or absorb lower margins. These responses support the proposition that memory suppliers retain a disproportionate share of supply-chain economics. The call does not establish a specific DRAM or NAND price increase, and it provides no independent evidence about HBM allocation. Its value is narrower: consumer-electronics customers are not planning around rapid normalization in memory availability and cost.
The important non-consensus distinction is that weak handset or PC units do not necessarily imply weak memory earnings. Prices, product mix, and allocation toward more attractive end markets can outweigh softer consumer-device volumes. However, demand destruction remains the eventual counterweight: sufficiently expensive memory can reduce economically viable device production. The positive inference concerns the persistence of tight conditions, not unlimited pricing power.
This is corroboration rather than a new quarterly earnings prediction. Micron’s September 30 prepared remarks already anticipated tighter supply-demand conditions in 2027 and 2028. SK hynix’s October 28 reporting also described continued shortages and stronger pricing. Universal Display adds independent downstream confirmation. Near-term trading catalysts are late-2026 contract-price developments and subsequent memory-producer guidance; the longer-duration implication is a more persistent allocation of profits toward memory suppliers and away from device assemblers.
CONSUMER HARDWARE: PREMIUM PRODUCT STRENGTH DOES NOT SIGNAL MASS-MARKET COST RELIEF (READ-THROUGH 2)
Affected companies: Xiaomi Corporation (1810: China) and Lenovo Group (0992: China). Direction: negative for the consumer-device volume and procurement-cost outlook, with substantially different earnings sensitivity between companies. Magnitude: potentially high for Xiaomi’s smartphone business and moderate at group level; moderate for Lenovo’s client-device operations, with a less direct consolidated earnings impact.
The call juxtaposed relative resilience in premium devices with broader smartphone uncertainty and memory tightness extending into 2027. Management also cited third-party expectations for only mid-single-digit OLED display-area growth next year. This combination argues against extrapolating successful flagship launches into a broad consumer-hardware recovery.
For Xiaomi, the mechanism is particularly direct. Memory inflation consumes a larger share of the selling price in lower-priced handsets, where absolute gross profit per unit provides less room to absorb component increases. Raising prices protects unit economics but risks reducing shipments; holding prices supports volumes at the expense of margin. The company’s August 18 results already demonstrated this trade-off: smartphone shipments fell 26.5%, ASP increased 25.9%, and smartphone gross margin was 8.5%. Universal Display’s call does not predict those already-reported results. It reinforces the risk that the underlying cost constraint persists into the next planning year.
The critical distinction is between slowing cost inflation and falling input costs. Even if memory-price increases decelerate, procurement costs can remain elevated as older inventory and supply agreements roll off. A less severe sequential increase therefore does not automatically produce a recovery in handset gross margin. Xiaomi’s successful premium products can improve mix without repairing the economics of its broader mid-range and entry-level portfolio. Its EV and other businesses also prevent a direct translation of smartphone pressure into an equivalent group earnings decline.
Lenovo requires a more differentiated interpretation. Its August presentation reported a stable 7.1% Intelligent Devices Group operating margin despite industry headwinds. That is counterevidence against assuming all PC manufacturers must experience immediate margin compression. Scale, sourcing, pricing, and mix can protect profitability while unit demand remains constrained. The call therefore challenges assumptions of broad volume recovery and easy procurement-cost relief, but does not independently justify cutting Lenovo’s stated earnings outlook.
Near-term catalysts are the companies’ next results, holiday-period shipment trends, and evidence that price increases are being accepted without further volume erosion. The longer-duration implication is greater differentiation between manufacturers with effective procurement and pricing capabilities and those dependent on high-volume, low-margin devices. Relative resilience in premium products should not be confused with recovery across the entire device market.
DISPLAY MANUFACTURING EQUIPMENT: ANNOUNCED CAPACITY IS NOT AN IMMEDIATE ORDER RECOVERY (READ-THROUGH 3)
Affected company: Canon (7751: Japan), through Canon Tokki’s OLED deposition systems and Canon’s separate flat-panel-display lithography business. Direction: negative for expectations of an immediate display-equipment rebound, with constructive longer-duration demand potential. Magnitude: meaningful within the affected equipment businesses, but limited relative to Canon’s diversified consolidated earnings.
Universal Display cited approximately $20 billion of Gen 8.6 OLED capacity commitments, Samsung Display’s restart of greenfield construction, and OLED IT shipments potentially increasing from 27 million in 2025 to 89 million in 2030. These are supportive indicators of the industry’s investment direction. They are not evidence that the corresponding equipment orders, deliveries, or revenue recognition occur in the next quarter.
The distinction is especially actionable because Canon reported on October 27, immediately before Universal Display. Canon’s prepared commentary stated: “Revenue from OLED display manufacturing equipment is expected to decline due to panel manufacturers postponing investments.” It separately described delayed flat-panel-display lithography investment, while expecting unit-sales growth from 2027 onward. Universal Display’s optimistic capacity commentary therefore does not invalidate Canon’s already-disclosed near-term weakness.
The transmission mechanism depends on project sequencing. Construction approval, building completion, cleanroom installation, equipment procurement, delivery, qualification, and commercial production are different milestones. Material consumption can increase as previously equipped factories ramp even while orders for the next generation of equipment remain delayed. Conversely, a greenfield building announcement can precede equipment revenue by a substantial interval. Treating both developments as simultaneous incremental equipment demand would overstate the near-term opportunity.
Supplier allocation also matters. The approximately $20 billion industry commitment is not Canon’s addressable order book, and the call identifies no new Canon award. Different panel manufacturers can select different deposition vendors and manufacturing architectures. The supported conclusion is an expanding long-term equipment opportunity, not a quantified Canon revenue uplift.
The near-term implication is to resist upgrading Canon’s display-equipment expectations solely because Universal Display describes an active capacity cycle. The relevant catalysts are actual orders, delivery schedules, customer-site readiness, and Canon’s initial 2027 outlook. Over the longer term, the projected approximately 27% annualized growth in OLED IT units supports continued investment. The investment opportunity depends on when that demand becomes executable equipment business, not simply when capacity plans are announced.
FOLDABLE DISPLAYS: SAMSUNG CAN BENEFIT EVEN WHEN APPLE GAINS DEVICE SHARE (READ-THROUGH 4)
Affected companies: Samsung Electronics (005930: South Korea), through Samsung Display, and Apple (AAPL: United States). Direction: positive for Samsung Display’s differentiated panel opportunity and positive for Apple’s premium-product mix. Magnitude: potentially material within Samsung Display’s foldable business, smaller at Samsung consolidated level; initially limited at Apple group level, with greater longer-duration significance.
The call stated that Apple’s initial iPhone Duo production allocations sold out within minutes, with delivery estimates extending into 2027 because of strong demand and limited early supply. Management also cited foldable shipments increasing from 18 million in 2025 to 45 million in 2030 and noted that foldables contain nearly 2-3 times the display area of a conventional smartphone.
The most important cross-portfolio implication is that Apple and Samsung are not purely opposing exposures in this category. Public reporting of Apple executives’ product discussion identifies Samsung Display as the manufacturing partner for Apple’s custom foldable screen. Samsung’s display operations can therefore participate in Apple’s success even if the iPhone Duo competes with Galaxy foldables. The financial transmission is through qualified panel shipments and utilization of advanced manufacturing capacity, not only Samsung-branded handset sales.
Larger display area also creates a content opportunity without requiring comparable growth in total smartphone units. Replacing an existing OLED handset with a foldable can increase display demand even when the transaction is merely a replacement purchase. However, 2-3 times the area does not establish 2-3 times panel revenue or profit. Yields, pricing, architecture, and manufacturing complexity determine the retained economics. The call supports a higher-content opportunity, not a precise revenue multiplier.
For Apple, the positive implication is stronger evidence of demand for a differentiated premium form factor and potential support for product mix. The constraint is that a sellout measures demand relative to initial supply. It does not establish total addressable demand, incremental replacement rates, or a company-wide shipment acceleration. Supply extending into 2027 can also defer revenue rather than simply increase it.
Near-term catalysts are Apple’s next earnings commentary, holiday-period availability, and subsequent Samsung Display shipment and profitability disclosures. The longer-duration shift is the expansion of premium smartphone competition from conventional handset specifications toward larger, flexible displays. Samsung’s participation as both device vendor and panel supplier makes its exposure more complex than a simple Apple-versus-Galaxy market-share comparison.
OLED TELEVISIONS: LOWER PANEL COSTS SUPPORT MARKET EXPANSION, NOT AUTOMATIC MARGIN EXPANSION (READ-THROUGH 5)
Affected companies: LG Display (034220: South Korea) and LG Electronics (066570: South Korea). Direction: positive for OLED market access and potential shipment growth; mixed for realized margins until volume and cost benefits are demonstrated. Magnitude: potentially material for LG Display’s large-OLED operations, moderate within LG Electronics’ television business, and smaller at LG Electronics consolidated level.
Universal Display specifically identified new televisions from LG, Sony, and Panasonic using LG Display’s lower-cost SE architecture, describing the development as helping broaden OLED’s addressable market. This provides customer-adoption evidence for a lower-cost product tier, rather than merely a panel-maker technology announcement.
For LG Display, the transmission mechanism is improved competitiveness at retail price points where conventional premium OLED panels are less attractive. Broader adoption can increase panel shipments and improve utilization of a capital-intensive manufacturing base. If additional volume is genuinely incremental, fixed manufacturing costs are spread across more output, supporting operating leverage. However, lower-priced SE panels can also displace higher-priced OLED products. The balance between new category demand and internal mix dilution determines whether revenue and profits improve together.
For LG Electronics, lower panel costs create a choice between more competitive retail pricing and greater retained gross profit. Competitive conditions may force much of the benefit into consumer prices. A stronger entry-level OLED offering can improve the product portfolio and defend market position without necessarily expanding television margins. The high-conviction positive is a lower economic barrier to OLED adoption, not a guaranteed margin uplift.
The timing distinction is important. LG Display’s October 22 results already described competitively priced OLED products and a sequential shipment recovery. Universal Display therefore corroborates that strategy rather than providing a new forecast of LG Display’s completed quarter. LG Display’s year-over-year operating-profit decline also demonstrates that a richer OLED portfolio does not eliminate currency, component-cost, or utilization risk.
Near-term catalysts are November-December sell-through, promotional intensity, panel shipment growth, and inventory levels. The longer-duration implication is stronger price competition between OLED and premium LCD televisions. A sustained improvement in LG Display’s economics requires profitable incremental demand, not simply higher OLED unit penetration.
SPECIALTY MATERIALS: UNCERTAIN PHOSPHORESCENT-BLUE TIMING EXTENDS THE INCUMBENT COMMERCIAL WINDOW (READ-THROUGH 6)
Affected company: Idemitsu Kosan (5019: Japan). Direction: positive for the durability of its fluorescent-blue OLED materials opportunity. Magnitude: meaningful within the relevant electronic-materials business, but small at the diversified group level. This is protection against displacement rather than evidence of an immediate earnings acceleration.
The supporting commentary was the absence of a commercial timetable for Universal Display’s phosphorescent blue and management’s expectation that development revenue would remain low during a transition to next-generation materials. CEO Steve Abramson stated that “we do expect the blue revenue to remain lower during this time period.” The call did not identify a commercial customer launch, production-volume commitment, or revenue ramp.
The transmission mechanism is the continued use of qualified incumbent materials while customers evaluate replacement technologies. Idemitsu’s operating exposure is established: its commercial materials portfolio includes fluorescent-blue technology, and its May 2026 disclosure described a commercialized stacked fluorescent-blue architecture with approximately 20% lower power consumption than its conventional single-layer reference. That comparison is not a performance comparison against Universal Display’s phosphorescent blue, but it demonstrates that incumbent technology is improving rather than remaining static.
A slower or uncertain transition gives the incumbent additional time to earn revenue from existing qualifications, improve performance, and participate in growing OLED display area. Customers must weigh the benefits of a new emitter system against qualification effort, manufacturing compatibility, reliability, and launch risk. An incumbent that meets product requirements can remain commercially relevant even if an alternative offers superior theoretical efficiency.
This should not be interpreted as proof that Universal Display’s blue program has failed or that Idemitsu has won a new customer. Nor does the call establish another explicit delay relative to a newly committed launch date. The positive inference is that near-term displacement remains unconfirmed, reducing the justification for assuming an abrupt loss of incumbent fluorescent-blue demand.
There is no immediate standalone trading catalyst from this commentary. The relevant events are Idemitsu’s subsequent electronic-materials updates and any customer-specific confirmation of commercial phosphorescent-blue adoption. Over the longer term, the competitive outcome will depend on qualified system performance and customer economics, not isolated laboratory metrics. The call favors a more gradual transition assumption while preserving substantial uncertainty about the eventual architecture mix.
Report record
- Sector
- Information Technology
- Industry
- Semiconductors & Semiconductor Equipment
- Fiscal period end
- September 30, 2026
- Report date
- October 28, 2026
- Analysis
- 6062 words
- Read-throughs
- 2385 words
- Content fingerprint (PDF)
513c73f7b73e- Content fingerprint (analysis)
aa08de29d4ad- Content fingerprint (read-throughs)
a7702c45a759
Prepared from the company's earnings release and earnings call transcript. Figures as reported by the company. For information only. Not investment advice.
More from Universal Display Corporation
No other reports yet.
All Universal Display Corporation reports
More in Information Technology
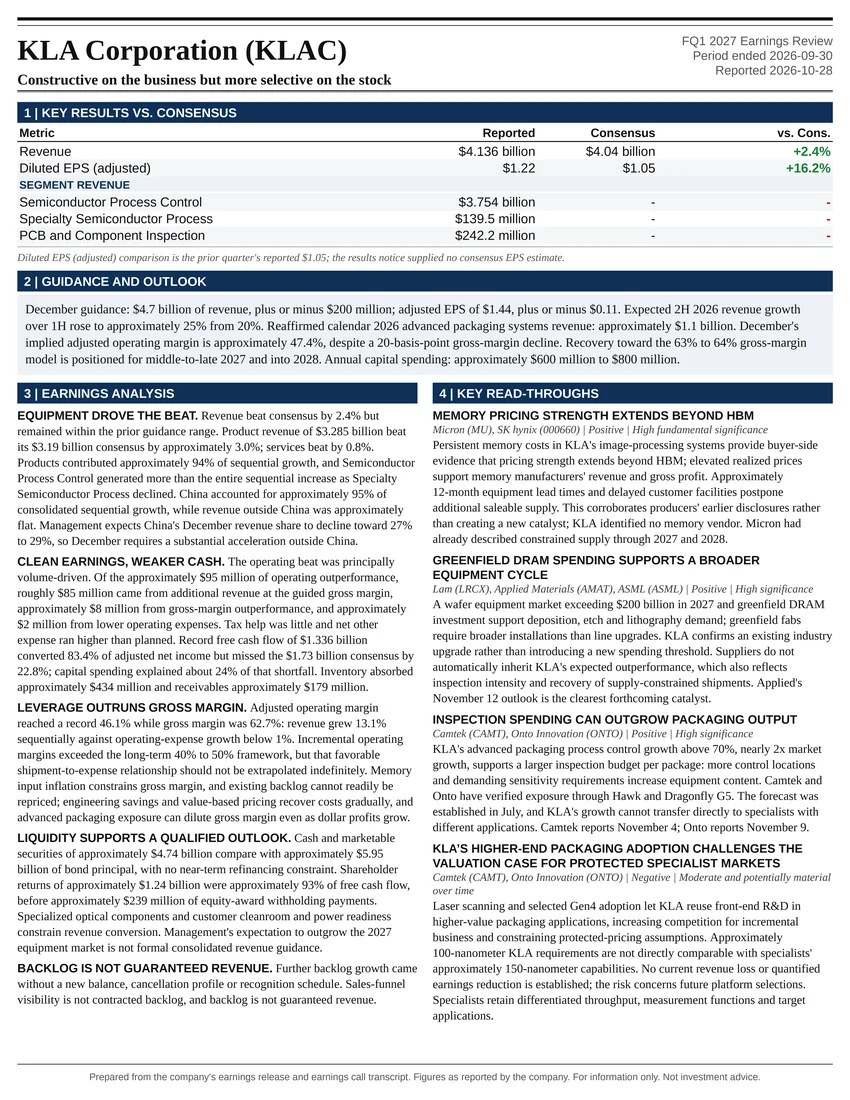
Constructive on the business but more selective on the stock
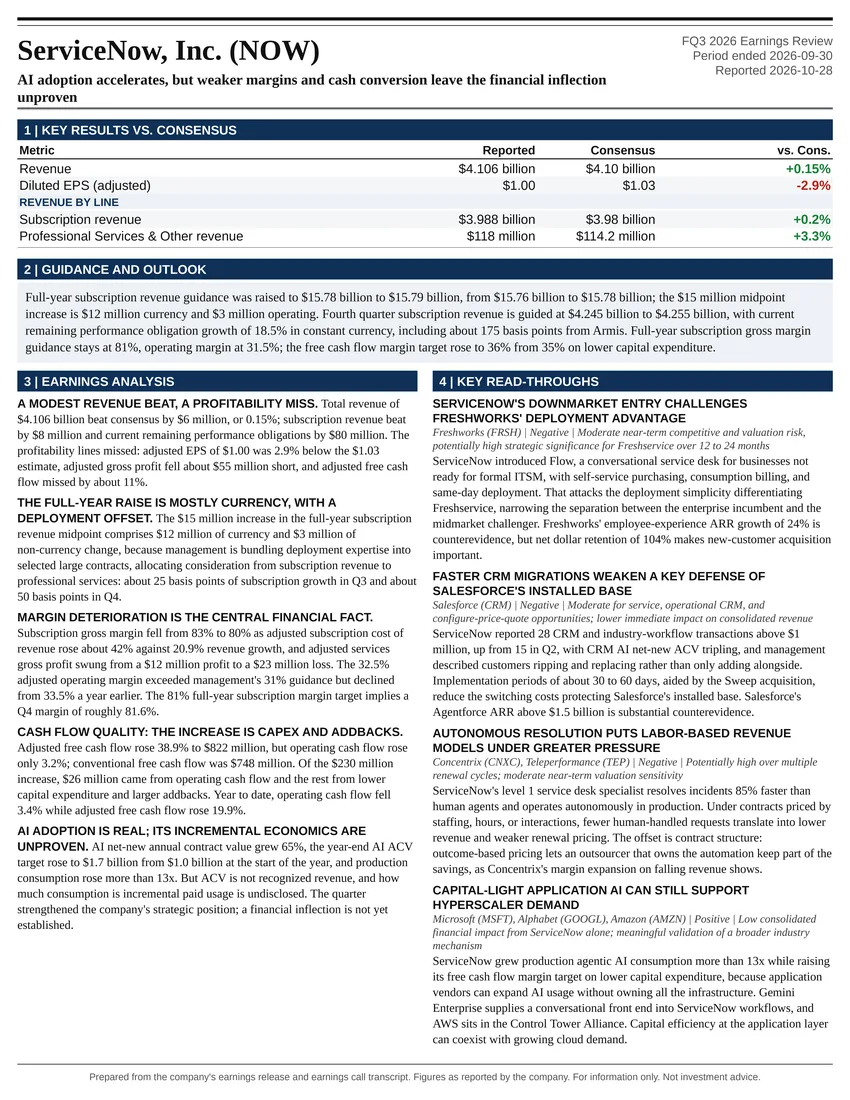
AI adoption accelerates, but weaker margins and cash conversion leave the financial inflection unproven
All Information Technology reports
Follow @AtlasPeakRes on X for new earnings reports as they publish.