An Internationally Led Recovery, Not Yet an Earnings Recovery
Earnings Reports
Cheniere Energy Inc FQ2 2026 Earnings Report
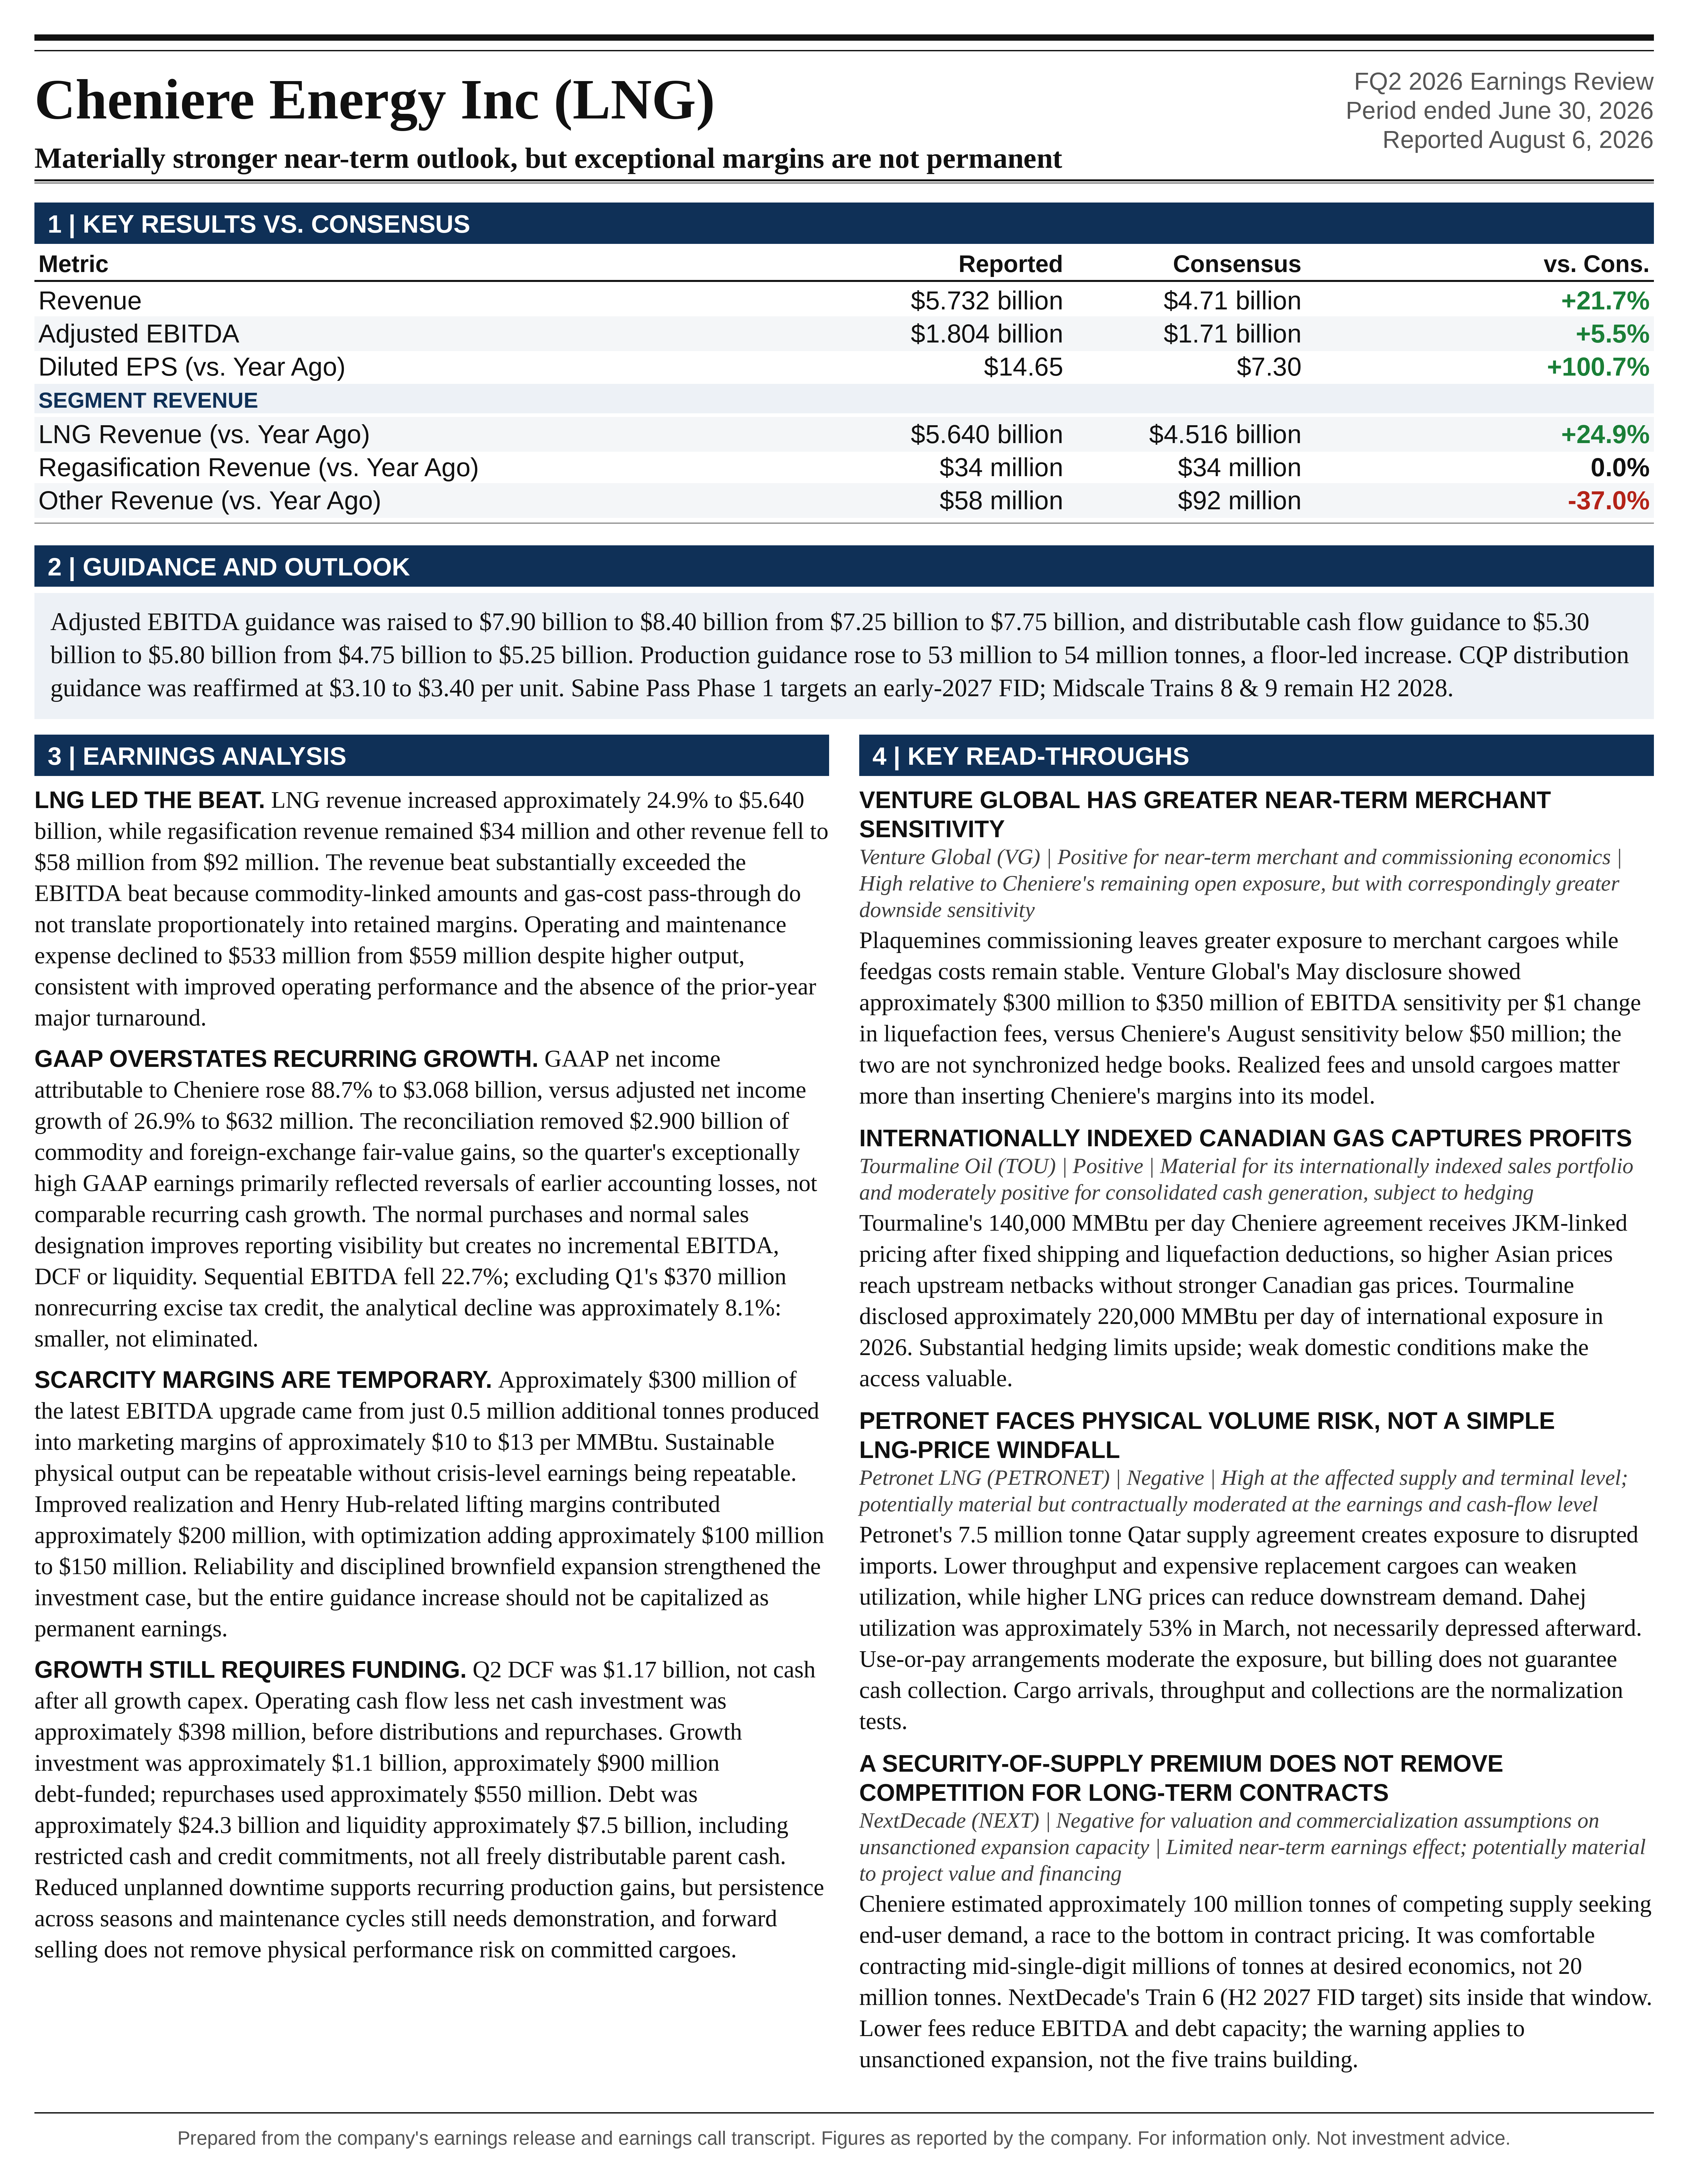
Cheniere Energy Inc (LNG) FQ2 2026 earnings: Materially stronger near-term outlook, but exceptional margins are not permanent. Full earnings analysis, key read-throughs, and the one-page exhibit from Atlas Peak Research.
Cheniere Energy Inc (LNG)
Sector: Energy · FQ2 2026 · Period end June 30, 2026 · Reported August 6, 2026
Cheniere’s Q2 2026 earnings call supported a materially stronger near-term earnings outlook and greater confidence in the operating platform’s sustainable production capacity.
Download the one-page report (PDF)
View one-page exhibit
Download analysis (.md)
Download read-throughs (.md)
Post to X
One-Page Exhibit
Earnings Analysis
EXECUTIVE CALL SUMMARY: Cheniere Energy, Inc. (08/06/26)
Cheniere’s Q2 2026 earnings call supported a materially stronger near-term earnings outlook and greater confidence in the operating platform’s sustainable production capacity. The central investment distinction is between repeatable improvements in reliability, utilization and project execution, and the unusually high profitability of incremental LNG volumes during the Middle East supply disruption. Both contributed to the guidance increase, but they warrant different valuation treatment. Higher sustainable production supports recurring earnings and infrastructure value. Exceptional marketing margins and optimization gains strengthen current cash generation but should not be capitalized indefinitely.
Consolidated adjusted EBITDA of $1.804 billion increased 27.4% year over year and exceeded the supplied Bloomberg consensus estimate by approximately 5.5%. Distributable cash flow, or DCF, increased approximately 27.2% to $1.17 billion. Management increased full-year EBITDA guidance to $7.90 billion to $8.40 billion and DCF guidance to $5.30 billion to $5.80 billion. The respective midpoint increases were $650 million and $550 million, or 8.7% and 11.0%. Both new guidance floors exceeded the previous ceilings. This was a substantive improvement in expected earnings, rather than a narrowing of ranges around an unchanged central forecast.
The most consequential operating disclosure was that more than approximately 67% of the production forecast improvement since the beginning of 2026 reflected reliability and operating improvements, rather than accelerated commissioning alone. The most consequential financial qualification was that approximately $300 million of the latest EBITDA increase came from just 0.5 million additional tonnes produced into marketing margins of approximately $10 to $13 per MMBtu. The additional physical output can be repeatable without the associated crisis-level earnings contribution being repeatable.
The call also improved visibility into the next investment cycle. Corpus Christi Stage 3 was approaching completion, the Midscale Trains 8 & 9 project continued advancing, and Sabine Pass Expansion Phase 1 had an approximately $4.7 billion EPC contract and completed commercialization. However, the distinction between project sanction and operating cash generation remains essential. An expected Sabine Pass final investment decision in early 2027 does not imply that the expansion contributes a full operating year of earnings in 2027.
The fundamental assessment is constructive, but the earnings upgrade does not by itself establish an attractive equity entry valuation. The appropriate framework values contracted cash flows, sustainable production improvements and disciplined brownfield expansion separately from temporary scarcity rents. The analysis below reflects information available with the August 6 call, supplemented by Cheniere’s contemporaneous earnings release, presentation, quarterly filing and historical disclosures.
QUARTERLY PERFORMANCE AND EARNINGS QUALITY
Revenue increased 23.5% to $5.732 billion from $4.641 billion in Q2 2025. LNG revenue increased approximately 24.9% to $5.640 billion, while regasification revenue remained unchanged at $34 million and other revenue declined to $58 million from $92 million. Total revenue exceeded the supplied consensus estimate of $4.71 billion by approximately 21.7%, substantially more than the EBITDA beat. That divergence matters because revenue includes commodity-linked amounts and is not a clean measure of incremental shareholder economics. Higher realized LNG prices and gas-cost pass-through can expand revenue without generating proportionate increases in retained margins.
Adjusted EBITDA increased $388 million to $1.804 billion. The reported EBITDA-to-revenue ratio increased to approximately 31.5% from 30.5%, although this ratio is less informative than production, recognized volumes, contractual fees and marketing margins because revenue denominators fluctuate with commodity prices. Operating and maintenance expense declined to $533 million from $559 million despite higher output, consistent with the absence of the prior-year major maintenance turnaround and improved operating performance. Depreciation increased to $380 million from $329 million as additional assets entered service, while interest expense, net of capitalized interest, increased to $287 million from $237 million. The expanding asset base is therefore increasing both productive capacity and the recurring charges below EBITDA.
Company-reported adjusted net income increased 26.9% to $632 million from $498 million. Dividing these amounts by diluted weighted-average shares produces an analytical adjusted earnings measure of approximately $3.02 per share versus $2.24, an increase of approximately 34.7%. This is a calculated measure, not a separately quoted company EPS result. The faster per-share growth reflects the reduction in diluted weighted-average shares to 209.5 million from 222.3 million. Repurchases are making a measurable contribution to per-share compounding alongside operating growth.
GAAP net income attributable to Cheniere increased 88.7% to $3.068 billion, but this should not be interpreted as the underlying earnings growth rate. Approximately $2.436 billion separated GAAP net income from adjusted net income. The reconciliation removed $2.900 billion of commodity and foreign-exchange fair-value gains and $5 million of deferred accounting amortization gains, with corresponding tax and non-controlling-interest adjustments. The quarter’s exceptionally high GAAP earnings primarily reflected the reversal of accounting losses associated with earlier movements in global gas forward curves, not a comparable expansion in recurring cash earnings.
The supplied earnings notice contains several discrepancies that materially affect interpretation. The issuer’s detailed tables show LNG loaded increasing from 550 TBtu to 672 TBtu, or 22.2%, rather than the notice’s 91%. Cargoes increased from 154 to 184, or 19.5%. The notice’s $14.68 current EPS figure is basic EPS, whereas the $7.30 historical comparator is diluted EPS. The consistent diluted comparison is $14.65 versus $7.30. These corrections preserve a strong operating result while avoiding exaggerated volume growth and mixed EPS definitions.
Sequential results were less strong than the year-over-year comparisons. EBITDA declined 22.7% from $2.333 billion in Q1, DCF declined approximately 29.9% from $1.67 billion, and exported volumes declined 2.3% from 688 TBtu. However, the quarterly filing identifies a $370 million nonrecurring excise tax credit recognized in Q1 as a reduction to cost of sales. Removing that credit from Q1 EBITDA produces an analytical comparison of $1.804 billion against $1.963 billion, a decline of approximately 8.1%. The sequential deterioration was therefore substantially smaller than the reported EBITDA comparison suggests, but it was not eliminated.
This adjustment also changes the assessment of year-to-date growth. Reported H1 EBITDA increased 25.8% to $4.137 billion from $3.288 billion. Excluding the identified $370 million credit from the current period produces $3.767 billion and growth of approximately 14.6%. This remains healthy operating progress, but the distinction is important for evaluating recurring growth. The credit was already recognized before the August guidance revision and should not be presented as a new driver of the latest $650 million increase.
GUIDANCE REVISION AND THE REMAINING-YEAR EARNINGS REQUIREMENT
The guidance trajectory has improved substantially since the original February outlook. Initial 2026 EBITDA guidance was $6.75 billion to $7.25 billion, with DCF of $4.35 billion to $4.85 billion. The May update increased those ranges to $7.25 billion to $7.75 billion and $4.75 billion to $5.25 billion. August’s ranges of $7.90 billion to $8.40 billion and $5.30 billion to $5.80 billion increased the EBITDA midpoint by 16.4% and the DCF midpoint by 20.7% relative to the original forecasts.
The new EBITDA floor exceeds the previous ceiling by $150 million, while the DCF floor exceeds the previous ceiling by $50 million. Nevertheless, the equity-market surprise was smaller than the company-guidance revision. The new EBITDA midpoint of $8.15 billion was approximately 4.0% above the supplied consensus of $7.84 billion. Consensus already exceeded the prior company guidance ceiling, indicating that some improvement had been anticipated.
The supplied DCF consensus estimate of $3.09 billion is not a reliable basis for calculating a guidance surprise without further reconciliation. It was materially below the previous company guidance floor of $4.75 billion, and the accompanying material does not establish matching definitions, periods or forecast coverage. The comparison between the company’s successive DCF guidance ranges is therefore more decision-useful than an apparent beat against that estimate.
Management provided an unusually informative bridge to the EBITDA increase. Approximately $300 million came from the additional 0.5 million tonnes in the production forecast. Approximately $200 million came from improved realization on previously open volumes together with higher Henry Hub-related lifting margins. Optimization contributed approximately $100 million to $150 million. These components broadly reconcile to the $650 million midpoint increase, subject to management’s rounding.
The production contribution represented approximately 46% of the total increase, but it was not independent of commodity prices. Davis stated: “Even adding 0.5 million tonnes, added $300 million to the guidance when margins are this high.” Using management’s approximate conversion of 1 million tonnes to 50 TBtu, 0.5 million tonnes represents about 25 million MMBtu. At the company’s normalized marketing-margin assumption of $2.50 to $3.00 per MMBtu, the same physical volume would correspond to approximately $63 million to $75 million of margin contribution before other relevant allocations and costs. The sustainable production improvement is valuable, but the latest earnings contribution substantially overstates its normalized annual value.
Full-year production guidance increased from 52 million to 54 million tonnes to 53 million to 54 million tonnes. The midpoint increased only 0.9%, from 53 million to 53.5 million tonnes, while the lower bound increased by 1 million tonnes. This was primarily an increase in confidence around the production floor rather than a new upper-end capacity forecast. Relative to the original 51 million to 53 million tonne range, the midpoint has increased approximately 2.9%.
With H1 EBITDA of $4.137 billion already reported, the revised full-year range requires H2 EBITDA of $3.763 billion to $4.263 billion. The midpoint requirement is $4.013 billion, approximately 9.8% above H2 2025 EBITDA of $3.655 billion. It also requires average quarterly H2 EBITDA of approximately $2.007 billion, about 11.2% above Q2. The guidance therefore assumes improved earnings relative to the latest quarter, supported by Stage 3 ramp-up, locked-in sales, recognition timing and sustained operational performance.
The remaining-year DCF requirement is $2.46 billion to $2.96 billion, with a midpoint of $2.71 billion. This is below H1 DCF of $2.84 billion, illustrating that the annual guidance does not require uninterrupted sequential increases in every financial measure. Maintenance spending, interest, taxes, minority interests and timing all affect the conversion from consolidated EBITDA to parent-level DCF.
The $8.15 billion EBITDA midpoint implies approximately 17.4% growth over 2025, whereas the $5.55 billion DCF midpoint implies only approximately 4.9% growth. This difference should not be interpreted simply as deteriorating operating conversion. The 2025 DCF reconciliation included a favorable $370 million current-tax contribution, while the 2026 forecast includes a current-tax deduction of approximately $100 million to $200 million. Higher interest and other deductions also matter. EBITDA growth and DCF growth are therefore being measured against materially different historical cash-conversion conditions.
LIMITED OPEN EXPOSURE DOES NOT ELIMINATE EXECUTION RISK
Management continued to forecast less than 1 million tonnes, or 50 TBtu, of unsold open 2026 volume. The presentation indicated approximately 46 million to 47 million tonnes associated with long-term contracts and approximately 5 million tonnes of forward-sold spot volumes, alongside commissioning and timing adjustments. Most of the year’s available production had therefore already been commercially committed.
The disclosed sensitivity of less than $50 million of EBITDA for a $1 per MMBtu change in market margins is consistent with this residual exposure. Even a $5 decline in margins would imply less than $250 million of direct sensitivity on those remaining open volumes, holding other factors constant. A substantial deterioration in 2026 earnings would consequently require more than lower spot LNG prices alone. Operational outages, delivery shortfalls, timing shifts, adverse procurement conditions or counterparty issues would have to contribute.
Forward selling reduces price risk but does not remove physical performance risk. A producer that has committed cargoes still needs to produce or otherwise procure them. In a tight market, an outage can create high replacement costs precisely when the value of the contracted sale is greatest. The small unsold position therefore strengthens earnings visibility without making the forecast insensitive to plant availability.
The unchanged $500 million EBITDA guidance width is consistent with these residual uncertainties. Management identified Stage 3 Train 7 commissioning and substantial-completion timing, cargoes crossing the calendar-year boundary, incremental optimization and Henry Hub-related lifting margins. The remaining uncertainty is increasingly about execution and realization rather than a large outright bet on uncommitted LNG prices.
OPERATING PERFORMANCE, RECOGNITION TIMING AND REPEATABILITY
The 672 TBtu exported during Q2 should be distinguished from the 657 TBtu of operating-project volumes recognized in income. The release separately identifies 3 TBtu of commissioning volumes and 660 TBtu of total recognized volumes including commissioning. At quarter-end, 72 TBtu were in transit, compared with 60 TBtu carried into the quarter. The net in-transit increase was therefore 12 TBtu. Several cargoes were redirected from Europe to Asia, extending voyage times and pushing recognition into Q3.
The distinction prevents an overly simple interpretation of the 15 TBtu difference between exports and operating volumes recognized in income. Part of that difference relates to commissioning rather than deferred operating revenue. Commissioning proceeds also receive different accounting treatment, including offsets against construction costs. Exported energy, recognized operational volumes and earnings contribution are related but not interchangeable measures.
Recognized operating-project volumes increased 19.5% year over year, below the 22.2% growth in loaded volumes because of timing and commissioning differences. The presentation also shows no third-party LNG volumes recognized in Q2 2026 versus 8 TBtu in Q2 2025. Including those third-party volumes produces approximately 17.7% growth in recognized operating and third-party volumes combined. EBITDA growth of 27.4% therefore reflected both increased throughput and improved economics per recognized unit, rather than volume growth alone.
The prior-year comparison benefited from the absence of a major Sabine Pass turnaround that had taken 2 trains offline for more than approximately half a month in Q2 2025. That comparison should not be extrapolated into a permanently maintenance-light operating model. Management explicitly acknowledged that a larger fleet will ordinarily have continuing planned maintenance and frequently major maintenance somewhere across the platform.
More encouraging was the discussion of reduced unplanned downtime, fewer defrost interruptions and more efficient maintenance execution. Davis indicated that accelerated Stage 3 commissioning accounted for no more than approximately 33% of the production forecast improvement since the beginning of the year. More than approximately 67% reflected the broader operating improvements. Fusco’s assessment was explicit: “Everything that we’ve mentioned, we feel good is repeatable year-over-year.” This is a meaningful statement about sustainable availability, although future results still need to demonstrate that the improvements persist across seasons and maintenance cycles.
Specific engineering changes support the credibility of the operating narrative. New fin-fans developed with Hudson reportedly deliver more than 40% additional airflow at unchanged motor amperage. Improved cooling can help alleviate hot-weather constraints, particularly at Sabine Pass. However, a 40% airflow improvement is not equivalent to a 40% increase in LNG output. Its production benefit depends on whether cooling remains the binding constraint and whether other equipment can accommodate greater throughput.
Feedgas nitrogen remains an operating variable rather than a fully extinguished risk. Management reported stabilization at approximately 1.5% nitrogen in Permian gas and described blending, process adjustments and the Gregory Power Project as mitigation tools. Diverting high-nitrogen gas streams to power generation can reduce the burden on liquefaction, but nitrogen is an inert diluent rather than a combustible fuel. The relevant economics involve gas quality, refrigeration requirements, LNG specifications and the opportunity cost of alternative gas disposition. The call did not quantify the full capital or operating cost of these mitigations, and greater Permian pipeline availability should not automatically be equated with uniformly better feedgas quality.
CORPUS CHRISTI EXECUTION AND CAPACITY OPTIONALITY
Corpus Christi Stage 3 reached 98.4% overall completion, compared with 96.5% at the end of Q1. Midscale Train 6 achieved substantial completion in June, and Train 7 was commissioning with initial LNG production expected imminently. Management expected Train 7 substantial completion during the coming months, ahead of its guaranteed 2027 date.
The incremental change relative to the previous earnings update is narrower than the comparison with the contractual guarantee implies. The Q1 release already anticipated completion of the remaining Stage 3 trains by year-end 2026. The Q2 update increased confidence in an earlier completion within that year and greater 2026 production contribution. It did not newly move the entire remaining Stage 3 program from 2027 into 2026.
Midscale Trains 8 & 9 reached 48.3% overall completion, up from 36.9% at March 31. Engineering was 91.5% complete and procurement 69.9% complete, but physical construction was only 6.7% complete. The overall percentage is therefore not a measure of installed physical completion alone. The written expected substantial-completion period remained H2 2028. Progress ahead of selected critical work streams is favorable, but it should not be treated as a formally accelerated commercial-operation date.
The June FERC authorization to increase permitted production capacity by approximately 5 million tonnes annually across Stage 3 and Midscale Trains 8 & 9 creates meaningful optionality. Management described refrigerant-mix optimization and other debottlenecking opportunities that could be implemented progressively, potentially across much of the midscale fleet over approximately the next year.
Regulatory authorization, demonstrated engineering capability and financial guidance nevertheless remain distinct. Some debottlenecking was already included in the Midscale Trains 8 & 9 investment case. Adding the entire newly authorized amount to existing production targets would therefore risk double counting. Davis clarified that the highest approved capacities are not embedded in the forecasts: “If you start going up to the high-ends of these approvals, that’s not baked in whatsoever.” This supports upside optionality, not immediate recognition of the full permitted increase.
The economic significance is substantial if higher output can be achieved without proportionate incremental capital. Debottlenecking spreads fixed infrastructure costs across more production and can improve project returns despite construction inflation. However, sustainable annual availability is more important than isolated daily production records. Higher peak rates must remain compatible with equipment limits, maintenance requirements, feedgas quality and reliable customer deliveries.
SABINE PASS EXPANSION: ATTRACTIVE STRUCTURE, INCOMPLETE ALL-IN ECONOMICS
Sabine Pass Expansion Phase 1 advanced materially through the approximately $4.7 billion lump-sum turnkey EPC contract with Bechtel. The scope includes a large-scale Train 7 with approximately 5 million tonnes of annual design capacity, a boil-off gas reliquefaction unit expected to add approximately 1 million tonnes across the facility, and related infrastructure and tie-ins. Baker Hughes will supply turbines and compressors and perform fleet-wide turbine upgrades under a separate multiyear services arrangement.
The brownfield configuration is a genuine structural advantage. The project can leverage existing marine berths, LNG storage and much of the gas infrastructure rather than duplicating the full infrastructure requirements of a greenfield terminal. This reduces capital intensity, limits certain development interfaces and supports a more competitive delivered cost.
Dividing the $4.7 billion EPC price by approximately 6 million tonnes of capacity produces an indicative EPC cost of approximately $783 per annual tonne. This is not the all-in investment cost. Owner costs, financing costs, contingency, separately contracted upgrades and other expenditure must be incorporated before calculating total capital intensity or project returns. The call did not provide sufficient detail to establish a precise project IRR or total equity requirement.
Management’s approximately 7 times capital expenditure-to-EBITDA framework was discussed most directly in connection with Midscale Trains 8 & 9 and debottlenecking. A 7 times ratio corresponds to an approximately 14.3% EBITDA yield on capital, but it is not an equity IRR or a fully burdened after-tax return. Construction duration, maintenance, taxes, financing and minority ownership materially affect shareholder economics.
Sabine Pass Phase 1 was described as fully commercialized, with financing underway and regulatory approvals expected later in 2026 to support an early-2027 FID. “Fully commercialized” indicates sufficient contractual support for the company’s investment criteria; it does not establish that every potential tonne is sold under an identical fixed-fee structure. Detailed contract pricing, contingencies and the complete project funding package were not disclosed on the call.
The proposed funding mix is approximately 50% debt and 50% equity cash flow, with the equity component supported by flexibility in CQP’s variable distribution. CQP distribution guidance remained $3.10 to $3.40 per unit despite the parent’s higher cash-flow outlook. Incremental cash is therefore being partly retained for expansion rather than automatically distributed. This can be value-accretive, but it creates a near-term distinction between growing distributable economics and cash actually paid to investors.
Early engineering and procurement reduce schedule uncertainty and secure equipment, but they also commit capital ahead of final authorization. The quarterly filing identified approximately $99 million of H1 cash investment in the Sabine Pass expansion. The remaining approval and financing conditions should therefore be treated as real investment gates, not administrative formalities.
GLOBAL LNG CONDITIONS: STRONG OPTIONALITY, NOT A PERMANENT SCARCITY ASSUMPTION
Management described a severe physical supply disruption, with Qatari and UAE exports approximately 18 million tonnes lower during Q2. The presentation showed global LNG exports declining from approximately 101.1 million tonnes to 98.3 million tonnes because growth elsewhere offset most of the lost supply. The important conclusion is that global supply expansion cushioned the disruption; the relatively modest net decline does not imply that the underlying shock was small.
The economics favor low-cost, reliable producers outside the disrupted region when international prices rise while domestic feedgas prices remain comparatively stable. Cheniere benefited from that divergence through incremental production, previously open marketing volumes and optimization. However, the company’s exposure is mediated by contracts. High global LNG prices do not reprice the entire installed production base at spot margins.
The quarterly filing states that at least approximately 90% of anticipated production from the operating and under-construction liquefaction projects is contracted through the mid-2030s, with approximately 15 years of weighted-average remaining contract life. SPA customers are generally required to pay fixed fees even when they elect to cancel or suspend cargo deliveries. IPM arrangements similarly seek to retain fixed liquefaction economics while transferring much of the underlying commodity exposure. This contractual base is the primary downside protection, subject to counterparty performance and contractual limitations.
The European storage discussion became more adverse during Q&A. Prepared remarks suggested difficulty reaching an 80% pre-winter storage level. Feygin subsequently stated that it would be “tough to get to 70%, much less 80% of inventory.” That difference is materially more informative than generic statements about tight markets. It implies a potentially weaker starting buffer and greater exposure to cold weather and competition for cargoes. It remains management’s market assessment rather than a guaranteed storage outcome.
Management estimated that each additional month of constrained Hormuz LNG flows could reduce European storage by approximately 5 percentage points, absent offsets, while a 1°C deviation in winter temperature could affect storage by approximately 10 percentage points. These are conditional sensitivities, not independently additive forecasts. Price-driven demand responses, fuel switching, pipeline flows, policy intervention and inventory behavior can change the realized effects.
China’s H1 imports declined approximately 10% to 27 million tonnes, providing flexibility through domestic gas production, pipeline imports, alternative generation and cargo redirection. Feygin cautioned that China was “at its limit for solving this issue for the world.” The investment implication is that the market may have less remaining flexibility entering winter than the H1 adjustment suggests. However, comparing China’s H1 import reduction directly with the Q2 global supply decline would mix periods and should not be treated as a complete physical balance.
The principal counterweight to near-term tightness is the large future supply pipeline. Management cited approximately 77 million tonnes of capacity reaching FID in 2025 and another 38 million tonnes during 2026 to date. These projects do not solve immediate winter shortages, but they can affect long-term contracting, terminal utilization and merchant margins. Short-term demand resilience also does not establish unlimited long-term affordability. Sustained high prices can accelerate substitution, reduce industrial consumption and weaken growth in price-sensitive importing markets.
COMMERCIALIZATION AND THE LIMITS OF THE RELIABILITY PREMIUM
Management consistently argued that Cheniere competes on reliability and partnership rather than the lowest headline liquefaction fee. Feygin described the standardized long-term contract market as a “race to the bottom” in which Cheniere does not seek to participate. Fusco emphasized that the company had not missed a foundation-customer cargo as it approached 5,000 cumulative cargoes.
That record has economic value. Reliable deliveries reduce customers’ replacement-procurement costs, portfolio imbalance risks and operational disruption. The value is particularly visible during periods when replacement LNG is scarce and expensive. It can support customer retention, access to higher-quality counterparties and a premium over less-proven suppliers.
The call nevertheless placed clear limits on the near-term commercialization opportunity. Management expressed confidence in securing mid-single-digit millions of tonnes of additional commercial support for Corpus Christi Phase 1 over approximately 12 to 18 months. It was substantially less confident that 20 million tonnes could be contracted at the desired economics over the same period.
This restraint is important because management estimated that approximately 100 million tonnes of competing supply was still seeking ultimate end-user demand. That does not necessarily mean all such capacity lacks plant-level contracts. Portfolio companies and intermediaries may hold commitments without having placed the volumes with final consumers. The competitive pressure on end-user pricing can therefore persist even when projects have already achieved financing or FID.
The investment implication is favorable for selective brownfield expansion, but less favorable for assigning full value to the entire development pipeline. The path toward 71 million to 75 million tonnes has more identifiable commercial and operating support than the broader ambition to exceed 100 million tonnes. Capacity beyond the nearer-term phases should retain an option value discounted for commercialization, capital costs, permitting and delivery timing.
ACCOUNTING CHANGE: BETTER VISIBILITY WITHOUT NEW CASH FLOW
The normal purchases and normal sales accounting designation is a meaningful reporting improvement, but not a change in underlying economics. Management described the designation as covering approximately 75% of IPM volumes and 6 of 8 agreements. The quarterly filing specifies approximately 73% of fixed minimum contractual IPM volumes at the designation date, with approximately 27% remaining outside the exception. The difference reflects the more precise filing definition rather than a material contradiction.
Previously, qualifying gas-purchase contracts were marked to market while economically related future LNG sales were recognized upon delivery. Rising international forward prices could therefore create large accounting losses on supply commitments without simultaneous recognition of the offsetting future sales economics. The reverse occurred when forward prices moderated.
The designation stops recurring fair-value remeasurement for the qualifying contracts and moves them to delivery-based accounting. It does not reverse prior reported results or create incremental EBITDA, DCF or liquidity. The large Q2 derivative gains largely arose before the mid-June designation. The accounting change should not be presented as the cause of a new cash earnings benefit.
The filing adds an important qualification to the call’s simplified description. Fair values at designation were established as new cost bases, creating net deferred NPNS assets and liabilities of approximately $349 million. These balances will be amortized over the remaining contract terms, with non-linear effects based on delivery schedules. The disclosed schedule included approximately $100 million of gains in 2027 and $101 million in 2028, followed by different effects in later periods. GAAP earnings will therefore continue to include noncash effects even for the designated portfolio.
Residual derivative exposure also remains, and contracts could return to fair-value accounting if they cease qualifying for the exception. Management’s historical illustration, under which negative net-income quarters since 2021 would have fallen from 6 to 2, demonstrates mitigation rather than elimination of volatility. Improved reporting comparability may reduce investor confusion, but it should not receive the same valuation treatment as improved cash generation.
CASH GENERATION, CAPITAL RETURNS AND FINANCING
Cheniere DCF is an ownership-adjusted non-GAAP measure after specified interest, tax, maintenance and other deductions. It is not cash remaining after all growth capital expenditure, and it is not identical to GAAP operating cash flow. This distinction is particularly important during an expansion cycle that combines repurchases with substantial debt-funded construction.
The quarterly filings show H1 operating cash flow of $2.658 billion versus $2.059 billion a year earlier. Subtracting Q1 produces Q2 operating cash flow of $1.578 billion versus $831 million, an increase of approximately 89.9%. Q2 cash expenditure on property, plant and equipment, net of commissioning LNG proceeds, was approximately $1.180 billion versus $1.024 billion. Operating cash flow less this net cash investment was therefore approximately $398 million, compared with negative $193 million a year earlier. This calculation is before minority distributions, dividends, repurchases and other investing or financing items; it is not the company’s DCF measure.
During Q2, approximately $550 million was used for repurchases, $116 million for cash dividends and $219 million of equity cash flow for growth investment. These amounts substantially reconcile to the approximately $884 million of capital allocation reported by management, allowing for rounding. Total growth investment was approximately $1.1 billion, with approximately $900 million described as debt-funded. The program is therefore not being financed entirely from cash retained after growth spending.
The financing dependence is visible in H1 cash flows, which included approximately $1.248 billion of net debt issuance and borrowings after repayments. This is not inherently negative when debt supports contracted, attractive-return assets. It does mean that repurchases, construction progress and credit quality must be evaluated together rather than as independent achievements.
The Q2 repurchase amounts imply an average purchase price of approximately $250 per share, compared with approximately $199 in Q1. The program bought fewer shares for a broadly similar cash amount as prices increased. Management’s assertion that repurchases are attractive remains a valuation judgment, not evidence of a fixed intrinsic value. The disclosed average is also not a contemporaneous market price.
Shares outstanding were approximately 206.5 million at July 31, compared with the longer-term target of 175 million. Reaching that target would require a further reduction of approximately 15.3%, before future stock issuance. At unchanged aggregate cash flow, that reduction would increase DCF per share by approximately 18.0%. The arithmetic is compelling, but the capital required depends on future purchase prices and competes with expansion equity.
The $0.555 quarterly dividend represents $2.22 annually. Management reiterated an intention to increase the dividend by at least 10% annually through the end of the decade, subject to board approval. A 10% increase would add approximately $46 million to annual cash requirements at the July share count. The dividend is therefore a relatively modest allocation compared with DCF, construction and repurchases, preserving substantial flexibility.
CQP’s issuance of $1 billion of 2036 notes at 5.350% and $750 million of 2056 notes at 6.050% extended duration and helped refinance $1.5 billion of 2027 secured notes. The new securities carry approximately $99 million of annual coupons versus $75 million on the retired notes. The approximately $24 million increase reflects both higher rates and additional principal. The transaction reduces near-term refinancing pressure, but it does not reduce absolute interest expense.
Consolidated debt was approximately $24.3 billion, and reported liquidity was approximately $7.5 billion, including cash, restricted cash and available credit commitments. These resources are not all freely distributable parent cash. Entity-level restrictions, construction commitments and the ownership of CQP remain relevant. Cheniere consolidates CQP despite owning approximately 48.6% of its limited partner interests, together with the general partner interest. Valuation based on consolidated EBITDA must therefore account properly for minority claims; parent-attributable DCF offers a useful complementary perspective.
2027 VISIBILITY AND THE DIFFERENCE BETWEEN CURRENT EARNINGS AND RUN-RATE VALUE
Davis explicitly resisted treating Cheniere as a short-term commodity vehicle, describing the business as “built for much more than as a trading proxy for prompt LNG prices.” The contractual structure supports that characterization. The detailed run-rate presentation also provides the necessary qualification: sustaining earnings comparable with 2026 under normalized commodity conditions requires additional capacity, capital and time.
For the platform including Stage 3, Midscale Trains 8 & 9 and debottlenecking, management’s normalized outlook is 60 million to 63 million tonnes of capacity, $7.3 billion to $8.0 billion of EBITDA and $4.1 billion to $4.7 billion of DCF. Including Phase 1 expansions at both Sabine Pass and Corpus Christi increases the modeled platform to 71 million to 75 million tonnes, EBITDA to $8.6 billion to $9.4 billion and DCF to $4.9 billion to $5.6 billion.
These are full-platform run-rate scenarios, not formal 2027 guidance. The lower-capacity scenario includes Midscale Trains 8 & 9, whose stated completion period remains H2 2028. The larger scenario includes expansions that had not yet reached FID at the time of the call. Treating these figures as next-year earnings would materially overstate near-term visibility.
The assumptions also matter. The presentation uses marketing margins of $2.50 to $3.00 per MMBtu, Henry Hub of $3.00, approximately 5.00% refinancing rates, a cash-tax burden of approximately 10% to 15% of DCF and specified project profit-sharing arrangements. Changes in taxes, rates or commercial terms can alter parent cash generation even if physical capacity is delivered as planned.
The 2026 DCF midpoint of $5.55 billion is above the midpoint of both normalized scenarios, including the larger platform’s $5.25 billion midpoint. This is a particularly important valuation signal. Current cash generation benefits from conditions that future capacity growth may partly replace rather than simply compound. The growth story is credible, but a larger production platform does not automatically imply proportionately higher aggregate DCF than a scarcity-enhanced year.
At the July share count, 2026 guidance implies approximately $25.66 to $28.08 of DCF per share. The normalized $4.1 billion to $4.7 billion platform implies approximately $19.85 to $22.76 at the same share count. The larger platform’s $4.9 billion to $5.6 billion DCF outlook implies $28 to $32 per share at the targeted 175 million shares. This explains how the approximately $30 long-term per-share objective depends on both expansion and substantial repurchases.
Using the approximately $250 Q2 repurchase average solely as an illustrative valuation reference, the 2026 DCF midpoint represents a yield of approximately 10.7%, while the smaller normalized platform midpoint represents approximately 8.5%. Neither measure deducts all future growth funding, and neither is a current market valuation. The comparison nevertheless demonstrates why valuing the shares solely on elevated 2026 DCF can make the business appear cheaper than a normalized assessment would suggest.
Management had forward-sold approximately 1.5 million tonnes for 2027, up from approximately 1 million tonnes at the prior call, at margins described as above $8 per MMBtu. This provides a tangible earnings cushion relative to normalized marketing assumptions. It does not establish the profitability of the entire 2027 marketing portfolio because total open capacity and the full production forecast were deferred to the next earnings call. The expected mid-50-million-tonne production profile with all of Stage 3 operating is directionally supportive, but maintenance and realized train availability remain critical.
INVESTMENT SCENARIOS, CATALYSTS AND THESIS RISKS
An illustrative base case, assigned a 60% analytical probability, places 2026 EBITDA at approximately $8.1 billion to $8.3 billion and DCF at $5.45 billion to $5.65 billion. This assumes production within the revised range, no material reliability reversal, delivery of already contracted volumes and broadly expected commissioning progress. The longer-term valuation case remains based on normalized margins and phased capacity delivery, rather than perpetual crisis pricing.
An illustrative bull case, assigned a 20% probability, places EBITDA at approximately $8.4 billion to $8.6 billion and DCF at $5.8 billion to $6.0 billion. It requires additional operational or optimization upside beyond that already embedded in guidance, favorable delivery timing and profitable realization of remaining opportunities. Higher benchmark LNG prices alone are insufficient to generate unlimited upside because most 2026 production has already been sold. The more durable bull case would include demonstrated debottlenecking gains and additional contracts at acceptable returns.
An illustrative bear case, assigned a 20% probability, places EBITDA at approximately $7.4 billion to $7.8 billion and DCF at $4.8 billion to $5.2 billion. This would require operational disruption, unfavorable recognition timing, procurement or replacement costs, or other execution shortfalls in addition to any commodity normalization. The bear case is not simply a return to lower spot LNG prices, given the limited remaining open exposure. These probabilities are analytical scenario weights, not company guidance or statistically estimated outcomes.
The immediate catalysts are Train 7’s production and substantial completion, completion of the remaining 2026 resilience work, and the next disclosure of 2027 production and uncommitted capacity. Later catalysts are regulatory authorization and financing for Sabine Pass Phase 1, an early-2027 FID, and additional Corpus Christi commercial agreements over the indicated 12-to-18-month period. Demonstrated production above existing run-rate assumptions would be more valuable than another increase in permitted capacity without corresponding operating evidence.
The thesis would weaken if the reliability improvements fail to persist, feedgas-quality issues again constrain production, maintenance requirements materially exceed assumptions, or expansion costs undermine the targeted capital efficiency. It would also weaken if additional long-term business can be secured only at economics below the company’s disciplined margin framework, or if simultaneous repurchases and construction erode investment-grade financial flexibility.
Portfolio exposure should be understood as a combination of contracted infrastructure, construction execution, interest-rate sensitivity and a smaller but economically significant international gas-spread position. It is not a clean substitute for direct LNG-price exposure. Concentration in Gulf Coast infrastructure, weather events, counterparties and capital-intensive energy projects remains relevant even when reported spot-price sensitivity is limited. An exact position size, current entry level or price-based stop cannot be established without contemporaneous valuation and portfolio exposures.
The earnings call supports higher near-term estimates and greater confidence in the operating platform. It does not support capitalizing the entire guidance increase as permanent earnings, treating the accounting change as new cash generation, or assigning full operating value to unsanctioned capacity. Existing investment cases based on contracted cash flow, reliability and disciplined brownfield expansion were strengthened. Incremental purchases require a valuation that remains attractive under normalized margins and the full funding requirements of the growth program.
COMPANY EMPLOYEES ON THE CALL
• Jack A. Fusco, Chairman, President and Chief Executive Officer. • Anatol Feygin, Executive Vice President and Chief Commercial Officer. • Zach Davis, Executive Vice President and Chief Financial Officer. • Randy Bhatia, Vice President, Investor Relations and Communications.
RESEARCH ANALYSTS ON THE CALL
• Theresa Chen, Barclays. • Jeremy Tonet, J.P. Morgan. • Spiro M. Dounis, Citi. • Keith Stanley, Wolfe Research, LLC. • Jean Ann Salisbury, Bank of America. • Olivia Foster, Goldman Sachs.
Key Read-Throughs
KEY READ-THROUGHS FROM CHENIERE ENERGY’S Q2 2026 EARNINGS CALL
The strongest cross-market implication is widening dispersion between companies that monetize internationally priced gas, companies protected by North American feedstock costs, and companies dependent on physically disrupted imports. Cheniere reported approximately 18 million tonnes of lost Qatari and UAE LNG supply during Q2, but substantial production growth elsewhere limited the net global export decline to approximately 3 million tonnes. This combination supports exceptional near-term margins without eliminating the longer-term risk of excess liquefaction capacity. The most actionable exposures are therefore determined by contractual pricing, supply geography, equipment awards and commissioning schedules, not simply membership in the LNG sector. The highest-conviction positives are internationally indexed Canadian gas production, North American nitrogen manufacturing, awarded LNG equipment and services, and remaining merchant LNG sales. The clearest negatives are prolonged disruption to Qatar-dependent import infrastructure and greater competition for contracts supporting unsanctioned export capacity. Magnitudes below refer to business and financial effects, not predicted share-price movements. Catalysts are assessed relative to the August 6, 2026 call; countries denote corporate domicile.
NATURAL GAS PRODUCERS: INTERNATIONALLY INDEXED CANADIAN GAS CAPTURES PROFITS THAT DO NOT ACCRUE TO THE LIQUEFACTION OPERATOR (READ-THROUGH 1)
Affected company: Tourmaline Oil Corp. (TOU: Canada). Direction: Positive. Magnitude: Material for its internationally indexed sales portfolio and moderately positive for consolidated cash generation, subject to hedging.
Cheniere’s discussion of its integrated production marketing agreements reveals an important distinction in where LNG profits accrue. Davis described these agreements as providing Cheniere with “stable, fixed fee economics,” while Feygin stated that “Henry Hub has remained stable throughout the period” despite sharply higher international benchmarks. Under this structure, the upstream supplier can retain international commodity-price exposure while Cheniere earns a comparatively stable processing margin. A large accounting gain or loss at Cheniere should not obscure the contractual allocation of the underlying economics.
Tourmaline is a directly verified beneficiary. Its agreement with Cheniere covers 140,000 MMBtu per day for 15 years beginning in early 2023. Cheniere pays a JKM-linked price after deductions for fixed shipping costs and a fixed liquefaction fee. The transmission mechanism is therefore unusually direct: higher Asian LNG prices increase the gas producer’s contractual realization, while largely fixed liquefaction and shipping deductions allow substantial incremental pricing to reach the upstream netback. The benefit does not require a comparable increase in Canadian domestic gas prices or Tourmaline ownership of a liquefaction terminal.
At the contracted daily volume, each $1 per MMBtu increase in the relevant realization corresponds to approximately US$51 million of annual gross revenue sensitivity before hedges, taxes, contractual adjustments and delivery variability. This is a contract-level sensitivity, not an earnings forecast. Tourmaline’s July 29 results disclosed approximately 220,000 MMBtu per day of total international pricing exposure in 2026 and stated that most costs under its LNG supply agreements were fixed. The company also disclosed substantial hedging, including approximately 100 MMcf per day in international markets, which limits incremental sensitivity to subsequent price increases.
The distinction is particularly valuable because Tourmaline simultaneously reported weak domestic gas conditions, deferred activity and additional storage injections. International pricing access can therefore improve corporate realizations even when the broader Canadian gas market remains depressed. Cheniere’s call supports differentiation between producers with contractual access to JKM or TTF and producers whose sales remain predominantly linked to domestic benchmarks.
Near-term catalyst: Realization of contracted international prices and hedge settlements through H2 2026 and the 2026–2027 winter, followed by decisions on deployment of excess cash flow. Tourmaline had already reported Q2 before Cheniere’s call, making this corroboration of the forward cash-flow mechanism rather than a prediction of an unreported quarter.
Longer-duration implication: The structural asset is access to international pricing through a reliable export platform. The current geopolitical premium is cyclical, but the ability to diversify away from Canadian pricing persists across the contract term. Cheniere’s accounting designation does not change Tourmaline’s contractual economics and should not be mistaken for the source of the benefit.
FERTILIZERS: NORTH AMERICAN NITROGEN PRODUCTION BENEFITS FROM THE GLOBAL GAS COST GAP (READ-THROUGH 2)
Affected company: CF Industries Holdings, Inc. (CF: United States). Direction: Positive. Magnitude: Potentially material to operating margins and cash flow while international nitrogen prices reflect higher-cost or disrupted supply.
The critical call evidence is the divergence between international and North American gas markets. Feygin characterized the disruption as an international supply-security event rather than a shortage of US natural gas. TTF and JKM retained substantial geopolitical premiums, while Henry Hub remained comparatively stable. Cheniere also highlighted weak European storage replenishment and increasing competition for winter cargoes, supporting the possibility that the regional gas-price gap persists beyond a brief trading spike.
CF Industries provides a cross-commodity route to monetizing that divergence. Natural gas is both feedstock and fuel in ammonia production, while nitrogen products compete in international markets. A predominantly North American production base can retain a feedstock advantage over European gas-based manufacturing even if CF’s own realized gas costs are not declining. The benefit is relative: internationally priced nitrogen products can incorporate scarcity and higher marginal production costs without an equivalent increase in North American input costs.
The cost transmission is substantial. For an illustrative ammonia plant consuming 30 MMBtu per tonne, a $1 per MMBtu widening in the gas-cost differential creates approximately $30 per tonne of relative production-cost advantage. A $5 differential creates approximately $150 per tonne. These are engineering-style sensitivities, not CF-specific realized margin forecasts. The amount retained depends on product prices, operating rates, freight, hedges and the composition of ammonia, urea and other nitrogen sales.
This is not simply a prediction that European competitors must shut down. A higher marginal cost curve can support international product pricing even before widespread curtailments occur. Conversely, North American producers do not automatically capture the entire theoretical advantage if agricultural demand weakens, buyers defer purchases or product prices normalize faster than gas costs.
CF’s August 5 release had already reported approximately $1.19 billion of Q2 adjusted EBITDA and emphasized its North American asset base. Cheniere’s call therefore reinforces the durability of the regional cost advantage rather than providing a fresh prediction of that reported result. It also strengthens the distinction between a favorable nitrogen manufacturing environment and a generalized bullish view on all chemical companies.
Near-term catalyst: H2 nitrogen pricing, customer purchasing activity and the persistence of the TTF/JKM premium through the 2026–2027 winter. Cheniere’s warning that European storage could struggle to reach even 70% increases the relevance of winter gas availability to marginal nitrogen production economics.
Longer-duration implication: Abundant North American gas remains a structural advantage for nitrogen manufacturing and selected low-carbon ammonia investments. The principal reversal risks are a sustained increase in North American gas costs, normalization of international gas supply, or sufficient new fertilizer capacity to weaken product pricing. The call supports a relative cost advantage, not indefinite crisis-level fertilizer margins.
INDUSTRIAL EQUIPMENT AND SERVICES: BROWNFIELD LNG EXPANSION FAVORS INSTALLED-BASE SUPPLIERS OVER A GENERIC CONSTRUCTION BASKET (READ-THROUGH 3)
Affected company: Baker Hughes Company (BKR: United States). Direction: Positive. Magnitude: Meaningful for its LNG equipment and service franchise; moderate at the consolidated company level, with project-specific award values undisclosed.
The relationship is explicit rather than inferred. Fusco stated that Baker Hughes would supply the turbines and compressors for Sabine Pass Expansion Phase 1. Cheniere also awarded Baker Hughes a multiyear services contract covering fleet-wide turbine upgrades at Sabine Pass. The expansion combines approximately 5 million tonnes of annual Train 7 design capacity with approximately 1 million tonnes from boil-off gas reliquefaction and additional optimization.
The most important implication is that spending is not confined to equipment for a new train. Existing turbines are being upgraded to increase power output and production across an established facility. This creates an equipment-plus-services opportunity tied to an installed base with operating infrastructure and demonstrated customer demand. Reliability work, debottlenecking and efficiency upgrades can remain economically attractive even when developers become more cautious about entirely new liquefaction projects.
The capital intensity of the project reinforces this allocation. Cheniere emphasized that the expansion does not require additional marine berths, LNG storage tanks or significant new gas pipelines. A greater share of the relevant investment opportunity is therefore concentrated in liquefaction machinery, compression, integration and upgrades rather than a full greenfield infrastructure package. The approximately $4.7 billion EPC contract belongs to privately held Bechtel and must not be attributed to Baker Hughes as revenue or orders.
The call also provided operating validation for thermal-management improvements. Fusco said new fin-fans developed with Hudson deliver more than 40% additional airflow at unchanged motor amperage and are producing tangible benefits, particularly at Sabine Pass. This does not imply a 40% increase in LNG output or a disclosed new equipment order. It demonstrates that relatively targeted upgrades can relieve bottlenecks and generate valuable additional production during high-margin periods.
Ownership and announcement timing are important. Baker Hughes completed its acquisition of Chart Industries in July 2026, so Chart should not be treated as a separate listed equity exposure. Baker Hughes had also already disclosed the Cheniere and Bechtel awards in its July 26 earnings release, alongside $7.1 billion of Industrial & Energy Technology orders. Cheniere’s call corroborates the project scope and progression; it is not a second, incremental booking of the same contracts.
Near-term catalyst: Conversion of early engineering and procurement into execution milestones, followed by Sabine Pass regulatory approvals expected in late 2026 and the targeted early-2027 FID. Much of Stage 3’s equipment has already been procured, so its imminent completion should not be presented as a fresh upstream equipment-order catalyst.
Longer-duration implication: Larger installed LNG fleets expand the addressable base for maintenance, upgrades and recurring service relationships. The strongest read-through is to lifecycle exposure and contract-backed execution, rather than an assumption that every dollar of announced LNG capacity becomes immediate supplier revenue. Project delays and customer capital discipline remain risks to timing.
LNG EXPORTERS: VENTURE GLOBAL HAS GREATER NEAR-TERM MERCHANT SENSITIVITY, BUT ITS HIGH-MARGIN WINDOW IS NOT PERMANENT (READ-THROUGH 4)
Affected company: Venture Global, Inc. (VG: United States). Direction: Positive for near-term merchant and commissioning economics. Magnitude: High relative to Cheniere’s remaining open exposure, but with correspondingly greater downside sensitivity.
Cheniere quantified the value of physical availability during the disruption. Davis attributed approximately $300 million of additional EBITDA guidance to just 0.5 million tonnes of incremental production sold into margins of approximately $10 to $13 per MMBtu. Cheniere also continued to lock in future cargoes at attractive prices, including approximately 1.5 million tonnes for 2027 at margins described as above $8.
The read-through is strongest for operating exporters with remaining merchant or commissioning volumes, not for every company that owns LNG capacity. Venture Global’s Plaquemines commissioning period creates more exposure to these economics than Cheniere’s heavily contracted operating portfolio. Higher international prices can translate into increased realized fees on remaining uncommitted cargoes without a proportionate increase in domestic feedgas costs.
Venture Global’s May 12 disclosure provides the relevant exposure benchmark. It raised 2026 EBITDA guidance to $8.2 billion to $8.5 billion and assumed $9.50 to $10.50 per MMBtu for remaining unsold cargoes. It disclosed approximately $300 million to $350 million of full-year EBITDA sensitivity to a $1 change in the relevant liquefaction fee. Cheniere’s August disclosure indicated less than $50 million of sensitivity to a $1 change in market margins.
These figures are not synchronized hedge-book comparisons: Venture Global’s position was disclosed in May and could change materially through subsequent sales. Nevertheless, they establish the distinction between the business models and the potential scale of residual exposure. At Venture Global’s May sensitivity, a $2 change would correspond to approximately $600 million to $700 million of EBITDA movement. The same sensitivity that supports upside also creates substantial downside if margins normalize before cargoes are sold.
Cheniere’s $10 to $13 margin commentary supports the plausibility of a strong pricing environment, but it should not be mechanically inserted into Venture Global’s model. Shipping obligations, fee definitions, sales dates, procurement costs and delivery terms differ. Venture Global had already made a large guidance increase in May, so the call primarily strengthened confidence in the pricing assumptions rather than proving another unanticipated upgrade.
Near-term catalyst: At the Cheniere call date, Venture Global’s next scheduled results were August 11. The most informative disclosures were updated realized fees, the percentage of remaining cargoes sold, physical export performance and any change to commodity sensitivity.
Longer-duration implication: The merchant opportunity changes as Plaquemines enters contractual commercial service. Venture Global’s stated targets were Q4 2026 for Phase 1 and mid-2027 for Phase 2. Transitioning to long-term contracts increases cash-flow durability but changes the availability of high-margin commissioning sales. Elevated 2026 profitability should therefore not be capitalized as an unchanged perpetual earnings stream. Execution, delivery commitments and replacement-cargo costs remain critical risks.
LNG DEVELOPERS: A SECURITY-OF-SUPPLY PREMIUM DOES NOT REMOVE COMPETITION FOR LONG-TERM CONTRACTS (READ-THROUGH 5)
Affected company: NextDecade Corporation (NEXT: United States). Direction: Negative for the valuation and commercialization assumptions attached to unsanctioned expansion capacity. Magnitude: Limited direct effect on near-term earnings, but potentially material to incremental project value and financing requirements.
The most important negative industry disclosure was Cheniere’s qualification of the contracting opportunity. Feygin estimated that approximately 100 million tonnes of competing supply was still seeking ultimate end-user demand. He described a “race to the bottom” in standardized long-term contracts and expressed confidence in securing mid-single-digit millions of tonnes at the desired economics over 12 to 18 months, while being less comfortable that 20 million tonnes could be contracted on that timetable.
This is a warning against assuming that high current LNG prices automatically produce strong long-term tolling fees for all new capacity. Buyers can simultaneously face a near-term physical shortage and expect more competitive supply after the next construction wave. The commercial decisions occur at different points on the supply curve. Security of supply increases interest in diversification, but the benefit must compete with a substantial inventory of future LNG.
NextDecade’s July 30 update makes the exposure specific. Trains 1 through 5 were already under construction, while Train 6 remained in development with EPC and long-term offtake discussions progressing. The company targeted a Train 6 FID in H2 2027, supported by an environmental review schedule calling for a final environmental impact statement on June 25, 2027. This places commercialization within the period during which Cheniere expects substantial competition for end-user contracts.
The transmission mechanism is through contract pricing, timing and financing, not an immediate reduction in existing plant revenue. Lower achievable fees reduce project EBITDA and debt capacity. A longer contracting process delays FID and cash generation while extending development spending. Maintaining fee discipline may preserve project returns but slow expansion; accepting weaker pricing can accelerate contracting at the expense of economic value.
The distinction between sanctioned and unsanctioned capacity is essential. Cheniere’s commentary is not evidence that NextDecade’s existing contracts have been repriced, that its first 5 trains have lost financing, or that Train 6 cannot proceed. NextDecade had already reported constructive construction progress and expected initial LNG production in H1 2027. Its use of Bechtel also provides an established execution partner. The negative read-through applies specifically to assumptions that future expansion can be commercialized quickly at attractive fees simply because current spot prices are high.
Near-term catalyst: Additional Train 6 offtake agreements, EPC terms and financing disclosures. Contract economics and conditions matter more than announced volume alone.
Longer-duration implication: Demonstrated operating reliability and low incremental infrastructure costs become more important competitive differentiators. Cheniere’s approaching 5,000-cargo record supports its premium positioning, while developers must establish their own delivery histories. Future capacity should be valued with project-specific commercialization probabilities rather than at the same multiple as operating, contracted infrastructure.
ASIAN LNG IMPORT AND REGASIFICATION: PETRONET FACES PHYSICAL VOLUME RISK, NOT A SIMPLE LNG-PRICE WINDFALL (READ-THROUGH 6)
Affected company: Petronet LNG Limited (PETRONET: India). Direction: Negative for throughput visibility, replacement-supply economics and the utilization ramp of expanded infrastructure. Magnitude: High at the affected supply and terminal level; potentially material but contractually moderated at the earnings and cash-flow level.
The call described LNG tanker transits through Hormuz recovering to less than 10% of pre-conflict levels through quarter-end, with approximately 18 million tonnes of lost Qatari and UAE supply. Feygin emphasized that restarting LNG exports requires coordinated recovery across upstream production, liquefaction, shipping and scheduling. This makes a ceasefire or partial recovery in crude tanker movements an insufficient signal that LNG supply has normalized.
Petronet has a directly identifiable exposure through its longstanding 7.5 million tonne annual Qatar supply agreement, renewed for deliveries from 2028 through 2048. The current agreement runs through 2028, while the renewal shifts to delivered terms. Neither a long contractual duration nor a change in shipping responsibility eliminates the physical concentration associated with the export route.
The primary transmission mechanism is lower or less predictable throughput, followed by the availability and affordability of replacement cargoes. Petronet’s infrastructure earns value from processing gas, not merely from a higher international LNG benchmark. If customers cannot source cargoes, or replacement prices reduce downstream consumption, terminal utilization and associated cash generation can weaken. Higher LNG prices are therefore not automatically positive for an LNG importer or regasification operator.
Petronet’s May 5 call had already demonstrated the operating sensitivity: management reported Dahej utilization of approximately 53% in March, while describing an improvement from replacement cargoes as prices moderated. Cheniere’s August assessment that the disruption remained severe challenges the durability of a simple normalization scenario. It does not establish that Petronet’s utilization remained continuously depressed after March or that alternative sourcing had failed.
Contractual protections materially qualify the earnings conclusion. Petronet has capacity-booking and use-or-pay arrangements, and its prior quarter included collection of approximately INR 630 crore of older use-or-pay dues and related accounting effects. Reported profits can therefore remain resilient even when physical throughput deteriorates. Conversely, contractual billing does not guarantee immediate cash collection. The relevant risks include the enforceability and timing of payments, force-majeure interpretations, customer financial capacity and the economics of expanded terminal capacity.
The call also highlighted selective demand destruction and fuel switching in South and Southeast Asia. This creates an additional constraint: replacing Qatari volumes with higher-priced cargoes does not necessarily restore the original quantity demanded. Cheniere’s observation that US LNG was being redirected toward higher-value Asian markets confirms flexibility of supply, but not affordability for every Indian end market.
Near-term catalyst: The subsequent August results, cargo arrivals, terminal throughput and the recovery of sustained LNG exports through Hormuz. Utilization and cash collections are more informative than revenue alone because commodity-price changes can obscure underlying volumes.
Longer-duration implication: Diversification away from concentrated supply routes and additional storage can improve security, but they require capital and may carry higher procurement costs. Those expenditures create value only if contractual tariffs, customer commitments or other returns compensate for them. The high-conviction negative is prolonged disruption to physical utilization and the normalization timetable, not an assumption that Petronet absorbs the full spot-price increase as an unhedged trading loss.
Report record
- Sector
- Energy
- Industry
- Oil & Gas Storage & Transportation
- Fiscal period end
- June 30, 2026
- Report date
- August 6, 2026
- Analysis
- 6261 words
- Read-throughs
- 3134 words
- Content fingerprint (PDF)
37d10108f0c8- Content fingerprint (analysis)
4304567179fa- Content fingerprint (read-throughs)
8c71fdf67a17
Prepared from the company's earnings release and earnings call transcript. Figures as reported by the company. For information only. Not investment advice.
More from Cheniere Energy Inc
No other reports yet.
All Cheniere Energy Inc reports
More in Energy
Exceptional Margins Strengthen the Near-Term Outlook; Duration Decides the Rest
Better long-term visibility, not immediate earnings acceleration
Follow @AtlasPeakRes on X for new earnings reports as they publish.