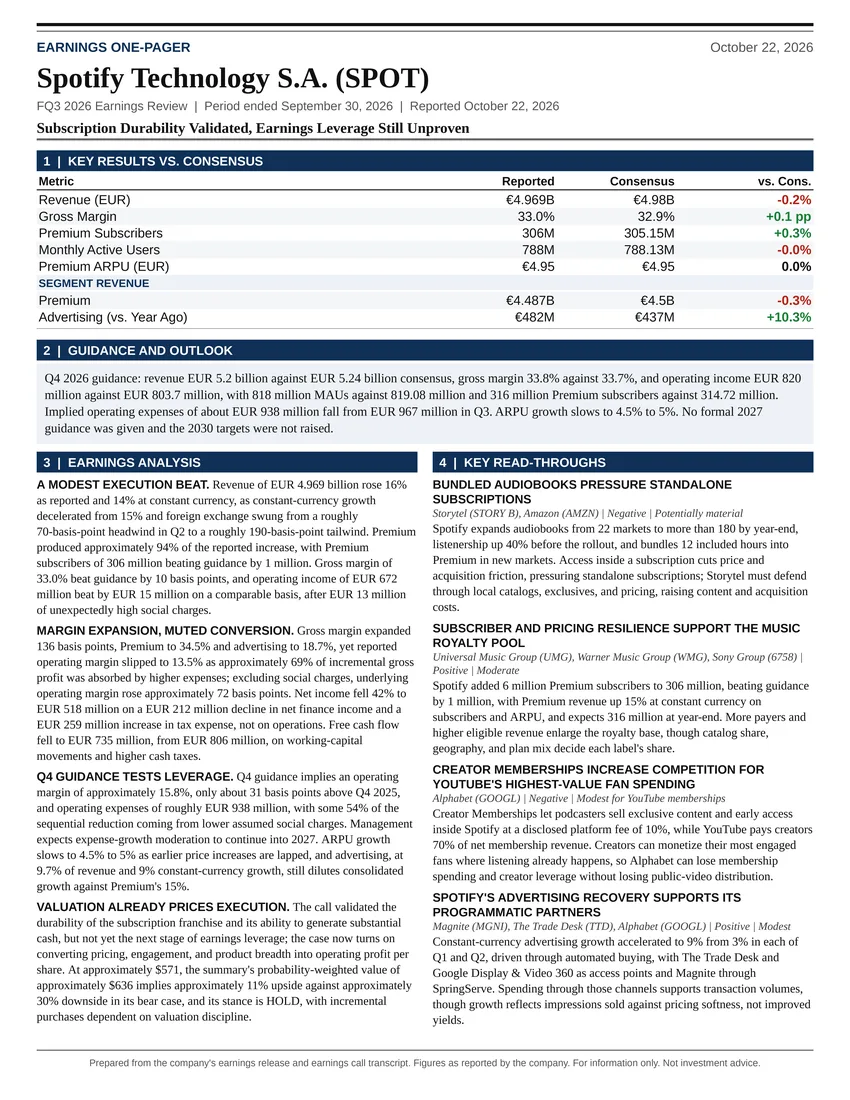
Subscription Durability Validated, Earnings Leverage Still Unproven
Earnings Reports
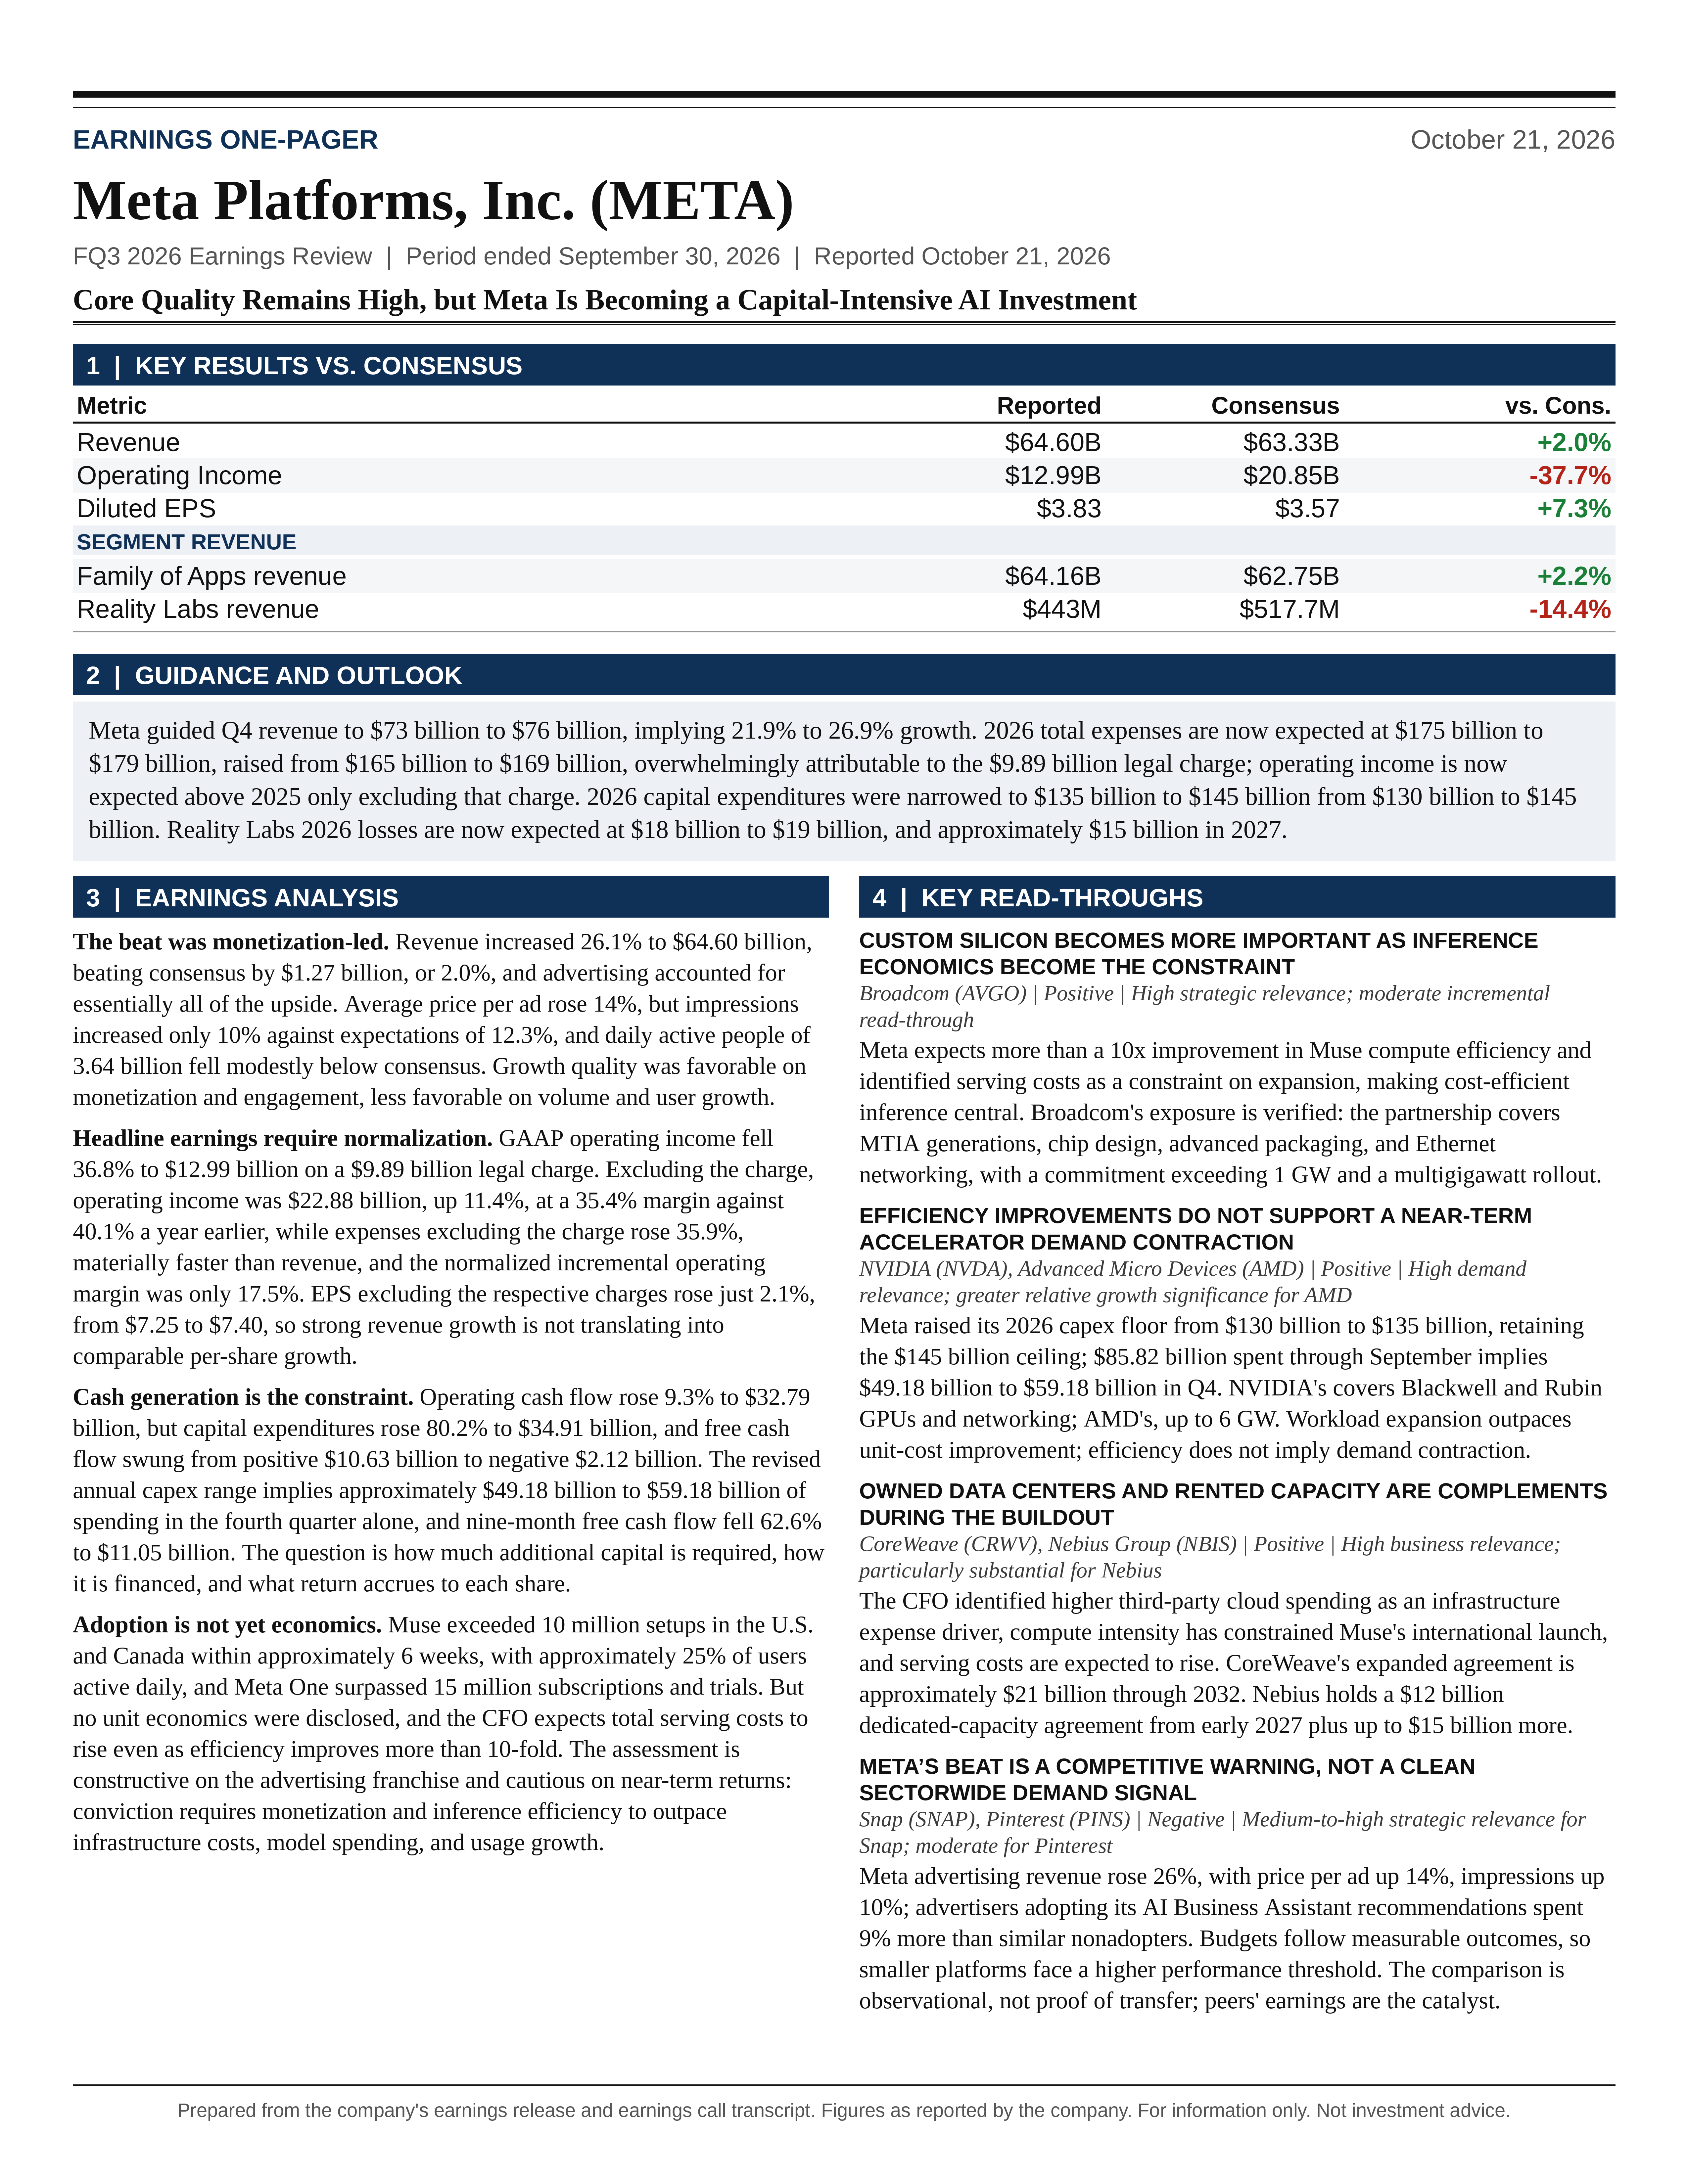
Meta Platforms, Inc. FQ3 2026 Earnings Report
Meta Platforms, Inc. (META) FQ3 2026 earnings: Core Quality Remains High, but Meta Is Becoming a Capital-Intensive AI Investment. Full earnings analysis, key read-throughs, and the one-page exhibit from Atlas Peak Research.
Meta Platforms, Inc. (META)
Sector: Communication Services · FQ3 2026 · Period end September 30, 2026 · Reported October 21, 2026
Meta’s Q3 2026 results support a constructive assessment of the core advertising franchise but a more cautious assessment of near-term equity returns.
Download the one-page report (PDF)
View one-page exhibit
Download analysis (.md)
Download read-throughs (.md)
Post to X
One-Page Exhibit
Earnings Analysis
EXECUTIVE CALL SUMMARY: Meta Platforms Inc. (10/21/26)
Meta’s Q3 2026 results support a constructive assessment of the core advertising franchise but a more cautious assessment of near-term equity returns. Revenue growth remains strong, AI-driven advertising improvements are producing measurable commercial benefits, and Muse has demonstrated substantial initial consumer adoption. However, the quarter also confirms that Meta is becoming significantly more capital intensive before the economics of its new AI businesses have been established. The appropriate investment stance is HOLD/NEUTRAL rather than an immediate increase in exposure based solely on the revenue beat or early Muse adoption. Greater conviction requires evidence that monetization and inference efficiency can outpace the combined growth of infrastructure costs, model development spending, and customer usage.
Revenue of $64.60 billion increased 26.1% year over year and exceeded Bloomberg consensus by $1.27 billion, or 2.0%. Advertising accounted for essentially all of the upside. The quality of growth was favorable in terms of advertiser monetization, with average price per ad increasing 14%, but less favorable in terms of volume, with impressions increasing 10% against expectations of 12.3%. Daily active people of 3.64 billion also fell modestly below consensus. The quarter was therefore primarily a monetization and engagement success rather than a user-growth surprise.
The headline earnings figures require substantial normalization. GAAP operating income declined 36.8% to $12.99 billion, reflecting a $9.89 billion legal charge. Excluding that specific charge, operating income was $22.88 billion, up 11.4%, with an operating margin of 35.4% versus 40.1% a year earlier. Expenses excluding the charge increased 35.9%, materially faster than revenue. The legal settlement explains most of the reported profit decline, but it does not explain the underlying margin compression. The normalized incremental operating margin was only 17.5%, indicating that a relatively small proportion of incremental revenue reached operating profit.
The reported EPS increase from $1.05 to $3.83 is particularly misleading as an indicator of economic growth because Q3 2025 included a substantial tax charge. Meta’s earnings releases indicate EPS of $7.40 for Q3 2026 excluding the current legal charge and $7.25 for Q3 2025 excluding the prior tax charge. On that explicitly limited normalization, EPS increased only 2.1%. Strong revenue growth is therefore not translating into comparable per-share earnings growth.
Cash generation is the more important constraint. Operating cash flow increased 9.3% to $32.79 billion, while capital expenditures increased 80.2% to $34.91 billion. Free cash flow consequently deteriorated from positive $10.63 billion to negative $2.12 billion. The revised annual capital expenditure range implies approximately $49.18 billion to $59.18 billion of spending in Q4, substantially above Q3. This is not merely a question of accepting lower accounting margins during an investment cycle. It is a question of how much additional capital will be required, how that capital will be financed, and what economic return will ultimately accrue to each share.
The central strategic change is the transition from using AI predominantly to improve advertising toward simultaneously building a consumer agent network, a model and enterprise platform, and a hardware distribution system for personal agents. The opportunity is substantial, but the risk profile is different from that of a primarily advertising-funded social platform. Zuckerberg’s statement that Meta must “scale the product, grow revenue, and optimize compute costs” accurately identifies the investment debate. None of these objectives can be evaluated independently: faster adoption can increase losses if monetization and cost efficiency do not advance sufficiently quickly.
QUARTERLY PERFORMANCE AND THE QUALITY OF THE BEAT
Total revenue increased from $51.24 billion in Q3 2025 to $64.60 billion and rose 6.2% sequentially from $60.80 billion in Q2 2026. Reported growth moderated from 28% in Q2 to 26% in Q3, while constant-currency growth moderated from 27% to 26%. The underlying business therefore remained robust, although the results do not demonstrate accelerating companywide revenue growth.
Actual revenue also exceeded the $61 billion to $64 billion range issued with the July 29 Q2 earnings release. Revenue was 0.9% above the upper end and 3.4% above the midpoint. The prior guidance assumed an approximately 1% currency headwind. The current release shows constant-currency revenue of $64.71 billion, only $113 million above reported revenue, indicating that the realized headwind was smaller. Some of the outperformance against the earlier reported-dollar outlook therefore benefited from currency relative to the original assumption. The entire revenue beat should not be attributed to operating execution.
Advertising revenue was $63.06 billion, up 25.9% and approximately 2.0% above consensus of $61.85 billion. Family of Apps revenue was $64.16 billion, approximately 2.2% above consensus. Other Family of Apps revenue was $1.10 billion, up 59%, but essentially in line with expectations. Reality Labs revenue of $443 million was 14.4% below consensus of $517.7 million. The revenue surprise was consequently concentrated in the established advertising franchise rather than in the emerging hardware or nonadvertising businesses.
Advertising represented approximately 97.6% of consolidated revenue. Despite the breadth of discussion around agents, subscriptions, enterprise services, and glasses, the current financial model remains overwhelmingly dependent on advertising. Revenue diversification is a strategic objective rather than an accomplished financial transition.
The operating-income and EPS consensus comparisons require caution. GAAP operating income of $12.99 billion was 37.7% below the supplied $20.85 billion consensus, while EPS of $3.83 was 7.3% above the supplied $3.57 estimate. These apparently conflicting signals cannot be reconciled confidently without knowing how each consensus series incorporated the legal charge and associated tax treatment. Adding back the legal charge produces operating income above the headline consensus, but that is not sufficient to establish a comparable adjusted earnings beat. The revenue comparison is considerably cleaner than the profit comparison.
USER GROWTH, ADVERTISING VOLUME, AND PRICING
Family daily active people increased from 3.54 billion a year earlier and 3.60 billion in Q2 to 3.64 billion. This represents approximately 2.8% annual growth and 40 million sequential additions. The result was 20 million below consensus, or approximately 0.5%. The shortfall is modest, but the broader implication is important: Meta’s revenue growth increasingly depends on extracting more economic value from existing users rather than on rapid expansion of the user base.
Ad impressions increased 10%, compared with 14% in both Q2 2026 and Q3 2025. Average price per ad increased 14%, compared with 12% in Q2 and 10% a year earlier. The combination of 10% impression growth and 14% pricing growth produces approximately 25.4% advertising growth before rounding and other measurement effects, closely matching the reported result. Relative to consensus, the mix shifted away from volume and toward yield.
Higher average pricing is economically favorable when it reflects better advertiser outcomes rather than simply higher auction costs. Management attributed pricing growth to stronger ad performance and improved macroeconomic conditions relative to the prior year. These are distinct drivers. Better conversion prediction and creative performance can support durable market-share gains, whereas stronger advertiser demand is more cyclical. The call did not quantify their respective contributions.
Using period-end monthly-average daily users as a rough denominator, advertising revenue per daily active person increased approximately 22.5%. This is not an official average-revenue metric because quarterly revenue and September daily users are not perfectly matched measurement periods. Nevertheless, it illustrates how heavily the quarter depended on increased monetization and engagement per person.
Similarly, the combination of approximately 2.8% daily-user growth and 10% impression growth implies roughly 7% growth in impressions per daily active person. That increase can reflect more time spent, changes in surface mix, and ad-load optimization. It cannot be attributed exclusively to improved recommendation quality. This distinction matters because engagement-led inventory expansion is generally more sustainable than repeatedly increasing commercial density.
The favorable interpretation is that Meta is improving advertiser value sufficiently to increase both inventory and realized pricing. The more cautious interpretation is that a growing proportion of revenue growth now rests on monetization improvements that must offset slower user and impression growth. A deterioration in advertiser demand would therefore expose the business to a more difficult growth comparison than the headline 26% rate suggests.
CORE AI RETURNS ARE VISIBLE, BUT THEIR INCREMENTAL ECONOMICS REMAIN INCOMPLETE
The strongest evidence supporting Meta’s AI investment thesis remains within advertising and recommendations, where management disclosed specific product interventions and measured outcomes. Instagram time spent per user increased at a double-digit rate and reached a record. Facebook Reels time spent also reached records globally and in the U.S. Threads time spent per user increased more than 20%.
The recommendation architecture is becoming more sophisticated in economically relevant ways. Ranking sequences of Reels rather than treating each item independently can optimize the overall viewing session instead of maximizing the predicted appeal of the next item in isolation. Richer watch-time signals improve the model’s ability to distinguish superficial exposure from meaningful engagement. Management attributed more than a 4% increase in Instagram Reels time spent to Q3 relevance launches.
Facebook’s generative retrieval architecture addresses a different constraint: identifying relevant content before it has accumulated enough engagement history to rank effectively under older systems. The architecture had reached approximately 25% of unconnected Feed views and 50% of Reels views, producing a 1% increase in Reels watch time. The remaining rollout creates potential incremental benefit, but partial deployment also means that the reported improvement should not be treated as a completed, fully scaled contribution.
Content freshness improved substantially. Nearly 45% of recommended Instagram Reels were less than 1 day old, an increase of more than 11 percentage points from Q2. This suggests that Meta is improving its ability to distribute newly created content, which can strengthen creator incentives and increase the relevance of recommendations. However, fresher content is an intermediate operating metric. Its financial value depends on sustained engagement, advertiser conversion, and the cost of processing and ranking that content.
The migration of content-understanding workloads onto Meta’s Muse model family is potentially important for vertical integration. Management reported better offline evaluation results and more than an 80% reduction in per-unit content-processing costs across Instagram, Threads, Facebook, and ads. This supports the proposition that internally developed models can improve both quality and efficiency. It does not establish an 80% reduction in aggregate AI costs, total inference spending, or companywide cost of revenue. The disclosure applies to a particular workload and remains partly based on offline evaluation.
On advertising, generative retrieval on Facebook Feed increased conversions by nearly 2% within targeted segments. Andromeda improvements increased Facebook conversions by 1.4%. The expanded GEM ranking model delivered a reported 9.6% improvement in app-ad conversions. The supplied transcript’s off-site conversion figure is internally garbled and should not support a precise financial assumption.
These gains cannot be added together as if they were independent increases in consolidated revenue. They concern different populations, surfaces, campaign objectives, and evaluation windows, with potentially overlapping exposure. Conversion improvements can translate into higher advertiser returns, higher advertiser spending, or both, but the relationship is mediated by budgets, auction dynamics, and attribution.
Zuckerberg’s statement that Meta has “not yet found the limit of how effectively we can apply compute to accelerating our own core business” is strategically significant but financially incomplete. The relevant investment criterion is not whether additional compute can improve recommendations. It is whether the incremental revenue and contribution profit exceed the fully loaded cost of that compute, including depreciation, energy, networking, model development, and capacity reserved for peak demand. The current call provides stronger evidence of revenue effectiveness than of marginal return on invested capital.
ADVERTISER TOOLS, CREATOR COMMERCE, AND SUBSCRIPTIONS
Meta AI Business Assistant is becoming a mechanism for increasing advertiser adoption of the broader platform. Management estimated that advertisers adopting its recommendations generated almost 5% more conversions at the same cost per conversion and increased advertising investment by 9% relative to similar nonadopters. This is directionally supportive of monetization because it suggests that better campaign execution can expand budgets rather than merely redistribute spending within Meta.
The comparison remains observational as presented. Advertisers that adopt recommendations may differ from nonadopters in sophistication, growth ambitions, or willingness to experiment. The call did not establish randomized assignment, cohort comparability, or the persistence of the effect. The evidence supports a favorable product signal, but not a mechanically scalable 9% increase in the advertising revenue base.
The Simply Organic Maple example illustrates how improved messaging can materially change campaign performance, with a 57% increase in purchases and a 36% reduction in cost per purchase. It is not representative evidence of average advertiser economics. Its principal significance is that conversational assistance can make optimization techniques accessible to smaller businesses that lack dedicated marketing teams.
Nearly 10 million advertisers used at least 1 generative AI creative tool during Q3, while adoption of video-generation features increased 25% sequentially. These disclosures indicate meaningful distribution. They do not establish paid adoption or incremental software revenue because the tools can be monetized indirectly through advertising performance and higher platform spending.
Partnership ads exceeded a $15 billion annual revenue run rate and grew more than 97% year over year. This is already a financially material product category, equivalent to roughly 6% of annualized Q3 advertising revenue. However, partnership ads are included within existing advertising revenue. Adding their run rate separately to the advertising forecast would double count revenue. Their importance lies in improving Meta’s positioning within creator-led commerce and potentially increasing the effectiveness and authenticity of commercial content.
Meta One surpassed 15 million subscriptions and trials following its broader rollout. The inclusion of trials is material: this is not a disclosure of 15 million paying subscribers. Revenue modeling requires trial-to-paid conversion, realized pricing, churn, product mix, and the incremental inference cost of expanded AI usage. Meta One accounts also should not be added to Muse users as if they represented separate, nonoverlapping customer populations.
The current nonadvertising revenue base remains small. Family of Apps other revenue increased rapidly to $1.10 billion, driven primarily by WhatsApp paid messaging and subscriptions, but still represented only approximately 1.7% of consolidated revenue. This offers substantial percentage-growth potential while limiting near-term diversification of the earnings base.
MUSE ADOPTION: PROMISING PRODUCT SIGNALS, NOT YET PROVEN UNIT ECONOMICS
Muse exceeded 10 million setups in the U.S. and Canada within approximately 6 weeks. Approximately 25% of people who had set it up used it on a given day, implying roughly 2.5 million daily users at the disclosed scale. This is a strong initial engagement signal for a new product, particularly given its limited geographic availability.
The relevant distinction is between installations, completed setup, daily activity, weekly activity, paying accounts, and monetizable transactions. These measures describe different stages of the customer funnel. The call alternated between several denominators, and the resulting metrics should not be treated as interchangeable.
Management described retention as improving among early adopters, with Zuckerberg stating that “the longer that they use muse, the better that retention seems to get.” This is encouraging, but the evidence remains early. No detailed retention curve, cohort aging schedule, paid retention measure, or acquisition-cost disclosure was provided. Comparisons with Threads and other AI applications also lack standardized measurement definitions.
The absence of a global rollout is simultaneously an opportunity and a constraint. Geographic expansion could substantially increase adoption, but management explicitly identified compute intensity, local optimization, and connector development as limiting factors. Global growth is therefore not simply a matter of activating existing distribution. It requires economically viable inference, market-specific integrations, and appropriate permissions.
The company’s ambition to serve more than 1 billion people over the next several years is a strategic objective rather than a near-term user forecast. Moving from 10 million setups to 1 billion users would represent an approximately 100-fold expansion in scale. Even allowing for Meta’s distribution advantages, that transition requires sustained retention, international relevance, and a major increase in serving capacity.
Muse Wonder’s reported improvement in quality, engagement, and retention supports management’s argument that model capability can expand product utility. However, Wonder is currently available through the paid tier, while Muse Spark is the default free-tier model. Without controlled comparisons, observed behavior may reflect both model quality and differences between paying and nonpaying users.
The strongest near-term conclusion is that Muse has demonstrated substantial consumer interest and potentially valuable use cases. The stronger claim that it already has durable, economically scalable product-market fit remains unproven. Product desirability and profitable distribution are separate milestones.
MUSE MONETIZATION AND THE COMMERCE OPPORTUNITY
The proposed business model combines business-funded transaction fees, consumer subscriptions, business subscriptions, enterprise usage, and optional integration with Meta’s advertising and content ecosystem. This creates multiple potential monetization paths, but it also complicates the assessment of incremental revenue because the same user or merchant can already contribute to Meta’s existing advertising business.
Shopping is the most frequently cited Muse use case. The CFO specified that more than 25% of weekly active users engaged in shopping, while management described average purchase size as exceeding $200. The call did not disclose completed order volume, transaction frequency, gross merchandise value, cancellation rates, return rates, or the share of purchases for which Meta currently earns a fee.
The daily-use percentage and weekly-shopping percentage should not be multiplied together to estimate transaction volume. Their denominators and measurement windows differ. Nor does engagement in shopping necessarily imply a completed purchase. Product research, comparison, itinerary planning, and execution can all form part of the shopping workflow.
Travel is included in the broader commerce discussion. This matters because high-ticket travel transactions can raise average purchase value without implying high recurring purchase frequency. Merchant margins and willingness to pay also vary substantially between travel, general retail, services, and subscription products.
Zuckerberg’s comparison with the existing Family of Apps revenue generated by Muse’s American users requires careful interpretation. He clarified that the reference was to revenue already associated with those users in the existing app ecosystem, not current Muse revenue. This is a potentially high-value, self-selected cohort. Its existing monetization should not be extrapolated to a global Muse population or treated as incremental agent revenue.
The arithmetic illustrates the scale of the commercialization challenge. At an illustrative $300 of annual commerce revenue per user and a 3% transaction fee, Meta would need to facilitate $10,000 of annual transaction value per user. At an illustrative $200 order value, that would require 50 completed orders annually. Subscriptions and advertising could reduce the required commerce contribution, but this sensitivity demonstrates why strong shopping engagement alone is insufficient to validate the long-term revenue aspiration.
There is also a potential allocation issue within merchant acquisition budgets. A business paying Meta both for advertising and for agent-facilitated transactions may evaluate the combined cost of customer acquisition. Transaction fees could create a genuinely incremental revenue pool if agents generate new demand or materially improve conversion. Alternatively, some spending could migrate from existing advertising budgets. Long-term forecasts should therefore measure net incremental economics across Meta rather than assume that every agent revenue stream is additive.
Management acknowledged the need to monetize earlier than in previous product launches. Zuckerberg stated that Meta would “work on monetization somewhat sooner on this than our normal playbook.” That is an economically necessary departure from the historical strategy of prioritizing scale before monetization. Unlike a new social surface, an autonomous agent can incur substantial variable cost through repeated model calls, external tools, browsing, and transaction execution.
AGENTIC COMMERCE, PERMISSIONS, AND COMPETITIVE CONTROL
The discussion of merchant resistance was important because it addressed a structural obstacle rather than a product feature. Some businesses benefit from agent-generated demand, while others risk losing control over customer relationships, product presentation, pricing, and cross-selling.
The CFO’s expectation that the market will move toward “more permissioned, structured interactions” is more economically credible than a model based indefinitely on agents navigating every digital interface as if they were human users. Authenticated APIs and approved agent partnerships can reduce execution failures, improve identity verification, and establish clearer responsibility for transactions.
The proposed personal agent protocol, developed with partners including Sierra, Walmart, Stripe, and Shopify, could improve interoperability. However, participation in developing a standard does not establish commercial exclusivity, guaranteed transaction volume, or agreement on take rates. An open standard may accelerate adoption while also enabling competitors to participate in the same ecosystem.
The strongest potential network effect would arise if consumers increasingly used Muse to express intent and businesses increasingly maintained agents capable of responding to that intent. The resulting advantage would depend on transaction reliability, identity, permissions, reputation, and access to useful integrations, not simply on the number of registered users.
This model also creates a potential conflict between consumer optimization and merchant monetization. A personal agent is expected to act in the user’s interest, while a commerce platform seeks fees and potentially advertising revenue from businesses. The design of recommendations, sponsored placements, and fee disclosure will affect trust. A monetization model that weakens confidence in the agent’s independence could undermine retention and conversion.
Security is particularly consequential because the product can connect to financial services, email, calendars, and business systems. The planned Confidential VM may strengthen privacy protections, but it was described as forthcoming rather than fully deployed. Secure execution environments also do not independently resolve transaction authorization, malicious external content, inappropriate connector access, fraud, or recovery from incorrect actions.
The CFO’s acknowledgment that many near-term experiences will remain AI-assisted rather than fully autonomous is therefore important. It suggests a more gradual commercialization path than the eventual vision of seamless agent-to-agent transactions might imply.
INFERENCE EFFICIENCY AND THE RISK OF RISING TOTAL COSTS
Management expects more than a 10-fold improvement in Muse compute efficiency over the next year. At constant workload and quality, a 10-fold efficiency improvement would imply approximately a 90% reduction in unit serving cost. The targeted mechanisms include off-peak utilization, smaller models, inference optimization, higher GPU utilization, and fewer tokens per completed task.
The absolute cost base was not disclosed. When directly asked about per-user economics, the CFO stated that specific numbers were not available. Without cost per active user, cost per completed task, task frequency, or paid-user contribution margin, the profitability claim cannot be independently tested.
The most important qualification came from the CFO: “we expect total serving costs to rise.” Unit-cost improvement and aggregate-cost growth are entirely compatible. At unchanged activity per user, expanding the installed base by 100-fold while reducing unit costs by 10-fold would still increase total serving costs by approximately 10-fold. More proactive agents or more complex tasks could increase the spending requirement further.
There is also a moving-quality problem. Management expects current frontier capability to become cheaper, but users may demand more advanced models rather than remain satisfied with today’s performance. Cost savings at constant intelligence can therefore be reinvested in higher intelligence, longer context, more tool use, and more ambitious tasks instead of flowing into margins.
Off-peak utilization is economically attractive when work can be deferred. It is less useful for latency-sensitive interactions requiring immediate responses. As utilization rises, the amount of genuinely spare capacity can also decline. A low marginal cost on otherwise idle equipment is not equivalent to an attractive fully loaded return on infrastructure built specifically to support incremental demand.
The claim that training is a large fixed cost supports serving additional inference demand across multiple products. Nevertheless, frontier training is not permanently fixed in an economic sense. Successive model generations require recurring investment, and serving workloads compete for capital, power, engineering resources, and infrastructure capacity. Enterprise and consumer profitability should therefore be evaluated after an appropriate allocation of model development and infrastructure costs, not solely against marginal token expense.
The key disclosure improvement would be an economic measure tied to successful outcomes: contribution profit per retained active user or per completed transaction, including the cost of unsuccessful attempts. Token efficiency alone can improve while the cost of delivering a reliable end-to-end service remains elevated.
ENTERPRISE AND SMALL-BUSINESS STRATEGY
Meta’s enterprise opportunity spans model APIs, Muse Code, business agents, workplace deployments, and tools for small-business owners. Existing distribution through advertising accounts, Facebook Pages, Instagram, and WhatsApp creates a credible advantage, particularly among businesses underserved by traditional enterprise software.
The claim that at least 500 million self-identified small businesses use the Family of Apps indicates substantial reach. It should not be interpreted as 500 million paying software customers, verified legal entities, or immediately addressable subscription accounts. The figure derives from a user survey and does not establish purchasing power, willingness to pay, or unique enterprise relationships.
Muse for small business was launched in late September as additional skills and connectors within the existing application. This approach reduces the need to acquire users for a separate product and can exploit existing business context. Connections to advertising accounts, analytics, Shopify, QuickBooks, Canva, and other systems could make the product more useful than a generic conversational interface.
The economically differentiated opportunity is not merely generating text or answering questions. It is combining business context with authorized actions across customer acquisition, campaign management, customer communication, inventory-related updates, and operating workflows. If execution is reliable, this could increase both software revenue and the productivity of Meta’s advertising customers.
The enterprise challenge is that distribution and model capability do not automatically create enterprise-grade software. Larger deployments require administrative controls, auditability, data governance, service reliability, security integration, procurement support, and predictable usage economics. These capabilities can increase implementation costs and extend sales cycles.
The CFO’s statement that Meta intends to “scale our investment behind demonstrated customer demand and product market fit in this area” provides a useful commitment against which future spending can be assessed. However, no enterprise revenue, customer count, annual recurring revenue, committed usage, gross margin, or retention metric was disclosed. Enterprise therefore remains a potentially valuable option rather than an established earnings contributor.
PROFITABILITY, HEADCOUNT, AND THE UNDERLYING COST STRUCTURE
The legal charge should be separated from operating performance, but the resulting business is not exhibiting stable margins. Expenses excluding the $9.89 billion charge were $41.72 billion, up 35.9%, compared with 26.1% revenue growth. Legal-charge-adjusted operating margin declined approximately 4.7 percentage points year over year.
Sequentially, Q2 operating income excluding its disclosed $2.40 billion legal charges and $1.18 billion severance expense was approximately $22.36 billion, with a margin of 36.8%. Q3 operating income excluding its legal charge was $22.88 billion, only 2.3% higher despite 6.2% revenue growth. The comparable margin declined by approximately 1.4 percentage points. The underlying profitability pressure is therefore visible both annually and sequentially.
Cost of revenue increased 45.2% to $13.37 billion and rose from approximately 18.0% to 20.7% of revenue. Research and development increased 32.4% to $20.05 billion. General and administrative expense excluding the specific legal charge increased approximately 41.4%. These figures show that the expense challenge extends beyond a single settlement or a single spending category.
Headcount declined to 66,775, down approximately 11.5% from Q2 and 14.9% year over year. The sequential decline primarily reflects the previously announced May workforce reduction flowing through reported headcount. Q2 still included approximately 8,000 affected employees. The Q3 change should not be interpreted as an entirely new restructuring initiative announced with this call.
The combination of lower headcount and higher expenses demonstrates the limits of using employee counts as a proxy for cost discipline. Depreciation, cloud spending, third-party AI token costs, specialized compensation, and infrastructure operations are increasingly important. Share-based compensation increased 32.5% to $7.36 billion despite the headcount reduction.
Family of Apps reported operating income of $17.12 billion, down from $24.97 billion. If the entire $9.89 billion settlement charge is attributed to Family of Apps, the implied operating income excluding that charge would be approximately $27.01 billion, with a 42.1% margin versus 49.2% a year earlier. This is a conditional analytical calculation rather than a separately presented segment adjustment. It reinforces the conclusion that Reality Labs is not the only source of economic pressure.
The EPS bridge adds another caution. The company-disclosed $7.40 EPS excluding the Q3 legal charge compares with $7.25 excluding the Q3 2025 tax charge. Lower net nonoperating income and a higher underlying tax rate absorb much of the operating-income growth. The earnings releases show net interest and other income declining from $1.13 billion to approximately $13 million, while the respective charge-adjusted tax rates were approximately 14% and 17%.
These adjustments also do not remove stock-based compensation, all legal expenses, or every unusual item. They are useful for isolating specific distortions, but they should not be described as a fully standardized measure of recurring economic earnings.
Q4 AND FULL-YEAR GUIDANCE: STRONG SALES, MORE CONSTRAINED PROFITS
Q4 revenue guidance of $73 billion to $76 billion implies 21.9% to 26.9% year-over-year growth against Q4 2025 revenue of $59.89 billion. The $74.5 billion midpoint implies 24.4% growth and a 15.3% sequential increase. With an approximately 1% currency headwind assumed, the underlying constant-currency growth expectation is modestly stronger than the reported range.
This is a strong outlook, but the midpoint does not imply accelerating reported growth relative to Q3. No earlier company-issued Q4 2026 revenue range was identified in the retrieved materials, so the guidance should be treated as a new forecast rather than a revision to a prior Q4 outlook.
The annual expense range increased from $165 billion to $169 billion in July to $175 billion to $179 billion. Removing the $9.89 billion Q3 legal charge produces approximately $165.11 billion to $169.11 billion, effectively unchanged from the prior range within rounding. The increase is therefore overwhelmingly attributable to the settlement, not a newly disclosed $10 billion increase in the underlying operating plan.
However, the annual operating-income commitment has weakened in GAAP terms. Previously, management expected 2026 operating income to exceed 2025. The current statement is explicitly qualified: “Excluding the Q3 legal charge, we continue to expect 2026 operating income to be above 2025 operating income.” The qualification is economically necessary and should not be treated as an unchanged GAAP commitment.
Combining reported 9-month revenue with Q4 guidance implies full-year revenue of $254.71 billion to $257.71 billion. Combining those endpoints with the expense range implies GAAP operating income of approximately $75.71 billion to $82.71 billion, below 2025 operating income of $83.28 billion throughout the mechanical range. At the respective midpoints, GAAP operating income would be approximately $79.21 billion, down 4.9%.
Adding back only the Q3 legal charge produces midpoint operating income of approximately $89.10 billion, up 7.0%. This is the relevant comparison for management’s revised commitment. It still implies a substantial gap between approximately 27.5% annual revenue growth and 7.0% operating-income growth.
The annual expense outlook also embeds a demanding Q4 cost trajectory. Subtracting 9-month expenses of $127.08 billion implies Q4 expenses of $47.92 billion to $51.92 billion. The midpoint of $49.92 billion is approximately 42.0% above Q4 2025 and 19.7% above Q3 expenses excluding the settlement.
At the revenue and expense midpoints, implied Q4 operating income is approximately $24.58 billion, essentially flat with $24.75 billion a year earlier. The implied operating margin is approximately 33.0%, versus 41.3% in Q4 2025. Thus, even without another Q3-sized legal charge, the outlook points toward continued underlying margin compression.
These are mechanical calculations from separately provided ranges, not management-issued quarterly earnings guidance. Expense and revenue endpoints may not occur together. Nevertheless, the midpoint implication is clear: strong holiday revenue does not currently imply strong holiday profit growth.
The Q4 tax-rate outlook of 15% to 17% is unchanged from the range issued in July for the remaining quarters of 2026. Q3’s reported 24% rate exceeded that range because of the nondeductible portion of legal expenses. The company indicated that the rate would have been approximately 17% without the charge.
2027 GUIDANCE: REVENUE CONFIDENCE WITHOUT A CONSOLIDATED PROFIT COMMITMENT
Management expressed confidence in sustaining strong overall revenue growth throughout 2027, supported by core advertising improvements and initial contributions from new AI businesses. The distinction is that this was qualitative commentary, not a numerical revenue forecast.
The CFO indicated that AI subscriptions, transactions, advertising, and enterprise offerings could begin contributing incremental revenue in 2027. The language suggests an emerging contribution rather than a claim that these businesses will immediately become material profit centers. Near-term revenue growth should therefore remain anchored primarily to the advertising franchise.
The call provided no consolidated 2027 expense range, capital expenditure range, operating-income target, or free-cash-flow objective. When pressed on the relationship between spending and annual operating-income growth, the CFO deferred quantitative detail until the Q4 call. This omission matters because it leaves the central shareholder-return question unresolved.
The prior Q2 call described capacity plans geared toward maximizing 2026 and 2027 capacity, with more flexibility in 2028 and beyond through infrastructure laid down in advance of server decisions. Nothing in the current call establishes that the heavy investment phase will end in 2027. Greater flexibility later is not equivalent to lower spending later.
The new business mix may also reduce the relevance of historical operating-leverage assumptions. Advertising improvements often monetize existing distribution, whereas autonomous agents generate additional serving costs with usage. Revenue growth in an agent business can therefore carry a materially different incremental margin from revenue growth in the advertising auction.
The most consequential forthcoming disclosure is the 2027 relationship between revenue growth, total expenses, capital spending, and capacity utilization. A strong revenue forecast without an attractive cash-flow trajectory would not resolve the valuation debate.
REALITY LABS: IMPROVEMENT, BUT NOT YET A CONSOLIDATED EARNINGS CATALYST
Reality Labs revenue declined 5.7% to $443 million as lower Quest sales outweighed growth in AI glasses. Operating loss narrowed from $4.43 billion to $4.13 billion, an improvement of approximately $303 million. The loss was approximately $1.0 billion better than consensus, but the revenue miss shows that the favorable profit surprise did not arise from stronger aggregate sales.
Implied segment expenses declined approximately 6.7% to $4.57 billion. The segment still incurred roughly $9.3 of operating loss for each $1 of revenue. Even allowing for substantial development spending, current economics remain far from self-funding.
The new 2026 loss range of $18 billion to $19 billion compares with $19.19 billion in 2025. Earlier annual guidance had anticipated losses remaining similar to 2025. The current midpoint therefore represents an improvement of approximately $693 million, or 3.6%, against the prior-year actual loss.
The 2027 target of approximately $15 billion implies a further $3 billion to $4 billion improvement from the 2026 range. At the midpoint, the reduction is approximately 18.9%. If retained entirely at the consolidated level, a $3.5 billion pretax improvement would be worth approximately $1.14 per existing diluted share using a 16% tax rate and Q3’s share count.
That full benefit should not automatically be included in consolidated earnings. Management explicitly described reallocating investment toward other priorities, primarily AI. A dollar removed from Reality Labs and spent elsewhere does not increase consolidated operating profit. It changes the allocation of risk and the expected return on spending.
The annual target also does not imply a monotonic quarterly improvement. With 9-month losses of $12.78 billion, the 2026 range implies Q4 losses of approximately $5.23 billion to $6.23 billion, above Q3’s $4.13 billion. The statement that the business improves “from here” should therefore be interpreted over a broader horizon rather than as a promise of sequential quarterly loss reductions.
The hardware strategy is increasingly a distribution strategy for software and agents. Zuckerberg explicitly stated that devices are not priced to generate large hardware profits. The relevant metrics become subscription attachment, retention, incremental service usage, and lifetime contribution after hardware-related costs. Rapid unit growth alone would not establish attractive economics.
Muse integration with glasses beginning in November is a concrete product catalyst. The change in VR launch cadence toward devices associated with major breakthroughs may improve resource allocation. Nevertheless, no date for Reality Labs profitability was provided, and a $15 billion annual loss would remain financially material.
CAPITAL EXPENDITURES, FREE CASH FLOW, AND FUNDING
The revised 2026 capital expenditure range of $135 billion to $145 billion increases the lower bound by $5 billion and the midpoint by $2.5 billion relative to July. The upper bound is unchanged. This is a narrowing of the range, but not a neutral revision: it reduces the probability of lower spending.
The progression across the year is more significant than the latest revision alone. Initial 2026 guidance was $115 billion to $135 billion. The current $140 billion midpoint is $15 billion above the initial midpoint and approximately 93.9% above 2025 capital expenditures of $72.22 billion. At the current revenue midpoint, capital expenditures would represent approximately 54.6% of annual revenue.
Through September, capital expenditures including finance-lease principal payments were $85.82 billion. The annual outlook therefore implies Q4 spending of $49.18 billion to $59.18 billion, with a midpoint of $54.18 billion. That midpoint is 55.2% above Q3 and substantially above the prior-year Q4 level.
Nine-month free cash flow was $11.05 billion, down 62.6% from $29.51 billion. At the $140 billion annual capital expenditure midpoint, Q4 operating cash flow would need to reach approximately $43.13 billion merely to preserve nonnegative full-year free cash flow. This would require growth of approximately 31.5% from Q3 operating cash flow and 19.1% from Q4 2025.
For Q4 alone to produce nonnegative free cash flow at the capital expenditure midpoint, operating cash flow would need to reach approximately $54.18 billion. That is a substantially higher hurdle. The distinction between full-year and quarterly cash-flow breakeven is important because positive cash generation earlier in the year can offset a large Q4 deficit.
The $9.89 billion legal charge should not simply be added back to free cash flow. Expense recognition, settlement liabilities, and cash payments occur on different schedules. The release identifies a broader agreement involving payments of up to approximately $18.59 billion, but the full amount is not an incremental charge to add on top of the Q3 expense. Detailed payment timing and the relationship between previously recognized amounts and future cash obligations require separate reconciliation.
Operating cash flow also includes substantial noncash adjustments, including $7.36 billion of stock-based compensation and $7.15 billion of depreciation and amortization. Changes in accrued and other liabilities contributed cash during the quarter. This does not invalidate operating cash flow, but it does mean that its composition should be examined rather than treated as equivalent to cash earnings freely available for shareholders.
Net property and equipment increased to $253.22 billion, up 43.5% from year-end 2025. Depreciation and amortization increased 44.1% year over year. The infrastructure buildout therefore creates a delayed expense burden as assets enter service. Slowing future capital expenditure growth would not immediately eliminate depreciation pressure.
The cash balance remains substantial at $82.45 billion, but the company no longer presents the same unambiguously net-cash profile associated with earlier periods. The call cited debt of approximately $83.7 billion, while the written release reported $80.92 billion of long-term debt. Those measures are not fully reconciled in the available disclosures and should not be treated as identical. Under either presentation, unrestricted cash and marketable securities are broadly comparable to debt before considering leases and other obligations.
Capital returns are already reflecting the investment cycle. The current release shows no Class A repurchases during the first 9 months of 2026, compared with $26.25 billion in the comparable prior-year cash-flow presentation. Dividend payments continued. Meta also raised approximately $24.91 billion of net debt proceeds during the first 9 months. These developments reinforce the conclusion that the company is prioritizing infrastructure and strategic flexibility over repurchase-supported per-share growth.
NEW NONVOTING SHARES AND GOVERNANCE
The proposed Class C structure is economically more important as a financing instrument than as a stock split. Existing shareholders are expected to receive 1 nonvoting Class C share for each existing Class A or Class B share, producing the economic effect of a 2-for-1 split. The stock dividend itself does not raise cash or dilute existing shareholders’ proportional economic ownership.
Subsequent issuance of Class C shares for capital raising, employee compensation, or acquisitions could dilute economic ownership without reducing existing voting power in the same manner as issuance of voting shares. This gives Meta greater financing flexibility while preserving founder control.
The CFO stated, “We don't have any specific financing plans to announce at this time.” The announcement therefore should not be described as a committed equity raise. Nevertheless, introducing the structure alongside negative quarterly free cash flow, elevated capital expenditure requirements, and a large new AI investment agenda makes its potential financing role relevant.
The governance trade-off is explicit. Founder control can support investment decisions with long payback periods that might otherwise be constrained by short-term market pressure. It can also reduce the ability of outside shareholders to influence spending if returns disappoint. The appropriate valuation consideration is therefore the quality of capital allocation under persistent control, not simply the mechanics of the split.
The release identifies a Founder Alignment Agreement, but its detailed terms were not established in the call. No conclusion should be drawn that it fully offsets governance concerns. The forthcoming information statement and related filings are important for understanding transfer provisions, future distributions, and the practical limits of the structure.
Trading is expected in late January 2027, with the amended certificate intended to become effective on January 19. Future per-share forecasts and price comparisons will need to incorporate the distribution correctly. Class A and Class C prices could also differ because of voting rights, liquidity, or investor mandates, so a mechanical assumption of identical post-distribution prices is not guaranteed.
INVESTMENT SCENARIOS AND VALUATION IMPLICATIONS
The central investment question is whether Meta can convert a strong advertising franchise into a broader AI platform without permanently reducing per-share returns on capital. The current quarter strengthens confidence in the advertising engine and in initial agent demand. It does not yet establish that the incremental AI businesses will earn attractive returns after serving costs, continuing model development, and financing requirements.
An illustrative 2027 scenario framework highlights the sensitivity. These scenarios are analytical assumptions, not management guidance or consensus. They use approximately $256.2 billion of 2026 revenue, derived from the current Q4 midpoint, and approximately $89.1 billion of 2026 operating income excluding only the Q3 legal charge. Consolidated expense assumptions include Reality Labs rather than subtracting its loss a second time.
The base case, assigned a 50% probability, assumes 20% revenue growth to approximately $307.5 billion and operating expenses of $210 billion. Operating income would be approximately $97.5 billion, with a 31.7% margin and 9.4% growth over the limited 2026 adjusted baseline. This assumes continued advertising strength, initial AI monetization, and substantial reinvestment that absorbs much of the incremental revenue.
The bull case, assigned a 25% probability, assumes 28% revenue growth to approximately $328.0 billion and expenses of $205 billion. Operating income would reach approximately $123.0 billion, with a 37.5% margin and 38.0% growth. The combination requires unusually strong execution: continued advertising gains, successful AI monetization, meaningful inference efficiencies, and disciplined reallocation from lower-return activities.
The bear case, assigned a 25% probability, assumes 10% revenue growth to approximately $281.8 billion and expenses of $220 billion. Operating income would decline to approximately $61.8 billion, with a 21.9% margin. This outcome could arise if advertising normalizes while infrastructure and serving costs remain committed, new AI revenue develops slowly, and efficiency gains are consumed by higher usage and model complexity.
Using an illustrative $2 billion net nonoperating expense, a 16% tax rate, and 2.6 billion diluted shares before the Class C distribution, those cases imply EPS of approximately $30.84, $39.08, and $19.33, respectively. These are sensitivity outputs rather than price targets. They deliberately exclude additional exceptional legal charges and do not assume a future equity raise. Actual financing, dilution, and tax outcomes could materially change them.
The framework demonstrates substantial downside asymmetry in operating leverage when revenue growth weakens. It also demonstrates why a revenue forecast alone is insufficient. Under the base case, 20% revenue growth produces less than 10% operating-income growth. A modest change in the expense trajectory can materially alter the earnings outcome.
At Q3’s share count and an illustrative 16% tax rate, each additional $1 billion of annual expense reduces EPS by approximately $0.33 before the stock distribution. A $10 billion spending deviation would therefore reduce EPS by approximately $3.26. The potential $3.5 billion Reality Labs improvement is meaningful but can be outweighed by a relatively small percentage change in the broader AI spending plan.
Valuation should separate demonstrated advertising earnings from less-proven agent and enterprise opportunities while avoiding double counting shared infrastructure and users. Capital expenditure also cannot be dismissed as irrelevant simply because it does not immediately reduce operating income. Earnings-based valuation should be cross-checked against the eventual cash generation required to earn an acceptable return on the expanded asset base.
A defensible absolute price target requires a verified market valuation, a complete 2027 budget, and explicit assumptions about financing and long-term capital intensity. Those inputs are not established by this call. The strongest conclusion is therefore directional: core-business quality remains high, but the stock increasingly represents a long-duration, capital-intensive AI investment rather than only a highly cash-generative advertising platform.
CATALYSTS, POSITIONING, AND THESIS INVALIDATION
The most important near-term catalyst is the Q4 earnings call, when management expects to provide the 2027 financial framework. The critical disclosures will be consolidated expenses, capital expenditures, the relationship between revenue growth and operating-income growth, and whether Reality Labs savings are retained or redeployed.
Muse integration with glasses beginning in November provides an earlier product catalyst. International expansion, more efficient models, commercial transaction tools, and enterprise customer disclosures could also change the assessment. However, no firm timetable was provided for several of these developments, and product announcements should not be equated with financial validation.
The appropriate current stance is to maintain exposure only within a disciplined risk budget rather than increase it solely on the basis of this quarter. For an illustrative diversified portfolio, an existing 1% to 2% position could preserve participation while limiting exposure to the unresolved 2027 spending trajectory. Actual sizing depends on existing concentration and correlations, which were not provided.
At a 2% position, a 10% adverse price move represents approximately 20 basis points of portfolio loss before gaps or hedging effects. Such a move should trigger a mandatory reassessment rather than automatic averaging down. Event-driven price gaps can exceed any intended stop, particularly around budget guidance or legal developments.
Fundamental reduction or exit triggers would include advertising deterioration accompanied by continued expense acceleration, persistent failure to convert Muse activity into revenue, rising fully loaded serving costs despite claimed efficiency improvements, or financing decisions that dilute per-share value without a credible improvement in expected returns. Repeated legal charges should also be assessed as part of the business’s economic risk rather than excluded indefinitely.
An increase in exposure would be supported by a different combination of evidence: sustained advertising growth, paid Muse retention, disclosed positive contribution economics, enterprise revenue with identifiable margins, and a capital plan that produces a credible path back to material free cash flow. The thesis would also strengthen if Reality Labs reductions improved consolidated profitability rather than merely financing spending elsewhere.
Portfolio diversification benefits should not be overstated. Meta’s advertising exposure remains cyclical, while its new strategy increases sensitivity to AI adoption, infrastructure investment, power availability, financing conditions, and long-duration growth valuations. In a portfolio already concentrated in hyperscalers, AI infrastructure, and growth technology, the position may increase common risk rather than diversify it.
Overall, Q3 strengthens the case that Meta can create valuable AI products and improve its core advertising system. It does not yet establish that the pace of value creation for users and advertisers will translate into attractive incremental returns for shareholders. The decisive evidence must come from monetization, fully loaded unit economics, and cash generation, not adoption alone.
SOURCE AND COMPARABILITY NOTES
The analysis uses the supplied Q3 2026 earnings-call transcript and Bloomberg earnings notice, together with Meta’s company-issued Q3 2026, Q2 2026, Q3 2025, and full-year 2025 earnings releases distributed through PR Newswire. Relevant prior-call passages were used for historical capacity commentary. Financial-statement figures take precedence over rounded spoken amounts. The July 29 outlook is the latest independently located comparable prior guidance for the annual expense and capital expenditure ranges. Scenario probabilities and financial sensitivities are analytical assumptions. The supplied transcript contains transcription irregularities, including the investor-relations host’s surname and the off-site advertising conversion figure.
COMPANY EMPLOYEES ON THE CALL
• Mark Zuckerberg, Founder and Chief Executive Officer. • Susan Li, Chief Financial Officer. • Rob Bevegni, Director of Investor Relations. The supplied transcript renders the surname inconsistently; Meta’s Q3 earnings release identifies Rob Bevegni as the investor-relations contact.
RESEARCH ANALYSTS ON THE CALL
• Brian Nowak, Morgan Stanley. • Eric Sheridan, Goldman Sachs. • Doug Anmuth, J.P. Morgan. • Justin Post, Bank of America. • Mark Shmulik, Bernstein. • Ross Sandler, Barclays. • Mark Mahaney, Evercore ISI.
Key Read-Throughs
KEY READ-THROUGHS FROM META PLATFORMS’ Q3 2026 EARNINGS CALL
Meta’s results reinforce a market distinction between companies supplying AI infrastructure and companies still proving how to monetize AI applications. The strongest positive read-throughs concern contracted compute providers, accelerator suppliers, power infrastructure, and eyewear distribution. The strongest negative implications concern smaller advertising platforms and software products whose functionality can be bundled into Meta’s existing distribution. Importantly, management’s targeted improvement of more than 10x in Muse compute efficiency does not imply declining infrastructure demand: the CFO explicitly stated that “we expect total serving costs to rise.” Conversely, strong advertising growth should not be extrapolated indiscriminately across digital media because much of the disclosed improvement was specific to Meta’s recommendation, conversion, and campaign-management systems. The assessments below distinguish economic direction from stock-price reaction, identify existing relationships separately from new information in the call, and avoid treating unquantified opportunities as earnings forecasts.
AI SEMICONDUCTORS: CUSTOM SILICON BECOMES MORE IMPORTANT AS INFERENCE ECONOMICS BECOME THE CONSTRAINT (READ-THROUGH 1)
Affected company: Broadcom (AVGO: US). Direction and magnitude: positive, with high strategic relevance to its custom-accelerator and networking businesses and a moderate incremental companywide read-through from this call.
Call evidence: Meta expects more than a 10x improvement in Muse compute efficiency over the next year, identified serving costs as a constraint on geographic expansion, and described smaller models, inference optimization, and higher utilization as central priorities. Separately, moving content-understanding workloads onto its own Muse models reportedly reduced per-unit processing costs by more than 80%. These disclosures make cost-efficient production inference, rather than frontier training alone, increasingly central to the investment program.
The transmission mechanism is the expansion of recurring, sufficiently standardized workloads for which customized hardware can improve total cost of ownership. Meta already processes recommendations, advertising signals, and content at enormous scale. Adding persistent consumer and business agents increases the range of production workloads that can justify hardware-software co-design. Broadcom’s exposure is verified rather than inferred solely from sector positioning: Meta’s announced partnership covers multiple MTIA generations, chip design, advanced packaging, and Ethernet networking, with an initial commitment exceeding 1 GW and a planned multigigawatt rollout.
The less obvious positive is that inference efficiency can increase the addressable deployment opportunity instead of reducing it. Lower serving costs make additional users and tasks economically viable. Broadcom can benefit from the infrastructure required to achieve that efficiency, even before Muse itself generates attractive profits. However, the reported 80% processing-cost reduction was attributed to model changes, not specifically to MTIA; it should not be presented as proof of custom-chip performance.
Near-term trading significance is confirmation of the workload and spending rationale behind an existing program, not a newly announced order. The longer-duration fundamental catalyst is production deployment across successive accelerator generations. The main limitation is allocation: Meta is explicitly pursuing multiple compute architectures, so the call does not establish an exclusive Broadcom position or a specific increase in its share of Meta spending.
AI SEMICONDUCTORS: EFFICIENCY IMPROVEMENTS DO NOT SUPPORT A NEAR-TERM ACCELERATOR DEMAND CONTRACTION (READ-THROUGH 2)
Affected companies: NVIDIA (NVDA: US) and Advanced Micro Devices (AMD: US). Direction and magnitude: positive for both; high demand relevance for NVIDIA and potentially greater relative growth significance for AMD’s AI accelerator business.
Call evidence: Meta increased its 2026 capital expenditure floor from $130 billion to $135 billion while retaining the $145 billion ceiling. Management also described building capacity to serve more than 1 billion people over several years, continued development of larger frontier models, and multiple competing uses for compute across advertising, agents, and enterprise services.
The accompanying financial statements show $85.82 billion of capital expenditures through September. The annual range therefore implies approximately $49.18 billion to $59.18 billion in Q4, with a $54.18 billion midpoint, approximately 55% above Q3. This is a strong spending backdrop, although capital expenditure includes buildings, networking, and other infrastructure rather than only accelerators. Cash expenditure timing also does not map directly onto supplier revenue recognition.
Both supplier relationships are established. NVIDIA’s announced agreement encompasses millions of Blackwell and Rubin GPUs, CPUs, and Spectrum-X networking. AMD’s agreement covers up to 6 GW across multiple generations, with shipments supporting the initial 1 GW deployment scheduled to begin in the second half of 2026. The current call strengthens the economic rationale for these programs without independently confirming individual shipment milestones.
The key mechanism is workload expansion outpacing unit-cost improvement. Illustratively, a 100-fold increase in users combined with a 10-fold reduction in cost per equivalent workload would still produce a 10-fold increase in aggregate serving expenditure at unchanged activity per user. This is a sensitivity, not a forecast, but it explains why model efficiency and hardware demand can rise together.
The near-term catalyst is supplier delivery and acceptance against Meta’s elevated spending trajectory. The longer-duration opportunity is recurring inference demand alongside continuing model training. NVIDIA faces customer diversification and custom-silicon competition; AMD faces deployment execution and software-performance requirements. AMD’s previously disclosed performance-based warrant for up to 160 million shares also means commercial growth should be evaluated alongside potential dilution, not solely through headline deployment capacity.
AI CLOUD: OWNED DATA CENTERS AND RENTED CAPACITY ARE COMPLEMENTS DURING THE BUILDOUT (READ-THROUGH 3)
Affected companies: CoreWeave (CRWV: US) and Nebius Group (NBIS: Netherlands). Direction and magnitude: positive, with high business relevance because Meta is an established large customer; the relative significance is particularly substantial for Nebius.
Call evidence: The CFO identified higher third-party cloud spending as a driver of infrastructure expense growth. Management also said compute intensity had constrained Muse’s international launch and that total serving costs would increase. The combination contradicts a simplistic assumption that Meta’s owned-infrastructure expansion immediately eliminates demand for external capacity.
The transmission mechanism is access to operational compute while Meta builds, commissions, and optimizes its own facilities. External providers can bridge differences between product demand and internal capacity availability, support geographic deployment, and supply particular hardware generations. Meta’s multiple workloads also create reasons to retain flexibility rather than force all demand into a single internally owned infrastructure schedule.
The relevant agreements predate this call. CoreWeave announced an approximately $21 billion expanded agreement providing capacity through December 2032. Nebius announced a $12 billion dedicated-capacity agreement beginning in early 2027, plus up to $15 billion of purchases of additional available capacity over 5 years. The latter component is important: Nebius intends to sell that capacity to third parties, with Meta purchasing remaining availability. It is not appropriate to treat the entire $27 billion as unconditional incremental Meta consumption and then separately count revenue from selling the same capacity to other customers.
Near-term trading implications are favorable for demand confidence, but the call does not announce new contract value. Revenue realization depends on delivery, commissioning, and contractual acceptance. Nebius’s dedicated-capacity arrangement is principally a 2027-and-beyond fundamental catalyst.
The negative cross-portfolio implication is concentration. Strong Meta demand can support several infrastructure holdings simultaneously, but those positions are not independent sources of diversification. Meta’s own negative quarterly free cash flow and expanding financing needs increase the importance of counterparty concentration, renewal economics, and disciplined supplier financing. These risks qualify the valuation implications without reversing the positive demand read-through.
DATA-CENTER EQUIPMENT: POWER AND COOLING BENEFIT WITHOUT REQUIRING A PARTICULAR MODEL TO WIN (READ-THROUGH 4)
Affected company: Vertiv Holdings (VRT: US). Direction and magnitude: positive, with high relevance to its addressable market and moderate incremental earnings visibility from this particular call.
Call evidence: Meta reported $34.9 billion of quarterly capital expenditures, raised the annual spending floor, and described infrastructure expansion across servers, data centers, and networking. The company also identified higher utilization as a major route to lower inference costs.
The transmission mechanism extends beyond installing additional chips. More deployed capacity requires power delivery, thermal management, controls, and commissioning. Higher utilization increases the importance of reliable operation and cooling performance because installed infrastructure must sustain demanding workloads rather than merely accommodate peak theoretical capacity. This creates demand for systems that improve deployment speed, uptime, and usable compute output.
Vertiv’s product relevance is independently established through its announced NVIDIA Vera Rubin DSX work covering integrated power, cooling, controls, and lifecycle services. That participation validates exposure to the relevant infrastructure category. It does not establish that Vertiv has received a specific new Meta award or owns a fixed percentage of Meta’s spending.
The non-consensus distinction is that infrastructure efficiency can itself require equipment investment. Improving usable compute per facility may involve redesigned power distribution, cooling upgrades, and system integration. Nevertheless, higher utilization does not mechanically generate proportional equipment revenue, and the call provides no basis for assuming a specific increase in content per rack.
The near-term catalyst is equipment orders, backlog conversion, and commissioning activity associated with the elevated construction schedule. The longer-duration fundamental driver is the conversion of AI capacity into sustained production infrastructure. This exposure is less dependent on which consumer agent succeeds than application-layer exposure, but remains sensitive to construction delays, customer spending discipline, and architectural changes.
POWER GENERATION: EXISTING NUCLEAR ASSETS OFFER A MORE DIRECT READ-THROUGH THAN SPECULATIVE FUTURE CAPACITY (READ-THROUGH 5)
Affected companies: Vistra (VST: US) and Constellation Energy (CEG: US). Direction and magnitude: positive, with moderate companywide fundamental significance and limited immediate earnings-revision implications from this call alone.
Call evidence: Meta intends to continue investing aggressively, expects total agent-serving costs to rise, and is planning capacity for a much larger user base. These statements support durable electricity requirements rather than a short-lived training-only demand surge.
The transmission mechanism is stronger demand for reliable, long-duration power arrangements that support operating infrastructure. Both companies have disclosed direct Meta relationships. Vistra’s agreements cover 2,176 MW of existing generation and 433 MW of planned uprates across nuclear assets in Ohio and Pennsylvania. Purchases are scheduled to begin in late 2026, with the full capacity phased in through 2034. Constellation’s Clinton arrangement begins in June 2027, relates to 1,121 MW of nuclear output, and supports a 30 MW uprate.
These distinctions matter. Most of the contracted capacity already exists; it is not all new generation. Constellation’s arrangement also supports continued operation and purchases of clean-energy attributes, rather than implying that Meta physically consumes every unit through a dedicated connection. Neither agreement justifies assuming that all incremental regional electricity demand translates directly into higher realized prices.
The highest-conviction positive is improved economic support for existing assets, long-term operations, and selected capacity additions. That is more directly grounded than extrapolating this earnings call into near-term profits for unbuilt reactors.
Near-term catalysts include commencement of the first Vistra purchases and progress toward Constellation’s June 2027 start. Longer-duration value comes from contracted economics, asset-life extension, and uprates. The geographic signal is concentrated in U.S. power markets, particularly PJM and Illinois, rather than a uniform global utility uplift. Existing contracts already incorporate substantial anticipated demand, so the call reinforces their rationale rather than announcing higher prices or new awards.
DIGITAL ADVERTISING: META’S BEAT IS A COMPETITIVE WARNING, NOT A CLEAN SECTORWIDE DEMAND SIGNAL (READ-THROUGH 6)
Affected companies: Snap (SNAP: US) and Pinterest (PINS: US). Direction and magnitude: negative on a relative competitive basis; medium-to-high strategic relevance for Snap and moderate relevance for Pinterest. The call does not demonstrate declining absolute revenue at either company.
Call evidence: Meta advertising revenue increased 26%, average price per ad rose 14%, and impressions increased 10%. Management attributed performance to advertising-system improvements alongside better macroeconomic conditions. Advertisers adopting Meta AI Business Assistant recommendations reportedly generated almost 5% more conversions at unchanged cost per conversion and increased spending by 9% relative to similar nonadopters. Partnership ads grew more than 97% and exceeded a $15 billion annual revenue run rate.
The transmission mechanism is budget allocation based on measurable outcomes. Better conversion prediction, automated creative production, and integrated campaign management can increase the return advertisers obtain from spending within Meta. Smaller platforms then face a higher performance threshold to win incremental budgets, while also needing to invest in their own recommendation and advertising infrastructure.
For Snap, the pressure concerns both advertiser performance and competition for attention and creator-led campaigns. For Pinterest, the overlap is particularly relevant in shopping discovery and product advertising. Meta’s combination of creator content, improved recommendations, and transactional intent can compete for budgets that might otherwise support specialized discovery platforms.
The non-consensus point is that a favorable macro backdrop does not make Meta’s outperformance uniformly positive for peers. The call contains extensive evidence of company-specific product improvements. At the same time, the 9% advertiser-spending comparison is observational and should not be treated as proof that spending was transferred from Snap or Pinterest.
The near-term trading catalyst is peers’ earnings and guidance, particularly whether they demonstrate comparable advertiser-return improvements. The longer-duration risk is a widening gap between platforms able to spread AI investment across enormous advertising revenue bases and those with less financial capacity. The actionable implication is to avoid raising peer estimates mechanically in response to Meta’s headline growth.
CREATIVE AND SMB SOFTWARE: DISTRIBUTION-LED BUNDLING PRESSURES PAID AI FEATURES (READ-THROUGH 7)
Affected companies: Adobe (ADBE: US) and HubSpot (HUBS: US). Direction and magnitude: negative for incremental feature monetization, with moderate strategic relevance but low-to-moderate near-term companywide earnings impact.
Call evidence: Nearly 10 million advertisers used Meta’s generative AI creative tools, video-generation adoption increased 25% sequentially, and Meta is adding conversational campaign planning, creation, optimization, and scheduled actions. Muse for small business can connect to advertising accounts and business systems, draft campaigns and responses, analyze performance, and execute operating tasks. Management cited at least 500 million self-identified small businesses using the Family of Apps.
The transmission mechanism is reduced willingness to pay separately for functionality available within a platform already used to acquire customers. Meta can recover some of the cost through advertising and broader subscriptions, rather than requiring every creative or campaign-management feature to support a stand-alone software price.
Adobe’s exposure is concentrated in lightweight commercial content creation and incremental monetization around products such as Express and Firefly. HubSpot’s exposure concerns basic campaign creation, content assistance, and customer-acquisition workflows overlapping with its Breeze and marketing products. The competitive issue is not simply model quality. It is Meta’s ability to place functionality directly inside the advertising workflow and connect it to performance data.
This is not a high-conviction thesis that Meta replaces professional creative suites or full CRM systems. Adobe retains differentiated professional workflows, while HubSpot’s customer records, cross-channel context, and operating processes provide capabilities that Meta has not demonstrated it can comprehensively replace. The 500 million figure is survey-derived reach, not a pool of paying software customers or immediately contestable subscriptions.
Near-term impact is more likely to affect expectations for AI upselling and valuation than reported renewals. The longer-duration risk is feature commoditization: vendors may need to deliver more functionality within existing prices and justify premiums through differentiated workflow outcomes. The call supports pressure on generic AI-feature monetization, not a blanket negative conclusion on enterprise software.
SEARCH AND COMMERCIAL DISCOVERY: PERSONAL AGENTS TARGET VALUABLE QUERY ECONOMICS BEFORE THEY REPLACE GENERAL SEARCH (READ-THROUGH 8)
Affected company: Alphabet (GOOGL: US). Direction and magnitude: negative competitive pressure, with potentially high long-term strategic significance but low near-term consolidated earnings impact.
Call evidence: Muse exceeded 10 million setups in the U.S. and Canada within approximately 6 weeks. Approximately 25% of registered users were active on a given day. More than 25% of weekly active users engaged in shopping, average purchase size exceeded $200, and management confirmed that travel is included in the commerce use cases. Meta intends to monetize transactions and subscriptions rather than wait indefinitely for scale.
The transmission mechanism is substitution within commercially valuable journeys. An agent that interprets preferences, compares products, monitors availability, and completes a purchase can eliminate some separate search sessions and visits to comparison pages. The economic risk is therefore concentrated in the monetizable portions of shopping and travel discovery, not necessarily in total search-query volume.
Persistent intent is especially relevant. The CFO described agents continuing to search on a user’s behalf and providing updates rather than waiting for each new explicit request. If that behavior scales, the platform owning the ongoing task can influence where demand is fulfilled and where acquisition fees accrue.
The geographic signal increases the relevance of the early adoption: the initial users are in the U.S. and Canada, rather than predominantly lower-monetizing markets. Nevertheless, approximately 2.5 million implied daily users remain small relative to Alphabet’s overall distribution. Shopping engagement is not equivalent to completed transactions, and the call does not establish the source of displaced activity.
The near-term catalyst is evidence of repeat purchasing, paid retention, and expansion beyond the initial markets, not an immediate reduction in Alphabet earnings estimates. The longer-duration risk is migration of commercial intent and acquisition economics toward agent interfaces. Alphabet’s own AI products and commerce integrations are substantial defenses, making this a competitive-pressure thesis rather than a conclusion that Meta has already won the category.
COMMERCE INFRASTRUCTURE: LOSING THE STOREFRONT INTERFACE DOES NOT NECESSARILY MEAN LOSING THE TRANSACTION (READ-THROUGH 9)
Affected company: Shopify (SHOP: Canada). Direction and magnitude: positive, with moderate-to-high strategic relevance and low near-term earnings visibility.
Call evidence: Meta named Shopify as a partner in the personal agent protocol and as an existing Muse small-business connector. The CFO expects commerce to migrate toward “more permissioned, structured interactions,” including authenticated APIs and direct communications between consumer and business agents.
The transmission mechanism is preservation, and potentially expansion, of Shopify’s role beneath the consumer interface. Even when discovery happens inside Muse, the transaction still requires accurate catalog data, inventory availability, merchant permissions, checkout rules, tax calculation, payment handling, and order management. These are more durable requirements than the particular webpage through which the consumer arrives.
Shopify’s published agentic-commerce framework supports this interpretation: merchants retain the merchant-of-record relationship, orders flow into their existing administration system, and the platform supports commerce originating from external AI interfaces. The positive is therefore not dependent on Shopify owning the dominant consumer agent.
The non-consensus distinction is between interface disintermediation and infrastructure disintermediation. A merchant can receive fewer conventional storefront visits while continuing to use Shopify to execute sales. Permissioned integrations may strengthen the value of reliable merchant infrastructure relative to ad hoc scraping or browser automation.
Near-term catalysts are integration availability, merchant activation, and measurable agent-originated orders. The longer-duration opportunity is higher platform relevance across multiple agent ecosystems. However, Shopify’s published framework does not imply an additional universal AI transaction fee. Some transactions will migrate from existing channels rather than represent new spending. The high-conviction positive is preservation of the economic role and access to new distribution, not an immediate assumption of higher take rates.
PAYMENTS: AGENTIC CHECKOUT DOES NOT AUTOMATICALLY ELIMINATE ESTABLISHED WALLETS (READ-THROUGH 10)
Affected company: PayPal Holdings (PYPL: US). Direction and magnitude: positive for strategic positioning and reduced exclusion risk; low near-term earnings impact and moderate longer-duration relevance.
Call evidence: Shopping is Muse’s leading use case, average purchase size exceeds $200, and Zuckerberg said early activity required Meta to work with Stripe to raise credit limits. Management also expects businesses and agents to transact through approved integrations rather than permanently rely on unstructured navigation.
The company-specific exposure comes from Meta’s separate Connect announcement naming PayPal among the payment integrations being added to Muse. This is an announced relationship, not evidence from the earnings call that PayPal is already processing material Muse volume. The reported Stripe activity must not be attributed to PayPal.
The transmission mechanism is that agents still need an authorized way to fund and complete purchases. A wallet’s value can persist even when the consumer no longer manually selects a visible checkout button on every transaction. Payment credentials, merchant acceptance, authorization, and transaction servicing remain relevant beneath the agent interface.
This is a positive challenge to the assumption that agentic commerce necessarily bypasses established payment providers. PayPal’s inclusion preserves an opportunity to participate in the new interface. However, competing integrations mean that participation is not exclusive, and the economics may differ from conventional branded checkout.
The near-term catalyst is confirmed availability and evidence of actual transaction routing. The longer-duration issue is whether PayPal can preserve payment share as transaction initiation moves from merchant pages to agents. No defensible near-term earnings increase can be derived from the disclosed Muse adoption metrics because routing share, payment volume, pricing, and incrementality remain undisclosed.
EYEWEAR AND CONSUMER DEVICES: META’S SOFTWARE STRATEGY CAN SUPPORT PARTNER HARDWARE DEMAND (READ-THROUGH 11)
Affected company: EssilorLuxottica (EL: France). Direction and magnitude: positive, with high relevance to its connected-eyewear growth opportunity and moderate companywide significance.
Call evidence: Management said glasses sales continued to grow rapidly, Muse would begin reaching Meta glasses in November, and hardware is deliberately priced “not to make a large profit on the hardware” but to build a software and personal-agent business. Reality Labs’ revenue decline was attributed to weaker Quest sales partly offset by strong AI-glasses growth.
The transmission mechanism is an additional recurring use case for eyewear, supported by a partner whose principal monetization objective lies beyond device margins. Better agent functionality can increase usage, replacement demand, and consumer willingness to choose connected frames. EssilorLuxottica participates through its brands, frames, lenses, distribution, and the established Meta partnership.
The important distinction is that declining Reality Labs revenue is not evidence of declining demand for EssilorLuxottica’s connected products. Quest and AI glasses have different demand trajectories. Similarly, Meta’s intention to accept limited hardware profit does not establish that EssilorLuxottica earns the same margin or receives a share of Muse subscriptions. Partnership economics must not be inferred from Meta’s segment-level commentary.
Meta’s September product announcements also expanded styles, prescription-compatible options, and geographic availability. This supports a broader eyewear opportunity rather than a narrow enthusiast-electronics category. Hardware expansion outside North America, however, should not be equated with immediate availability of the full Muse experience in every market.
The near-term catalysts are the November agent integration, holiday sell-through, and subsequent partner revenue disclosures. The longer-duration shift is the potential evolution of connected eyewear into a frequently used computing interface. The relevant investment evidence is sustained sell-through and attractive partner economics, not merely device launches or Meta’s eventual software ambitions.
CROSS-PORTFOLIO IMPLICATIONS
The strongest positive exposures are those with an established role in delivering compute, operating infrastructure, or completing transactions. The strongest negative exposures are businesses charging separately for functionality that Meta can distribute within an existing advertising or subscription relationship. This favors selective supplier and infrastructure exposure over indiscriminate purchases of every company associated with AI.
The principal portfolio risk is correlated demand masquerading as diversification. An accelerator sale, a GPU-cloud contract, a cooling-system order, and a power agreement can all depend on the same underlying Meta investment program. They are different revenue recipients, but not independent end-demand sources. Meta’s cloud payments and the cloud provider’s hardware purchases are also successive stages of the same spending chain, not additive evidence of separate final demand.
Finally, the call supports neither a generalized consumer-spending boom nor an immediate collapse in incumbent software and search earnings. Muse’s early users are geographically concentrated and self-selected; transaction frequency and monetization remain undisclosed. The actionable distinction is between near-term infrastructure delivery, where spending and relationships are identifiable, and longer-duration shifts in advertising, software pricing, and commerce interfaces, where competitive pressure is clearer than the eventual earnings allocation.
Report record
- Sector
- Communication Services
- Fiscal period end
- September 30, 2026
- Report date
- October 21, 2026
- Analysis
- 8027 words
- Read-throughs
- 3838 words
- Content fingerprint (PDF)
0a40bd239dd4- Content fingerprint (analysis)
a10af0be9a59- Content fingerprint (read-throughs)
537fee9c842c
Prepared from the company's earnings release and earnings call transcript. Figures as reported by the company. For information only. Not investment advice.
More from Meta Platforms, Inc.
No other reports yet.
All Meta Platforms, Inc. reports
More in Communication Services
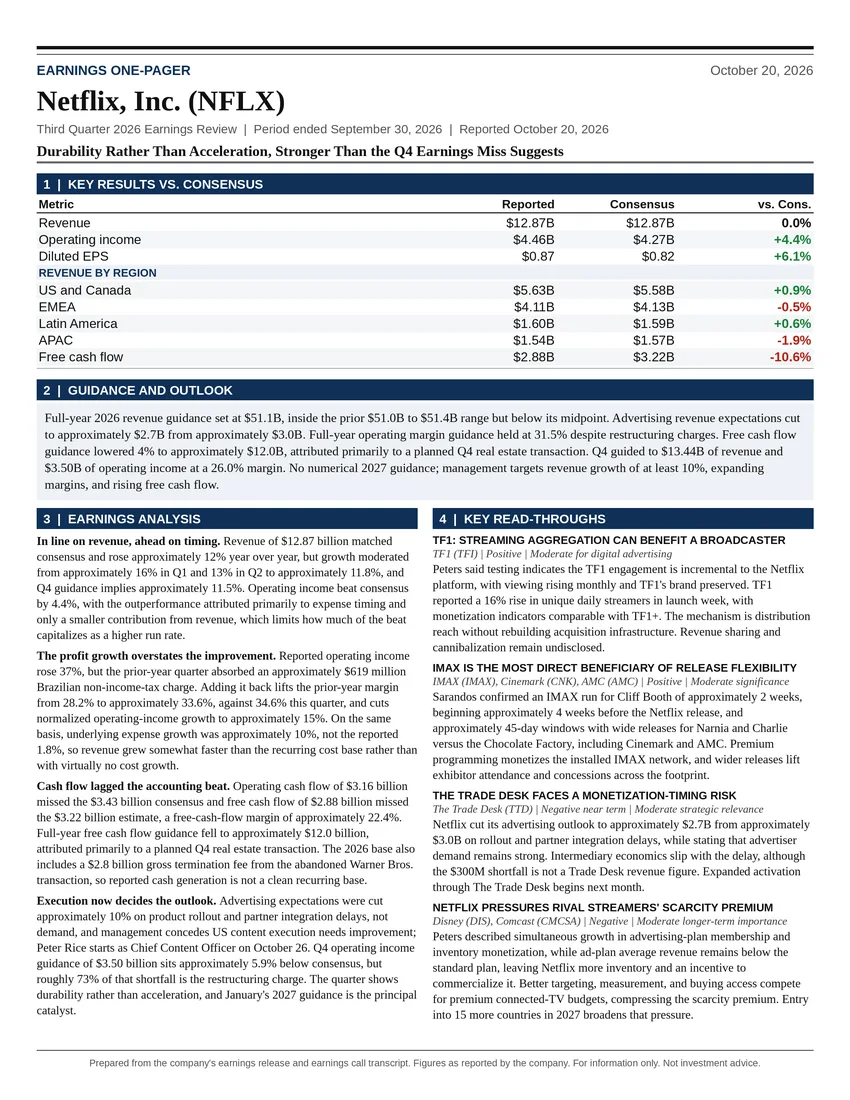
Durability Rather Than Acceleration, Stronger Than the Q4 Earnings Miss Suggests
All Communication Services reports
Meta Platforms, Inc. on the Atlas Peak ticker page
Follow @AtlasPeakRes on X for new earnings reports as they publish.