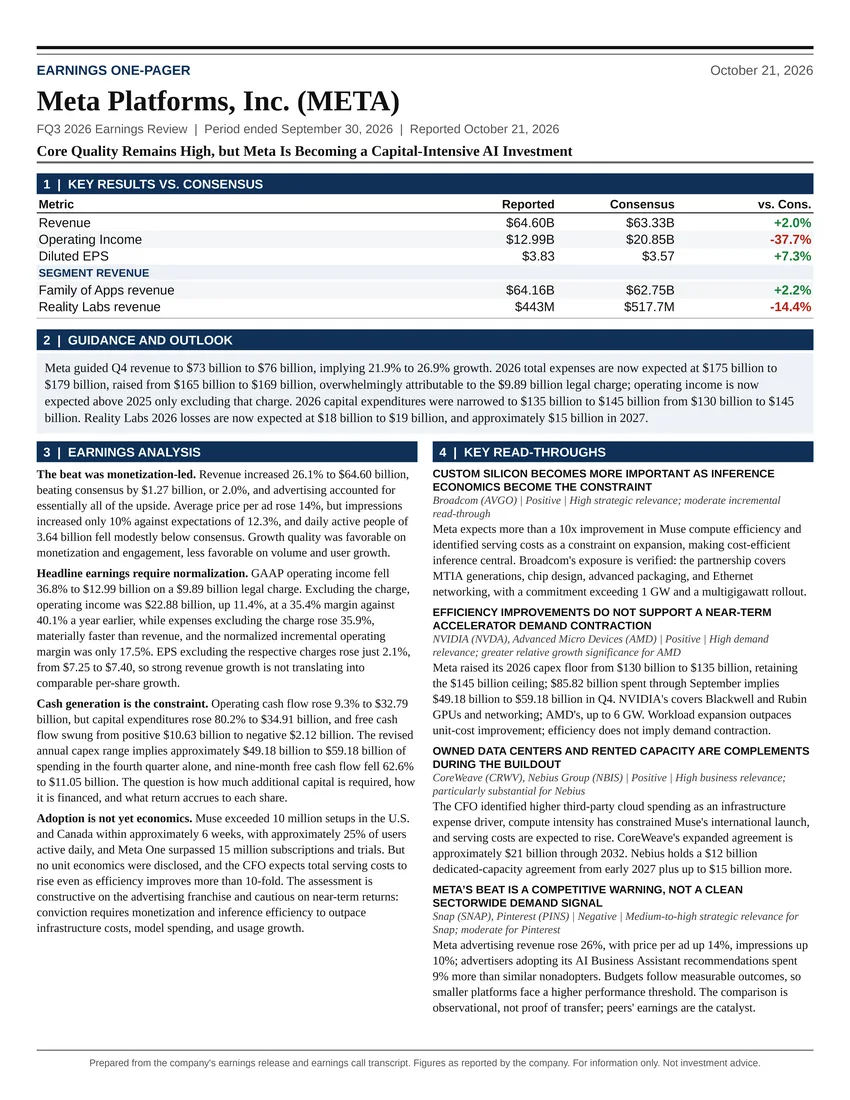
Core Quality Remains High, but Meta Is Becoming a Capital-Intensive AI Investment
Earnings Reports
Spotify Technology S.A. FQ3 2026 Earnings Report
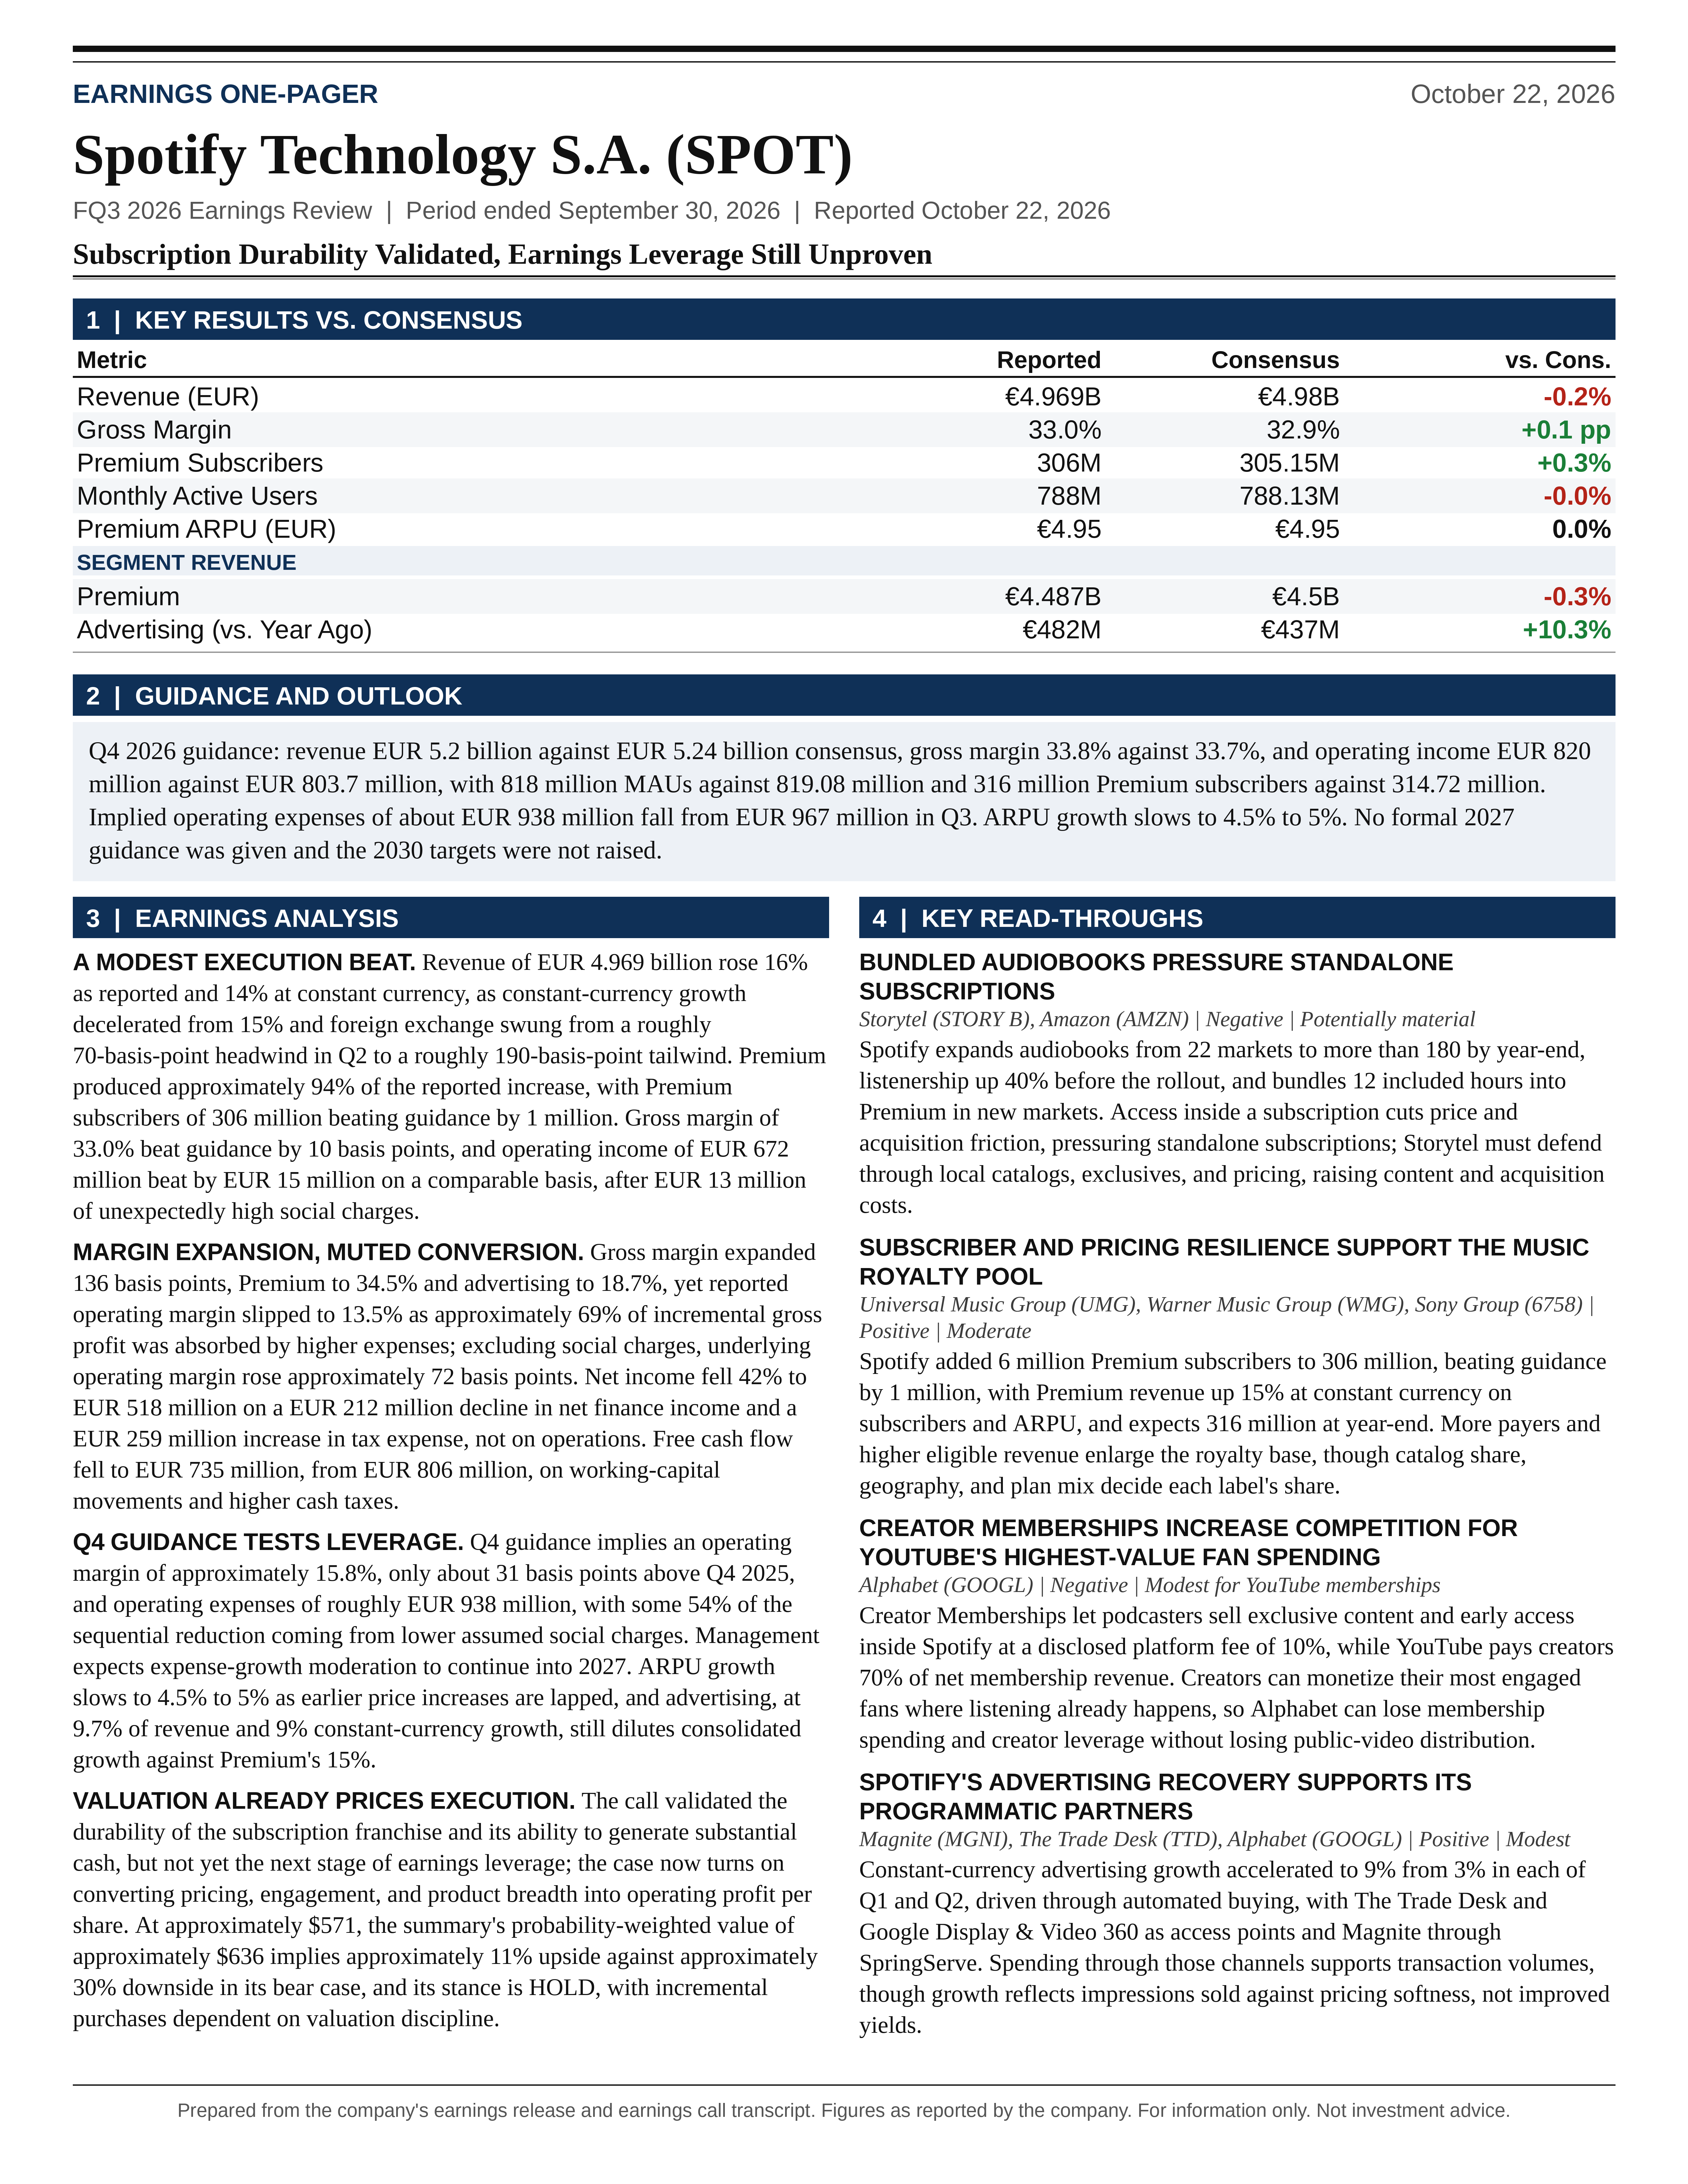
Spotify Technology S.A. (SPOT) FQ3 2026 earnings: Subscription Durability Validated, Earnings Leverage Still Unproven. Full earnings analysis, key read-throughs, and the one-page exhibit from Atlas Peak Research.
Spotify Technology S.A. (SPOT)
Sector: Communication Services · FQ3 2026 · Period end September 30, 2026 · Reported October 22, 2026
Spotify’s Q3 2026 earnings call supports a constructive fundamental outlook but does not establish a sufficiently large earnings acceleration to justify an indiscriminate increase in exposure.
Download the one-page report (PDF)
View one-page exhibit
Download analysis (.md)
Download read-throughs (.md)
Post to X
One-Page Exhibit
Earnings Analysis
EXECUTIVE CALL SUMMARY: Spotify Technology S.A. (10/22/26)
Spotify’s Q3 2026 earnings call supports a constructive fundamental outlook but does not establish a sufficiently large earnings acceleration to justify an indiscriminate increase in exposure. The appropriate investment stance is HOLD, with incremental purchases dependent on valuation discipline and confirmation that Q4 expense moderation translates into sustained operating leverage. Subscriber growth, pricing realization, gross-margin expansion, and the advertising recovery remain intact. However, reported operating margin declined slightly, free cash flow fell year over year, and Q4 guidance implies slower underlying revenue growth as earlier price increases are lapped. The central investment question is shifting from whether Spotify can become consistently profitable to how much incremental revenue can reach operating income while the company expands content offerings and funds AI-driven product development.
The quarter was a modest execution beat rather than a material financial surprise. Revenue reached EUR 4.969 billion, increasing 16% as reported and 14% at constant currency, consistent with management’s rounded EUR 5.0 billion guidance. Premium subscribers reached 306 million, exceeding guidance by 1 million, while monthly active users, or MAUs, reached the expected 788 million. Gross margin of 33.0% exceeded guidance by 10 basis points. Operating income of EUR 672 million exceeded guidance by only EUR 2 million, although the underlying variance was more favorable after adjusting for EUR 13 million of unexpectedly high share-price-linked social charges. On that comparable basis, operating income exceeded guidance by EUR 15 million.
The most important prospective development was the commitment to slower expense growth. Christian Luiga stated, “OpEx growth is now coming down meaningfully, and we expect that moderation to continue into 2027.” Q4 guidance implies approximately EUR 938 million of operating expenses, down from EUR 967 million in Q3, despite higher revenue and substantial audiobook and podcast-program expansion. Nevertheless, approximately EUR 16 million of that sequential expense reduction reflects lower assumed social charges. Excluding those charges, the implied expense decline is closer to EUR 13 million. The outlook therefore supports a genuine improvement in spending discipline, but not the magnitude of structural cost reduction that the headline operating-income increase might initially suggest.
The advertising recovery is encouraging but remains insufficient to transform consolidated growth. Constant-currency advertising growth improved to 9%, from 3% in each of Q1 and Q2. Advertising still represents only 9.7% of revenue and approximately 5.5% of gross profit. Furthermore, advertising growth below Premium’s 15% constant-currency growth rate continues to dilute consolidated growth relative to the subscription business. Management’s language about “progress towards double-digit growth” should not be interpreted as a commitment to advertising growth above 15%, or even as an explicit numerical Q4 forecast.
AI integration, interactive music tools, audiobooks, and creator monetization strengthen the strategic argument that Spotify can increase the value and durability of its subscription. They do not yet establish the magnitude of incremental economic returns. Management disclosed encouraging adoption and engagement indicators, but not product-level contribution margins, controlled retention improvements, inference costs, or a quantified 2027 monetization roadmap. Confidence is high in the demonstrated financial improvement and current subscription scale. Confidence is moderate in the pace of future operating leverage and lower in the standalone value of newer AI and software-commercialization initiatives.
At Bloomberg reference prices retrieved at approximately 14:25 UTC on October 22, Spotify traded at approximately $571.14, with EUR/USD at 1.1194. Using the latest diluted weighted-average share count and disclosed cash and short-term investments produces an illustrative enterprise value of approximately EUR 96.5 billion before lease adjustments and other investments. That represents approximately 33.7 times operating income implied by the 2026 outlook and a trailing free-cash-flow yield of approximately 3.0% on the corresponding diluted equity value. A probability-weighted valuation framework developed below indicates approximately 11% upside over 12-18 months, against approximately 30% downside in the bear case. The business merits a quality premium, but the current valuation already requires substantial execution.
QUARTERLY PERFORMANCE AND THE QUALITY OF THE GUIDANCE BEAT
The relevant prior guidance was issued on August 4, 2026. Spotify forecast 788 million MAUs, 305 million Premium subscribers, EUR 5.0 billion of revenue, a 32.9% gross margin, and EUR 670 million of operating income. Actual results met the MAU and rounded revenue forecasts and exceeded subscriber, gross-margin, and operating-income expectations. The subscriber beat represented approximately 0.3% of the projected subscriber base, but 20% of the expected 5 million quarterly net additions. It was therefore meaningful relative to quarterly acquisition expectations, although small relative to the installed base.
The operating-income beat requires careful treatment of social charges. Guidance incorporated EUR 9 million of these payroll taxes, which fluctuate with the value of employee equity awards. Actual charges were EUR 22 million. Holding charges at the forecast level would have produced EUR 685 million of operating income, compared with the EUR 670 million forecast. Alternatively, removing all social charges from both figures produces EUR 694 million of actual operating income against EUR 679 million implied by guidance. Both methods identify the same EUR 15 million underlying beat. This is an analytical comparability adjustment, not a separate company-reported earnings measure.
The underlying beat was approximately 2.2% of forecast operating income. Gross-margin favorability contributed only approximately EUR 5 million at the quarter’s revenue scale, with the remainder principally attributable to marketing and personnel-related cost favorability. The result supports management’s execution credibility, but it does not indicate a large, previously unrecognized earnings opportunity. Some cost favorability could reflect timing rather than a permanently lower expense base.
The historical comparison is stronger at gross profit than at operating income. Revenue increased from EUR 4.272 billion in Q3 2025 to EUR 4.969 billion, while gross profit increased from EUR 1.351 billion to EUR 1.639 billion. That represents 21.3% gross-profit growth and an incremental gross margin of approximately 41.3% on the additional revenue. Operating income increased from EUR 582 million to EUR 672 million, or 15.5%, because operating expenses absorbed EUR 198 million of the EUR 288 million gross-profit increase. Approximately 69% of incremental gross profit was reinvested or absorbed by higher expenses.
Consequently, reported operating margin declined from approximately 13.6% to 13.5%, despite 136 basis points of gross-margin expansion. Sequentially, gross margin declined from Q2’s 33.4%, and operating margin declined from 13.7%. The quarter therefore demonstrated better content-level economics without corresponding reported operating-margin expansion. That distinction is central to evaluating the investment year.
Social charges explain an important portion of the apparent operating deleverage. Q3 2025 included a EUR 16 million social-charge credit, compared with a EUR 22 million expense in Q3 2026. Removing those effects produces operating income of EUR 566 million and EUR 694 million, respectively, representing approximately 22.6% growth. The corresponding adjusted operating margin increased by approximately 72 basis points. Underlying leverage was therefore positive, although materially less dramatic than the gross-margin expansion alone.
REVENUE GROWTH, FOREIGN EXCHANGE, AND COMPARABILITY
The distinction between reported and constant-currency growth materially affects the interpretation of momentum. Reported revenue growth accelerated from approximately 14% in Q2 to 16% in Q3. Constant-currency growth moved in the opposite direction, declining from approximately 15% to 14%. Foreign exchange shifted from an approximately 70-basis-point growth headwind in Q2 to an approximately 190-basis-point tailwind in Q3. Most of the apparent acceleration in reported growth was therefore currency-related rather than an acceleration in underlying demand.
Spotify’s current shareholder deck provides the appropriate historical segment comparisons. Effective January 1, 2026, certain revenue-generating activities were transferred from Ad-Supported to Premium following changes in management reporting under the co-CEO structure. Comparative periods were recast. Premium revenue of EUR 4.487 billion should therefore be compared with the recast Q3 2025 figure of EUR 3.835 billion, and advertising revenue of EUR 482 million with EUR 437 million. Mixing these figures with unrecast historical segment disclosures would distort growth and margin comparisons.
Premium revenue increased 17% as reported and 15% at constant currency. Advertising revenue increased 10% as reported and 9% at constant currency. Premium contributed approximately EUR 652 million of the EUR 697 million reported revenue increase, or approximately 94%. Despite the substantial attention devoted to advertising and new products, the current financial model remains overwhelmingly dependent on subscription monetization.
SUBSCRIBER DURABILITY, MAU QUALITY, AND EMERGING-MARKET EXECUTION
Premium subscribers increased by 6 million sequentially to 306 million, compared with 5 million additions in Q3 2025 and 7 million in Q2 2026. Annual subscriber growth was approximately 9%, versus 12% in the prior-year quarter. The distinction between durable absolute additions and slowing percentage growth is important. Spotify continues to add subscribers at considerable scale, but the larger denominator naturally reduces the growth rate.
Management expects 316 million subscribers at year-end, implying 26 million additions during 2026 and approximately 9% annual growth. That supports Alex Norström’s argument that the subscription engine remains durable. It does not imply accelerating subscriber growth. Sustained revenue growth in the mid-teens increasingly requires ARPU expansion, add-on adoption, or a stronger advertising contribution alongside subscriber additions.
MAUs increased by 11 million sequentially to 788 million, compared with 17 million additions in Q3 2025 and 16 million in Q2 2026. Annual MAU growth remained approximately 11%, but quarterly intake slowed. The Premium-subscriber-to-MAU ratio was approximately 38.8%, compared with 39.4% a year earlier and 38.6% in Q2. These ratios are useful indicators of mix, not cohort conversion rates. Quarterly net additions cannot be interpreted as a direct measure of free-to-paid conversion because acquisition, churn, reactivation, promotions, and measurement timing all affect the totals.
The separately reported 499 million ad-supported MAUs should not be calculated by subtracting 306 million subscribers from 788 million total MAUs. The disclosed populations are not a simple mutually exclusive accounting partition. This matters when estimating monetization, conversion, or the economic value of the free funnel.
The emerging-market discussion highlighted a deliberate trade-off between maximizing user counts and improving user economics. Management described better sign-up data hygiene, ad-load adjustments, and migration from lower-end clients to experiences believed to retain users more effectively. Norström characterized these changes as “business positive.” That conclusion is plausible but remains insufficiently quantified. No market-level conversion uplift, churn impact, acquisition cost, or contribution-margin improvement was disclosed.
Adding friction to a free tier can improve Premium conversion and advertising monetization among retained users, but it can also reduce funnel growth, accelerate substitution to competing services, or disproportionately affect lower-income users. The appropriate success criterion is incremental contribution value per acquired cohort, not a higher conversion percentage in isolation. A smaller, more monetizable funnel can create value, but only if the improved economics exceed the value of foregone users and future conversions.
The call’s reference to India as a market with “1.4 billion users” should be understood as a reference to the population opportunity, not Spotify’s actual Indian user base. The literal interpretation would exceed Spotify’s entire global MAU count. Similarly, Sweden’s approximately 50% paid population penetration is evidence of the potential strength of a mature market, not a directly transferable global penetration assumption. Purchasing power, payment infrastructure, local competition, household-plan economics, language catalogs, and free alternatives differ substantially across markets.
Management’s claim that more than 100 million users engage with Spotify on 28 days of the month is a meaningful indicator of habitual use. However, it describes an unspecified mix of users and represents approximately 13% of global MAUs, not the entire subscription base. It supports the argument that a substantial core audience is unlikely to cancel through simple subscription housekeeping. It does not quantify aggregate churn or establish the resilience of less engaged subscribers.
PRICING, ARPU, AND THE LIMITS OF THE VALUE-ADDITION ARGUMENT
Premium ARPU reached EUR 4.95, increasing 9.3% as reported and 7.5% at constant currency. The shareholder deck attributes underlying ARPU growth to price increases, partially offset by product and geographic mix. Q2 ARPU was EUR 4.89, with approximately 7.4% constant-currency growth. Q3 therefore sustained the preceding quarter’s strong underlying monetization rather than delivering a major new acceleration.
The combination of positive subscriber additions and higher ARPU is favorable evidence that pricing has not impaired aggregate growth. It is not sufficient to conclude that price elasticity is negligible. Strong gross additions can offset higher churn, geographic mix can conceal divergent regional outcomes, and customers can migrate between plans. Without gross-add, churn, and plan-migration disclosures, the precise demand response to pricing remains uncertain.
The disclosed 9% subscriber growth and 7.5% ARPU growth should not simply be added or multiplied to recreate Premium revenue growth. Period-end subscriber counts and the population underlying quarterly ARPU are not necessarily equivalent, and the segment reporting changes add another comparability consideration. The disclosed information does not provide a complete bridge. The reported 15% constant-currency Premium revenue growth remains the appropriate financial baseline.
For Q4, management expects ARPU growth of 4.5%-5%, supported by recent pricing actions and Audiobooks+ add-ons but offset by the anniversary of price increases across more than 150 markets. Relative to Q3’s 7.5%, that represents a slowdown of 250-300 basis points. Because Premium generates approximately 90% of revenue, this deceleration is more consequential to consolidated growth than a modest acceleration in advertising.
The monetization framework is strategically coherent. Management intends to improve the free product, enrich Premium, and offer incremental products to high-intensity users. Norström explained that the objective is an “improved value to price ratio over time.” The commercial advantage is price discrimination: occasional users can remain within the standard offering, while highly engaged listeners purchase additional audiobook hours, creator memberships, or other premium experiences.
The financial constraint is that product value and shareholder value are not identical. Additional features may increase willingness to pay but also incur content royalties, cloud expense, creator payouts, support costs, and marketing expenditure. The relevant metric is incremental lifetime contribution profit after these costs. No specific 2027 pricing schedule, new-tier economics, or add-on revenue target was provided. Management explicitly declined to offer a detailed monetization roadmap.
Family Plan verification should not be modeled as a discrete, Netflix-style monetization event. Norström described it as “ongoing routine” rather than a time-limited crackdown. No markets, completion date, conversion target, or incremental revenue estimate were disclosed. Potential upside exists if ineligible users migrate to paid accounts, but attrition and household-plan substitution could offset that benefit.
ADVERTISING: A REAL RECOVERY, BUT NOT YET A CONSOLIDATED GROWTH ENGINE
Advertising revenue reached EUR 482 million, increasing from EUR 437 million a year earlier and EUR 446 million in Q2. Constant-currency growth accelerated to 9%, compared with 3% in each of the preceding quarters. This is tangible evidence that the advertising rebuild is producing results and supports management’s earlier expectation of an improvement during the second half of 2026.
The disclosed drivers were automated buying channels and podcast sponsorships. The shareholder deck adds an important qualification: music advertising growth was driven by higher impressions sold, partly offset by pricing softness. The recovery therefore reflects improved inventory monetization and demand access more clearly than improved advertising yield. Continued CPM pressure would limit the economic benefit of audience and impression growth.
Norström described the operating objective as making it “easier and easier for advertisers to buy this special inventory.” That addresses a credible historical constraint. Better auction access, measurement, and creative-generation tools can broaden the advertiser base and improve fill rates without requiring an equivalent increase in sales headcount. However, automated buying can also migrate existing direct business into lower-priced channels. Revenue growth alone does not distinguish entirely new demand from channel substitution.
Advertising remains too small to offset a substantial Premium slowdown. At approximately a 10% revenue weight, a 6-percentage-point increase in advertising growth contributes roughly 0.6 percentage points to consolidated growth, holding other factors constant. A 1-percentage-point slowdown in Premium contributes approximately a 0.9-percentage-point drag. The subscription business therefore remains the dominant determinant of group growth.
Rich Greenfield’s question about whether advertising could lift Spotify’s overall growth rate exposed an important distinction. Advertising growing at 10% is better than advertising growing at 3%, but it remains dilutive to a Premium business growing at 15%. To lift the consolidated rate above Premium’s growth rate, advertising must grow faster than Premium. Management did not commit to that outcome or identify 2027 as a definitive inflection point.
Advertising gross margin improved to 18.7%, up approximately 105 basis points year over year, reflecting revenue growth and a more favorable podcast cost structure. Nevertheless, it remains substantially below Premium’s 34.5%. Faster advertising growth can increase absolute gross profit while diluting consolidated gross margin through mix. The strongest advertising outcome would combine faster revenue growth with improved contribution margins, not merely a larger revenue share.
GROSS MARGIN, OPERATING EXPENSES, AND THE Q4 PROFIT BRIDGE
Consolidated gross margin increased by 136 basis points to 33.0%. Premium gross margin increased approximately 130 basis points to 34.5%, while advertising gross margin increased approximately 105 basis points to 18.7%. Both segments contributed, making the improvement broader than a favorable revenue-mix effect.
Spotify attributed Premium improvement to revenue growth outpacing music costs net of marketplace programs, audiobook costs, and video podcast costs. This supports the proposition that content expansion is not necessarily dilutive at the aggregate segment level. However, the disclosure does not identify how much improvement came from pricing, marketplace economics, licensing terms, utilization patterns, or specific content categories. It therefore does not establish that every newly launched product is independently margin-accretive.
Operating expenses increased 26% as reported and 24% at constant currency. Excluding currency and social-charge movements, expense growth was 19%, matching the underlying growth rate disclosed for Q2. This is an important qualification to the characterization of Q3 as the expense-growth peak. The reported peak is evident, but the underlying rate was already elevated in Q2.
Research and development expense increased 35% to EUR 417 million, sales and marketing increased 16% to EUR 406 million, and general and administrative expense increased 30% to EUR 144 million. Headcount was 7,284, compared with 7,302 at the end of Q2. Flat staffing therefore did not mean flat technology spending. Cloud and AI costs, compensation, and other non-headcount expenses continued to increase.
Q4 guidance calls for EUR 5.2 billion of revenue, a 33.8% gross margin, and EUR 820 million of operating income. These figures imply approximately EUR 1.758 billion of gross profit and EUR 938 million of operating expenses. Relative to Q3, revenue increases approximately 4.6%, gross profit increases approximately EUR 119 million, and operating expenses decline approximately EUR 29 million. Operating income consequently increases approximately EUR 148 million, or 22%.
The resulting Q4 operating margin is approximately 15.8%, compared with 13.5% in Q3. That is a meaningful sequential improvement, but only approximately 31 basis points above Q4 2025’s operating margin. Seasonality matters: the anticipated Q4 result should not be treated as a new structural margin increase of more than 200 basis points on a year-over-year basis.
Q4 guidance assumes EUR 6 million of social charges, compared with EUR 22 million in Q3. Approximately 54% of the implied sequential expense reduction therefore reflects this assumption. Excluding social charges, operating expenses decline approximately 1.4%, rather than the approximately 3.0% headline reduction. The underlying direction is favorable, but the magnitude is moderate.
Social-charge sensitivity also creates a recurring complication when evaluating quarterly beats and misses. Spotify’s deck indicates that a 10% share-price movement around the disclosed reference point can change social charges by approximately EUR 20 million. That is larger than the entire underlying Q3 operating-income beat. Forecast comparisons should therefore continue to distinguish operating execution from equity-linked payroll-tax volatility.
NET INCOME AND EPS: WHY THE HEADLINE DECLINE OVERSTATES OPERATING DETERIORATION
Net income declined to EUR 518 million from EUR 899 million, a decrease of approximately 42%. This contrasts sharply with the 15.5% increase in operating income. The reconciliation is straightforward: operating income increased EUR 90 million, net finance income declined EUR 212 million, and tax expense increased EUR 259 million. Together, these changes explain the EUR 381 million reduction in net income.
Net finance income declined from EUR 245 million to EUR 33 million. Income tax moved from a EUR 72 million benefit to a EUR 187 million expense. The current effective tax rate was approximately 26.5%, compared with a negative effective rate in the prior-year quarter. The decline in net income therefore primarily reflects below-operating-line comparability rather than deterioration in the core business.
Diluted EPS declined from EUR 3.28 to EUR 2.48, or approximately 24%. The smaller decline relative to net income requires attention to the prior-year dilution calculation. Q3 2025 diluted earnings excluded EUR 197 million of fair-value gains on dilutive exchangeable notes, reducing the EPS numerator from EUR 899 million to EUR 702 million. Those adjustments did not recur in Q3 2026.
Diluted weighted-average shares also declined approximately 2.4%, from 213.8 million to 208.6 million. Some of that reduction reflects the absence of the exchangeable-note dilution, rather than repurchases alone. Basic weighted-average shares were approximately flat year over year. Headline diluted-share reduction should therefore not be attributed entirely to the buyback program.
Operating income and normalized cash generation are more informative valuation anchors than unadjusted year-over-year net income in this quarter. However, cash taxes remain economically relevant. Removing tax and financing volatility from the operating assessment does not justify ignoring their effect on shareholder cash returns.
FREE CASH FLOW: STRONG ABSOLUTE GENERATION, WEAKER QUARTERLY CONVERSION
Free cash flow was EUR 735 million, down from EUR 806 million in Q3 2025 and EUR 797 million in Q2 2026. Free-cash-flow margin declined from approximately 18.9% to 14.8% year over year. Operating cash flow declined 11% to EUR 740 million. The business remained strongly cash-generative, but the quarter did not demonstrate uninterrupted cash-flow acceleration.
The cash-flow statement substantiates management’s explanation. Net working-capital movements contributed approximately EUR 101 million in Q3 2025 but consumed approximately EUR 27 million in Q3 2026, a deterioration of approximately EUR 128 million. Cash taxes increased from EUR 5 million to EUR 75 million, creating a further EUR 70 million headwind. These effects outweighed improved pre-working-capital cash earnings.
Trade receivables and other assets consumed EUR 194 million, compared with EUR 26 million a year earlier. Higher trade and other liabilities partly offset that outflow. This does not establish a deterioration in collections, because the disclosed category includes assets beyond receivables and the call described timing effects. It nevertheless warrants monitoring. A recurring receivables build would be more concerning than a temporary quarter-end movement.
Capital expenditures declined from EUR 23 million to EUR 6 million, cushioning the free-cash-flow decline. The asset-light model remains an important advantage, but low capital expenditure does not mean AI infrastructure is inexpensive. Purchased cloud services can be expensed through the income statement rather than appearing as capital spending.
Trailing free cash flow was EUR 3.190 billion, approximately 9% above the prior-year trailing period but below Q2’s EUR 3.261 billion. Year-to-date free cash flow reached EUR 2.356 billion, increasing approximately 15.5%. The longer-term trajectory remains positive, but cash-flow growth is currently less rapid than the operating-income progression implied by the full-year outlook.
Stock-based compensation of EUR 87 million was added back in operating cash flow. This is standard cash-flow accounting, but it represents a real economic cost through dilution or the repurchases required to offset dilution. Lease-principal payments of EUR 20 million were also classified within financing activities rather than Spotify’s reported free-cash-flow measure. Free cash flow should therefore not be equated automatically with cash distributable to shareholders without economic adjustments.
Q4 GUIDANCE, FULL-YEAR IMPLICATIONS, AND THE ABSENCE OF A 2027 RAISE
The Q4 outlook is a new quarterly forecast, not an upward revision to a previously disclosed numerical Q4 forecast. Management reaffirmed its earlier qualitative direction: advertising should improve in the second half, expense growth should moderate after Q3, and investment should support longer-term monetization. The call did not provide formal 2027 guidance or raise the 2030 targets.
The 818 million MAU forecast implies 30 million sequential additions, compared with 38 million in Q4 2025. Management attributed the comparison to the unusually successful prior-year free-tier rollout. The implied year-end annual MAU growth rate is approximately 8.9%, below Q3’s approximately 11%. Subscriber guidance of 316 million implies 10 million additions, compared with 9 million in Q4 2025, and approximately 9.0% annual growth.
Revenue guidance of EUR 5.2 billion implies approximately 14.8% reported growth against Q4 2025. The shareholder deck assumes an approximately 230-basis-point currency tailwind. This suggests underlying growth of roughly 12.5%, subject to guidance rounding. The combination of slower ARPU growth and a favorable currency contribution is therefore important: reported revenue can remain healthy even as underlying growth moderates.
The 33.8% gross-margin forecast implies approximately 70 basis points of year-over-year expansion, compared with 136 basis points in Q3. The slower expansion reflects a more demanding comparison and investment in content expansion. It should not be interpreted as a broken margin trajectory, but it does argue against extrapolating Q3’s improvement mechanically into future periods.
Combining reported Q1-Q3 results with Q4 guidance produces approximately EUR 19.479 billion of 2026 revenue, EUR 2.862 billion of operating income, and a 14.7% operating margin. These compare with EUR 17.186 billion, EUR 2.198 billion, and approximately 12.8% in 2025. The implied full-year increases are approximately 13.3% in reported revenue and 30.2% in operating income. Implied gross margin is approximately 33.3%, around 130 basis points above 2025, consistent with management’s commentary.
The full-year picture is therefore substantially more favorable than Q3’s reported operating-margin comparison alone. However, the remaining earnings sensitivity is concentrated in delivery of the Q4 expense and gross-margin assumptions. There was no full-year free-cash-flow forecast.
AI STRATEGY: DISTRIBUTION ADVANTAGE VERSUS INTERFACE DISINTERMEDIATION
The central strategic argument is that Spotify can remain the system through which content is licensed, personalized, played, and monetized even when another company controls the conversational interface. Gustav Söderström stated, “What is happening is you are talking to that agent, which remote controls Spotify in the background.” That distinction is economically important. An external agent does not necessarily replace Spotify’s subscription, playback infrastructure, licensing relationships, or audio advertising.
Spotify’s existing integration history supports the feasibility of this architecture. Connected speakers, navigation applications, and other interfaces have allowed listening to occur outside Spotify’s foreground application without eliminating its economic role. The company’s strategy is to extend that distribution model into AI agents, with Spotify’s own agent handling taste-based reasoning and execution.
Management also argued that external-agent usage can improve Spotify’s data rather than simply transferring value away. Personalized content generated through an external interaction can be saved to Spotify, creating additional information about the user’s interests. Söderström stated, “We are not sending the data to these partners.” The stated architecture preserves Spotify’s internal taste reasoning, although the call did not disclose detailed partner economics, commercial access terms, or the full contractual allocation of customer data.
The strategic risk is not resolved solely by retaining playback. A powerful agent can compare subscription prices, recommend competing services, influence renewal decisions, and potentially commoditize discovery. It may retain the most valuable intent signal even if playback occurs elsewhere. Spotify could remain essential operational infrastructure while losing some control over acquisition, merchandising, and pricing.
The analogy with navigation applications is consequently useful but incomplete. Navigation interfaces generally did not actively evaluate competing music subscriptions or optimize household subscription spending. Agents may do both. Spotify’s defense must be sustained differentiation in taste data, experience, content breadth, social features, and value, rather than integration ubiquity alone.
Management’s claim that entertainment benefits when agents eliminate chores is directionally reasonable, but category effects differ. Music is difficult to replace with a summary. Informational podcasts and books are more exposed to summarization and synthetic substitutes. Personalized generated podcasts could create incremental listening occasions while also displacing consumption of professionally produced content. The net effect on creator economics, licensing costs, and subscription willingness to pay remains uncertain.
Background monetization is a genuine advantage for audio, but it is not equally favorable for every advertising format. Audio ads can remain relevant while the application is not visible. Display inventory, video engagement, and in-app promotional discovery may be more sensitive to interface migration. Aggregate listening growth should therefore not be assumed to translate proportionately into advertising value.
AI PRODUCTIVITY AND PRODUCT ADOPTION: EVIDENCE IS IMPROVING, BUT ROI REMAINS PARTIALLY OBSERVED
Spotify provided more substantive evidence of AI adoption than generic references to experimentation. Nearly 40 million Premium users now listen to mixed playlists, equivalent to approximately 13% of the subscriber base, although the precise activity window was not specified. Consumption of mixed playlists increased 90% sequentially, and millions of users create mixes each month. Management also cited tens of millions of users communicating with Spotify in natural language and approximately 100 million users approaching engagement with About the Song.
These adoption figures are meaningful, but they are not additive. The same user can interact with several features, and cumulative users are not equivalent to monthly active users or retained paying users. High growth from a relatively small base also does not establish enduring behavior. The most relevant missing disclosure is the incremental effect on retention and contribution profit after controlling for the fact that highly engaged users are more likely to adopt new features.
The large taste model is strategically more consequential than any individual interface feature. Better understanding of listening history, sequencing, timing, and context can improve discovery and differentiate the service even when music catalogs are broadly similar. Mixing adds richer behavioral information than playlist membership alone because it reveals how tracks fit together at a more granular level.
Management reported double-digit improvements in discovery and said early deployments were on track to add billions of listening hours annually. These statements indicate potential scale, but no baseline, experimental methodology, or economic conversion was disclosed. Additional listening hours have different financial consequences across Premium, advertising-supported music, podcasts, and audiobooks. Subscription listening does not produce incremental revenue per hour, while some content and infrastructure costs can rise with usage.
The engineering discussion was more credible than a simple claim that AI generates more code. Söderström distinguished early activity measures from completed, shipped products and stated, “We are shipping much more.” He described stronger delivery after successive 6-month development cycles. Flat headcount alongside faster product shipping is consistent with improved output per employee.
However, higher output is not yet equivalent to lower expense or better returns on invested capital. R&D expense increased 35%, and underlying operating expenses increased 19%. The evidence supports productivity gains within a higher-investment model, not a demonstrated reduction in total engineering costs. Model-routing infrastructure and lower token prices can improve unit costs, but increased usage, richer features, and more complex inference may absorb those savings.
Management’s statement that investment would remain “roughly at the same levels” is best interpreted as continued investment commitment alongside slower expense growth, not a promise that all AI spending will decline. Lower year-over-year growth can result from anniversary effects even when absolute spending remains high.
The commercialization of internal development software should remain outside the core valuation. Söderström explicitly said, “Think about it as option value for the time being.” Selling tools developed for internal use can spread fixed costs across a wider customer base, but enterprise software commercialization introduces support, security, distribution, and product-management requirements. No revenue, customer count, contract value, or profitability measure was disclosed.
AUDIOBOOKS, CREATOR MONETIZATION, AND CONTENT EXPANSION
Audiobook expansion from 22 markets to more than 180 is a major distribution development, but geographic count should not be confused with proportional revenue opportunity. The existing markets already include important audiobook-consuming economies. New markets differ in purchasing power, local-language catalog availability, listening habits, and willingness to buy add-ons. An increase of more than 8 times in market count does not imply a similar increase in near-term revenue.
The shareholder deck states that listeners in new markets will gain access to more than 350,000 titles across more than 120 languages. That does not establish identical catalogs, listening allowances, or subscription economics across all countries. Local content depth and commercial terms will determine whether availability translates into meaningful adoption.
Management cited a 40% increase in audiobook listenership before the global rollout, but the spoken answer did not identify the comparison period. The figure supports directional momentum but should not be presented as a precisely defined quarterly or annual growth rate. More important economically, management claimed that audiobook adoption increases active days, retention, lifetime value, and add-on demand.
The underlying mechanism is credible. Long-form content can create habitual engagement, increase the number of use cases served by the subscription, and support purchases from high-intensity listeners. The limitation is selection bias: audiobook adopters may already be unusually engaged or willing to spend. The call did not disclose controlled churn improvements or the net contribution margin of those cohorts.
The May 2026 Investor Day provided useful context by describing Audiobooks+ as a differentiated monetization opportunity and discussing higher-value user cohorts. Q3’s commentary indicates that the company is moving from proving the category toward scaling distribution. Nevertheless, audiobook economics remain dependent on consumption costs, publisher terms, add-on attachment, and the balance between bundled access and incremental payments.
The Q4 gross-margin forecast already includes initial investment in the expansion. Guidance for 33.8% consolidated gross margin despite the rollout is encouraging, but it does not demonstrate immediate profitability in every new market. Pricing and scale benefits elsewhere in the business can offset initial losses or investment in newly launched markets.
Creator Memberships and the expansion of the Spotify Partner Program further develop the high-intensity-fan monetization strategy. Memberships allow creators to sell differentiated experiences directly to fans, while the Partner Program uses engagement-based economics to attract and retain content supply. These mechanisms can deepen creator dependence on Spotify and increase user engagement, but they also create new payout obligations.
The call did not disclose Spotify’s net take rate, revenue-recognition basis, contribution margin, or expected scale for Memberships. Gross fan spending should not be equated with Spotify revenue. Similarly, additional creator payouts can improve content supply while raising costs. The economic objective should be incremental platform contribution, not merely greater creator activity.
MUSIC RIGHTS, PODCAST RENEWALS, AND THE DISTRIBUTION OF VALUE
The renewal cycle discussed for Universal Music Group and Warner Music Group in early 2027 is a material financial catalyst. The analyst’s reference to the agreements’ 2-year anniversary should not be treated as independently verified contractual expiration dates, but management confirmed the recurring negotiation rhythm. Norström emphasized that partner interests were becoming more aligned.
Alignment on industry growth does not determine how value is divided. Labels and publishers can support price increases, paid remix products, and broader distribution while seeking a larger share of the resulting economics. Spotify’s ability to add consumer value may strengthen its negotiating position, but rights-holder concentration remains a structural constraint.
Remixes and covers offer a potential new revenue pool because they monetize participation rather than passive access. The addition of Believe and TuneCore broadens the potential rights ecosystem. However, consent, attribution, compensation, and catalog participation are fundamental operating requirements, not peripheral details. Product appeal and economics will depend on the breadth of authorized content and the cost of clearing usage.
The renewed Joe Rogan agreement supports continuity in a strategically important podcast franchise. No financial terms were disclosed. The renewal should therefore be treated as content-retention evidence, not a quantified margin catalyst. Higher guarantees, revenue shares, or other commitments could offset sponsorship growth, while better distribution and ad monetization could improve returns. The call does not resolve that balance.
A 100-basis-point change in consolidated gross margin on an illustrative EUR 22.2 billion 2027 revenue base represents approximately EUR 222 million of operating income before offsets. That is approximately 5.7% of the base-case operating-income estimate below. Relatively small changes in rights economics can therefore materially affect valuation.
BALANCE SHEET AND CAPITAL ALLOCATION
The written financial statements resolve an important inconsistency in the spoken transcript. The approximately 9.9 billion liquidity figure is denominated in euros, not dollars, and includes cash, cash equivalents, restricted cash, and short-term investments. Cash and cash equivalents alone were EUR 6.032 billion, while short-term investments were EUR 3.856 billion. The entire headline liquidity balance should not be described as unrestricted cash and cash equivalents.
The absence of financial debt other than lease obligations strengthens strategic flexibility and reduces refinancing risk. However, not all liquidity should automatically be considered distributable. Operating reserves, licensing obligations, working-capital requirements, leases, and potential acquisitions remain relevant. Spotify also holds other investments whose value is distinct from operating cash generation.
Management reported repurchases of 2.2 million shares for approximately $1.1 billion through October 21. The implied average purchase price is approximately $500 per share, based on rounded figures. That arithmetic does not establish whether the purchases were attractive relative to intrinsic value. It only indicates the approximate execution level.
The repurchases have moved beyond dilution neutralization, but the scale should not be overstated. Management referenced approximately 1 million shares associated with employee-program dilution. On that simplified basis, approximately 1.2 million repurchased shares represent excess returns beyond the stated dilution offset, equivalent to roughly 0.6% of the share base. Timing and award mechanics limit the precision of that estimate.
The financial statements show EUR 851 million of repurchases during the first 9 months, compared with EUR 2.356 billion of free cash flow, or approximately 36%. This is a cleaner same-period, same-currency comparison than dividing the October dollar repurchase total by September euro cash flow. The payout level leaves considerable flexibility, but no fixed repurchase cadence or committed distribution ratio was announced.
Organic investment remains the highest priority, followed by acquisitions and opportunistic shareholder returns. The references to WhoSampled, Findaway, and Sonantic illustrate a capability-acquisition strategy rather than a disclosed intention to pursue a large transaction. The risk is that accumulated liquidity supports increasingly ambitious projects whose returns are less certain than those of the core subscription business. Buyback flexibility provides a counterweight, but not a guaranteed floor under the share price.
VALUATION AND PROBABILITY-WEIGHTED INVESTMENT CASE
The following scenarios are analytical estimates, not management guidance. They use a 12-18-month horizon, a constant EUR/USD rate of 1.1194, approximately 208.6 million diluted shares, and EUR 9.888 billion of cash and short-term investments. They do not assume future net cash accumulation, additional share-count reduction, or separate value for other investments and internal software commercialization. Lease adjustments and required operating cash reserves are not separately modeled, making the outputs illustrative rather than precise transaction values.
The base case carries a 55% probability. Revenue reaches EUR 22.2 billion in 2027, approximately 14% above the 2026 outlook-derived base, and operating margin reaches 17.5%, producing EUR 3.885 billion of operating income. This assumes continued subscriber growth, mid-single-digit ARPU support, advertising growth in the low-to-mid-teens, and materially slower expense growth. With a 34.8% gross margin, the operating-margin assumption implies approximately EUR 3.84 billion of operating expenses, only about 6% above the 2026 implied expense base. The case therefore depends on a genuine spending inflection. Applying 28 times operating income produces an equity value of approximately $637 per share, or approximately 12% upside.
The bull case carries a 25% probability. Revenue reaches EUR 23.0 billion, increasing approximately 18%, while operating margin reaches 19.5%, producing EUR 4.485 billion of operating income. This requires stronger add-on monetization, more sustained pricing power, advertising growth that becomes genuinely accretive to consolidated growth, and unusually strong expense leverage. Applying 32 times operating income produces approximately $823 per share, or approximately 44% upside. This case would require Spotify to approach its longer-term operating-margin ambition substantially earlier than 2030.
The bear case carries a 20% probability. Revenue reaches EUR 21.0 billion, increasing approximately 8%, while operating margin falls to 14.0%, producing EUR 2.940 billion of operating income. Subscriber growth continues, but pricing anniversaries, weaker add-on monetization, disappointing advertising yields, or unfavorable content costs limit earnings growth. Operating expenses remain elevated despite slower revenue growth. Applying 22 times operating income produces approximately $400 per share, or approximately 30% downside.
The probability-weighted value is approximately $636, corresponding to approximately 11% upside from the observed price. These probabilities are judgmental, and confidence in precise price targets is moderate at best. The central result is that the expected return is positive but not compelling relative to the downside sensitivity and the degree of operating leverage required.
Valuation is particularly sensitive to margin delivery and the multiple assigned to that delivery. At base-case revenue and a 28-times multiple, 100 basis points of operating margin changes estimated value by approximately $33 per share. A change of 1 multiple point on base-case operating income changes estimated value by approximately $21 per share. A modest earnings disappointment combined with multiple compression can therefore overwhelm several quarters of subscriber growth.
Spotify’s unchanged 2030 targets, disclosed at the May Investor Day, include a mid-teens revenue CAGR, gross margin of 35%-40%, and operating margin above 20%. Q3 supports continued progress toward those objectives but does not eliminate the remaining execution requirement. Q4’s approximately 15.8% operating margin still leaves more than 420 basis points to reach the minimum operating-margin ambition.
RECOMMENDED ACTION, CATALYSTS, AND RISK PARAMETERS
A HOLD stance is appropriate at approximately $571. Incremental buying becomes more attractive near or below $520, assuming the operating thesis remains intact. At that level, the probability-weighted valuation offers approximately 22% upside without requiring an increase in the modeled fair value. Conversely, a move materially above approximately $650 without corresponding earnings revisions would reduce the attractiveness of the base-case return and favor trimming rather than increasing exposure.
The most immediate catalyst is Q4 execution against 316 million subscribers, 818 million MAUs, 33.8% gross margin, and EUR 820 million of operating income. The next major catalyst is formal 2027 guidance, particularly the relationship between revenue growth, expense growth, and operating-margin expansion. Early-2027 music-rights negotiations and the first meaningful retention and monetization data from expanded audiobook markets are additional decision points. Wrapped and year-end promotions can support subscriber acquisition, but their value should be assessed through retention and subsequent monetization rather than gross intake alone.
The thesis would be weakened by persistent constant-currency revenue growth below approximately 12% without compensating margin upside; failure of underlying expense growth to moderate meaningfully in 2027; recurring gross-margin disappointments attributable to content or AI costs; or advertising growth remaining below 10% despite the completed infrastructure rebuild. A repeated working-capital cash outflow would also require reassessment. These are analytical review thresholds, not company forecasts.
Any new position should be sized as a growth and execution exposure rather than a defensive subscription utility. An illustrative initial allocation of 0.75% of portfolio NAV, with a 1.5% ceiling before stronger evidence of 2027 leverage, would limit concentration while preserving participation. A 15% price-loss exit threshold on a new position implies approximately 11 basis points of planned portfolio loss at the initial weight and approximately 23 basis points at the ceiling, excluding gaps and execution slippage. A broken operating thesis should trigger exit independently of that price threshold. Stops do not guarantee a maximum realized loss.
Spotify adds exposure to consumer subscriptions, advertising cyclicality, AI-related valuation sentiment, content negotiations, and foreign-exchange translation. It may diversify business models relative to semiconductor and infrastructure holdings, but it should not be assumed to diversify growth-factor or technology-sector drawdown risk. Actual correlations and incremental portfolio risk cannot be quantified without the holdings and risk book.
The decisive implication of Q3 is that Spotify has largely validated the durability of its subscription franchise and its ability to generate substantial cash, but has not yet fully validated the next stage of earnings leverage. The investment case now depends less on user-scale milestones and more on the conversion of pricing, engagement, and product breadth into operating profit per share. Q4 guidance is directionally supportive. The valuation requires that the improvement persist beyond the seasonal quarter.
SOURCE BASIS
Financial comparisons reflect Spotify’s Q3 2026 shareholder deck dated October 22, 2026, the Q2 2026 shareholder deck dated August 4, 2026, the supplied Q3 earnings-call transcript, and Spotify’s May 21, 2026 Investor Day disclosures. Historical segment comparisons use the recast figures in the 2026 disclosures. Market references reflect the Bloomberg retrieval described above. Scenario probabilities, valuation multiples, price estimates, and portfolio-risk thresholds are analytical assumptions rather than company guidance.
COMPANY EMPLOYEES ON THE CALL
• Alex Norström, Co-Chief Executive Officer. • Gustav Söderström, Co-Chief Executive Officer. • Christian Luiga, Chief Financial Officer. • Bryan Goldberg, Head of Investor Relations.
RESEARCH ANALYSTS WHOSE QUESTIONS WERE PRESENTED ON THE CALL
• Sean Diffley, Morgan Stanley. • Jessica Reif Ehrlich, BofA Securities. • Eric Sheridan, Goldman Sachs. • Rich Greenfield, LightShed Partners. • Jason Bazinet, Citi. • Justin Patterson, KeyBanc Capital Markets. • Douglas Anmuth, J.P. Morgan. • Batya Levi, UBS. • Michael Morris, Guggenheim Securities.
Key Read-Throughs
KEY READ-THROUGHS FROM SPOTIFY’S Q3 2026 EARNINGS CALL
Spotify’s quarter points to a redistribution of value within digital media rather than a broad acceleration in consumer spending or advertising demand. The strongest positive implications are for established content owners and advertising infrastructure providers that can monetize Spotify’s growing distribution without funding its consumer-acquisition costs. The clearest negative implications are for standalone audiobook subscriptions and competing creator-monetization platforms, where Spotify is using an existing subscription base and audience to lower the incremental cost of adoption. The distinction between revenue growth and value capture is critical: more listening does not automatically generate more music royalties, higher Spotify ARPU does not entirely accrue to music suppliers, and automated advertising growth does not flow equally to every intermediary. Several launches were announced before the call, making the incremental signal confirmation of execution and adoption rather than entirely new information. The following read-throughs prioritize direct commercial relationships and identifiable competitive mechanisms over broad thematic extrapolation.
AUDIOBOOKS AND BOOK PUBLISHING
BUNDLED AUDIOBOOKS PRESSURE STANDALONE SUBSCRIPTIONS, BUT THE GEOGRAPHIC DETAILS MATTER (READ-THROUGH 1)
Affected companies: Storytel (STORY B: Sweden); Amazon (AMZN: United States), through Audible. Direction: negative competitive pressure. Magnitude: potentially material to Storytel’s medium-term streaming economics; meaningful at Audible’s product level but small relative to Amazon’s consolidated earnings.
The supporting call commentary is unusually direct. Spotify is expanding audiobooks from 22 markets to more than 180 by year-end, while management reported a 40% increase in audiobook listenership before the expansion. Alex Norström stated that audiobooks increase active days, retention, and lifetime value, alongside encouraging add-on demand. This establishes audiobooks as an increasingly important component of Spotify’s subscription proposition rather than a peripheral catalog experiment.
The transmission mechanism is a reduction in the incremental price and acquisition friction of audiobook consumption. A customer already paying for Spotify can access an included allowance in eligible markets without first purchasing a separate audiobook subscription. For occasional listeners whose consumption fits within that allowance, a standalone subscription becomes harder to justify. Storytel and Audible must defend through deeper local catalogs, exclusives, larger listening allowances, stronger discovery, or promotional pricing. Those responses can raise content and acquisition costs even if subscriber numbers remain resilient.
The important geographic qualification comes from Spotify’s October launch terms. Eligible Premium subscribers receive 12 included monthly hours in markets including Italy, Spain, Brazil, Mexico, Colombia, Poland, and Norway. By contrast, Audiobooks+ is the primary access model across Africa, Asia, and Argentina. The strongest competitive pressure therefore occurs where audiobook access is bundled into an existing music subscription, not uniformly across all 180-plus markets. Treating the expansion as a worldwide free-audiobook offering would materially overstate the threat.
Storytel has meaningful defenses. Its publishing businesses own valuable content, and its local-language expertise and offerings for heavy listeners reduce direct substitutability. Those publishing assets can also benefit from broader audiobook distribution, although the call does not quantify any incremental payments to Storytel-owned publishers. Storytel’s strong Q2 results and increased full-year EBITDA guidance show that competitive pressure has not yet translated into an established earnings decline.
The near-term trading catalyst is Storytel’s October 27 earnings release. The relevant information is forward commentary on retention, promotional intensity, pricing, and marketing expenditure. Q3 results largely precede the October expansion and should not be interpreted as a clean test of its impact. The longer-duration risk is erosion of standalone audiobook pricing power and higher acquisition costs over the next 12-24 months. Confidence is high in the increase in competitive pressure, not in an imminent earnings miss.
AUDIOBOOK RIGHTS OWNERS BENEFIT FROM PLATFORM COMPETITION MORE CLEANLY THAN DISTRIBUTORS (READ-THROUGH 2)
Affected company: News Corp (NWSA: United States), through HarperCollins. Direction: positive. Magnitude: meaningful for the audiobook revenue stream, moderate for the publishing segment, and modest at the consolidated company level.
The supporting call evidence is the combination of expanding geographic distribution, rising audiobook adoption, and monetization through add-ons. Gustav Söderström described the objective as growing the market itself rather than merely competing for existing audiobook spending. Management also stated that audiobooks contribute to acquisition, retention, active days, and margin improvement in established markets.
HarperCollins benefits through an existing supplier relationship rather than an assumed future contract. News Corp’s fiscal Q4 2026 commentary identified Spotify and Audible as contributors to 16% audiobook revenue growth. Spotify’s expansion therefore extends a demonstrated distribution channel. More discovery, broader availability, and increased consumption can generate additional publisher receipts under the applicable commercial agreements.
The attractive distinction is that a publisher can monetize competing platforms simultaneously. Spotify’s global expansion announcement explicitly describes its audiobook partnerships as non-exclusive. HarperCollins does not have to predict which consumer interface wins; it can earn through Spotify, Audible, and other distributors where rights are available. Competition among distributors can also improve publishers’ negotiating alternatives and reduce dependence on a dominant retail channel.
Backlist economics are particularly relevant. Existing audiobook titles can reach additional audiences without repeating the full editorial and production investment associated with a new release. Incremental receipts still carry author royalties, distribution economics, and potentially localization costs, but the opportunity is not dependent on continually financing new consumer platforms or acquiring subscribers directly.
The magnitude should remain proportionate. Audiobooks are only part of HarperCollins, which is itself part of a diversified company. Furthermore, access does not guarantee incremental consumption, and some Spotify listening can substitute for purchases elsewhere. The simultaneous growth previously reported at Spotify and Audible is nevertheless evidence that market expansion and competitive redistribution can coexist.
The near-term catalyst is evidence of continued audiobook growth in News Corp’s subsequent results. The more important fundamental shift develops through 2027 as additional markets become commercially productive. The cross-portfolio implication is that audiobook intellectual property offers cleaner exposure to category growth than a standalone subscription distributor facing bundled competition.
ADVERTISING TECHNOLOGY
SPOTIFY’S ADVERTISING RECOVERY SUPPORTS ITS PROGRAMMATIC PARTNERS, NOT A BLANKET ADVERTISING UPGRADE (READ-THROUGH 3)
Affected companies: Magnite (MGNI: United States); The Trade Desk (TTD: United States); Alphabet (GOOGL: United States), through Display & Video 360. Direction: positive. Magnitude: potentially more relevant to Magnite’s audio-related activity, modest for The Trade Desk, and negligible at Alphabet’s consolidated scale.
Spotify reported 9% constant-currency advertising growth, compared with 3% in each of Q1 and Q2. Management identified automated buying channels as a principal driver. Norström described the commercial objective as making it “easier and easier for advertisers to buy this special inventory,” including better access, measurement, and audio-ad creation.
The commercial relationships are established. Spotify’s advertising disclosures identify The Trade Desk and Google Display & Video 360 as access points to its exchange. Magnite has separately disclosed its SpringServe integration with Spotify Ad Exchange and its role enabling DSP access. These are identifiable transaction and infrastructure relationships, not inferred exposure based on participation in the broader advertising sector.
The transmission mechanism is increased monetizable activity through those channels. For DSPs, additional advertiser spending can generate platform revenue under their commercial arrangements. For Magnite, increased use of its integration and infrastructure can support monetization under the relevant contractual model. Spotify’s results are therefore encouraging evidence that previously announced integrations are supporting an expanding advertising business.
The less obvious implication is that this is primarily a distribution-and-execution signal, not evidence of a broad improvement in advertising prices. Spotify’s supporting financial disclosures attribute music advertising growth to more impressions sold, partly offset by pricing softness. More accessible inventory can benefit buying infrastructure even when publishers face weak pricing.
The earnings translation remains bounded. Spotify generated approximately EUR 482 million of quarterly advertising revenue, but only a portion passes through each external partner, and those partners recognize their contractual economics rather than Spotify’s entire advertising revenue. Spotify Ads Manager also provides an internal buying route. No partner-specific volume allocation, take rate, exclusivity, or incremental revenue commitment was disclosed.
The near-term catalyst is confirmation of audio-related activity and customer spending in the partners’ next results. The longer-duration positive is the migration of digital audio into standardized programmatic workflows, making it easier for agencies to allocate budgets across formats. The strongest conclusion is favorable transaction-volume exposure, not an automatic material EPS upgrade for every partner.
RECORDED MUSIC AND MUSIC PUBLISHING
SUBSCRIBER AND PRICING RESILIENCE SUPPORT THE MUSIC ROYALTY POOL (READ-THROUGH 4)
Affected companies: Universal Music Group (UMG: Netherlands); Warner Music Group (WMG: United States); Sony Group (6758: Japan). Direction: positive. Magnitude: moderate for the music businesses of Universal and Warner; smaller at Sony’s diversified group level.
Spotify added 6 million Premium subscribers to reach 306 million, exceeding guidance by 1 million. Premium revenue increased 15% at constant currency, supported by subscriber growth and higher ARPU. Management expects 316 million subscribers at year-end, implying 26 million additions during 2026. Subscriber growth occurred across all regions despite price increases.
These figures support continued expansion in the economic base from which recording and publishing royalties are funded. The mechanism is higher eligible subscription revenue, more paying customers, and the continued commercial relevance of licensed catalogs. This is a stronger supplier signal than a simple increase in listening hours because it reflects actual monetization rather than engagement alone.
The favorable interpretation is particularly relevant to the argument that music streaming has exhausted its pricing opportunity. Spotify’s aggregate results show that monetization can increase while the subscriber base continues to grow. They do not prove that churn is unaffected, but they reduce the credibility of a thesis that recent pricing actions necessarily cause a contraction in paid demand.
The supplier benefit is not proportional to Spotify’s total Premium growth. Music suppliers receive payments under specific recording and publishing agreements, with outcomes affected by catalog share, geography, plan mix, allocation rules, and other commercial terms. Subscriber outperformance led by Latin America and the rest of the world does not have the same revenue value as identical additions in higher-priced markets. Universal’s, Warner’s, and Sony’s own repertoire performance remains important.
The near-term implication is supportive evidence for streaming revenue in upcoming music-company results, not justification for applying Spotify’s 15% growth rate directly to their subscription revenue forecasts. The longer-duration positive is a larger recurring royalty pool funded by a resilient paid ecosystem.
Early-2027 negotiations create an additional catalyst. Management acknowledged the recurring agreement cycle with Universal and Warner and described improving alignment. That raises the importance of how pricing and new products are shared economically, without establishing that the agreements legally expire on the exact dates suggested in the analyst’s question.
SLOWER ARPU GROWTH AND NON-MUSIC MONETIZATION LIMIT THE NEAR-TERM LABEL UPSIDE (READ-THROUGH 5)
Affected companies: Universal Music Group (UMG: Netherlands); Warner Music Group (WMG: United States); Sony Group (6758: Japan). Direction: negative for the incremental royalty-growth impulse and for forecasts extrapolating Q3 monetization; not a forecast of declining royalty revenue. Magnitude: modest to moderate within streaming revenue, with a smaller effect on consolidated earnings.
Spotify expects Q4 ARPU growth of 4.5%-5%, down from 7.5% in Q3. Christian Luiga attributed the slowdown partly to the anniversary of pricing actions across more than 150 markets. The same outlook identifies Audiobooks+ add-ons as a source of ARPU support.
The immediate transmission mechanism is a smaller year-over-year pricing contribution to the relevant subscription revenue base. Existing price increases continue to support the absolute revenue level, but their contribution to growth diminishes as they enter the comparison period. A label forecast relying on sustained Q3-level monetization would therefore face a less favorable pricing impulse, all else equal.
The more important structural distinction is that Spotify is increasingly generating subscription value outside music. Audiobook add-ons, podcast memberships, and other specialized products can improve Spotify’s revenue and retention without creating an equivalent increase in the music royalty pool. Their economics accrue to the relevant publishers, creators, and platform participants under separate arrangements.
This weakens the use of Spotify’s consolidated ARPU as a simple proxy for music-label monetization. Spotify can become more profitable while recording and publishing revenue grow more slowly. Conversely, an increase in music listening within a fixed subscription does not necessarily expand aggregate royalties if the relevant economics are largely revenue-based.
The call does not disclose enough information to quantify a label-specific downgrade. Country-level pricing, the music share of bundle revenue, contract provisions, and repertoire performance remain necessary. The high-conviction conclusion is narrower: the direction of the pricing comparison becomes less favorable, and the mapping between Spotify’s ARPU and music-rights income becomes less direct.
The near-term catalyst is the Q4 reporting cycle and disclosure of subscription-streaming growth. The longer-duration issue is bargaining over how much value from a broader media bundle should accrue to music. A cross-portfolio position in both Spotify and the labels should not be treated as exposure to an identical earnings stream.
LICENSED AI CREATION IS AN INCREMENTAL MONETIZATION CHANNEL FOR COPYRIGHT OWNERS (READ-THROUGH 6)
Affected company: Universal Music Group (UMG: Netherlands). Direction: positive for long-term intellectual-property monetization and the durability of licensing economics. Magnitude: strategically meaningful, but currently small and unquantifiable in near-term earnings.
The call highlighted the addition of Believe and TuneCore to Spotify’s remix-and-cover initiative. Norström described “consent, credit, and compensation” as the foundation. Management also reported nearly 40 million Premium users listening to mixed playlists and 90% sequential growth in their consumption, evidence of substantial interest in interactive music experiences.
Universal has a direct commercial basis for benefiting. Its previously announced agreement with Spotify covers licensed fan-made covers and remixes and identifies the product as a paid Premium add-on. The Q3 call therefore provides adoption-related context and evidence of broader rights participation around an already established commercial framework.
The transmission mechanism differs from ordinary streaming. Consumers can pay to interact with and transform authorized music, creating an additional revenue pool associated with recordings, compositions, and participating artists. This potentially monetizes intensive fandom above the standard subscription price rather than relying exclusively on more subscribers or higher basic subscription fees.
The important qualification is that listening to mixed playlists is not the same as purchasing a licensed generative-music product. The 90% consumption increase should not be treated as revenue growth, paid conversion, or proof of demand for a separately priced remix subscription. It demonstrates engagement with interactivity, not the final economics of the new product.
Nevertheless, the commercial structure is a positive counterexample to the claim that generative AI necessarily eliminates payments to established rights owners. A large consumer distributor is choosing licensed participation and compensation as part of its product architecture. That supports the economic relevance of controlled catalogs and rights administration.
The near-term catalysts are product availability, pricing, authorized catalog breadth, and any disclosed revenue-sharing terms. The fundamental opportunity is longer-duration. No material earnings contribution should be assumed before paid adoption is demonstrated. Warner and Sony may benefit from broader industry developments, but the specific Universal agreement should not be imputed to them without equivalent contractual evidence.
CREATOR ECONOMY AND VIDEO PLATFORMS
CREATOR MEMBERSHIPS INCREASE COMPETITION FOR YOUTUBE’S HIGHEST-VALUE FAN SPENDING (READ-THROUGH 7)
Affected company: Alphabet (GOOGL: United States), through YouTube. Direction: negative competitive pressure on podcast-related memberships and creator relationships. Magnitude: modest within the relevant YouTube activities and very small at Alphabet’s consolidated scale.
The supporting call commentary is the launch of Creator Memberships and expansion of the Spotify Partner Program into 35 additional markets. Söderström explained the monetization logic directly: “Some fans want to go deeper and are willing to spend more, and now they can do that right on Spotify.” This targets direct fan payments and recurring creator income, not simply advertising impressions.
Spotify’s October 20 launch terms make the competitive mechanism more concrete. Creators can offer exclusive audio or video, bonus episodes, early access, and other benefits within Spotify. The disclosed platform fee is 10%, including payment processing, foreign-exchange, and payout fees, with applicable taxes handled separately. YouTube’s disclosed channel-membership framework pays creators 70% of net revenue. The precise payment bases differ, but Spotify is clearly offering an economically attractive alternative for eligible creators.
The pressure operates through both creator incentives and customer conversion. Podcasters with an existing Spotify audience can promote memberships where listeners already consume their content, reducing the need to move fans to another platform. More favorable retained economics can encourage creators to direct valuable fan relationships and exclusive benefits toward Spotify. Alphabet can lose incremental membership spending without losing the creator’s entire public-video distribution.
This need not become an exclusivity contest. Creators can continue publishing widely on YouTube while monetizing their most engaged fans elsewhere. That makes public video views an incomplete measure of competitive outcomes. The more relevant indicators are the location of paid memberships, exclusive benefits, customer relationships, and creator-directed promotion.
YouTube retains substantial advantages in discovery, reach, video-native behavior, and established monetization. Spotify’s launch therefore does not support a broad negative forecast for YouTube advertising or Alphabet earnings. The high-conviction conclusion is increased competitive pressure on a defined monetization category, not imminent displacement of YouTube.
The near-term catalyst is creator adoption following the October launch, particularly whether established shows direct paid memberships toward Spotify. The longer-duration risk is reduced platform take-rate flexibility and stronger creator bargaining power. Alphabet also has a positive Spotify-related exposure through Display & Video 360, underscoring why these business-level effects should not be collapsed into a single large directional call on the parent company.
Report record
- Sector
- Communication Services
- Fiscal period end
- September 30, 2026
- Report date
- October 22, 2026
- Analysis
- 7367 words
- Read-throughs
- 2843 words
- Content fingerprint (PDF)
fd90c47d728c- Content fingerprint (analysis)
2a9863de23df- Content fingerprint (read-throughs)
babeb6c4898d
Prepared from the company's earnings release and earnings call transcript. Figures as reported by the company. For information only. Not investment advice.
More from Spotify Technology S.A.
No other reports yet.
All Spotify Technology S.A. reports
More in Communication Services
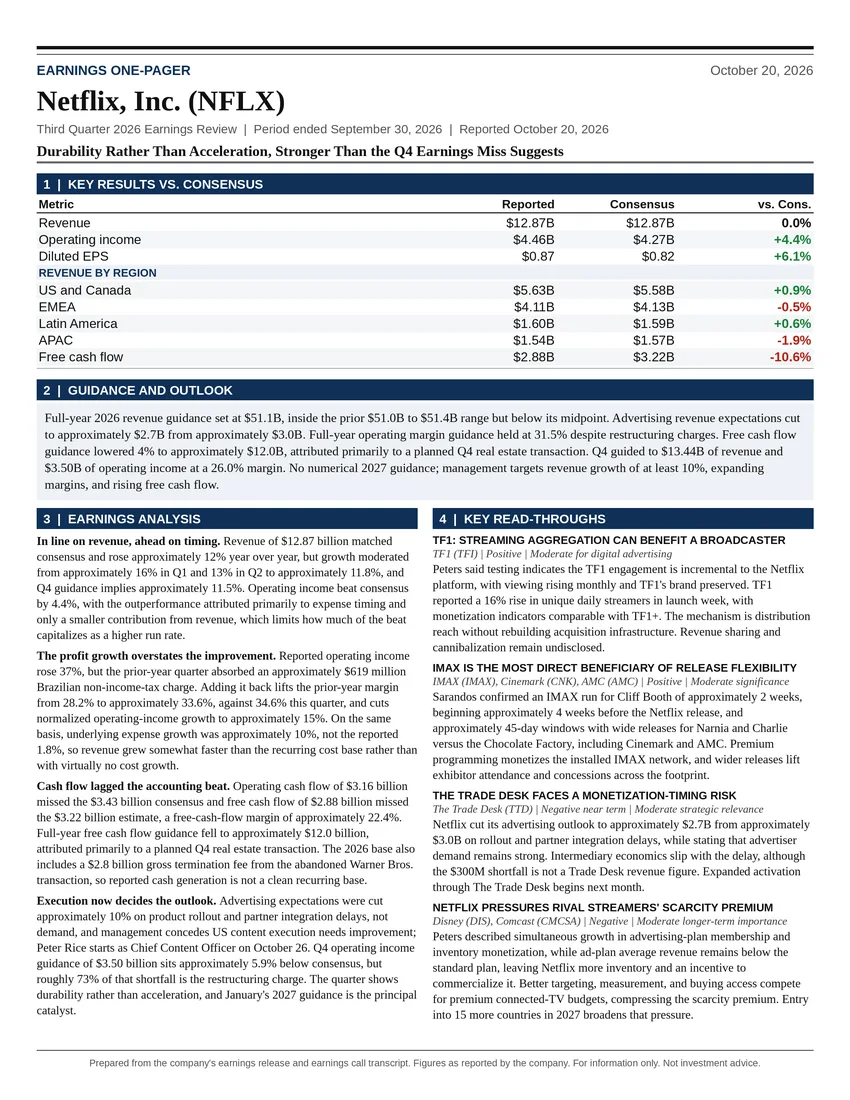
Durability Rather Than Acceleration, Stronger Than the Q4 Earnings Miss Suggests
All Communication Services reports
Follow @AtlasPeakRes on X for new earnings reports as they publish.