Subscription Durability Validated, Earnings Leverage Still Unproven
Earnings Reports
Netflix, Inc. FQ3 2026 Earnings Report
Netflix, Inc. (NFLX) FQ3 2026 earnings: Durability Rather Than Acceleration, Stronger Than the Q4 Earnings Miss Suggests. Full earnings analysis, key read-throughs, and the one-page exhibit from Atlas Peak Research.
Netflix, Inc. (NFLX)
Sector: Communication Services · FQ3 2026 · Period end September 30, 2026 · Reported October 20, 2026
Netflix’s Q3 2026 results support a neutral/Hold assessment rather than an incremental overweight. The subscription business remains resilient, pricing continues to be absorbed without an apparent deterioration in retention, and international content is generating measurable commercial benefits.
Download the one-page report (PDF)
View one-page exhibit
Download analysis (.md)
Download read-throughs (.md)
Post to X
One-Page Exhibit
Earnings Analysis
EXECUTIVE CALL SUMMARY: Netflix Inc. (10/20/26)
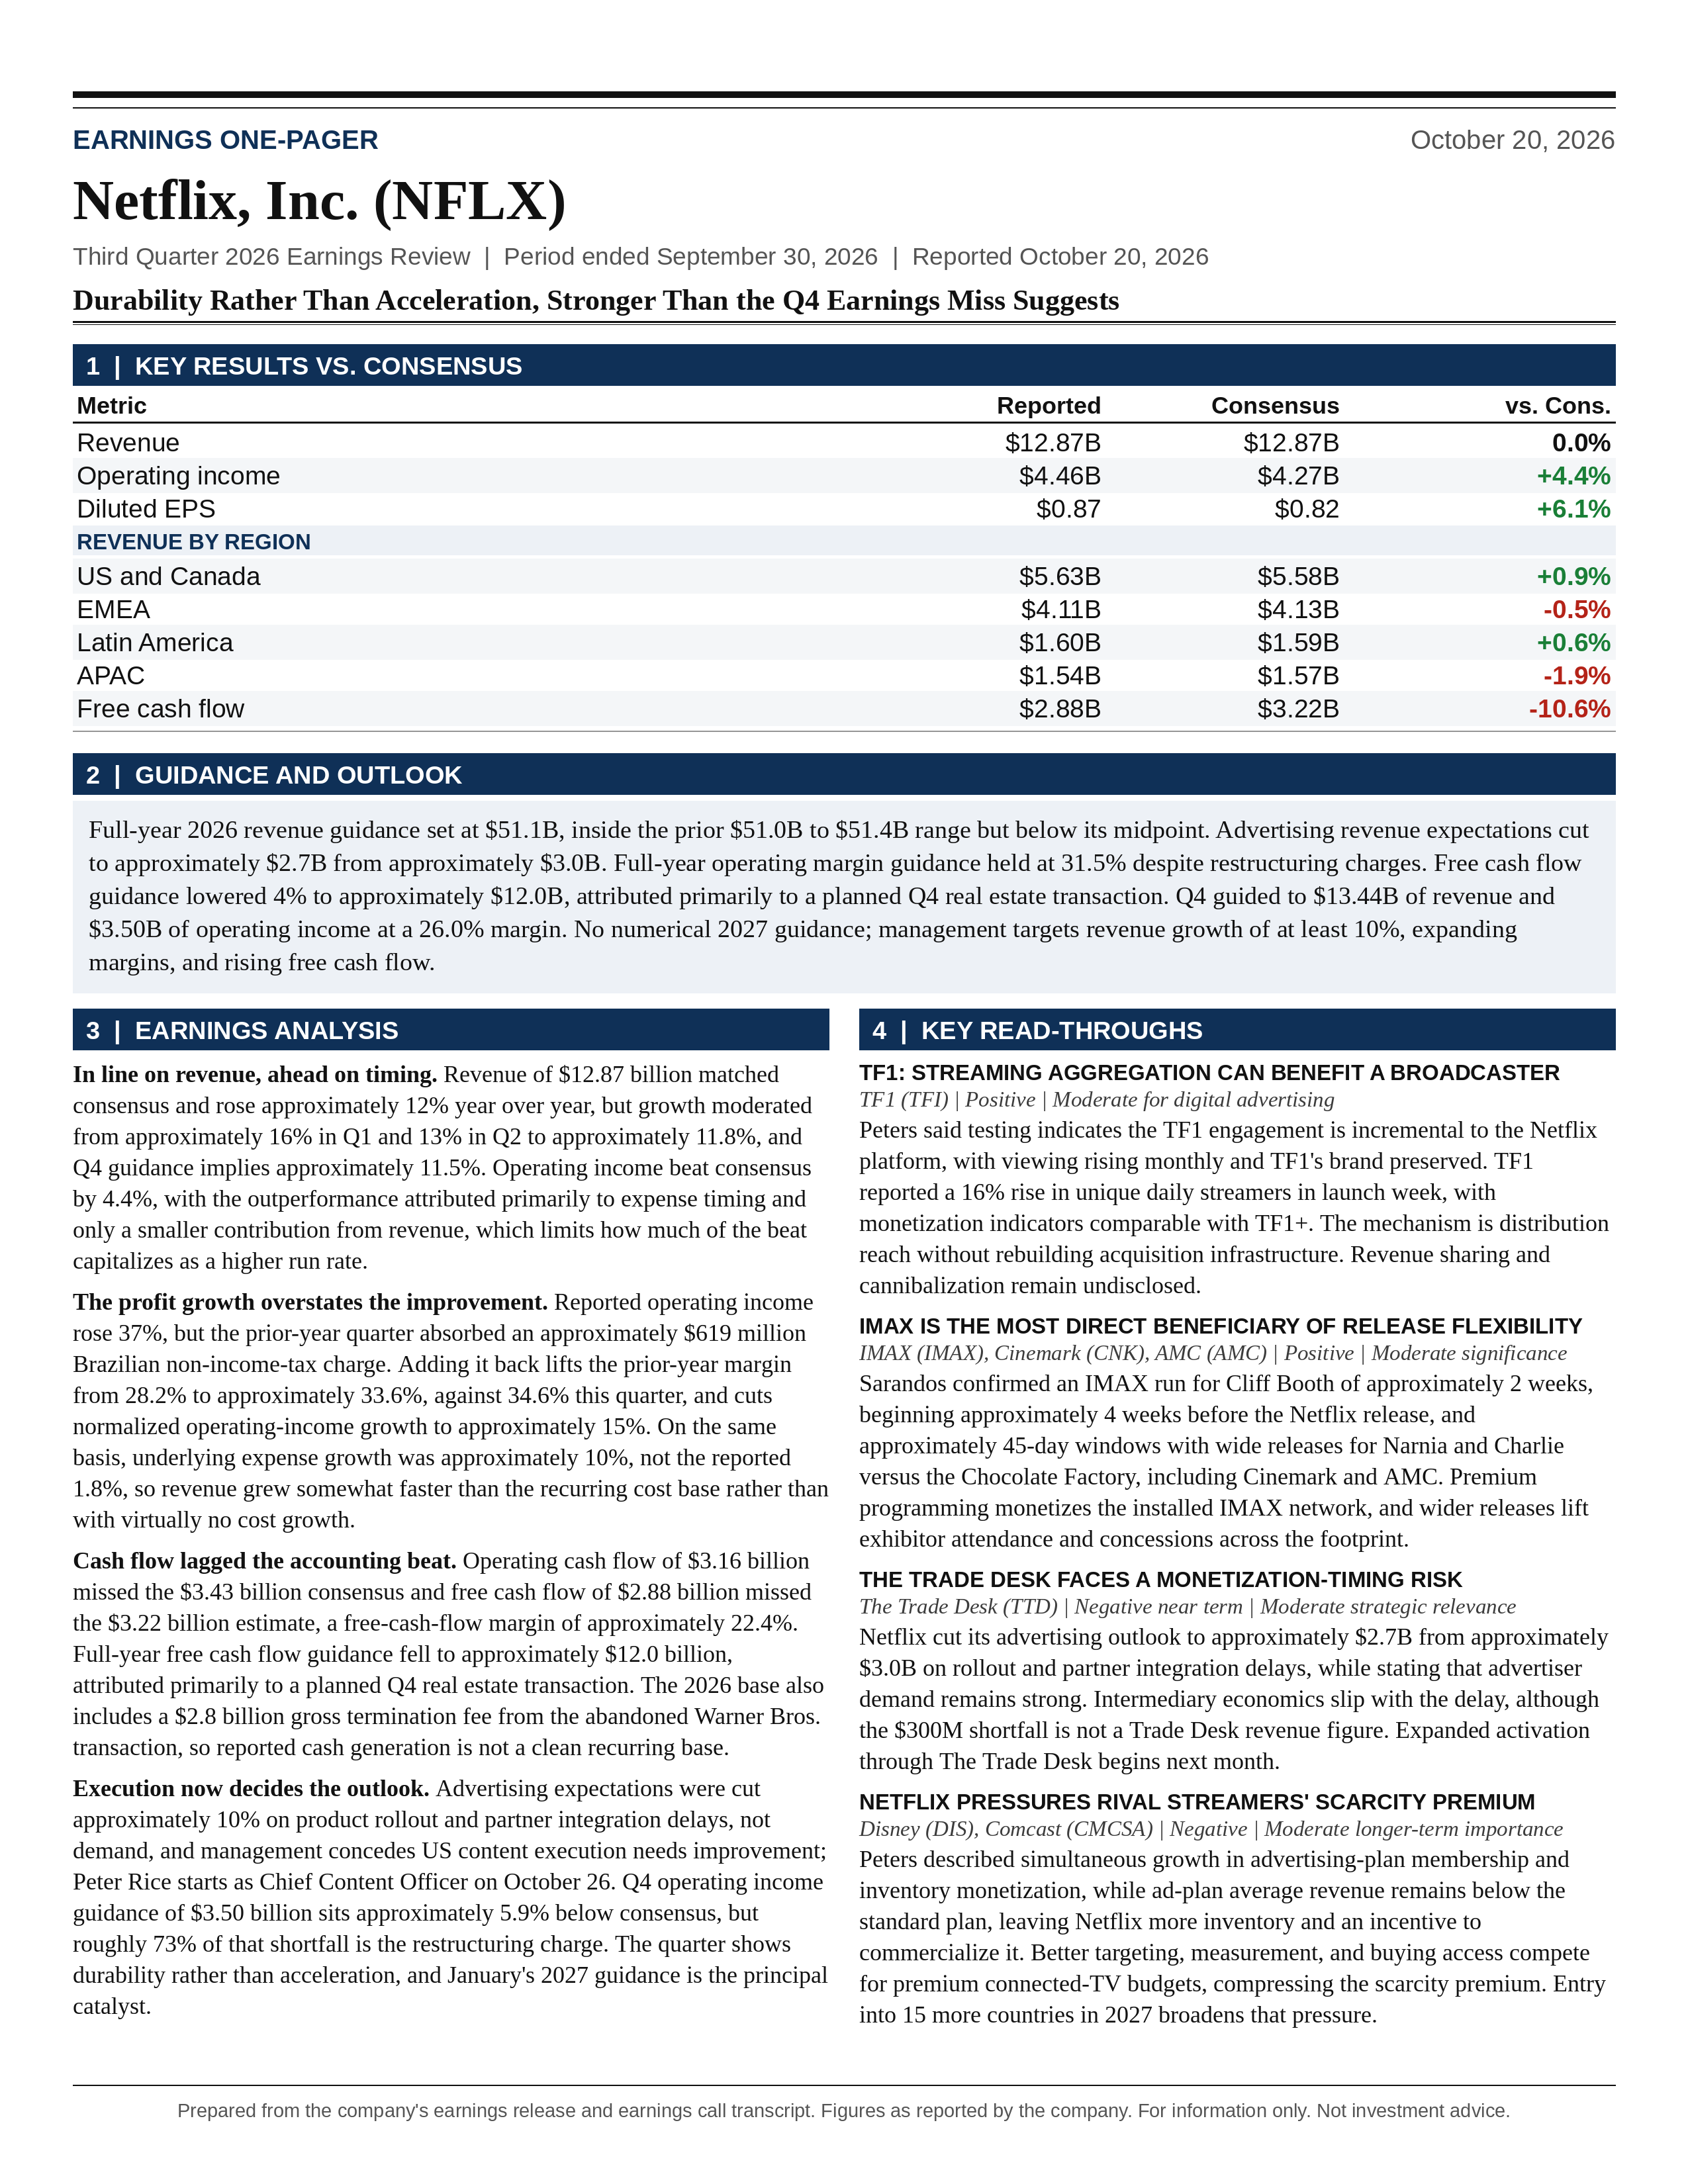
Netflix’s Q3 2026 results support a neutral/Hold assessment rather than an incremental overweight. The subscription business remains resilient, pricing continues to be absorbed without an apparent deterioration in retention, and international content is generating measurable commercial benefits. However, the quarter did not establish accelerating demand. Revenue was essentially in line with expectations, advertising guidance was reduced, full-year revenue expectations moved modestly lower, and management acknowledged that US content execution needs improvement. The operating-income beat was meaningful, but its investment significance is reduced by favorable expense timing and an unusually weak prior-year comparison.
Revenue of $12.87 billion increased approximately 12% year over year, while operating income increased 37% to $4.46 billion and diluted EPS increased approximately 47% to $0.87. Those profit growth rates substantially overstate the improvement relative to an illustrative prior-year base excluding the approximately $619 million Brazilian non-income-tax charge recorded in Q3 2025. Removing that charge raises the comparable prior-year operating margin from 28.2% to approximately 33.6%, versus 34.6% this quarter. On that basis, operating-income growth was approximately 15%, not 37%. The underlying outcome remains positive, but it reflects moderate operating leverage rather than a fundamental step-change in profitability.
The forward outlook was more mixed than the Q3 EPS beat suggests. Full-year revenue guidance moved to $51.1 billion from $51.0 billion to $51.4 billion, approximately 0.2% below the previous midpoint. Advertising revenue expectations fell to approximately $2.7 billion from approximately $3.0 billion, a 10% reduction. Full-year operating-margin guidance remained 31.5%, despite restructuring charges, while free-cash-flow guidance declined 4% to approximately $12.0 billion. Contemporaneous reporting attributes the cash-flow reduction primarily to a planned Q4 real estate transaction, which is economically different from a deterioration in subscription collections or content profitability.
Q4 operating-income guidance of $3.50 billion was approximately 5.9% below Bloomberg consensus, but roughly 73% of that shortfall is explained by the disclosed restructuring charge. Excluding its approximately 120-basis-point margin impact, Q4 operating margin would be approximately 27.2%, compared with 27.6% consensus. The residual operating shortfall is therefore modest. Nevertheless, the combination of weaker advertising expectations, slower revenue growth, and a major content-leadership transition reduces confidence in near-term upside to estimates.
The central investment question is whether Netflix can convert its demonstrated pricing power and distribution scale into stronger engagement and advertising monetization without materially increasing the cost of delivering that growth. Management reaffirmed an objective of sustaining revenue growth of at least 10%, expanding margins, and increasing free cash flow. It did not issue numerical 2027 guidance. The January 2027 earnings call is therefore the principal financial catalyst, while advertising-product deployment and Q4 content performance provide earlier operating evidence.
Q3 FINANCIAL PERFORMANCE AND THE QUALITY OF THE BEAT
Q3 revenue of $12.87 billion matched Bloomberg consensus and exceeded the approximately $12.86 billion forecast issued in July by only about $10 million, or 0.1%. The quarter therefore demonstrates delivery against the revenue plan, not a meaningful positive demand surprise. Relative to Q2 revenue of $12.56 billion, revenue increased approximately 2.5% sequentially.
The growth trajectory continues to moderate. Publicly reported revenue growth was approximately 16% in Q1 and 13% in Q2, versus approximately 11.8% in Q3. Q4 guidance implies approximately 11.5% growth. This progression is consistent with a large business sustaining healthy expansion, but it does not yet support a reacceleration thesis. Increasing scale, pricing comparisons, currency movements, and business mix can all affect these rates, so the deceleration cannot be attributed solely to engagement.
Operating income of $4.46 billion exceeded Bloomberg consensus of $4.27 billion by approximately $190 million, or 4.4%. It also exceeded management’s July forecast of approximately $4.268 billion by approximately 4.5%. Operating margin of 34.6% was 160 basis points above Bloomberg consensus of 33.0% and 140 basis points above management’s 33.2% forecast. The distinction matters because the consensus and company-guidance benchmarks were not identical.
With revenue essentially on plan, most of the operating-income upside necessarily arose from the expense side of the income statement. The accompanying results commentary attributes the outperformance primarily to expense timing, with a smaller contribution from revenue. That qualification limits the amount of the Q3 beat that should be capitalized as a permanently higher earnings run rate. Delayed spending can improve a quarter without changing the economics of the full year.
Diluted EPS of $0.87 exceeded the $0.82 consensus estimate by approximately 6.1%, compared with the 4.4% operating-income beat. Net income increased approximately 44% to $3.66 billion, versus approximately 47% EPS growth. The difference is consistent with some benefit from a lower diluted share count, although rounded figures do not support a precise attribution. Below-operating-line items and taxes also prevent the EPS beat from being treated as an exact measure of operating outperformance.
The Q3 result and Q4 outlook are more informative when considered together. Q3 operating income of $4.46 billion plus Q4 guidance of $3.50 billion totals $7.96 billion, compared with combined Bloomberg expectations of $7.99 billion. Thus, the Q3 beat and Q4 shortfall almost offset across the 2 quarters. Before adjusting for restructuring, the second-half operating-profit outlook is approximately unchanged relative to those expectations. This is substantially less negative than the isolated Q4 miss suggests, but also less positive than the isolated Q3 beat implies.
HISTORICAL PROFITABILITY REQUIRES A COMPARABILITY ADJUSTMENT
The most important historical adjustment is the approximately $619 million Brazilian tax expense recorded in cost of revenue in Q3 2025. This was a non-income-tax matter, so it directly depressed operating income rather than appearing only below the operating-profit line.
Prior-year revenue was approximately $11.51 billion and reported operating income was approximately $3.248 billion. Adding back the full $619 million charge produces an illustrative operating-income base of approximately $3.867 billion and an operating margin of approximately 33.6%. Against that base, Q3 2026 operating-income growth was approximately 15.3%, with approximately 100 basis points of margin expansion. Most of the reported 640-basis-point margin improvement therefore reflects the comparison with the tax-affected quarter.
A full exclusion is not a perfect recurring-earnings adjustment. The historical disclosure indicated that approximately 20% of the charge related to 2025, with the balance attributable to earlier periods. Excluding only the approximately 80% attributable to earlier years produces a prior-year margin of approximately 32.5% and current operating-income growth of approximately 19.1%. These calculations are analytical sensitivities, not company-reported adjusted results. They demonstrate that the underlying profit improvement was materially below the headline 37% under either treatment.
The expense-growth comparison changes similarly. Using rounded current results, operating expenses were approximately $8.41 billion. Against the reported prior-year expense base, that represents growth of only approximately 1.8%. Against a prior-year expense base excluding the full tax charge, expense growth was approximately 10%. The more defensible interpretation is that revenue grew somewhat faster than the underlying expense base, not that Netflix delivered a 12% revenue increase with virtually no recurring cost growth.
This distinction also affects valuation. A forecast based on extrapolating reported operating-income or EPS growth would embed an unrealistic continuation of the favorable tax comparison. The current quarter supports a healthy earnings-growth profile, but the appropriate starting point is normalized profitability and the full-year expense calendar.
Q4 AND FULL-YEAR GUIDANCE
Q4 revenue guidance of $13.44 billion was approximately $70 million, or 0.5%, below Bloomberg consensus of $13.51 billion. Although the earnings notice characterized the revenue outlook as meeting estimates, the numerical comparison shows a small miss. The appropriate description is broadly in line to modestly below expectations, not a material revenue disappointment.
Q4 EPS guidance of $0.67 was approximately 8.2% below the $0.73 consensus estimate. Operating-income guidance of $3.50 billion was approximately $220 million below the $3.72 billion estimate, while the guided 26.0% operating margin was 160 basis points below consensus.
The restructuring adjustment substantially narrows that gap. A 120-basis-point charge applied to $13.44 billion of revenue represents approximately $161 million of operating expense. Adding this amount back produces approximately $3.66 billion of operating income, subject to rounding, compared with $3.72 billion consensus. The remaining shortfall is approximately $60 million. Consensus treatment of restructuring is not fully established, so this is an explanatory bridge rather than a strictly like-for-like adjusted-consensus comparison.
The guided Q4 margin still improves from 24.5% a year earlier to 26.0% as reported, or approximately 27.2% excluding the disclosed restructuring effect. Consequently, the sequential decline from Q3’s 34.6% margin should not be interpreted as an equivalent deterioration in underlying economics. Release timing, marketing, live programming, and other seasonal expenses create substantial quarterly variation. The year-over-year comparison and full-year margin are more useful measures.
Full-year revenue guidance of $51.1 billion remains inside the previous $51.0 billion to $51.4 billion range, but is below its $51.2 billion midpoint. This is a modest downward revision rather than a break below the prior guidance range. The growth outlook moved from 13% to 14% to approximately 13%.
Maintaining a 31.5% full-year operating margin on $51.1 billion of revenue implies approximately $16.10 billion of operating income. The previous revenue midpoint at the same margin implied approximately $16.13 billion. The change in implied annual operating income is therefore only approximately $32 million. Preserving the margin despite restructuring suggests some offsetting operating strength, expense flexibility, or favorable timing elsewhere.
The advertising revision is much larger than the consolidated revenue revision. Advertising expectations declined approximately $300 million, whereas the consolidated revenue midpoint declined approximately $100 million. Mechanically, the implied non-advertising component increased approximately $200 million relative to the earlier midpoint. This does not establish a precise subscription-growth bridge because currency, rounding, and other changes may be involved. It does indicate that the advertising shortfall was not accompanied by an equivalent deterioration across the rest of the revenue base.
Management’s statement that it expects to deliver full-year guidance refers to the updated outlook. It should not be interpreted as an affirmation of the previous advertising or cash-flow forecasts.
CASH GENERATION AND CAPITAL-ALLOCATION IMPLICATIONS
Q3 cash flow from operations was $3.16 billion, up approximately 12% year over year but approximately 7.9% below Bloomberg consensus of $3.43 billion. Free cash flow was $2.88 billion, up 8.4% but approximately 10.6% below the $3.22 billion estimate. Cash generation therefore increased, but lagged both expectations and the growth in reported accounting profit.
Free-cash-flow margin was approximately 22.4%, compared with an implied approximately 23.1% a year earlier. Free cash flow represented approximately 64.6% of operating income. Neither ratio is sufficient to diagnose deterioration because content payments, amortization, taxes, and working-capital movements are not synchronized. Nevertheless, the cash result provides less support for a strengthening earnings-quality thesis than the operating-income headline.
The difference between operating cash flow and free cash flow implies approximately $280 million of purchases of property and equipment under Netflix’s free-cash-flow definition. Content investment is not captured solely in this conventional capital-expenditure line. Cash paid for content flows through operating cash flow, while the income statement recognizes content expense through amortization or the applicable release-related expense pattern. A favorable operating margin can therefore coexist with weaker cash conversion.
Full-year free-cash-flow guidance declined from approximately $12.5 billion to approximately $12.0 billion, versus Bloomberg consensus of $12.64 billion. The new outlook is approximately 5.1% below consensus and implies a free-cash-flow margin of approximately 23.5%, versus approximately 24.4% using the previous revenue midpoint and cash-flow outlook.
Contemporaneous earnings coverage attributes the reduction primarily to an expected Q4 real estate transaction. That explanation changes the interpretation materially. A property-related cash outflow does not, by itself, imply weaker subscription economics or a structurally higher content burden. It still reduces cash available for repurchases or other uses, and its economic attractiveness depends on the returns and costs associated with the asset. It should not be ignored simply because it is outside the recurring streaming operating cycle.
The annual cash-flow base also contains a significant nonrecurring inflow. Netflix’s Q1 disclosures identified a $2.8 billion gross termination-fee receipt related to the abandoned Warner Bros. transaction. The Q1 increase in annual free-cash-flow guidance from approximately $11.0 billion to approximately $12.5 billion was attributed primarily to the after-tax effect of that payment. Reported 2026 cash generation therefore cannot be treated as an entirely recurring foundation for 2027.
Subtracting the full $2.8 billion from annual free cash flow would not produce a complete normalized measure because related taxes, transaction expenses, financing effects, and payment timing require reconciliation. The important conclusion is directional: 2027 recurring cash generation could improve materially while reported cash flow grows more slowly, and management’s objective of increasing reported free cash flow must be evaluated against the absence of the termination receipt and the potential nonrecurrence of other cash outflows.
ENGAGEMENT, PRICING POWER, AND THE US EXECUTION PROBLEM
The strongest evidence supporting the subscription model was management’s retention commentary. Greg Peters stated, “Q3 churn both globally and in the United States improved year-on-year. It was better than forecast.” This is a more commercially relevant positive signal than an isolated viewing-hours statistic because retention directly influences recurring revenue, acquisition requirements, and customer lifetime value.
Management also reported that the 2026 price increases, including those in the US, performed consistently with previous pricing changes and expectations. Stable or improving retention through a pricing cycle indicates that customers continue to perceive sufficient value to maintain the service. It argues against an immediate breakdown in Netflix’s competitive position.
The limitations are important. No absolute churn rates, pricing-cohort retention curves, or detailed regional subscriber bridges were provided in the supplied materials. Aggregate churn improvement can reflect changes in geography, tenure, plan mix, or acquisition channels. It does not establish that every mature-market cohort is becoming more engaged or that further price increases will encounter identical elasticity.
Management’s definition of engagement deliberately extends beyond hours viewed. Peters described it as the combination of “quality, quantity and variety of viewing.” That is economically defensible for subscriptions: a relatively small number of highly valued programs can sustain willingness to pay even when total viewing time is modest. However, viewing quantity remains directly relevant to advertising inventory and to the platform’s share of consumer attention. A satisfactory subscription outcome does not eliminate the monetization consequences of slower viewing growth.
The US commentary was more candid than the general reassurance. Ted Sarandos stated, “We do need better execution in the US.” He also said that the US business is “not growing as fast as it could or as fast as we’d like.” These statements acknowledge an execution gap rather than merely rejecting the engagement debate as an inappropriate investor concern.
The issue extends beyond US revenue because major US-produced titles can travel internationally. Management’s distinction between “solid doubles and triples” and globally resonant hits indicates that a weaker US slate can reduce the worldwide return on a major component of content spending. The investment opportunity is therefore not limited to adding domestic viewing hours. Better global performance from US-originated programming could improve content productivity across the entire subscriber base.
The downside case is that pricing and retention remain healthy for a period even as engagement weakens. Subscription behavior can lag changes in attention, particularly when a service retains a deep catalog and a relatively modest share of household spending. Conversely, the upside case is that current retention demonstrates substantial underlying loyalty, allowing a stronger slate to generate additional growth without requiring a fundamental product or pricing reset. The quarter supports the latter possibility but does not establish it.
REGIONAL RESULTS AND THE INTERNATIONAL GROWTH ENGINE
US and Canada revenue was $5.63 billion, up 11% and approximately $50 million above Bloomberg consensus. The region represented approximately 44% of consolidated revenue. This is an important counterweight to the negative US content narrative: the mature-market business is still growing and exceeded the revenue estimate despite management’s dissatisfaction with execution.
EMEA revenue was $4.11 billion, up 11% and approximately $20 million below consensus. Latin American revenue was $1.60 billion, up 17% and approximately $10 million above consensus. APAC revenue was $1.54 billion, up 12% and approximately $30 million below consensus. The regional figures sum slightly differently from consolidated revenue because of rounding.
The geographic pattern is broadly healthy but not uniformly ahead of expectations. Latin America delivered the fastest reported growth, while APAC’s regional result was below consensus despite strong commentary about India, Korea, and Japan. Selected local successes should therefore not be generalized into an assumption of broad regional upside.
India provided the clearest example of the intended content-to-commercial-outcome mechanism. Management reported 24% growth in total viewing hours, an increase in viewing per member, membership growth, and nearly 20% revenue growth. Higher total viewing alone could simply reflect a larger subscriber base. The increase in viewing per member provides stronger evidence that content performance improved within the existing audience as well.
India’s performance cannot be extrapolated directly to Netflix’s consolidated economics. Market pricing, payment methods, advertising development, content costs, and penetration differ substantially. Rapid membership growth in lower-priced countries can increase scale while creating a mix headwind to global average revenue per membership. The relevant objective is attractive lifetime contribution, not convergence to US pricing.
Management’s geographic framework is internally consistent. Mature markets such as the US, UK, and Australia rely more heavily on pricing and advertising. Less penetrated markets such as India and Indonesia offer greater membership-growth potential. Intermediate markets can combine subscriber growth with improved monetization. This diversification reduces dependence on any particular growth mechanism, but also makes consolidated averages less informative.
Reported dollar revenue cannot fully distinguish local demand from currency translation. The supplied regional results do not provide a complete constant-currency, membership, and pricing decomposition. The regional evidence establishes growth and diversification, but not the precise contribution of each operating driver.
ADVERTISING: STRONG GROWTH, A MATERIAL EXECUTION MISS
Advertising was the clearest negative revision in the quarter. Management continues to expect growth of more than 80%, but the approximately $2.7 billion revenue outlook is 10% below the previous approximately $3.0 billion target. Rapid growth and underperformance against plan are simultaneously true.
Peters acknowledged that “we are currently a bit behind our aggressive target for the year.” The explanation centered on delays in product rollouts and partner integrations rather than weaker advertiser demand. He stated that “general demand remains strong” and that the breadth of advertisers continues to expand.
This distinction matters, but it remains management’s explanation rather than a fully quantified commercial reconciliation. The call did not provide sufficient disclosure on effective advertising prices, fill rates, advertiser retention, committed spending, or campaign performance to independently isolate the impact of product delays. Demand may be healthy while buying friction prevents Netflix from capturing it. Alternatively, better technology may be necessary to compete more effectively for budgets that are not automatically available merely because inventory exists.
The strategic trade-off involves preserving Netflix’s proprietary data advantage while integrating with advertisers’ existing buying and measurement systems. More restrictive integration can protect long-term differentiation, but it can also slow adoption. More open integration can accelerate monetization while reducing control over data, workflows, and economics. Management is explicitly accepting some near-term revenue cost to pursue its preferred architecture.
Netflix’s October 20 advertising-product announcement provides concrete milestones beyond the call’s general assurances. It described an enhanced Conversion API, a new Netflix Pixel, conversion-based targeting, proprietary measurement capabilities, and additional integration with demand-side platforms. The announcement indicated that expanded audience activation through The Trade Desk would begin the following month. These developments provide testable execution milestones for Q4 rather than leaving the recovery thesis entirely dependent on broad strategic claims.
The economic objective is to make Netflix inventory easier to buy, target, measure, and attribute within existing advertiser workflows. Stronger conversion measurement could broaden demand beyond traditional brand campaigns and support more persistent performance-oriented budgets. That outcome is not assured, and selected advertiser case studies should not be treated as platform-wide evidence of superior returns.
The average-revenue gap between the advertising plan and the standard advertising-free plan remains open. Peters stated, “there’s still a gap,” while emphasizing that it is narrowing. This means the combined subscription and advertising revenue generated by an advertising-plan member remains below the comparable standard-plan measure in the markets discussed.
The gap represents both opportunity and risk. Better advertising yield can raise monetization without requiring an equivalent subscription-price increase. However, movement from a higher-revenue plan into the advertising tier can dilute near-term revenue unless incremental advertising sufficiently compensates. Acquisition of genuinely incremental, price-sensitive members has different economics from migration by existing higher-paying customers.
Total advertising revenue growth does not establish the pace of unit-economics improvement. Revenue can rise because advertising-plan membership and available inventory increase, even if monetization per available impression improves slowly. The strongest evidence would be simultaneous growth in advertising membership, stable engagement, better fill rates, and higher revenue per advertising-plan member.
Advertising also remains a minority of consolidated revenue. At approximately $2.7 billion, it represents about 5.3% of the 2026 revenue outlook. As an illustrative sensitivity, 50% advertising growth in 2027 would add approximately $1.35 billion, equivalent to about 2.6 percentage points of consolidated growth against the 2026 base. Achieving 10% total revenue growth would still require approximately 7.8% growth in subscription and other non-advertising revenue. Advertising is an important accelerant, not yet a substitute for healthy subscription growth.
Expansion into 15 additional countries in 2027 increases the addressable opportunity but also raises execution complexity. New markets require sales coverage, measurement, privacy compliance, advertiser relationships, and sufficient demand density. They can initially add inventory faster than demand develops. Country expansion should therefore be modeled as a phased revenue contribution, not an immediate replication of mature-market monetization.
CONTENT LEADERSHIP AND THE EXPECTED TIMING OF IMPROVEMENT
Peter Rice’s appointment as Chief Content Officer is strategically significant because it coincides with explicit recognition of a US execution problem. Netflix’s October 15 announcement identified October 26 as his effective start date. Q3 results cannot be attributed to the incoming leadership, and much of the Q4 and 2027 slate necessarily reflects decisions made before his arrival.
Sarandos framed the appointment as an execution upgrade rather than a strategic reversal: “There is no need for a fundamental shift in the strategy.” He emphasized Rice’s experience across television, film, streaming, and live sports, together with talent relationships and the ability to manage quality and volume at scale.
The potential benefit is improved selection and execution across a large content portfolio. Better talent relationships can improve access to projects, strengthen creative collaboration, and reduce the friction involved in delivering complex productions. Stronger prioritization can increase returns without requiring proportionate growth in spending. These advantages are plausible, but they cannot be quantified from an executive résumé.
Management suggested Rice could influence projects already in development in the near term. That is credible for packaging, production decisions, release plans, marketing, and projects with substantial work remaining. The largest effects of new commissioning decisions generally require longer development and production cycles. A strong Q4 slate would validate the existing pipeline more directly than the new leadership structure.
The transition also introduces operational risk. Organizational disruption can affect creative relationships, decision speed, and the retention of experienced executives. The relevant test is whether content productivity improves while maintaining the international capabilities management credits to Bela Bajaria’s tenure. A US-focused repair should not undermine a functioning local-content model elsewhere.
RESTRUCTURING AND THE LIMITS OF THE SAVINGS THESIS
Management characterized the headcount reductions as a prioritization exercise following rapid growth. Peters acknowledged that Netflix had become overinvested in certain areas and described the changes as a forcing mechanism to identify efficiencies and redirect resources.
The interpretation is not purely negative. A large company can accumulate organizational complexity even while revenue and profit grow. Addressing that complexity before the business deteriorates can improve long-term returns. However, the combination of layoffs, content-leadership changes, and advertising delays also indicates that execution has fallen short in multiple areas.
No annual savings figure, payback period, or reinvestment split was provided. Spencer Neumann explicitly declined to quantify the 2027 expense impact. The approximately $161 million implied Q4 restructuring charge therefore cannot be translated into a reliable recurring savings estimate.
The correct model treatment is to recognize the disclosed charge and await a quantified 2027 margin framework. Automatically assuming that payroll savings flow entirely to profit would contradict management’s emphasis on reinvesting in high-impact areas. Conversely, treating the entire restructuring cost as evidence of a weaker recurring business would ignore its potentially nonrecurring nature.
A particularly important execution issue is whether cost reductions preserve the capabilities required to accelerate advertising delivery and improve content quality. Efficiency that removes low-value complexity is constructive. Efficiency that slows the revenue initiatives intended to support future growth would be self-defeating.
LICENSING, TF1, AND THE POSSIBILITY OF A BROADER DISTRIBUTION PLATFORM
The call rejected the idea that Netflix is abandoning its core entertainment model. Sarandos stated that roughly 95% of spending and nearly all revenue remain focused on the core. That disclosure argues against assigning substantial near-term financial value to short-form video, user-generated content, or other early-stage initiatives.
Licensed content remains complementary to exclusive originals. The Disney, Sony, Universal, and Globo examples demonstrate access to programming that can broaden the service and improve catalog depth. Netflix’s distribution and discovery capabilities can make previously underdistributed titles more commercially valuable.
The strategic benefit is not simply more hours of content. Licensed programming can fill genre gaps, improve habitual use, retain particular audience cohorts, and create franchise familiarity. However, suppliers receive cash and additional exposure for their intellectual property, and many are also competitors. These are mutually beneficial commercial arrangements rather than evidence that Netflix captures all of the value.
The Globo agreement is particularly relevant to local-market depth because management highlighted the prior reluctance to license content to Netflix within Brazil. Access to established domestic programming can complement original production and reduce gaps in local relevance. The call did not disclose contract economics, so the effect on content returns cannot be quantified.
TF1 is a distinct model because it integrates a broadcaster’s programming and product identity rather than merely adding individually licensed titles. Peters stated that early testing indicates “the TF1 engagement is incremental to our platform.” If sustained, incremental viewing would support the argument that aggregation broadens Netflix’s utility without simply shifting consumption away from its existing catalog.
Incremental viewing is not the same as incremental profit. The call did not disclose partner payments, advertising allocation, revenue sharing, or a quantified retention benefit. Those terms determine whether the arrangement increases customer lifetime contribution and how much of the value Netflix retains.
Optional subscription add-ons were discussed as a possible extension, but no service launch or financial guidance was announced. Such a model could improve convenience and generate distribution economics without Netflix directly funding all underlying content. It could also introduce customer-service complexity, partner conflicts, and different revenue-recognition treatment. Gross consumer spending through an aggregation product should not automatically be modeled as Netflix revenue.
THEATRICAL DISTRIBUTION AND LIVE EVENTS
The theatrical discussion represented a meaningful evolution in distribution flexibility, not a wholesale change in the business model. Sarandos reiterated, “we are a streaming first business.” Approximately 30 theatrical releases were planned for 2026, broadly similar to the previous year. The more consequential changes involve release windows, selected wider distribution, IMAX partnerships, and public box-office reporting.
Management described traditional approximately 45-day windows for selected large family films, including Narnia and Charlie versus the Chocolate Factory. Family franchises may retain substantial streaming value after theatrical release because repeat viewing remains important. A theatrical campaign can also expand awareness, improve talent relationships, and generate incremental revenue before the streaming debut.
The trade-offs remain material. Theatrical distribution adds marketing and distribution costs, shares box-office receipts with exhibitors, and delays immediate availability to subscribers. The relevant economic test is incremental theatrical contribution plus any subsequent subscription benefit, less the costs and the value lost during exclusivity. Box-office gross alone is not the appropriate measure.
The cited opening of more than $69,000 per screen for a specialty release is encouraging evidence of concentrated demand. It does not establish wide-release scalability, total profitability, or the economics of a larger family-film strategy. Management’s own suggestion to revisit the evidence after approximately 6 months was appropriately cautious.
Live programming serves a different role from the on-demand catalog. It creates appointment viewing, concentrated advertiser demand, and acquisition opportunities that are difficult to reproduce with an interchangeable library title. The Thanksgiving Eve and Christmas NFL games provide identifiable Q4 catalysts, while the final-week regular-season game and the Women’s World Cup extend the live calendar into 2027.
Event economics must include rights, production, marketing, technology reliability, advertising sales, and post-event retention. Sign-ups associated with a major event are not equivalent to durable subscriber growth. The strongest outcome is a live event that attracts viewers who subsequently develop broader engagement with the service.
The draft transcript contains a material transcription error: the Thanksgiving Eve halftime performer is U2, not YouTube, as confirmed by the NFL’s October 20 announcement. This is not evidence of a new Netflix-YouTube commercial partnership. The Women’s World Cup reference to the US and Canada concerns Netflix’s distribution territories; the 2027 tournament takes place in Brazil.
2027 OUTLOOK AND ILLUSTRATIVE SCENARIOS
Neumann’s statement was explicit about ambition but not guidance: “We look to sustain double-digit revenue growth. We look to expand margins and we look to increase free-cash flow.” Numerical 2027 guidance is expected with the Q4 results in January.
The distinction between an objective and a forecast is central. The call reaffirmed the operating model’s intended direction without specifying revenue growth, advertising revenue, content spending, restructuring savings, or the margin target. Treating the statement as a formal commitment to a particular 2027 result would overstate the disclosure.
An illustrative base case with a 50% probability assumes 2027 revenue of approximately $57.0 billion, or 11.5% growth, and a 32.5% operating margin. This produces approximately $18.5 billion of operating income, about 15% above the 2026 implied outlook. The assumptions are continued pricing and membership growth, substantial but moderating advertising expansion, partial delivery of delayed advertising capabilities, and selective reinvestment of restructuring savings. US content improves enough to sustain retention without requiring an exceptional hit cycle.
An illustrative bull case with a 25% probability assumes revenue of approximately $59.3 billion, or 16% growth, and a 34.0% operating margin. Operating income would reach approximately $20.2 billion, about 25% above the 2026 implied outlook. This requires stronger US-originated global hits, sustained international momentum, meaningful improvement in advertising monetization, and efficient delivery of the expanded live and theatrical slate. Revenue acceleration and margin expansion would need to occur together.
An illustrative bear case with a 25% probability assumes revenue of approximately $54.7 billion, or 7% growth, and a 31.0% operating margin. Operating income would be approximately $17.0 billion, only about 5% above the 2026 implied outlook. This case reflects persistent advertising delays, limited engagement improvement, less pricing capacity, and reinvestment requirements that absorb restructuring savings. A bear outcome need not involve an earnings decline; growth below the level embedded in valuation can be sufficient to produce substantial equity downside.
These are analytical operating scenarios, not management guidance or price targets. Stock returns would also depend on the starting valuation, taxes, share repurchases, nonoperating items, and the valuation multiple assigned to the resulting earnings. The 2026 termination receipt makes unadjusted net-income and cash-flow comparisons particularly unsuitable for a mechanical equity-return forecast.
INVESTMENT IMPLICATIONS, CATALYSTS, AND RISK PARAMETERS
The quarter strengthens the argument that Netflix remains a resilient subscription platform, but weakens the argument that its next growth phase will arrive with little execution friction. Pricing and retention provide a substantial foundation. Advertising-product delivery, US content performance, and the economics of broader distribution now require more evidence.
The call-specific recommendation is Hold/neutral, with no incremental position justified solely by the Q3 EPS beat. Incremental allocation on that evidence alone is 0%. A valuation-based initiation or increase requires a verified share price, a recurring earnings and cash-flow bridge, and portfolio exposure information that are not established by the supplied materials.
The principal near-term catalysts are deployment of the announced advertising capabilities, Q4 content engagement, and monetization of the November and December NFL events. January 2027 guidance should establish whether management expects revenue growth of at least 10%, how much margin expansion is planned, and whether recurring cash improvement can offset the absence of the termination receipt. Advertising-market expansion in 2027 and the June 24 to July 25 Women’s World Cup provide subsequent execution checkpoints.
The positive thesis would be strengthened by sustained retention following pricing changes, evidence that US engagement is improving, faster advertising revenue per member, and a 2027 margin plan that does not rely primarily on deferring investment. The strongest evidence would connect better content and technology execution to measurable financial improvement rather than rely on title rankings, product announcements, or aggregate advertising growth alone.
The thesis would be weakened by a further advertising-guidance reduction, deterioration in mature-market churn, 2027 revenue guidance below 10% without a clearly temporary explanation, or margin expansion achieved at the expense of future content and product delivery. Repeated cash-flow shortfalls after adjusting for disclosed property transactions, taxes, and other nonrecurring items would also require reassessment.
The principal portfolio exposures are consumer subscription spending, digital advertising, foreign exchange, content execution, and growth-equity valuation. Geographic diversity and subscription revenue provide some resilience, but advertising expansion increases exposure to marketing budgets. Netflix should not automatically be treated as a diversifier against other growth-oriented technology and communications holdings merely because its operating model differs.
A defensible price-based stop-loss and maximum position-loss budget require an entry price, volatility assumptions, liquidity requirements, and the existing portfolio’s risk allocation. Those inputs are unavailable. The operative thesis stop is failure to sustain healthy retention and recurring earnings growth while repairing advertising and US content execution. The next mandatory financial reassessment is the January 2027 guidance update, with earlier review warranted by any material deterioration in those operating indicators.
Overall, Q3 demonstrates durability rather than acceleration. The business is stronger than the headline Q4 earnings miss suggests, but the underlying improvement is less dramatic than the reported Q3 profit growth implies. The investment case now depends on successful execution of already identified opportunities, not on the discovery of a new strategy.
SOURCE AND COMPARABILITY NOTES
Financial comparisons use the supplied Bloomberg earnings notice, with additional context from the supplied initial-draft call, publicly indexed company filing excerpts, contemporaneous earnings reporting, and official Netflix and NFL announcements. Bloomberg consensus is used consistently for the principal estimate comparisons. Historical tax adjustments and 2027 scenarios are analytical calculations rather than company-reported adjusted measures.
Complete shareholder-letter PDFs and all accompanying financial-statement footnotes were not independently accessible. Detailed attribution of cash movements, restructuring savings, regional currency effects, and recurring net income therefore remains incomplete. Rounded source figures explain small differences between calculations based on revenue and margins and calculations based on reported operating income.
COMPANY EMPLOYEES ON THE CALL
• Greg Peters, Co-Chief Executive Officer. • Ted Sarandos, Co-Chief Executive Officer. • Spencer Neumann, Chief Financial Officer. • Spencer Wang, Vice President of Finance, Investor Relations and Corporate Development in the participant roster; introduced on the call as Vice President of Finance and Capital Markets.
An additional unidentified speaker delivered a closing acknowledgment. Identity and title were not established.
RESEARCH ANALYSTS WHOSE QUESTIONS WERE PRESENTED
The interview used submitted analyst questions read by Spencer Wang. The transcript does not establish that these analysts spoke live.
• David Joyce, Seaport Research Partners. • Eric Sheridan, Goldman Sachs. • Rob Sanderson, Loop Capital. • Matthew Condon, Citizens Bank. • Dan Kurnos, StoneX. • Doug Anmuth, JPMorgan. • Michael Morris, Guggenheim. • Vikram Kesavabhotla, Baird. • Sean Diffley, Morgan Stanley. • Robert Fishman, MoffettNathanson.
Key Read-Throughs
KEY READ-THROUGHS FROM NETFLIX’S Q3 2026 EARNINGS CALL
Netflix’s quarter points to a redistribution of economics across entertainment rather than a broad deterioration in consumer or advertising demand. The strongest positive implications accrue to content owners monetizing existing libraries, broadcasters gaining incremental distribution, and theatrical infrastructure receiving programming previously concentrated on streaming. The principal negatives are delayed monetization for advertising intermediaries and greater competitive pressure on rival advertising platforms and traditional television bundles. Netflix’s advertising outlook declined approximately 10%, but management attributed the reduction to product and integration delays while reporting strong advertiser demand and improving subscriber retention. That distinction argues against extrapolating the miss into an advertising-recession thesis. The highest-conviction conclusions concern identifiable commercial relationships and specific competitive mechanisms; magnitude assessments distinguish exposed-business effects from consolidated earnings and do not imply equivalent share-price moves.
CONTENT LICENSING AND LOCAL BROADCASTING
TF1 PROVIDES DIRECT EVIDENCE THAT STREAMING AGGREGATION CAN BENEFIT AN INCUMBENT BROADCASTER (READ-THROUGH 1)
Affected company: TF1 (TFI: France). Direction: Positive. Magnitude: Moderate potential significance for digital advertising and audience development; smaller and not yet quantifiable for consolidated earnings.
The most differentiated broadcaster read-through is positive, not negative. Greg Peters said Netflix’s early testing indicates that “the TF1 engagement is incremental to our platform,” while TF1 viewing through Netflix is increasing monthly. He also emphasized that the integration preserves TF1’s brand. This supports a distribution-expansion thesis rather than a simple transfer of existing viewing between applications.
The transmission mechanism is additional discoverability and viewing, followed by monetization of the associated advertising inventory. TF1 can reach households inside an established entertainment interface without independently recreating Netflix’s distribution, recommendation, and customer-acquisition infrastructure. The commercial benefit depends on whether that reach is incremental to TF1’s own audience and whether the additional inventory monetizes adequately.
TF1’s separate post-launch update strengthens the evidence. It reported a 16% increase in unique daily streamers during the launch week and monetization indicators comparable with TF1+. Those observations are not controlled estimates of partnership causality, but they corroborate the direction of Netflix’s commentary. The combination of audience growth and monetization is materially more useful than an isolated claim that a program entered Netflix’s rankings.
The near-term catalyst is TF1’s next financial disclosure showing whether incremental consumption converts into digital advertising revenue and contribution profit. The longer-duration implication is that a broadcaster with strong local programming can use a global streaming platform as an additional distribution channel rather than treating it exclusively as a competitor.
The constraint is contractual economics. Revenue sharing, distribution payments, and potential cannibalization of direct viewing remain insufficiently disclosed. This is a positive read-through for TF1’s distribution efficiency, not evidence that every broadcaster should adopt identical terms or that Netflix viewing automatically carries TF1’s existing margin.
LIBRARY OWNERS BENEFIT, BUT RIGHTS OWNERSHIP MATTERS MORE THAN THE ORIGINAL CHANNEL BRAND (READ-THROUGH 2)
Affected companies: Lionsgate Studios (LION: Canada) and AMC Global Media, formerly AMC Networks (AMCX: US). Direction: Positive. Magnitude: Potentially moderate for the relevant television-library businesses; consolidated earnings impact cannot be quantified from the disclosed terms.
Sarandos described Power as “a great show that was just underdistributed” and said Netflix would introduce a new audience to the franchise. The question also specifically referenced renewal of The Walking Dead, which management characterized as an evergreen franchise with substantial episode depth.
The transmission mechanism is additional licensing revenue from existing programming, supplemented by renewed audience awareness that can support subsequent franchise exploitation. Monetizing a completed library generally requires less incremental production investment than creating an equivalent volume of new programming. However, residuals, participations, distribution expenses, and remaining content amortization prevent license receipts from being treated as pure profit.
The ownership distinction is critical for Power. The publicly announced Netflix agreement identifies Lionsgate Television as the licensing counterparty. The original series’ association with Starz does not make Starz Entertainment (STRZ: Canada) the automatic recipient of the gross licensing economics. Lionsgate and Starz are separate public companies, and any allocation of proceeds or participations requires the underlying contracts.
The announced Power arrangement also preserves additional monetization flexibility: it is nonexclusive, covers international rights to multiple franchise series and US rights to the original series, and excludes certain newer projects. That structure supports the value of a library capable of generating revenue across platforms rather than depending entirely on a single subscription service.
The near-term catalyst is the programming’s rollout beginning in November 2026 and subsequent licensing disclosures. Availability dates do not necessarily equal revenue-recognition or cash-collection dates. The call confirms the strategic relevance of an already announced transaction; it does not establish a new licensing award.
For AMC Global Media, the Walking Dead renewal supports franchise durability and licensing continuity. It is not sufficient to establish that licensing growth offsets all pressures in the company’s other businesses. The important cross-portfolio distinction is between ownership of monetizable intellectual property and dependence on a shrinking distribution channel.
DISNEY’S NETFLIX LICENSING CAN SUPPORT THEATRICAL FRANCHISE RETURNS, NOT JUST CURRENT CONTENT REVENUE (READ-THROUGH 3)
Affected company: The Walt Disney Company (DIS: US). Direction: Positive. Magnitude: Moderate potential benefit for the specific franchise and licensing activity; small at the consolidated company level.
Netflix said its Disney agreement launched in October and that all 5 Ice Age films entered its top 10. Sarandos explicitly connected that viewing to Disney’s planned February theatrical release of Ice Age: The Boiling Point: “more people will be recent fans of the Ice Age franchise.”
There are 2 distinct transmission mechanisms. Disney receives contractual licensing economics for existing content. Separately, Netflix’s distribution can refresh franchise awareness ahead of a new theatrical release, potentially increasing the audience’s familiarity with characters and reducing the marketing effort required to reintroduce the property.
The second mechanism is the more differentiated insight. Licensing to a competing streamer can function as franchise promotion rather than simply surrendering exclusivity. Netflix finances access to the catalog while its recommendation and distribution systems expose the intellectual property to additional viewers. Disney retains the economic interests associated with the upcoming film and other rights it has not licensed away.
The near-term catalysts are sustained catalog engagement and the February 2027 theatrical release. Top-10 placement is evidence of consumption, not proof of incremental ticket purchases, marketing savings, or film profitability. No quantified box-office uplift is justified.
The longer-duration implication is that windowing and selective licensing can outperform blanket exclusivity when different distribution channels monetize different stages of a franchise’s life. This is positive for Disney’s content economics but should not be double-counted as a simultaneous competitive improvement for Disney+. The studio can benefit financially while the subscription platform faces a stronger Netflix offering.
ADVERTISING TECHNOLOGY AND CONNECTED TELEVISION
THE TRADE DESK FACES A MONETIZATION-TIMING RISK, BUT THE PRODUCT ROADMAP IMPROVES ITS LONGER-TERM OPPORTUNITY (READ-THROUGH 4)
Affected company: The Trade Desk (TTD: US). Direction: Negative for the near-term Netflix-related monetization trajectory relative to prior expectations; positive for the longer-term addressable opportunity. Magnitude: Moderate strategic relevance, with the consolidated revenue effect undisclosed.
Netflix reduced its advertising revenue outlook from approximately $3.0 billion to approximately $2.7 billion. Peters attributed the shortfall to “delays in the rollout and partner integrations for some of those new ads products,” while stating that advertiser demand remains strong.
The immediate transmission mechanism is delayed advertising spending through eligible buying channels and therefore delayed transaction-linked economics for participating intermediaries. Netflix advertising revenue is not equivalent to The Trade Desk revenue: only the portion purchased through its platform contributes to its relevant economics, and the applicable commercial terms are not disclosed. The approximately $300 million Netflix shortfall cannot be transferred directly into a Trade Desk estimate reduction.
The longer-term evidence is more constructive. Netflix’s separate October 20 product announcement said expanded audience activation through The Trade Desk would begin the following month and identified additional measurement capabilities. These are enhancements to an existing buying relationship, not the initial opening of Netflix inventory to the platform.
Improved audience selection and measurement reduce the operational friction that prevents advertisers from deploying budgets. Better integration can make Netflix inventory easier to include in broader campaigns and improve the usefulness of The Trade Desk’s existing customer relationships. The opportunity depends on spending routed through its platform, not merely growth in Netflix’s advertising membership.
The near-term catalyst is successful November deployment and evidence of spending conversion during the holiday advertising period. The longer-duration catalyst is Netflix’s expansion into 15 additional advertising countries in 2027.
The main competitive limitation is that Netflix is integrating with multiple buying platforms while preserving its proprietary data advantage. The Trade Desk gains a better opportunity to intermediate transactions, not exclusive access or ownership of Netflix’s audience data. The call supports a timing-risk framework, not an inference that The Trade Desk caused the delays or that digital advertising demand broadly weakened.
NETFLIX’S INVENTORY AND MEASUREMENT EXPANSION PRESSURES RIVAL STREAMERS’ SCARCITY PREMIUM (READ-THROUGH 5)
Affected companies: The Walt Disney Company (DIS: US) and Comcast (CMCSA: US), through Disney’s advertising-supported streaming services and NBCUniversal’s Peacock. Direction: Negative for competitive positioning and pricing power in overlapping advertising markets. Magnitude: Moderate longer-term importance for streaming advertising; small and unquantifiable immediate consolidated earnings impact.
Peters described simultaneous growth in advertising-plan membership and monetization of available inventory. He also acknowledged that advertising-plan average revenue remains below the standard advertising-free plan, describing the gap as unrealized revenue opportunity. Netflix therefore has both additional inventory and a strong incentive to improve its commercialization.
The transmission mechanism is greater competition for premium connected-TV budgets. As Netflix improves targeting, measurement, and buying access, advertisers gain another scalable way to reach audiences in professionally produced programming. Rival platforms must compete through price, differentiated reach, exclusive content, or better campaign outcomes.
The less obvious risk is not necessarily an immediate decline in competitors’ advertising revenue. A growing market can support revenue growth across multiple platforms while reducing the scarcity premium and increasing the spending required to win each incremental advertising dollar. Better Netflix monetization can constrain the margin improvement that rivals might otherwise expect from expanding advertising revenue.
Netflix’s planned entry into 15 additional advertising countries broadens this pressure, although the overlap with each competitor varies. New markets also require demand development, so country launches should not be treated as immediate mature-market competition.
The near-term effect is limited because advertising commitments, product readiness, and sales execution determine the speed of budget movement. The more important catalysts are 2027 campaign planning, renewals, and demonstrated adoption of Netflix’s new capabilities.
There are material offsets. Disney and Comcast also license content to Netflix, and stronger overall connected-TV demand can support their own advertising businesses. The appropriate conclusion is a negative competitive read-through for the exposed advertising operations, not an automatic consolidated earnings downgrade or a blanket short of either parent company.
THEATRICAL EXHIBITION AND DISTRIBUTION
IMAX IS THE MOST DIRECT BENEFICIARY OF NETFLIX’S RELEASE FLEXIBILITY, WITH BROADER EXHIBITOR UPSIDE FOLLOWING IN 2027 (READ-THROUGH 6)
Affected companies: IMAX Corporation (IMAX: Canada), Cinemark Holdings (CNK: US), and AMC Entertainment Holdings (AMC: US). Direction: Positive. Magnitude: Moderate strategic significance for IMAX; modest and title-dependent near-term financial benefit for exhibitors.
Sarandos confirmed an IMAX arrangement for The Further Mis-Adventures of Cliff Booth, describing a run of approximately 2 weeks beginning approximately 4 weeks before the Netflix release. He also described traditional approximately 45-day theatrical windows and wide releases for Narnia and Charlie versus the Chocolate Factory.
IMAX has the clearest direct relationship. Premium programming can generate content-related revenue and, where applicable, revenue-sharing proceeds from additional box-office activity across the installed network. The value is not limited to a single film: willingness by a major streaming buyer to use IMAX expands the potential supply of commercially relevant programming.
For Cinemark and AMC Entertainment, wider releases create admission and concession opportunities on an existing theater footprint. The announced Narnia distribution plan specifically includes both chains. The transmission mechanism is increased attendance and utilization, not receipt of Netflix’s subscription revenue or a guaranteed payment independent of ticket sales.
The near-term catalyst is Cliff Booth’s announced November 25, 2026 IMAX release. The broader exhibitor catalysts are the 2027 releases. Narnia belongs in the 2027 calendar, not as an incremental addition to Q4 2026 forecasts.
The magnitude should remain disciplined. Netflix expects approximately 30 theatrical releases in 2026, broadly unchanged from the prior year. The meaningful change is the commercial breadth and exclusivity of selected releases, not a demonstrated surge in total release count. Sarandos also maintained that Netflix is “a streaming first business.”
For IMAX, additional titles can displace other attractive programming if premium screens are already constrained, so incremental box office is not necessarily fully additive. For exhibitors, film rentals and operating costs reduce the contribution from ticket receipts. A stronger slate is positive for operations but does not, by itself, resolve financing or capital-structure risks. The call supports an expanding distribution opportunity, not a sector-wide earnings reset.
SONY CAN MONETIZE NETFLIX’S CONTENT SPENDING WITHOUT OWNING THE UNDERLYING FILMS (READ-THROUGH 7)
Affected company: Sony Group (6758: Japan). Direction: Positive. Magnitude: Modest for Pictures distribution economics and small for consolidated Sony earnings.
The call’s theatrical expansion has a less obvious beneficiary beyond cinema operators. Sarandos confirmed wide theatrical releases for Narnia and Charlie versus the Chocolate Factory. Separately announced distribution arrangements identify Sony Pictures Entertainment as the international theatrical distributor for those films.
The transmission mechanism is distribution economics generated through Sony’s existing international infrastructure. Netflix supplies the films and owns the relevant content investment; Sony contributes market access, release execution, and distribution capabilities under the agreed arrangements. This can generate fees or other contractual economics without requiring Sony to originate and finance the entire production.
The precise allocation of marketing expenditure, working capital, and commercial risk is not publicly established. The relationship should therefore not be modeled as risk-free fee income or as Sony ownership of the films’ lifetime economics. Nevertheless, it is a direct commercial role rather than a speculative inference from Netflix’s content budget.
The near-term significance is confirmation that the announced theatrical strategy remains intact. The principal financial catalysts are the 2027 releases and the associated recognition of distribution economics. These are existing arrangements reaffirmed by the call, not newly awarded contracts announced during it.
The longer-duration implication is that a scaled studio can benefit from streaming platforms’ selective use of theatrical distribution even when the streamer owns the intellectual property. Sony can monetize its distribution capabilities alongside its separate licensing relationships. That creates a different exposure from a subscription platform whose return depends primarily on retaining exclusivity within its own service.
PAY TELEVISION AND CABLE DISTRIBUTION
ADDITIONAL LIVE SPORTS WEAKEN THE TRADITIONAL VIDEO BUNDLE’S DIFFERENTIATION, BUT NOT THE BROADBAND BUSINESS (READ-THROUGH 8)
Affected companies: Charter Communications (CHTR: US) and Comcast (CMCSA: US). Direction: Negative for traditional video-bundle differentiation and retention economics. Magnitude: Modest near term and more meaningful cumulatively; substantially smaller at the consolidated parent level.
Netflix highlighted its Thanksgiving Eve and Christmas NFL games, a game in the final week of the regular season, and the 2027 Women’s World Cup. Sarandos said live events “drive new membership” and “add fuel to our ad revenues.”
The transmission mechanism is the availability of additional high-interest programming outside the traditional multichannel bundle. As standalone services offer more entertainment and selected sports events, some households can satisfy a larger portion of their viewing needs without maintaining a comprehensive video package. This weakens an important retention argument for cable video.
The call does not establish that Netflix is replacing the full sports bundle. Its NFL schedule remains a subset of the season, and individual events do not provide the breadth available across major sports networks. The high-conviction conclusion is incremental erosion of video differentiation, not an imminent collapse in video subscriptions.
The near-term catalysts are the November and December 2026 NFL events and subsequent subscriber behavior. The Women’s World Cup provides another identifiable viewing event in June and July 2027. Churn associated with those events cannot be quantified from Netflix’s commentary.
The consolidated impact is materially smaller than the video-specific pressure. Broadband remains necessary to consume the streaming services, distributors can participate in streaming bundles, and video subscriber losses can reduce associated programming costs. Comcast additionally has content and advertising relationships that create offsets elsewhere in the group.
The cross-portfolio implication is to distinguish the economics of owning connectivity from those of preserving the traditional television package. Netflix’s live expansion is a negative read-through for the latter, not evidence of weaker broadband demand or an equivalent loss of consolidated cable-company earnings.
Report record
- Sector
- Communication Services
- Fiscal period end
- September 30, 2026
- Report date
- October 20, 2026
- Analysis
- 5883 words
- Read-throughs
- 2726 words
- Content fingerprint (PDF)
ca686ef4ba72- Content fingerprint (analysis)
d541cb361e1b- Content fingerprint (read-throughs)
a9d8e1f51ded
Prepared from the company's earnings release and earnings call transcript. Figures as reported by the company. For information only. Not investment advice.
More from Netflix, Inc.
No other reports yet.
More in Communication Services
Core Quality Remains High, but Meta Is Becoming a Capital-Intensive AI Investment
All Communication Services reports
Follow @AtlasPeakRes on X for new earnings reports as they publish.