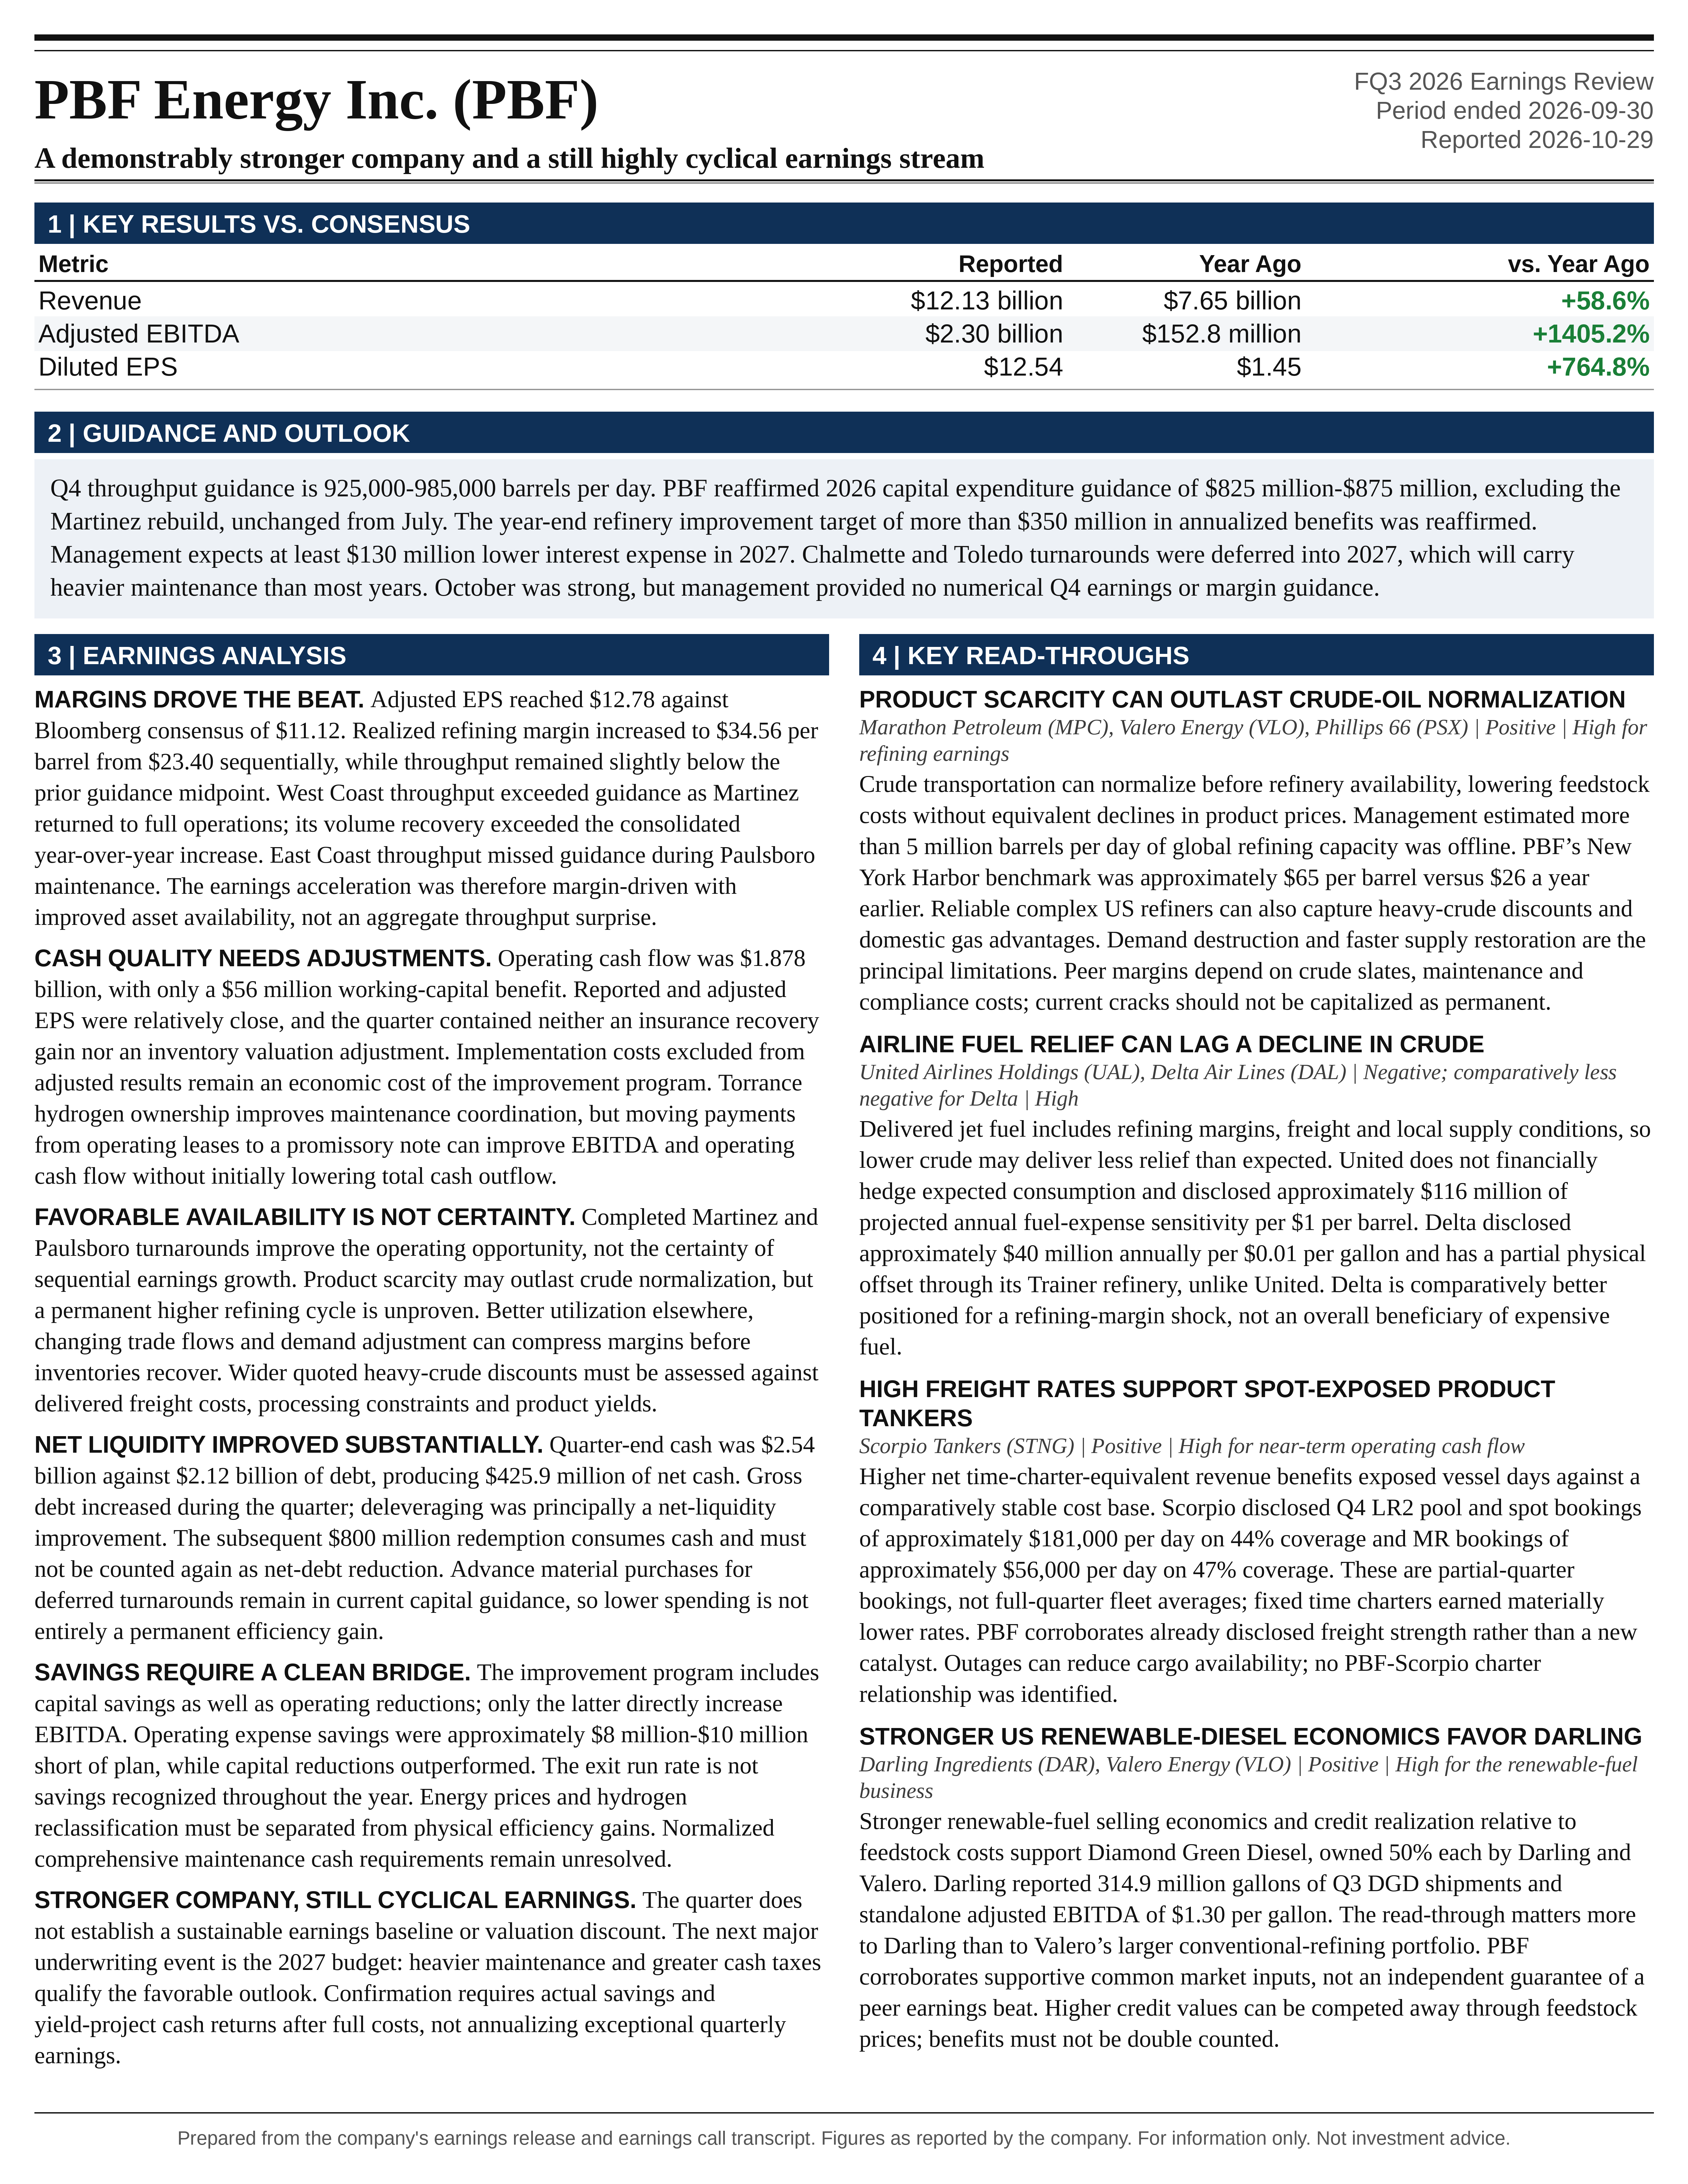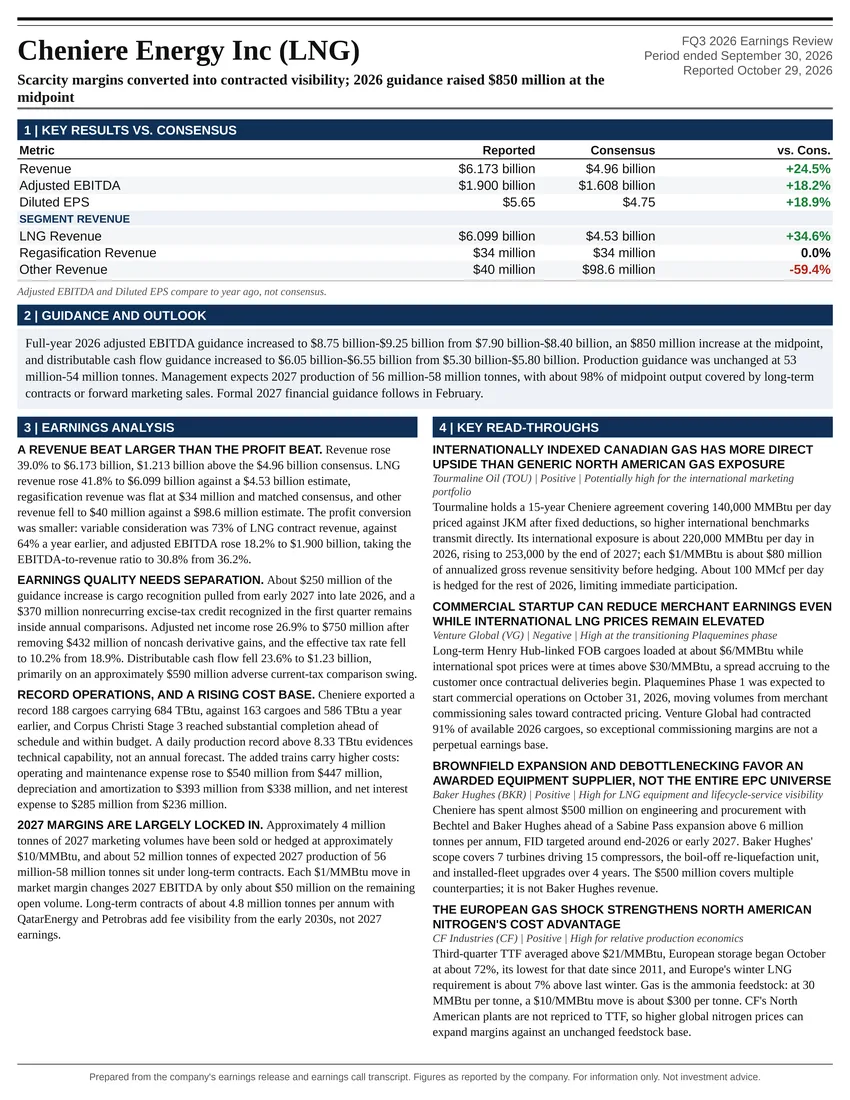
Scarcity margins converted into contracted visibility; 2026 guidance raised $850 million at the midpoint
Earnings Reports
PBF Energy Inc. FQ3 2026 Earnings Report
PBF Energy Inc. (PBF) FQ3 2026 earnings: A demonstrably stronger company and a still highly cyclical earnings stream. Full earnings analysis, key read-throughs, and the one-page exhibit from Atlas Peak Research.
PBF Energy Inc. (PBF)
Sector: Energy · FQ3 2026 · Period end September 30, 2026 · Reported October 29, 2026
PBF Energy’s Q3 2026 results demonstrate an unusually favorable combination of exceptional refining margins, restored operating availability and substantial balance-sheet improvement.
Download the one-page report (PDF)
View one-page exhibit
Download analysis (.md)
Download read-throughs (.md)
Post to X
One-Page Exhibit
Earnings Analysis
EXECUTIVE CALL SUMMARY: PBF Energy (10/29/26)
PBF Energy’s Q3 2026 results demonstrate an unusually favorable combination of exceptional refining margins, restored operating availability and substantial balance-sheet improvement. The principal investment development is not simply the magnitude of quarterly earnings, but management’s conversion of cyclical cash generation into lower financing costs, greater liquidity and potentially more durable refinery profitability. Adjusted EPS reached $12.78, adjusted EBITDA was $2.30 billion, and operating cash flow was $1.88 billion. Nevertheless, the quarter does not establish that these earnings represent a sustainable baseline. The appropriate call-based assessment is HOLD/NEUTRAL on valuation, with a favorable near-term earnings outlook and materially improved financial resilience.
Adjusted EPS increased 105.5% from $6.22 in Q2 2026 and compared with an adjusted loss of $0.52 in Q3 2025. Adjusted EBITDA increased 85.6% sequentially from $1.24 billion and compared with $152.8 million a year earlier. The dominant driver was realized refining margin, which increased to $34.56 per barrel from $23.40 sequentially and $9.00 a year earlier. Throughput increased to 923,800 barrels per day, but remained slightly below the midpoint of prior guidance. Consequently, the earnings acceleration should primarily be characterized as a margin-driven result with improved asset availability, rather than an aggregate throughput surprise.
The outlook for Q4 is constructive. Throughput guidance of 925,000-985,000 barrels per day implies a midpoint of 955,000 barrels per day, 3.4% above Q3 actual throughput. Management described October as strong, expected wider crude differentials to support feedstock economics and reported completion of the Martinez and Paulsboro turnarounds during October. However, no numerical Q4 earnings or margin guidance was provided. The distinction between favorable operating conditions and a guaranteed sequential earnings increase remains important.
The clearest durable financial improvement is management’s expectation that refinancing and debt reduction will lower 2027 interest expense by at least $130 million. The refinery business improvement program also remains targeted to exceed $350 million of annualized benefits by year-end 2026. These improvements must be separated from maintenance timing, accounting reclassification and exceptionally favorable market conditions. The $350 million program includes capital savings as well as operating expense reductions, while the Torrance hydrogen acquisition shifts certain payments from operating to financing classification without initially reducing their aggregate cash burden.
The central investment tension is therefore between a demonstrably stronger company and a still highly cyclical earnings stream. PBF enters Q4 with favorable operating availability, significant crude flexibility and reduced financial obligations. Conversely, 2027 brings heavier scheduled maintenance, greater expected cash taxation as tax-loss carryforwards are consumed, and uncertainty over how much current product scarcity persists. CEO Matt Lucey’s statement, “We intend to convert those earnings into lasting improvements in our business,” accurately identifies the strategic objective. The remaining investment question is how much of that improvement survives normalization in refining margins.
OBSERVATION: QUARTERLY PERFORMANCE AND EARNINGS QUALITY
PBF’s October 29 earnings release reported revenue of $12.13 billion, compared with $11.68 billion in Q2 2026 and $7.65 billion in Q3 2025. Revenue increased 58.6% year over year, but revenue is a relatively weak measure of economic progress for a refiner because it incorporates substantial changes in commodity prices. The more informative measures are realized refining margin, operating costs, throughput, cash generation and the extent to which earnings improvements persist after removing unusual items.
Adjusted fully converted net income was $1.57 billion, or $12.78 per share. Contemporaneous Seeking Alpha earnings coverage reported an EPS beat of $1.67, implying a consensus estimate of $11.11 and an approximately 15% positive surprise. Investing.com reported a similar EPS consensus of $11.10, although its revenue consensus differed. The earnings beat was therefore substantial, but the exact revenue surprise depends on the estimate provider. No inference about regional consensus performance can be drawn from those consolidated estimates alone.
Reported net income attributable to PBF Energy was $1.53 billion, or $12.54 per diluted share. The relatively small difference between reported and adjusted EPS is favorable for earnings quality. Special items reduced adjusted fully converted earnings by $28.9 million after tax, or $0.24 per share, principally reflecting $11 million of refinery improvement implementation costs and a $28 million pretax debt-extinguishment loss. The debt charge includes financing-accounting effects and should not be treated as a recurring operating expense. Conversely, implementation costs excluded from adjusted results remain relevant when evaluating the total economic cost of achieving the improvement program.
The historical comparison is particularly significant because Q3 2025 reported earnings contained substantial favorable special items. That quarter included a $250 million insurance recovery gain and a $94 million terminal asset sale gain, while adjusted EPS was negative $0.52 despite positive reported EPS of $1.45. Q3 2026 contained no insurance recovery gain and no lower-of-cost-or-market inventory adjustment. The current earnings improvement is therefore not principally an artifact of insurance accounting, asset sales or an inventory valuation reversal.
The sequential gross-margin bridge demonstrates the dominance of unit economics. Gross refining margin increased from $1.89 billion in Q2 to $2.94 billion in Q3, an improvement of approximately $1.05 billion. Using rounded reported throughput volumes, approximately $949 million of that improvement is attributable to the increase in realized margin per barrel, while approximately $101 million is attributable to higher processed volume at the prior-quarter margin. This decomposition is approximate and combines commodity conditions, crude selection, product yields and other capture factors within the unit-margin effect. It nevertheless indicates that roughly 90% of the gross-margin increase came from better economics per barrel rather than higher volume.
Operating costs provide a more mixed picture than the headline profitability. Refining operating expense declined sequentially from $8.00 to $7.80 per barrel, but increased from $7.35 a year earlier. General and administrative expense was $127.4 million, down from $148.6 million sequentially but up from $74.0 million a year earlier. Strong earnings therefore do not establish that every component of PBF’s expense base is declining. Regional operating mix, utilization, compensation and other cost factors need to be distinguished from the underlying improvement program.
REGIONAL PERFORMANCE AND THE RESTORATION OF MARTINEZ
The West Coast was the most important operating recovery. Throughput increased to 293,100 barrels per day from 234,000 a year earlier, an increase of 25.3%. This exceeded the prior Q3 guidance range of 270,000-290,000 barrels per day. West Coast gross refining margin increased to $38.64 per barrel from $7.96, while operating expense fell to $10.41 per barrel from $12.81. Gross refining margin less reported regional operating expense consequently improved from negative $4.85 to positive $28.23 per barrel, before depreciation and corporate allocations.
That result reflects both a dramatically stronger market and the restoration of productive assets. Martinez returned to full operations in May, making Q3 the initial full reporting quarter after the restart, although the hydrocracker turnaround began in September. The West Coast throughput increase of 59,100 barrels per day exceeded PBF’s consolidated year-over-year increase of 52,800 barrels per day. The net volume contribution from the rest of the system was therefore negative. This makes the recovery at Martinez central to the operating comparison, rather than a peripheral contributor to a uniformly expanding system.
The East Coast produced a strong financial result despite weaker throughput. Combined Delaware City and Paulsboro throughput was 293,800 barrels per day, below both the prior-year level of 307,800 and the Q3 guidance range of 300,000-320,000. The Paulsboro crude-unit turnaround began in September and was completed in October. Gross refining margin increased to $33.54 per barrel from $8.14, while operating expense increased to $5.93 from $4.98. The important Q4 opportunity is the restoration of throughput into a seasonally relevant distillate market, rather than evidence that Q3 volumes already exceeded expectations.
Toledo throughput increased to 156,400 barrels per day from 141,500, within the prior guidance range of 155,000-165,000. Gross refining margin increased to $36.86 per barrel from $11.03, while operating expense was comparatively stable at $6.40 versus $6.33. Distillate yield increased to 41% from 37%. Toledo therefore combined favorable market exposure with improved throughput and product mix, although the deferred FCC turnaround remains an important 2027 consideration.
Chalmette was less impressive on operating capture. Throughput of 180,500 barrels per day was within guidance but below the prior-year 187,700. Gross refining margin increased to $27.61 per barrel from $10.18, while operating expense increased to $7.16 from $5.21. The Gulf Coast benchmark environment was exceptionally strong, making the return of the pretreater and reformer particularly relevant. These units had been offline since May and were back in service by the call. Their restoration should improve operational flexibility, but no quantified Q4 capture benefit was provided.
The system’s product mix also cautions against assuming that a heavier crude slate automatically produces a higher distillate yield. Heavy crude represented 30% of Q3 throughput, versus 25% a year earlier but 31% in Q2. Consolidated distillate yield was 34%, unchanged year over year and below Q2’s 36%. Gasoline yield increased to 47% from 43% a year earlier and 42% sequentially. Management committed to economic optimization, not to a specified increase in either heavy-crude consumption or distillate yield.
REFINING FUNDAMENTALS: STRONG EVIDENCE OF SCARCITY, LESS CERTAINTY ABOUT DURATION
Management’s macroeconomic argument is that refined products, rather than crude oil availability alone, are the binding constraint. Lucey stated, “Peace may, and hopefully will, normalize trade flows, but it will not restore damaged capacity, rebuild depleted inventories, or reverse years of capacity rationalization.” This distinction is economically important. A recovery in crude shipments can improve refinery feedstock availability without immediately restoring damaged conversion capacity or rebuilding product inventories.
The company’s reported market indicators substantiate the exceptional Q3 margin environment. The New York Harbor 2-1-1 benchmark averaged $64.77 per barrel, versus $25.82 a year earlier. The Gulf Coast LLS 2-1-1 benchmark averaged $69.06 versus $24.41. Los Angeles and San Francisco benchmarks averaged $71.45 and $73.33, respectively, versus $29.34 and $30.59. The strength was therefore geographically broad, rather than dependent on an isolated favorable market.
Management estimated that more than 5 million barrels per day of global refining capacity was offline and that global inventories were approximately 500 million barrels below pre-war levels. These are management estimates, not independently established inventory balances within the earnings materials. The geographic coverage, product composition and reference date underlying the inventory comparison were not specified. The phrase “essentially zero cushion” should consequently be understood as management’s characterization of market tightness, not a literal statement that usable inventories have disappeared.
The proposed “new higher cycle” is plausible but not proven by the quarter. Physical damage and prior capacity closures can support an extended period of scarcity. However, normalization does not require the immediate restoration of every lost barrel of capacity. Higher utilization elsewhere, changes in trade flows, product substitution, weaker petrochemical or industrial demand, and consumer responses to elevated prices can compress refining margins before inventories fully recover. The duration of above-normal margins remains more uncertain than the existence of current tightness.
PBF’s domestic product exposure is advantageous in this environment. Management stated that most products are sold domestically, reducing exposure to expensive long-distance product transportation. Import-dependent coastal markets can also price against the marginal delivered cost of foreign supply. Nevertheless, demand resilience should not be overstated. Paul Davis reported stable West Coast demand and modestly stronger wholesale volumes, but suggested that some of the increase reflected movement from branded channels into wholesale. That is evidence of commercial channel performance, not necessarily an equivalent increase in total regional consumption.
CRUDE DIFFERENTIALS, FREIGHT AND CALIFORNIA ACCESS
Wider crude-quality discounts create an additional source of margin support beyond product cracks. PBF’s Q3 indicators showed a Brent-Maya differential of $19.16 per barrel, compared with $8.15 a year earlier, and a WTI-WCS differential of $19.63 versus $12.54. Thomas O’Connor attributed the widening to Latin American heavy-crude availability and freight-induced pressure on export valuations, with Canadian grades responding to those dynamics.
The economic benefit depends on delivered crude cost, not the quoted discount alone. A wider export-market discount can be partly offset by higher freight, financing costs, handling requirements or less favorable product yields. PBF’s complexity provides flexibility to process discounted barrels, but refinery-specific limits remain important, including coking capacity, hydrogen availability, sulfur handling, metals, unit severity and product specifications. Toledo’s predominantly light and medium slate also means that heavy-crude benefits are not distributed uniformly across the system.
The sensitivity is nevertheless meaningful. At Q3 throughput and a 30% heavy-crude share, an additional $1 per barrel discount across the entire heavy portion of the slate would represent approximately $25.5 million of quarterly gross feedstock benefit before freight, yield and processing offsets. This is an illustrative sensitivity, not management guidance. Actual exposure varies by grade, purchase timing and refinery, and Q3’s reported margin already includes the benefits realized during that quarter.
Freight is both a cost and a competitive advantage. Management stated that approximately 50% of the fleet was on time charter, providing insulation from spot-market volatility, and emphasized shorter Atlantic Basin crude voyages relative to many Asian competitors. However, 50% of the fleet is not necessarily equivalent to 50% of imported barrels or freight expenditure. Charter duration, vessel size, utilization and fuel costs also matter. The available disclosure supports partial protection, not a conclusion that PBF is fully hedged against transportation inflation.
California’s advantage is more specific than a general heavy-crude discount. PBF emphasized its ability to source California production through the M-70 pipeline, which still has available capacity. Management identified production availability, rather than pipeline egress, as the current constraint. A potential San Pablo Bay Pipeline restart therefore should not be modeled as an immediate increase in economic crude supply to Martinez. Incremental production, competing transportation economics and the new owner’s commercial intentions would first need to support that outcome.
The timing of crude benchmarks also matters. The Q3 release showed average ANS pricing below average Brent, while the Q&A referenced a current ANS premium. Quarterly averages and prompt-market conditions describe different periods. The most relevant Q4 conclusion is management’s expectation of advantageous purchased crude costs, not an extrapolation of every Q3 differential.
Q4 GUIDANCE: HIGHER AVAILABILITY, WITHOUT AN EARNINGS COMMITMENT
PBF’s Q4 throughput guidance represents an increase in operating opportunity, but not a revision to a previously published Q4 earnings forecast. The new 925,000-985,000 barrels-per-day range has a midpoint 25,000 barrels per day above the prior Q3 guidance midpoint and 31,200 barrels per day above actual Q3 throughput. Q3 actual throughput of 923,800 was approximately 0.7% below the prior guidance midpoint of 930,000, consistent with management’s characterization of overall performance as in line.
Relative to the prior quarter’s guidance ranges, the Q4 outlook increases West Coast throughput by 20,000 barrels per day and Gulf Coast throughput by 5,000, while leaving East Coast and Mid-Continent ranges unchanged. Relative to actual Q3 operations, however, the largest midpoint increase is on the East Coast, where guidance implies recovery from Paulsboro’s turnaround. This distinction explains why West Coast restoration dominated the historical comparison while East Coast availability is important to the incremental Q4 volume opportunity.
At the Q4 midpoint, the system would process approximately 87.9 million barrels during the quarter, versus approximately 85.0 million in Q3. The additional volume provides operating leverage, but a $1 per barrel movement in realized margin across the entire Q4 system would affect gross refining profit by approximately $88 million. Relatively modest margin changes can therefore overwhelm the benefit from the additional barrels.
Management appropriately declined to predict prompt product cracks. Lucey said, “I think it would be folly for us to predict prompt cracks.” His comments about October strength and wider crude differentials are constructive qualitative signals, but not an EPS or EBITDA forecast. Similarly, the “clear operational runway” applies after the October completion of maintenance. It does not mean that every unit was available for every day of Q4.
2026 CAPITAL GUIDANCE AND THE 2027 MAINTENANCE BURDEN
Full-year 2026 capital expenditure guidance remains $825 million-$875 million, excluding Martinez rebuild expenditures. This is unchanged from the July 30 Q2 update. PBF’s January 2026 guidance implied total capital spending of $885 million-$925 million, comprising $600 million-$620 million for maintenance and turnarounds, $235 million-$250 million for capital projects and $50 million-$55 million for corporate and logistics spending. The current midpoint is therefore $55 million, or approximately 6.1%, below the initial midpoint.
The reduction should not be classified entirely as a permanent efficiency gain. The July update explicitly connected it to deferral of the Chalmette and Toledo turnarounds into 2027. The current guidance also includes advance purchases of materials for the deferred work. Some spending remains in 2026 even though the associated downtime and execution move to 2027. The resulting annual cash profile reflects both genuine cost improvement and interperiod timing.
Reported capital expenditures on the release’s guidance-comparable basis were $685.1 million through September. Mechanically, the annual range implies approximately $139.9 million-$189.9 million in Q4 spending on that basis. This is a derived residual, not separate quarterly guidance, and excludes the separately identified Martinez rebuild and hydrogen acquisition expenditures. It should not be mistaken for PBF’s complete Q4 investing cash requirement.
The 2027 maintenance outlook is the most important qualification to the favorable near-term operating message. Lucey stated, “2027 will be a heavier turnaround schedule than most years.” The initial 2026 plan contemplated substantial Chalmette crude-unit/coker work and Toledo FCC work, with planned durations of 50-55 days and 50-60 days, respectively. Updated 2027 timing, scope and durations were not provided, and those historical unit-level durations should not be translated into complete refinery shutdowns.
Heavier maintenance creates an adverse combination of greater cash expenditure, lower throughput and weaker fixed-cost absorption. Lower interest expense and continued operating improvements can offset part of that pressure, but they do not remove it. Management also indicated that 2028 should be a lighter turnaround year. Through-cycle cash generation should therefore be evaluated over a maintenance cycle rather than by annualizing a favorable quarter or assuming that 2026 spending represents a permanent baseline.
REFINERY BUSINESS IMPROVEMENT: REAL PROGRESS, WITH IMPORTANT MEASUREMENT LIMITATIONS
The refinery business improvement program remains central to PBF’s effort to reduce its economic breakeven. Management reiterated that more than $230 million of annualized improvements had been incorporated into 2026 plans, with the total expected to exceed $350 million by year-end. The October and July releases both identify the $230 million level as achieved in 2025 and the $350 million objective as the 2026 exit target. The current call therefore reaffirmed the target rather than introducing an additional $350 million of savings.
The distinction between annualized benefits and annual earnings is essential. An exit run rate describes the expected annual benefit if achieved performance is maintained. It is not equivalent to savings recognized throughout 2026. Moreover, the program includes operating expense reductions and capital savings. Only the operating portion directly increases EBITDA. Capital savings improve cash generation but do not increase EBITDA in the period in which expenditure is avoided.
The original $230 million framework comprised approximately $160 million of operating expense benefits and $70 million of capital benefits. Management now expects approximately $88 million of capital reductions, exceeding the commitment by $18 million, including approximately $54 million from turnaround improvements. Operating expense savings were described as approximately $8 million-$10 million short of plan. On those absolute figures, capital outperformance more than offsets the operating shortfall at the cash-benefit level, although it does not replace the missing EBITDA contribution.
The operating-savings discussion contained a small numerical ambiguity. Management described the shortfall as approximately 10%, while also citing $8 million-$10 million against an earlier $160 million operating target. Those absolute amounts imply approximately 5%-6%, not 10%. The appropriate interpretation is that the operating program is modestly below its original in-year objective, not that a precise revised savings total was formally established.
The physical operating indicators are encouraging. Natural-gas intensity declined approximately 11% year to date, Toledo’s overall energy intensity improved 10%-15%, and strategic sourcing identified approximately $55 million of annual savings across contract renewals. Management also reported improvement in turnaround benchmarking from the bottom 50% of the industry before the program to the top 50% in 2026. These disclosures support the existence of operational progress, although the sourcing, energy, turnaround and sustaining-capital figures should not be added independently to the headline target because they overlap with the program.
Lower energy intensity is more durable evidence than lower absolute fuel expenditure because natural-gas prices also changed. PBF’s reported Q3 natural-gas indicator was $2.89 per MMBtu, versus $3.07 a year earlier and the $4.10 assumption in the January budget. A cost bridge must distinguish physical efficiency, commodity-price benefits, regional mix and accounting effects.
Management’s sustaining-capital comments also require care. A historical baseline of approximately $230 million was said to have been reduced by $25 million-$30 million, implying approximately $200 million-$205 million for that component. This is not an all-in estimate of the cash needed to maintain PBF’s entire business. Major turnarounds, corporate and logistics spending, and other capital requirements remain additional considerations. The call did not fully resolve the analyst request for a normalized, comprehensive maintenance cash requirement.
YIELD PROJECTS: ATTRACTIVE POTENTIAL RETURNS WITHOUT CAPACITY EXPANSION
The Chalmette jet-fuel project is the clearest example of the proposed reinvestment strategy. The initial phase completed in Q3 enables approximately 10,000 barrels per day of jet production by upgrading high-sulfur diesel, with capability expected to increase to 20,000 barrels per day in 2027. Management cited capital expenditure below $20 million and a product-value differential of approximately $0.20 per gallon.
At 42 gallons per barrel, the cited differential is $8.40 per barrel. At 10,000 barrels per day and continuous operation, that represents approximately $30.7 million of annual gross product-value improvement. At 20,000 barrels per day, it represents approximately $61.3 million, or $55.2 million at 90% utilization. If the cited capital envelope covers the full intended configuration, the gross-value payback would be approximately 4 months at full utilization.
Those calculations are not EBITDA, free cash flow or an investment return forecast. Incremental hydrogen, utilities, catalysts, yield losses, logistics, taxes and implementation requirements must be deducted. The project’s economics are also sensitive to the persistence of the high-sulfur-diesel-to-jet differential. Nevertheless, the relationship between the indicated capital requirement and potential gross uplift supports management’s contention that selective internal projects may offer attractive returns.
The Paulsboro opportunity follows a similar approach. Management identified a 2027 project to upgrade lower-value intermediates and increase gasoline yield and blending capability by approximately 10,000 barrels per day. No project cost or expected uplift per barrel was disclosed. Each $1 per barrel of realized incremental value on that volume would represent approximately $3.65 million of annual gross benefit at full utilization, but a defensible project return cannot be calculated from the available information.
Mike Bukowski emphasized, “To be clear, these are yield improvement projects, not capacity expansions.” The distinction should be preserved in financial models. These projects change product quality and value within the existing system; the stated product volumes should not automatically be added to total crude throughput. Their potential strategic value is improved conversion economics without the scale, duration and execution exposure of a major refinery expansion.
BALANCE SHEET: SUBSTANTIAL NET IMPROVEMENT, NOT SIMPLY GROSS DEBT REDUCTION
PBF ended September with $2.54 billion of cash and $2.12 billion of reported debt, producing $425.9 million of net cash. This compares with $855.0 million of net debt at June 30 and $1.62 billion at December 31, 2025. Net debt improved by approximately $1.28 billion during Q3 and $2.05 billion year to date. These changes substantiate management’s central balance-sheet claim.
Gross debt, however, increased by approximately $369 million during Q3. The increase reflects the hydrogen seller financing and the replacement of $500 million of existing notes with $550 million of exchangeable notes, together with carrying-value effects. Cash increased by approximately $1.65 billion, more than offsetting that increase. The quarter’s deleveraging was therefore principally a net-liquidity improvement, not a reduction in every measure of debt.
After quarter-end, PBF redeemed $800 million of 9.875% notes using cash. Before other Q4 activity, this would reduce cash to approximately $1.74 billion. Management reported approximately $1.4 billion of remaining gross debt, including the hydrogen promissory note. The repayment should not be counted as an additional $800 million of net-debt reduction: debt principal and cash decline together, before redemption premiums, fees and accounting effects.
The financing savings are substantial. Redemption of the $500 million 7.875% notes eliminates approximately $39.4 million of annual coupon expense, while redemption of the $800 million 9.875% notes eliminates another $79.0 million. Together, those actions remove approximately $118.4 million of annual coupons. Earlier refinancing and other financing changes help explain management’s expectation of at least $130 million less interest expense in 2027.
At the indicated 26% tax rate, a $130 million reduction would represent approximately $96 million of after-tax earnings, or approximately $0.78 per share using the Q3 fully diluted share count, assuming other factors remain unchanged. This is a useful sensitivity rather than separate EPS guidance. Lower interest income on cash used for debt repayment, promissory-note financing costs, fee amortization and the precise comparison baseline must also be incorporated into a complete model.
ZERO-COUPON FINANCING IS LOW-CASH-COST FINANCING, NOT FREE CAPITAL
The September financing release provides important context absent from the abbreviated call discussion. The exchangeable notes have an initial exchange price of approximately $96.80 per share and are accompanied by capped-call transactions with an initial cap price of $123.20. The notes require cash settlement up to principal, with value above principal potentially settled in cash, shares or a combination.
The transaction eliminates regular coupon payments, extends maturity and preserves access to capital markets. However, it also embeds an equity option, required issuance expenditure and capped-call premiums. The pricing release disclosed approximately $25.2 million of capped-call cost for the original $500 million transaction, with additional capped calls associated with the exercised option. The economic cost is therefore not captured by the 0% coupon alone.
The earnings release states that no incremental diluted shares from these notes were included in Q3 because the applicable share-price condition was not met during the period. Future dilution depends on share performance, settlement decisions and the capped-call structure. It would be incorrect either to assume immediate dilution for the full underlying share amount or to assume that the financing can never dilute shareholders.
Management’s decision to retain permanent financing is defensible as a liquidity and capital-market-access choice, but it does not eliminate operating cyclicality. The stronger balance sheet reduces the probability that a downturn forces distressed financing or impaired capital decisions. It does not prevent refinery outages, adverse commodity movements or environmental liabilities from consuming cash.
TORRANCE HYDROGEN ACQUISITION: RELIABILITY BENEFITS AND CASH-FLOW PRESENTATION
The acquisition of the 2 Torrance hydrogen plants addresses a specific operational dependency. Management explained that the plants were integrated with refinery utilities and steam production, while hydrogen availability directly influenced refinery utilization. Ownership allows maintenance and turnaround schedules to be coordinated with the refinery rather than managed across separate operating priorities.
The intended return is primarily greater refinery availability. Bukowski stated that the acquisition was based on increasing utilization, rather than describing a large immediately identifiable reduction in aggregate cash expenditure. This is economically credible for a hydrogen-dependent refinery, but no incremental throughput, avoided outage frequency or quantified cash return was provided.
The accounting issue is especially important. CFO Joe Marino stated, “nothing changed with the transaction as far as the cash flows go or overall cash flows.” Payments previously associated with operating leases will now be associated with a debt promissory note. The September acquisition disclosure confirms that the prior operating lease liability and related right-of-use asset were derecognized when the transaction closed.
Consequently, reported operating cash flow and EBITDA can improve through classification changes even without an equivalent reduction in total cash outflow. Comparisons of operating expense, cash conversion and leverage should adjust consistently for the former lease structure and the new financing obligation. Principal repayments should remain visible in an economic cash-flow assessment even when they sit below conventional operating-cash-flow-minus-capex calculations.
PBF separately identified $46.5 million of acquisition-related cash expenditure in Q3 and approximately $340 million of seller financing. These amounts should not be modeled as though the entire purchase price was paid in cash during the quarter. Nor should the transaction be assigned a large standalone cost-saving benefit absent evidence of improved utilization or reduced total contractual payments. Management also indicated that Torrance’s circumstances were unusual and that similar repurchases of other hydrogen assets were not expected.
CASH GENERATION, INSURANCE AND TAX NORMALIZATION
Subtracting the Q2 year-to-date cash-flow statement from the Q3 year-to-date statement produces Q3 operating cash flow of $1.878 billion. This represents approximately 81.6% of adjusted EBITDA. The disclosed $56 million working-capital benefit was modest relative to total cash generation, supporting the conclusion that cash performance was primarily earnings-driven rather than dependent on a large temporary working-capital release.
Operating cash flow less the reported $176.5 million of capital expenditure was approximately $1.70 billion. After also deducting the separately identified $8.4 million Martinez rebuild expenditure and $46.5 million hydrogen acquisition cash expenditure, the surplus was approximately $1.65 billion. Removing the $56 million working-capital benefit reduces that figure to approximately $1.59 billion. These are analytical cash-surplus measures, not company-defined free cash flow, and they precede shareholder distributions and financing payments.
The Martinez insurance recovery is approaching resolution but remains nonrecurring. Cumulative receipts were $1.25 billion, unchanged during Q3. The July release had already expected completion of the claims process during the second half of 2026; the current call narrowed the expectation to before year-end. Management’s reference to a final payment in a range similar to recent precedents is not a sufficiently precise amount to book as firm guidance. The previously disclosed $250 million installment provides context, not a contractual forecast for the final recovery.
Q4 cash conversion may diverge from EBITDA because of commodity-price timing and taxes. Management expected some working-capital benefits from late-Q3 price increases to emerge in early Q4, while also identifying an upcoming cash tax payment. Higher prices are not universally a working-capital benefit for refiners. Their cash effect depends on inventory ownership, receivable and payable terms, financing arrangements and purchase timing. The transcript describes PBF’s specific near-term timing expectation rather than a general rule.
The expected consumption of a substantial majority of tax-loss carryforwards during 2026 is particularly important for 2027 valuation. PBF can report a 26% effective tax rate while cash taxes differ because of tax attributes and payment timing. As those attributes are used, a larger portion of future pretax cash earnings may be paid in cash taxes. Lower interest expense and better operating performance can therefore coexist with less favorable cash conversion than a simple extrapolation of recent cash generation would suggest.
ST. BERNARD RENEWABLES: MATERIAL IMPROVEMENT, BUT LIMITED GROUP DIVERSIFICATION
St. Bernard Renewables contributed $62.4 million of equity income in Q3, compared with $27.5 million in Q2 and a $19.7 million equity loss a year earlier. PBF’s corresponding EBITDA contribution was approximately $72.1 million after adding back its share of interest, depreciation and amortization. That represented approximately 3.1% of consolidated adjusted EBITDA. SBR was therefore a meaningful incremental contributor, but conventional refining remained overwhelmingly responsible for group earnings.
Production averaged approximately 19,200 barrels per day, compared with approximately 15,100 in Q2, when an April catalyst change affected output. Q3 production was above the midpoint of the prior 18,000-20,000 guidance range. Q4 production guidance remains 18,000-20,000 barrels per day, indicating stable high utilization rather than a further major volume increase.
Ownership and production bases must be kept consistent. PBF owns 50% of SBR and accounts for the investment under the equity method. The reported production figure describes the facility, while the equity income and EBITDA contribution discussed above are PBF’s share. Adding another 50% adjustment to the reported contribution would understate earnings; treating the facility’s entire output as wholly owned would overstate economic exposure.
Management attributed stronger profitability to favorable renewable-diesel margins, feedstock-versus-distillate economics, high RIN prices and a greater contribution from lower-carbon-intensity feedstocks. Lower-carbon-intensity feedstocks can increase credit value, but their attractiveness depends on purchase cost, processing requirements, yields and applicable credit rules. No detailed feedstock mix or numerical margin outlook was provided.
PBF received its initial SBR distribution of approximately $20 million during Q3. That amount was approximately 32% of PBF’s equity income and 28% of its EBITDA contribution. The difference does not itself indicate weak underlying cash generation, because the venture may retain cash for working capital, financing and other requirements. It does mean that equity earnings and cash available at the parent are not interchangeable. The distribution should also not be added again if already captured in the relevant reported cash-flow measure.
Higher renewable credit prices are not an unqualified benefit to the consolidated company. PBF’s reported effective RIN basket increased to $14.36 per barrel from $6.38 a year earlier. Strong credits support SBR economics but affect compliance economics in conventional refining, with the net burden also influenced by product-price pass-through and commercial exposure. SBR should therefore be treated as a partial and imperfect offset, not a complete hedge against renewable-fuel compliance costs.
CAPITAL ALLOCATION AND SHAREHOLDER RETURNS
The quarterly dividend increases from $0.275 to $0.325 per share, an 18.2% increase, producing an annualized dividend of $1.30. At approximately the Q3 basic share count, that represents an annual cash requirement near $156 million, approximately $24 million above the prior rate. The incremental commitment is modest relative to current cash generation and the expected financing savings.
Management emphasized sustainability rather than maximizing immediate distributions. Lucey stated that “there is no replacement for a strong balance sheet,” while describing repurchases as an important component of shareholder returns without announcing a new quantified buyback commitment during the call. The priority remains a combination of liquidity, selected internal reinvestment and a sustainable ordinary dividend.
The debate over excess cash remains unresolved because management did not specify a minimum liquidity target or a formula for distributing cash above that level. Quarter-end net cash was approximately $3.47 per Q3 diluted share, much less than gross cash per share. Gross cash should not be treated as entirely distributable given outstanding debt, commodity working-capital needs, taxes, maintenance and contingent liabilities. The analyst’s acquisition-target discussion was hypothetical and does not constitute evidence of an active transaction or takeover catalyst.
ILLUSTRATIVE Q4 SCENARIOS AND EARNINGS SENSITIVITY
A transparent sensitivity framework helps separate throughput visibility from margin uncertainty. The following scenarios are analytical assumptions, not management guidance or consensus estimates. They use 92 days, refining operating expense of $7.80 per barrel and approximately $27 million of net quarterly contributions and adjustments outside gross refining margin less refining operating expense, broadly consistent with the Q3 reconciliation. Holding those items constant deliberately isolates volume and realized-margin effects.
The base case, assigned a 55% probability, assumes 955,000 barrels per day and realized gross refining margin of $32 per barrel. This allows modest margin normalization from Q3 while preserving the guided availability improvement. It produces approximately $2.15 billion of adjusted EBITDA. The principal message is that favorable throughput does not require sequential EBITDA growth if unit margins normalize.
The bull case, assigned a 25% probability, assumes throughput at the 985,000 barrels-per-day upper end and realized gross refining margin of $38 per barrel. Persistent product scarcity, favorable crude purchases and strong refinery availability would support approximately $2.76 billion of adjusted EBITDA under those assumptions.
The bear case, assigned a 20% probability, assumes throughput at the 925,000 barrels-per-day lower end and realized gross refining margin of $22 per barrel. Faster normalization in product cracks or weaker capture would produce approximately $1.24 billion of adjusted EBITDA. This is not a severe historical trough: the assumed margin remains well above Q3 2025’s $9.00. A major unplanned outage or a deeper collapse in margins could generate materially worse results.
The probability-weighted outcome is approximately $2.12 billion of Q4 adjusted EBITDA within this deliberately simplified framework. The probabilities are judgmental, and the result is not a substitute for a regional refinery model or a current forward-curve valuation. Its value is demonstrating that a relatively narrow range of throughput outcomes can coexist with a very wide range of earnings.
IMPLICATION: A LOWER BREAKEVEN DOES NOT REMOVE COMMODITY EXPOSURE
The most durable positive implication is a reduction in PBF’s financial and operating breakeven. Lower interest expense directly improves earnings and cash flow across market environments. Better turnaround execution, energy efficiency and yield optimization can also create value through both strong and weak markets. These changes are more defensible sources of lasting equity value than assuming that the entire current scarcity premium persists.
Their scale nevertheless remains modest relative to commodity sensitivity. At Q3 throughput, a $1 per barrel change in realized refining margin represents approximately $337 million of annual pretax gross refining profit, before behavioral or operating offsets. The entire $350 million improvement target, including its capital component, is approximately equivalent to that sensitivity. The program is strategically important, but a small movement in market margins can outweigh it.
A valuation based on annualizing Q3 adjusted EPS to $51.12 or adjusted EBITDA to approximately $9.2 billion would therefore be unreliable. The quarter combines unusually high cracks, favorable crude differentials, restored Martinez operations and supportive renewable-diesel economics. Some company-specific improvements are durable; the prevailing market contribution is not established as permanent.
Valuation should distinguish the present value of temporary excess cash generation from normalized operating value. Cash accumulated during an exceptional market can permanently benefit shareholders even if margins later decline. However, applying a normal earnings multiple to peak earnings and then separately assigning full value to the resulting cash can overstate that benefit. The same consistency is required for SBR, lease-to-debt reclassification, exchangeable securities and deferred maintenance.
The call does not independently establish that the shares are mispriced. Analyst comments that the market is failing to recognize cash generation are opinions, not conclusions demonstrated by the financial statements. A robust valuation requires a verified enterprise value, regional forward economics, normalized maintenance expenditure, post-NOL cash taxes and a consistent treatment of financing obligations. The operating outlook improved materially; the appropriate price to pay for that improvement remains a separate question.
CATALYSTS, RISKS AND THESIS INVALIDATION
The immediate catalyst is Q4 operating delivery. The key evidence will be throughput relative to the 955,000 barrels-per-day midpoint, restoration of East Coast volumes, sustained West Coast availability, Chalmette capture after the return of affected units, and realization of the expected crude-cost advantage. Actual regional margins will matter more than headline benchmark cracks alone.
Before year-end, additional catalysts include completion of the Martinez insurance settlement and demonstration that the refinery improvement program has reached its targeted exit run rate. The insurance outcome is a finite liquidity event. The improvement program is potentially recurring, but requires a bridge showing operating savings, capital savings, implementation costs and any overlap with hydrogen accounting changes.
The next major underwriting event is the 2027 budget. It should clarify turnaround timing and cash requirements, expected throughput, the split between sustaining and discretionary projects, remaining improvement-program benefits, interest expense and cash taxation. Execution of the Chalmette jet expansion and Paulsboro yield project during 2027 would provide further evidence that selective reinvestment can improve asset economics without a major expansion program.
The principal downside risks are faster normalization in product margins, narrowing crude-quality discounts, adverse freight exposure, renewed refinery outages, maintenance overruns and greater cash-tax absorption. California remains both a source of scarcity-driven profitability and regulatory risk. Management’s description of improved relations with the state is constructive, but it does not remove exposure to operating requirements, environmental enforcement, permitting conditions or longer-term fuel-demand changes.
The durable-improvement thesis would weaken if normalized operating costs fail to decline after adjusting for utilization, regional mix, natural-gas prices and hydrogen reclassification; if the $350 million program is delivered mainly through temporary expenditure deferral; or if yield projects fail to generate incremental cash returns after their full operating costs. The near-term bullish earnings view would weaken if better availability and wider quoted crude discounts fail to translate into realized margin and cash generation.
RECOMMENDATION
HOLD/NEUTRAL is the appropriate conclusion from the call alone, with a favorable Q4 operating bias and a materially stronger credit profile. The quarter establishes exceptional current profitability and credible progress toward a lower-cost, more resilient business. It does not establish a permanent refining-margin reset or a valuation discount sufficient to justify an unconditional BUY recommendation.
The most attractive potential investment case is the combination of finite scarcity-driven cash generation and a durable reduction in through-cycle financing and operating requirements. Confirmation requires a transparent 2027 cash-flow bridge that incorporates heavier maintenance, cash taxes, actual rather than annualized savings, and the economics of the yield projects. Continued execution would support a stronger assessment; reliance on annualized Q3 earnings would not.
Historical and supplemental comparisons are based on PBF’s October 29 and July 30, 2026 earnings releases, January 2026 guidance, September financing and acquisition disclosures, 2025 annual report and 2026 proxy statement. Market-disruption estimates and forward operating commentary are attributed to management. Scenario probabilities and financial sensitivities are illustrative analytical assumptions.
COMPANY EMPLOYEES ON THE CALL
• Matthew “Matt” Lucey, President and Chief Executive Officer. • Michael “Mike” Bukowski, Senior Vice President and Head of Refining. • Joseph “Joe” Marino, Senior Vice President and Chief Financial Officer. • Colin Murray, Vice President, Investor Relations. • T. Paul Davis, Senior Vice President, Supply, Trading and Optimization. • Thomas “Tom” O’Connor, employee in a non-executive officer capacity; formerly Senior Vice President, Commodity Strategy and Risk. The current functional title was not specified on the call. PBF’s 2026 proxy states that he stepped down from the executive position on December 31, 2025.
RESEARCH ANALYSTS ON THE CALL
• Manav Gupta, UBS. • Doug Leggate, Wolfe Research. • Joe Laetsch, Morgan Stanley. • Phillip Jungwirth, BMO Capital Markets. • Josiah Knight, Goldman Sachs. • John Royall, Piper Sandler.
Key Read-Throughs
KEY READ-THROUGHS FROM PBF ENERGY’S Q3 2026 EARNINGS CALL
The strongest cross-market conclusion is that the current disruption is a refined-product scarcity event, not simply an oil-price shock. That distinction favors operationally reliable US refiners, selected renewable-fuel producers and spot-exposed product-tanker owners, while disadvantaging unhedged fuel consumers and heavy-oil producers facing wider quality discounts. The most actionable implication is that normalization in crude supply or geopolitical risk does not necessarily produce an equivalent normalization in diesel, jet-fuel or gasoline economics. Geographic positioning, refinery configuration, freight exposure and ownership structure matter more than broad sector classifications. The retained read-throughs below distinguish company-level exposure from industry inference and separate current earnings effects from potentially durable changes. Directional assessments concern operating economics; they do not imply that the corresponding share-price opportunity remains undiscounted.
CONVENTIONAL REFINING
PRODUCT SCARCITY CAN OUTLAST CRUDE-OIL NORMALIZATION, SUPPORTING US COMPLEX REFINERS (READ-THROUGH 1)
Affected companies: Marathon Petroleum (MPC: United States), Valero Energy (VLO: United States) and Phillips 66 (PSX: United States). Direction: positive. Magnitude: high for refining earnings and potentially material for consolidated cash generation, with the equity sensitivity diluted by each company’s non-refining businesses.
The critical call evidence is management’s distinction between recovering crude flows and constrained product supply. Matt Lucey stated, “Crude normalization will happen much quicker than stabilization in the product markets.” He also stated that peace would not immediately restore damaged capacity, rebuild depleted inventories or reverse capacity rationalization. Management estimated that more than 5 million barrels per day of global refining capacity was offline and inventories were approximately 500 million barrels below pre-war levels. Those figures are management estimates, but the reported New York Harbor benchmark of approximately $65 per barrel versus $26 a year earlier independently demonstrates the exceptional margin environment within PBF’s financial disclosures.
The transmission mechanism is stronger product realizations relative to delivered crude costs. If crude transportation normalizes faster than refinery availability, feedstock costs can decline without an equivalent decline in gasoline, diesel and jet-fuel prices. Complex US plants also have the potential to capture widening heavy-crude discounts. These benefits are additional to the relative operating-cost advantage identified by PBF from abundant domestic natural gas and shorter crude-supply routes. The signal is therefore more favorable for conversion capacity and reliable operations than for undifferentiated exposure to higher oil prices.
The financial sensitivity is substantial. Each additional $1 per barrel of realized margin across 100,000 barrels per day represents approximately $36.5 million of annual pretax gross-margin contribution, assuming unchanged throughput and before incremental operating costs. That is a scale illustration, not a company earnings forecast. PBF’s actual margin cannot be transferred directly to peers because crude slates, product yields, maintenance and renewable-fuel compliance costs differ.
The near-term catalysts are Q4 regional margin capture, crude-purchase differentials and operating availability. The longer-duration implication is that existing conversion assets may retain scarcity value after the initial geopolitical premium fades. The principal limitation is demand destruction or faster restoration of competing supply. A ceasefire headline alone is not sufficient evidence that refining earnings must normalize immediately, but current cracks should not be capitalized as permanent.
CALIFORNIA’S IMPORT DEPENDENCE BENEFITS SURVIVING REFINERIES, NOT EVERY COMPANY WITH A HISTORICAL WEST COAST FOOTPRINT (READ-THROUGH 2)
Affected companies: Marathon Petroleum (MPC: United States) and Chevron (CVX: United States). Direction: positive. Magnitude: potentially high at the relevant California assets, meaningful for Marathon’s refining business, and smaller at Chevron’s consolidated level because of its much larger upstream and international operations.
PBF stated that California imports approximately 250,000 barrels per day of gasoline, equivalent to approximately 30% of demand. Lucey added that freight conditions raise the cost of delivering imports into product-short coastal markets. Paul Davis described West Coast demand as resilient despite volatile prices. Together, these observations support a regional pricing mechanism in which the marginal imported barrel can set an elevated clearing price for locally produced fuel.
Marathon’s Los Angeles refinery processes California heavy crude and other domestic and imported grades and produces California-specification gasoline and diesel. Chevron operates the Richmond and El Segundo refineries. These are direct asset exposures to the market described by PBF. Higher delivered import costs can support local product prices without increasing every component of an incumbent refinery’s costs by the same amount. Local crude access and integrated distribution infrastructure can strengthen that advantage.
The ownership distinction is essential. Valero Energy (VLO: United States) completed the idling of Benicia in April 2026 and expects to meet Northern California contractual obligations through imports or alternative supply arrangements. Benicia should therefore not be counted as an operating refinery benefiting from current scarcity. Import-sourcing obligations also do not confer the same economic exposure as ownership of active conversion capacity. This is an asset-level distinction, not a conclusion that Valero’s broader refining portfolio is disadvantaged.
The near-term catalysts are California gasoline and distillate differentials, refinery reliability and import freight costs. The longer-duration positive is the scarcity of operating, permitted refining capacity in a market that still requires substantial transportation-fuel supply. However, PBF’s restored operations themselves add competing supply, and elevated prices can encourage imports and demand adjustment. Management’s constructive comments about California policymakers do not establish regulatory immunity or justify eliminating the political discount applied to these assets.
UPSTREAM OIL PRODUCTION
WIDER HEAVY-CRUDE DISCOUNTS TRANSFER VALUE FROM PRODUCERS TO COMPLEX REFINERS (READ-THROUGH 3)
Affected company: Baytex Energy (BTE: Canada). Direction: negative for heavy-oil realizations and operating cash flow, holding benchmark oil prices constant. Magnitude: potentially material because heavy oil is a substantial component of the company’s production.
Thomas O’Connor provided the clearest transmission mechanism: “The Latin American heavies are really driving the discounts that everybody is seeing and talking about.” He added that freight was driving South American export valuations lower and that “the Canadian markets are following that.” This is a specific warning that stronger refining profitability need not imply uniformly stronger upstream profitability.
The mechanism is competition among substitutable heavy barrels. If expensive ocean transportation depresses the export value of Latin American heavy crude, competing Canadian grades can reprice to maintain refinery demand. The producer receives a lower realized price relative to WTI or Brent, while a suitably configured refinery acquires a cheaper input. Consequently, heavy-oil cash-flow estimates based primarily on benchmark oil prices can overstate the benefit of a strong crude market if widening differentials are not modeled separately.
Baytex’s heavy-oil operating areas produced approximately 44,700 barrels of oil equivalent per day in 2025, with oil representing 96%. Using the resulting approximately 42,900 barrels per day solely as an illustrative exposure base, an additional $1 per barrel discount would reduce annual gross realizations by approximately US$15.7 million. A $5 widening would represent approximately US$78 million. These are mechanical sensitivities before royalties, taxes, hedges, foreign-exchange effects, transportation arrangements and changes in production. They are not forecasts of Baytex’s adjusted funds flow.
The near-term catalysts are realized heavy-oil differentials and company price realizations in Q4 and early 2027, rather than WTI alone. The longer-duration implication is conditional: increasing heavy-crude supply can support a sustained competitive advantage for conversion capacity, but the freight-driven component of the discount can reverse when shipping conditions normalize. The high-conviction conclusion is adverse differential exposure, not necessarily falling absolute earnings if benchmark oil prices rise sufficiently.
TRANSPORTATION AND LOGISTICS
AIRLINE FUEL RELIEF CAN LAG A DECLINE IN CRUDE; DELTA HAS A PARTIAL PHYSICAL OFFSET (READ-THROUGH 4)
Affected companies: United Airlines Holdings (UAL: United States) and Delta Air Lines (DAL: United States). Direction: negative for airline fuel costs relative to a rapid-normalization assumption; comparatively less negative for Delta when the shock is concentrated in refining margins. Magnitude: high, because relatively small changes in delivered jet-fuel prices can materially affect annual pretax earnings.
The supporting call commentary is that product-market stabilization will lag crude normalization, together with management’s description of persistent product shortages. The relevant variable for an airline is delivered jet-fuel cost, not the crude benchmark in isolation. Jet fuel incorporates crude cost, the refining margin, transportation and local supply conditions. A decline in crude can therefore produce less fuel-cost relief than a model assumes if jet-fuel cracks remain elevated.
United’s 2025 annual report disclosed a strategy of not financially hedging expected fuel consumption and estimated that a $1 per barrel change in aircraft-fuel prices would change projected 2026 fuel expense by approximately $116 million. On that disclosed consumption basis, a sustained $0.10 per gallon difference equates to approximately $487 million of annual fuel expense. Delta disclosed an approximately $40 million annual sensitivity for each $0.01 per gallon, equivalent to approximately $400 million for $0.10. These are cost sensitivities, not net earnings forecasts: capacity changes, passenger demand, fares and other operating responses can offset part of the effect.
Delta’s ownership of Monroe Energy creates an important competitive distinction. Its Trainer refinery provides a physical exposure to refining margins that can offset part of the higher fuel bill. PBF’s exceptionally strong New York Harbor environment is therefore adverse to Delta as a jet-fuel buyer but potentially favorable to its refinery. United does not have an equivalent refinery ownership offset. That makes Delta comparatively better positioned for a refining-margin shock, although the hedge is incomplete because refinery yields, geographic exposure and operating availability do not match the airline’s entire fuel requirement.
The near-term catalysts are delivered jet-fuel prices and revisions to airline fuel-cost assumptions for Q4 and 2027. The longer-duration implication is greater strategic value for reliable physical fuel supply and partial refining exposure if product scarcity persists. The strongest conclusion is not that Delta benefits overall from expensive fuel, but that a crude-only framework understates United’s exposure and misses an important offset within Delta.
HIGH FREIGHT RATES SUPPORT SPOT-EXPOSED PRODUCT TANKERS, BUT DO NOT AUTOMATICALLY SIGNAL HIGHER CARGO VOLUMES (READ-THROUGH 5)
Affected company: Scorpio Tankers (STNG: Monaco). Direction: positive. Magnitude: high for near-term operating cash flow because spot and pool earnings can change sharply against a comparatively stable vessel cost base.
PBF described a “dramatic increase in freight rates” and a “freight firestorm,” while noting that approximately 50% of its fleet was on time charter. The important cross-company implication is that the transportation cost burden faced by refiners and crude suppliers can become income for vessel owners with available market exposure. PBF’s charter coverage also demonstrates why the benefit depends on contract structure rather than simply the number of vessels owned.
The product-tanker application is supported by Scorpio’s own October 28 disclosure, rather than inferred solely from PBF’s generic freight commentary. Scorpio reported Q4 LR2 pool and spot bookings of approximately $181,000 per day on 44% coverage and MR bookings of approximately $56,000 per day on 47% coverage. These were partial-quarter bookings, not full-quarter fleet averages. The same disclosure showed materially lower rates on vessels committed to fixed time charters, illustrating the large difference between open-market exposure and contracted revenue.
The transmission mechanism is higher net time-charter-equivalent revenue on exposed vessel days. Disrupted supply patterns, longer replacement routes and constrained vessel availability can increase transportation pricing even when global product supply is tight. However, physical refinery outages can also reduce cargo availability. The bullish conclusion concerns observed freight earnings, not an unsupported assumption that every disruption increases seaborne volumes.
The near-term catalysts are subsequent fixtures, changes in booked coverage and Q4 cash realization. PBF’s commentary corroborates a market condition Scorpio had already disclosed, so it is confirmation rather than a newly discovered catalyst. Longer-duration valuation should remain conservative because route normalization and vessel-supply changes can reverse extraordinary rates. The $181,000 LR2 figure should not be applied to the entire fleet or treated as a sustainable annual rate. No PBF-Scorpio charter relationship was identified; this is a market-pricing read-through, not a confirmed customer contract.
RENEWABLE FUELS
STRONGER US RENEWABLE-DIESEL ECONOMICS FAVOR DARLING, BUT FEEDSTOCK AND CREDIT BENEFITS MUST NOT BE DOUBLE COUNTED (READ-THROUGH 6)
Affected companies: Darling Ingredients (DAR: United States) and Valero Energy (VLO: United States). Direction: positive. Magnitude: high for the renewable-fuel business and more significant to Darling’s consolidated investment case than to Valero’s much larger conventional-refining portfolio.
PBF reported approximately $62 million of SBR equity income and approximately $72 million of attributable EBITDA, with production near the upper end of guidance. Joe Marino cited “strong margins and higher credit prices,” favorable feedstock-versus-distillate economics and greater use of lower-carbon-intensity feedstocks. These observations indicate that the renewable-fuel improvement was not exclusively an operational recovery at PBF’s asset; common market inputs were also supportive.
Darling and Valero each own 50% of Diamond Green Diesel. The transmission mechanism is improved renewable-fuel selling economics and credit realization relative to feedstock and conversion costs. Darling’s feedstock sourcing platform is also relevant to access and optimization, although ownership of that platform does not eliminate competition for attractive inputs.
The magnitude is demonstrable without transferring SBR’s margin directly to another plant. Darling’s October 22 disclosure reported 314.9 million gallons of Q3 DGD shipments and standalone DGD adjusted EBITDA of $1.30 per gallon. At that quarterly sales volume, each additional $0.10 per gallon of DGD margin would represent approximately $31.5 million of venture-level EBITDA, or approximately $15.7 million attributable to Darling’s 50% interest, before parent-level adjustments. This is an illustrative sensitivity, not an incremental earnings forecast.
The principal near-term catalysts are Q4 margin realization, sales timing and distributions from the venture. Darling had already indicated that certain Q3 commercial timing effects should benefit Q4, making PBF’s commentary supportive corroboration rather than an independent guarantee of an earnings beat.
The longer-duration positive is the value of operating, feedstock-flexible US renewable-fuel capacity. The main qualification is that high credit prices can be competed away through higher prices for low-carbon feedstocks. Higher waste-fat values and higher conversion margins should not both be assumed to accrue without offset across the same production chain. Policy changes, feedstock eligibility and credit monetization remain material. The call supports stronger current economics, not a permanent margin floor or an equivalent benefit for every global renewable-diesel producer.
ENI HAS A DIRECT SBR BENEFIT, BUT ITS ATTRIBUTABLE ECONOMIC EXPOSURE IS BELOW THE HEADLINE 50% JV STAKE (READ-THROUGH 7)
Affected company: Eni (ENI: Italy). Direction: positive. Magnitude: meaningful for the SBR asset and supportive for Enilive, but small at Eni’s consolidated level. This is a direct ownership read-through rather than a peer analogy.
PBF reported approximately $72 million of SBR EBITDA attributable to its investment and disclosed receipt of an approximately $20 million distribution during Q3. Production averaged approximately 19,200 barrels per day, with Q4 guidance of 18,000-20,000. The relevant signal is that the asset is operating at a high rate, generating meaningful earnings and beginning to distribute cash.
Enilive owns the other 50% of SBR. However, Eni retains 70% of Enilive following the sale of a 30% interest to a KKR-managed investment structure. The simple ownership-weighted economic interest attributable to Eni shareholders is therefore approximately 35% of SBR, not 50%. Consolidated presentation and minority-interest allocation must be distinguished from that underlying economic exposure.
The transmission mechanism is improved SBR earnings and distributable cash flowing into Enilive, with Eni shareholders participating after the minority interest. PBF’s $72 million attributable EBITDA is not automatically an identical contribution to Eni’s reported results because accounting, financing and consolidation conventions can differ. Similarly, PBF’s $20 million receipt does not establish that Eni received the same amount or that distributions will recur at that quarterly rate.
The near-term catalyst is continued operating performance and evidence of sustained cash distributions. The longer-duration positive is validation that the US biorefining investment can contribute cash rather than remain primarily a capital-consumption story. The important limitation is scale: this result is supportive evidence for Enilive’s asset economics, not sufficient by itself to drive a material reassessment of Eni’s group earnings or valuation.
Report record
- Sector
- Energy
- Industry
- Oil, Gas & Consumable Fuels
- Fiscal period end
- September 30, 2026
- Report date
- October 29, 2026
- Analysis
- 6901 words
- Read-throughs
- 2589 words
- Content fingerprint (PDF)
784cd4dfbd05- Content fingerprint (analysis)
7ae0428f9238- Content fingerprint (read-throughs)
889adefd85d2
Prepared from the company's earnings release and earnings call transcript. Figures as reported by the company. For information only. Not investment advice.
More from PBF Energy Inc.
No other reports yet.
More in Energy
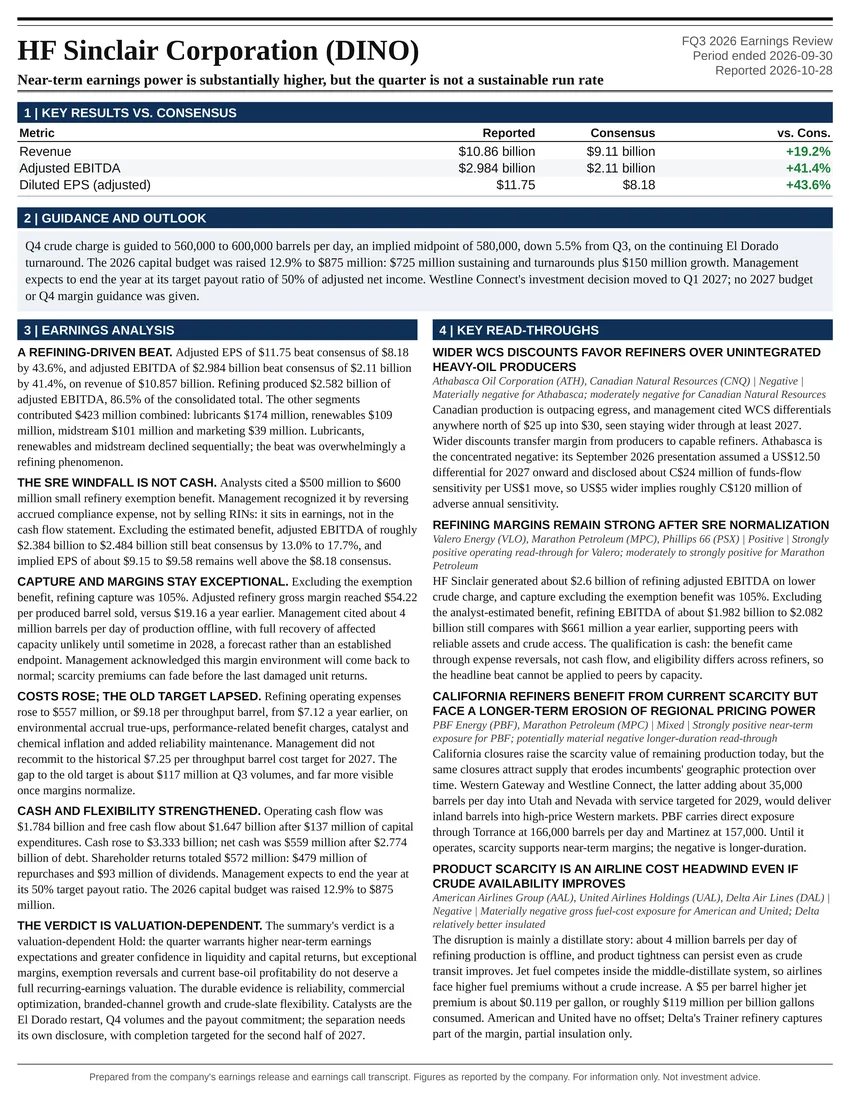
Near-term earnings power is substantially higher, but the quarter is not a sustainable run rate
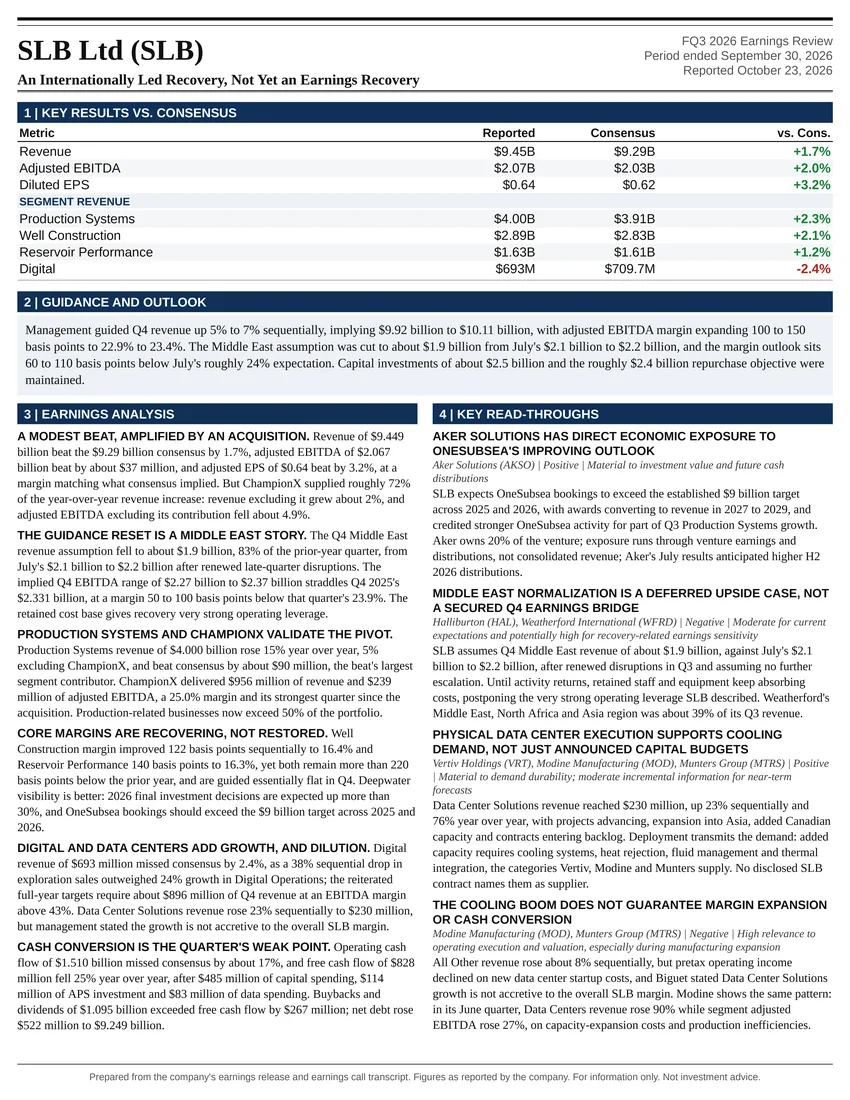
An Internationally Led Recovery, Not Yet an Earnings Recovery
Follow @AtlasPeakRes on X for new earnings reports as they publish.