
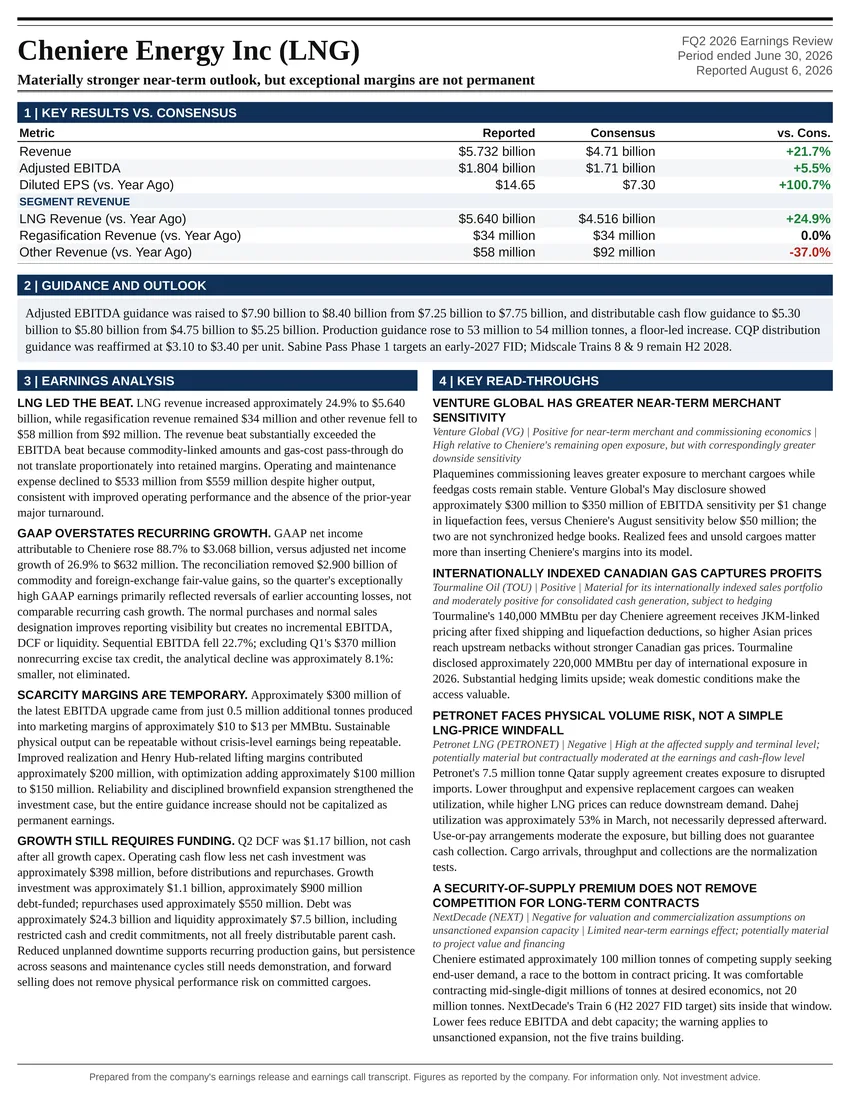
Materially stronger near-term outlook, but exceptional margins are not permanent
Earnings Reports
Cheniere Energy Inc FQ3 2026 Earnings Report
Cheniere Energy Inc (LNG) FQ3 2026 earnings: Scarcity margins converted into contracted visibility; 2026 guidance raised $850 million at the midpoint. Full earnings analysis, key read-throughs, and the one-page exhibit from Atlas Peak Research.
Cheniere Energy Inc (LNG)
Sector: Energy · FQ3 2026 · Period end September 30, 2026 · Reported October 29, 2026
Cheniere’s Q3 2026 earnings call materially strengthened the near-term cash-generation outlook and the commercial foundation for its next expansion cycle.
Download the one-page report (PDF)
View one-page exhibit
Download analysis (.md)
Download read-throughs (.md)
Post to X
One-Page Exhibit
Earnings Analysis
EXECUTIVE CALL SUMMARY: CHENIERE ENERGY, INC. (10/29/26)
Cheniere’s Q3 2026 earnings call materially strengthened the near-term cash-generation outlook and the commercial foundation for its next expansion cycle. The most consequential developments were the $850 million increase in 2026 adjusted EBITDA guidance, confirmation that approximately 4 million tonnes of 2027 marketing volumes have been sold or hedged at approximately $10/MMBtu, completion of Corpus Christi Stage 3, and approximately 4.8 million tonnes per annum of new long-term contracts with QatarEnergy and Petrobras. The investment conclusion is constructive, with existing exposure supported by improving cash-flow visibility and disciplined brownfield growth. Incremental purchases should nevertheless be justified by normalized cash generation rather than capitalization of current scarcity margins as permanent earnings.
The quarter demonstrated that Cheniere is converting an exceptional commodity environment into more durable shareholder value through forward sales, long-duration contracts, infrastructure investment, and share repurchases. That conversion is more important than exposure to further increases in spot LNG prices. Approximately 98% of expected 2027 production at the midpoint is already covered by long-term contracts or forward marketing transactions. Consequently, the company is substantially less sensitive to incremental commodity-price movements than the geopolitical backdrop might suggest, while remaining exposed to operational delivery, counterparty, logistics, and capital-execution risks.
The principal qualification is that stronger underlying operations do not make every component of 2026 earnings recurring. Approximately $250 million of the latest guidance increase reflects cargo recognition moving from early 2027 into late 2026. Expected optimization earnings exceed their recent historical level. Separately, the Q3 Form 10-Q identifies a $370 million nonrecurring excise-tax credit recognized in Q1 2026 that reduced cost of sales and remains relevant when comparing annual adjusted EBITDA. These items should be separated from the sustainable contribution of additional liquefaction capacity and contracted fees.
Management’s confidence in 2027 is credible but remains qualitative. CFO Zach Davis stated, “Next year is going to be not too far off from what we are achieving right now in 2026.” Formal 2027 financial guidance will not be provided until February. The appropriate interpretation is that contracted production growth and locked-in marketing margins support another strong year, not that management has formally committed to repeating the $9 billion 2026 EBITDA midpoint.
QUARTERLY RESULTS AND THE QUALITY OF THE REVENUE BEAT
Cheniere’s October 29 earnings release reported Q3 revenue of $6.173 billion, up 39.0% from $4.441 billion. Against the supplied Bloomberg consensus of $4.96 billion, revenue exceeded expectations by approximately $1.213 billion, or 24.5%. LNG revenue was $6.099 billion, up 41.8% from $4.302 billion and approximately 34.6% above the $4.53 billion estimate. Regasification revenue was unchanged at $34 million and matched consensus. Other revenue fell to $40 million from $105 million and was below the $98.6 million estimate.
The revenue surprise should not be interpreted as an equivalent improvement in economic profitability. LNG revenue contains substantial commodity-price pass-through, and the company’s economic exposure differs materially across long-term contracts, marketing cargoes, and integrated production marketing arrangements. The Form 10-Q reports that variable consideration represented 73% of the relevant LNG contract revenue in Q3, compared with 64% a year earlier. Higher commodity prices can therefore expand reported revenue much faster than retained liquefaction margins.
The revenue categories in the Bloomberg notice also require a consistency qualification. Their consensus estimates sum to approximately $4.663 billion, below the $4.96 billion consolidated estimate. Different contributor populations or estimate coverage may explain that discrepancy, but the component estimates cannot be treated as a fully reconciled consensus model. The consolidated revenue beat is clear. A comparable EBITDA, distributable cash flow, or EPS consensus was not supplied, so the revenue beat does not establish an across-the-board earnings beat.
Adjusted EBITDA increased 18.2% to $1.900 billion from $1.608 billion and rose 5.3% from $1.804 billion in Q2. EBITDA growth was substantial but well below revenue growth, reducing the reported EBITDA-to-revenue ratio to approximately 30.8% from 36.2%. That decline is not, by itself, evidence of deteriorating liquefaction economics because commodity pass-through, derivatives, and sales mix affect the revenue denominator. It does, however, demonstrate why revenue growth is an inferior valuation anchor to contracted cash flow and realized marketing margins.
Net income attributable to Cheniere increased 11.5% to $1.170 billion, while diluted EPS increased 18.9% to $5.65 from $4.75. Weighted-average diluted shares declined 5.9% to 206.9 million from 219.9 million, explaining a meaningful portion of the difference between profit growth and EPS growth. Share repurchases are already materially enhancing per-share results rather than representing only a future capital-allocation opportunity.
The operating cost base expanded with the additional trains. Operating and maintenance expense increased to $540 million from $447 million, depreciation and amortization increased to $393 million from $338 million, and interest expense net of capitalized interest increased to $285 million from $236 million. These increases qualify the capacity-growth thesis: additional production carries operating costs, depreciation, and financing expenses, and the end of construction-period interest capitalization can restrain the conversion of incremental EBITDA into equity cash flow.
GAAP EARNINGS, TAXES, AND CASH-FLOW COMPARABILITY
GAAP earnings remain an imperfect representation of underlying operating performance. The company’s adjusted-net-income reconciliation removes $432 million of noncash commodity and foreign-exchange derivative gains and $26 million of deferred accounting amortization benefits from Q3 earnings, with associated tax and minority-interest adjustments. Adjusted net income was $750 million, compared with $591 million a year earlier, an increase of 26.9%. This supports the conclusion that underlying profitability improved even though GAAP earnings contain material noncash effects.
Tax expense also helped reported earnings. The effective tax rate declined to 10.2% from 18.9%, and the tax provision fell to $168 million from $303 million despite higher pretax income. The Form 10-Q attributes the lower rate primarily to changes in the proportion of income attributable to Cheniere Energy Partners, part of which is not taxable to Cheniere, and an increased Foreign Derived Deduction Eligible Income deduction. The tax benefit is economically relevant, but the rate depends on income composition and should not automatically become a permanent modeling assumption.
An accounting change further complicates comparisons across 2026. In June, Cheniere designated approximately 73% of fixed minimum contractual IPM volumes for the normal purchases and normal sales exception. Those agreements are no longer remeasured at fair value through earnings each period. Their designation-date balances are instead amortized as deliveries occur. The remaining approximately 27% were excluded from that designation. Lower subsequent earnings volatility therefore reflects an accounting change as well as market movements; it does not establish a corresponding reduction in underlying contractual exposure.
Reported distributable cash flow declined approximately 23.6% to $1.23 billion from $1.61 billion in Q3 2025, despite the increase in EBITDA. The explanation is primarily tax comparability, not an operating reversal. The prior-year DCF reconciliation included approximately $490 million of positive current-tax contribution, reflecting revised corporate alternative minimum tax treatment, while Q3 2026 included approximately $100 million of current-tax expense. That approximately $590 million adverse swing more than offset the $292 million EBITDA increase. Higher cash interest and other deductions explain most of the remaining difference.
The historical comparison is therefore materially stronger than the headline DCF decline suggests. Removing the current-tax contribution from both periods produces an illustrative pre-current-tax DCF comparison of approximately $1.33 billion against $1.12 billion, or approximately 19% growth, using rounded disclosures. This is not a replacement for reported DCF, but it illustrates the extent to which the apparent decline reflects an unusually favorable prior-year tax comparison.
For the 9 months, operating cash flow increased 47.1% to $5.124 billion from $3.484 billion. Cash expenditure on property, plant, and equipment, net of commissioning LNG proceeds, was $2.648 billion against $2.334 billion. Operating cash flow less that expenditure was therefore approximately $2.476 billion, compared with $1.150 billion. This consolidated cash measure is substantially below reported DCF because it deducts growth investment, and it remains before distributions to minority interests and other financing uses.
Importantly, the Form 10-Q attributes the operating-cash-flow increase primarily to favorable changes in payment and collection timing, with higher LNG receipts also contributing. The 47% increase should not be extrapolated as a recurring operating growth rate. Working-capital timing, derivative settlements, commissioning proceeds, and ownership distributions all affect the relationship between reported EBITDA, DCF, and cash ultimately available to common shareholders.
The $370 million excise-tax credit recognized in Q1 is another important normalization item. Excluding that credit alone would reduce 9-month adjusted EBITDA from $6.037 billion to approximately $5.667 billion, implying growth of approximately 15.7% rather than 23.3%. Applied to the annual guidance midpoint, the same isolated adjustment would reduce $9.0 billion to $8.63 billion. These are analytical adjustments, not company guidance, and they do not remove cargo timing or above-normal optimization benefits.
OPERATING PERFORMANCE AND THE VALUE OF RELIABILITY
Cheniere exported a record 188 cargoes containing 684 TBtu, compared with 163 cargoes and 586 TBtu in Q3 2025. Cargo count increased approximately 15%, while exported energy increased approximately 17%. The difference matters because cargo sizes vary; cargo count alone is not a sufficiently precise production metric.
The quarter’s 697 TBtu recognized in operating income consisted of 693 TBtu from Cheniere’s operating liquefaction facilities and 4 TBtu sourced from third parties. This measure is not identical to exported or loaded volumes because delivered cargoes can remain in transit at period-end and commissioning cargoes receive different accounting treatment. Approximately 61 TBtu of exported LNG sold on a delivered basis remained in transit at September 30.
Management explained that Q3 benefited from volumes in transit at the end of Q2, but the financial benefit was offset by higher-margin cargoes remaining in transit at the end of Q3. The implication is that recognition timing depends on the margin attached to each cargo, not simply the net change in physical volume. A smaller deferred volume at a materially higher margin can offset recognition of a larger volume sold at lower margins.
The completion of Corpus Christi Stage 3 is the most important structural operating milestone. The final midscale train produced its initial LNG shortly after the August call and achieved substantial completion in late August, only a few weeks later. Completion ahead of schedule and within budget supports management’s execution credibility and enables a full-year contribution in 2027.
The daily production record above 8.33 TBtu is evidence of strong technical capability, but it is not an annual production forecast. Sustained annual output remains subject to maintenance, ambient conditions, feed-gas availability, equipment reliability, and loading logistics. The explicit 56 million-58 million tonne forecast for 2027 is the appropriate modeling anchor.
Reliability has unusually high marginal economic value in the current market. Davis observed that “one cargo sold at spot prices today could contribute almost $100 million in EBITDA.” That is an upper-end current-market illustration, not an average contribution across the contracted cargo portfolio. Nevertheless, it explains why small improvements in uptime, completion dates, and winter production can have disproportionate financial consequences.
The operational advantage also extends to feed-gas procurement. Management described sourcing across 5 basins and Canada and emphasized experience managing differing gas specifications. This supports Cheniere’s claim to operational flexibility. It does not establish that competing projects will experience delays or failures, and management explicitly declined to assess competitors’ technical configurations in detail.
THE 2026 GUIDANCE INCREASE AND ITS COMPONENTS
Full-year adjusted EBITDA guidance increased to $8.75 billion-$9.25 billion from $7.90 billion-$8.40 billion. The midpoint increased $850 million, or 10.4%, to $9.0 billion. DCF guidance increased to $6.05 billion-$6.55 billion from $5.30 billion-$5.80 billion, a $750 million, or 13.5%, midpoint increase to $6.30 billion.
The progression across the year has been substantial. February guidance was $6.75 billion-$7.25 billion of EBITDA and $4.35 billion-$4.85 billion of DCF. May guidance increased to $7.25 billion-$7.75 billion and $4.75 billion-$5.25 billion, respectively, before the August increase. Relative to February, the latest EBITDA midpoint is higher by $2.0 billion, or 28.6%, and DCF is higher by $1.70 billion, or 37.0%.
Production guidance remains 53 million-54 million tonnes, unchanged from August. The latest financial increase is therefore predominantly a margin, optimization, and recognition-timing revision rather than an increase in the formal production range. Earlier completion of Stage 3 contributed additional production within that unchanged range.
Management provided an unusually useful, although approximate, bridge. Approximately 0.5 million tonnes remained open at the prior call. An approximately $10/MMBtu increase in margin on that volume contributed about $250 million. Approximately 3 cargoes moving from early January recognition into late December contributed another $250 million. Additional optimization contributed approximately $150 million, and earlier completion of the final Stage 3 train contributed approximately $100 million.
Those components sum to approximately $750 million, leaving approximately $100 million of the $850 million increase unallocated by the rounded verbal bridge. The difference should not be assigned to an invented operating driver. The accompanying presentation also identifies higher lifting margins associated with higher Henry Hub prices among the positive factors, but it does not quantify their contribution.
The cargo-timing component deserves particular attention. Pulling approximately $250 million of earnings from early 2027 into late 2026 improves the current-year result but does not automatically increase combined earnings across the 2 years. Management linked some of the acceleration to Europe attracting more cargoes, which can shorten delivery voyages relative to Asia. Better routing economics may add value, but the disclosed recognition benefit should not be counted again in 2027.
Optimization is more durable than a purely exceptional windfall but less predictable than contracted liquefaction fees. Management expects more than $700 million in 2026, compared with approximately $500 million annually in recent years. The latest $150 million increase was split approximately equally between upstream and downstream activities. That breadth indicates capabilities beyond directional LNG-price exposure, including procurement, routing, contractual flexibility, and commercial execution.
Davis stated, “We usually don’t guide to that, and I probably won’t guide to much of that in early February.” Initial 2027 guidance may therefore omit a meaningful contribution that has historically recurred. The disciplined approach is to distinguish conservative company guidance from an analyst’s probability-weighted expectation, while avoiding automatic extrapolation of the exceptionally favorable 2026 optimization environment.
The full-year outlook implies a major Q4 acceleration. Subtracting 9-month EBITDA of $6.037 billion gives an implied Q4 range of approximately $2.713 billion-$3.213 billion, with a $2.963 billion midpoint. That midpoint is approximately 56% above Q3. The corresponding implied Q4 DCF range is approximately $1.98 billion-$2.48 billion, with a $2.23 billion midpoint.
These are derived quarterly requirements, not separately issued quarterly guidance. They are supported by winter production above 14 million tonnes, higher realized margins, and recognition of high-margin delivered cargoes. Production growth alone does not explain the earnings acceleration. Delivery timing and margin realization are essential to achieving the annual range.
Maintaining a $500 million guidance range despite very little remaining unsold volume is therefore reasonable. At exceptionally high cargo margins, a small number of delayed deliveries or modest production variations can move EBITDA materially without invalidating the broader production outlook.
THE 2027 OUTLOOK: MORE VOLUME, LESS OPEN COMMODITY EXPOSURE
Management expects 2027 production of 56 million-58 million tonnes, compared with 53 million-54 million tonnes in 2026. The midpoint increase is 3.5 million tonnes, or approximately 6.5%. The forecast includes planned maintenance and benefits from a full year of Stage 3, debottlenecking, and the absence of long-duration major turnarounds.
Approximately 52 million tonnes are expected to be sold under long-term contracts, up from 46 million-47 million tonnes in 2026. Contracted volume therefore grows faster than total production. At the 2027 production midpoint, long-term contracts cover approximately 91.2% of output.
Approximately 5 million tonnes remain allocated to marketing sales, of which approximately 4 million tonnes have already been sold or hedged. Long-term contracts plus forward marketing transactions consequently cover approximately 98.2% of midpoint production. Only approximately 1 million tonnes, equivalent to approximately 50 TBtu, remains open to market pricing.
The most important new earnings disclosure came in response to Citi’s question about forward margins. Davis explained that approximately 1.5 million tonnes had been sold by August at prices “well under $10,” followed by another approximately 2.5 million tonnes sold “well over $10.” For the combined 4 million tonnes, he concluded that it was “safe to say that’s locked in around $10.”
Using management’s approximately 50 MMBtu per tonne conversion, that represents approximately $2 billion of implied marketing margin on the forward-sold volumes. This is not incremental revenue, not an additional $2 billion beyond guidance, and not all attributable directly to common shareholders. It is nevertheless a substantial foundation for 2027 earnings.
Citi’s question suggested that market expectations might have embedded approximately $6/MMBtu on those forward-sold volumes. If that characterization accurately represents a particular model, moving from $6 to $10 across approximately 200 million MMBtu would increase estimated EBITDA by approximately $800 million before other model changes. That is a conditional estimate-revision opportunity, not an independently verified consensus gap.
Residual price sensitivity is much smaller than the commercial headline might imply. Management estimates that each $1/MMBtu change in market margin affects 2027 EBITDA by approximately $50 million. A $10 change would therefore move EBITDA by approximately $500 million on the currently open volume, assuming production and hedge coverage remain unchanged.
The distinction between price risk and volume risk is critical. Hedging approximately 98% of expected output substantially reduces commodity exposure, but it does not eliminate the consequences of an outage. Lost production may forfeit high-margin discretionary sales or require replacement purchases to meet commitments. Illustratively, 1 million tonnes at a $20/MMBtu marginal marketing margin represents approximately $1 billion of margin exposure. The actual impact would depend on contract allocation, replacement costs, operating savings, and timing.
The changing sales mix is another qualification. More volume will earn stable contracted fees rather than exceptional spot margins. The increase in contracted output should not be valued as though every additional tonne captures prevailing international netbacks. Similarly, management’s reference to almost 5 million tonnes of additional earnings-contributing capacity includes the effect of commissioning and timing volumes that did not enter 2026 operating earnings; it is not a separate increase beyond the physical production forecast.
The decision to fix margins prioritizes certainty over maximum participation in a further price spike. Davis summarized the policy directly: “When margins double like this, we’re not cute about it. We proactively sell it, lock in the fixed fees, and increase the cash flow visibility.” That policy is attractive for funding commitments and capital returns, although it also limits incremental upside from a still tighter LNG market.
GLOBAL LNG CONDITIONS AND THE DURATION OF THE WINDFALL
Management’s market assessment remains strongly supportive of near-term LNG margins. TTF and JKM averaged more than $21/MMBtu and $22/MMBtu, respectively, during Q3. Calendar 2027 forward prices increased more than $10/MMBtu since the August call. However, these are international benchmark prices, not Cheniere’s realized margins after feed gas, liquefaction, freight, and contract economics.
The supply discussion indicates that the market is managing a substantial physical disruption rather than merely a financial risk premium. Management reported that LNG tanker transits through the Strait of Hormuz briefly recovered to approximately 50% of pre-war peak levels before weakening again. In its cited supply balance, 23 million tonnes of additional U.S. and Canadian supply and 14 million tonnes elsewhere were insufficient to offset approximately 41 million tonnes of lost Strait-constrained supply.
Europe’s winter position provides a credible source of continuing demand for Atlantic cargoes. Management reported storage at approximately 72% at the beginning of October, its lowest level for that date since 2011. Its winter balance requires approximately 93 billion cubic meters, or 69 million tonnes, of LNG to preserve an end-winter storage buffer of approximately 28%. That is approximately 7% more LNG than the prior winter, equivalent to approximately 64 additional cargoes.
The central European constraint is increasingly access to molecules rather than aggregate regasification capacity. Approximately 73 million tonnes per annum of additional regasification capacity has been installed since 2022, improving import flexibility. That infrastructure allows Europe to compete more effectively for supply but does not create additional global LNG production. Regional pipeline and storage constraints can also produce local stress despite adequate aggregate receiving capacity.
Weather remains a major source of uncertainty. Management cited an approximately 25 billion cubic meter difference between warm and cold winter demand. Against approximately 104 billion cubic meters of storage capacity, the full warm-to-cold swing represents approximately 24 percentage points of storage capacity, consistent with roughly 10-15 percentage points of variation around a central outcome. A mild winter could reduce immediate scarcity; a cold winter could increase both spot prices and the following summer’s refill requirement.
Emerging Asian demand has been more resilient than a simple high-price narrative would imply. Southeast Asian imports increased approximately 25% year to date, while India increased 21% year to date and 9% in Q3. Nevertheless, aggregate regional data should not be interpreted as proof that end users can indefinitely absorb spot prices above $30/MMBtu. Long-term contracts, domestic pricing arrangements, and differences in buyer exposure can insulate consumption from spot-market conditions.
China remains the clearest source of demand flexibility. Management expects approximately 60 million tonnes of imports in 2026, compared with an approximately 83 million tonne historical peak cited on the call. Its view that imports could eventually reach 130 million-140 million tonnes implies more than doubling from the current level. That is a long-term demand scenario, not a dated forecast supported by current pricing.
China’s flexibility also demonstrates why lower imports do not necessarily imply lost liquefaction sales. A buyer with low-cost U.S. contractual supply may redirect cargoes to Europe rather than import them domestically. Cheniere can still collect contracted fees while the destination changes. Conversely, expanded regasification capacity alone does not guarantee future Chinese consumption; competing fuels, domestic gas production, pipeline imports, and relative power-generation economics remain relevant.
The medium-term supply cycle is the primary challenge to extrapolating present margins. Management cited 77 million tonnes per annum of capacity reaching final investment decision in 2025 and another 52 million tonnes in 2026 to date. These are project commitments, not immediate annual supply additions. Nevertheless, the company’s own outlook shows supply growth resuming from 2028 even if constrained Hormuz volumes remain unavailable. Recovery of those volumes would add further supply.
The appropriate conclusion is that near-term scarcity can coexist with a less favorable medium-term merchant margin environment. Cheniere’s long-term contracts and forward sales reduce that exposure, but future uncontracted earnings and the valuation assigned to them remain cyclical.
QATARENERGY, PETROBRAS, AND THE QUALITY OF COMMERCIAL GROWTH
The QatarEnergy agreements are strategically significant because they demonstrate the value of geographic supply diversification to a major incumbent producer. QatarEnergy is purchasing 2 million tonnes per annum from Sabine Pass and 2 million tonnes from Corpus Christi, with deliveries beginning in the early 2030s and extending through 2054. The contracts are FOB and priced against Henry Hub plus a fixed fee. Approximately 1 million tonnes of Sabine Pass volume is conditional on a positive final investment decision for the initial expansion phase.
The direct financial effect is therefore primarily long-term contracted fee visibility and support for development financing, not incremental 2027 earnings. The contracts also provide external validation of Cheniere’s reliability and its ability to support a major buyer’s supply obligations from outside the Strait of Hormuz.
Management’s statement that QatarEnergy was never viewed as a competitor should be interpreted as commercial diplomacy rather than an economic conclusion. QatarEnergy remains a competing global supplier while becoming a Cheniere customer. The industry can contain both relationships simultaneously. A more diversified QatarEnergy trading portfolio may support demand for U.S. supply while remaining highly competitive in sales to end users.
The agreements should not be treated as evidence of 4 million tonnes of newly created global consumption. They may support replacement supply, geographic diversification, trading activity, or existing customer commitments. Their strongest investment implication is the durability of contracted U.S. liquefaction demand under changing trade patterns.
The Petrobras agreement adds approximately 0.8 million tonnes per annum for 22 years on an FOB basis through Cheniere Marketing. The September 29 announcement did not disclose a delivery commencement date, detailed pricing formula, or specific supplying facility. Those details should not be inferred from the term or from the company’s broader expansion plans.
Together, the agreements add approximately 4.8 million tonnes per annum, appropriately rounded by management to almost 5 million tonnes. The presentation identifies more than 10 million tonnes per annum of long-term contracts available to support future growth. Management also indicated that sufficient contracts remain after supporting Sabine Pass to substantially underpin the initial Corpus Christi expansion.
The company’s commercial portfolio has more than 35 creditworthy counterparties, a weighted-average remaining life exceeding 16 years, and a weighted-average credit rating of A-. These attributes support cash-flow durability. They do not establish identical credit protection across every agreement, eliminate concentration risk, or demonstrate that each contractual obligation carries a sovereign guarantee.
Management’s approximately $18 billion of newly secured fixed margins combines different economic categories: nearly $1 billion associated with late 2026, more than $2 billion from forward marketing transactions across subsequent years, and approximately $15 billion of long-duration contractual fees. The aggregate is neither annual EBITDA nor present value. Recognizing its value requires consideration of delivery dates, operating costs, financing, taxes, ownership interests, and project conditions.
The approximately $6/MMBtu price cited for long-term Henry Hub-linked FOB cargoes versus international prices above $30/MMBtu illustrates the attractiveness of the offering to customers. Much of that differential belongs to the buyer, not Cheniere. It also compares an FOB price with international market benchmarks that can include delivery economics. The producer’s value comes from fixed fees, retained marketing exposure, and optimization, not appropriation of the entire international price spread across all contracted output.
EXPANSION ECONOMICS AND EXECUTION RISK
The growth program contains separate projects with different timelines and risk profiles. Corpus Christi Stage 3 is complete. Midscale Trains 8 and 9 remain under construction. The initial Sabine Pass expansion is approaching final investment decision. The initial Corpus Christi expansion remains in permitting and engineering development. The larger development portfolio beyond these phases is longer-dated optionality.
Midscale Trains 8 and 9 were 58.6% complete at September 30, but the completion mix matters. Engineering was 95.2% complete and procurement 84.9%, while physical construction was only 14.5% complete. The overall percentage therefore should not be interpreted as construction being nearly 60% complete or as evidence that commissioning is imminent.
The official expected substantial-completion window remains the latter half of 2028. Management was explicit: “We do not currently forecast any volume contribution in 2027 from this project.” Early delivery is potential upside, not an appropriate base-case assumption.
The initial Sabine Pass expansion is expected to add more than 6 million tonnes per annum through a new large train, boil-off gas re-liquefaction, and debottlenecking. The September final environmental impact statement is an important milestone, but it is not the final construction authorization or export approval. The presentation indicates a late-2026 or early-2027 FID window, subject to remaining conditions.
The approximately $4.7 billion lump-sum turnkey EPC contract provides meaningful cost visibility. Nearly $500 million of early engineering and procurement work also reduces equipment lead-time exposure and advances execution readiness. The trade-off is that capital is being committed before final approvals, increasing sunk-cost exposure if the development timetable slips.
Financing commitments include a $3.25 billion senior secured delayed-draw term loan. Management stated that the loan, together with previously raised excess bond proceeds, would finance approximately 50% of expected total project costs. It would therefore be incorrect to assume that doubling the term-loan amount necessarily produces the complete project budget. The financing is committed but remains subject to closing conditions, including FID.
Management reiterated its standards of approximately 7x capital expenditure to EBITDA and 10% unlevered contracted returns. A 7x capital-to-EBITDA multiple implies an approximately 14.3% EBITDA yield on capital, not a 14.3% project IRR. Construction timing, taxes, maintenance spending, contract duration, and residual value determine the relationship between those measures.
The claim of building below $1,000 per tonne also requires a consistent numerator and denominator. The EPC contract is not necessarily total installed cost, while effective capacity includes debottlenecking of existing infrastructure. The final all-in capital budget and exact capacity denominator are needed to verify the claim on a fully comparable basis.
The initial Corpus Christi expansion is less mature. Management expects the FERC permit around the middle to latter part of 2027, with additional approvals required thereafter. The presentation indicates late-2027 or early-2028 FID. The project remains in value engineering with Bechtel, and the EPC price is not yet fixed.
The brownfield advantage is credible because the initial phases avoid major new tanks, berths, and pipelines while adding debottlenecking that can improve existing trains. It should not be assumed that the same capital efficiency applies unchanged to every later expansion. Eventually, shared infrastructure can become capacity-constraining and additional investment can be required.
CAPITAL ALLOCATION, SHARE COUNT, AND BALANCE-SHEET CAPACITY
Q3 capital deployment was substantial. Cheniere repurchased approximately 2.8 million shares for $731 million, invested approximately $740 million in growth capital, paid approximately $114 million in dividends, and repaid approximately $54 million of debt. Approximately $626 million of growth investment was funded with equity cash flows, with the remainder debt-funded. That distinction reconciles the approximately $1.5 billion equity-cash deployment figure with the larger total that includes debt-financed capital spending.
The quarter’s repurchases imply an average acquisition price of approximately $261 per share, using rounded share counts. This is a historical capital-allocation reference, not a current stock price or valuation floor. Repurchases create value only if the acquired shares are worth more than the cash and alternative investment opportunities surrendered.
The period distinction is also important. The earnings release reports 7.7 million shares repurchased for approximately $1.8 billion through September. The call’s figures of more than 8 million shares and more than $2 billion include subsequent activity through the filing date. Approximately 204 million shares were outstanding as of October 23.
The quarterly dividend increased to $0.625 from $0.555, a 12.6% increase, or $2.50 annualized. At approximately 204 million shares, the annualized cash requirement is approximately $510 million, equivalent to only 8.1% of the 2026 DCF midpoint. The dividend is therefore comfortably covered, but the investment proposition remains primarily repurchase-driven per-share growth rather than current income.
Approximately $8 billion remains under the repurchase authorization. At the historical Q3 average price, that amount would retire approximately 30.6 million shares before issuance offsets, equivalent to approximately 15% of the current share count. Actual accretion will depend on execution prices, timing, stock compensation, and the availability of cash after growth and financing commitments.
Management suggested that stronger cash generation could accelerate repurchases and eventually support a larger authorization. That is plausible, but the authorization is not a funding commitment. Quarter-specific capital deployment can exceed DCF because of seasonal cash generation and existing liquidity; it should not be assumed that the latest deployment pace is indefinitely self-financing.
The balance sheet provides meaningful flexibility. Consolidated debt principal was approximately $24.138 billion, while cash and cash equivalents were $1.663 billion. Restricted cash was an additional $393 million, and available credit commitments were approximately $6.023 billion. The approximately $8.1 billion liquidity headline therefore includes restricted cash and undrawn facilities rather than freely deployable parent cash alone.
A simple debt-minus-cash calculation gives approximately $22.475 billion of net debt, or approximately 2.5x the $9 billion EBITDA midpoint. This is an analytical consolidated ratio, not a covenant or rating-agency leverage measure. Subsidiary debt structures, minority interests, restricted liquidity, and normalized earnings must be considered separately.
S&P’s upgrade of Corpus Christi Holdings to A- is a meaningful financing milestone. It supports management’s strategy of maintaining low-A to high-BBB project ratings and solidly investment-grade corporate ratings while financing growth with up to approximately 50% debt. The rating improvement reduces financing uncertainty but does not eliminate exposure to higher interest costs, construction spending, or lower merchant earnings.
VALUATION, SCENARIOS, AND INVESTMENT IMPLICATIONS
The central valuation distinction is between current cash generation and normalized cash generation after expansion. At approximately 204 million shares, 2026 DCF guidance implies approximately $29.66-$32.11 per share, with a $30.88 midpoint. Achieving that level during an exceptional LNG market does not establish $30 as a permanent floor.
The presentation’s normalized framework assumes marketing margins of approximately $2.50-$3.00/MMBtu. Including Midscale Trains 8 and 9 and debottlenecking, but excluding the initial large-train expansions at both sites, the framework shows EBITDA of $7.3 billion-$8.0 billion and DCF of $4.1 billion-$4.7 billion. Including both initial expansion phases increases those ranges to $8.6 billion-$9.4 billion and $4.9 billion-$5.6 billion.
At the current approximately 204 million shares, the latter DCF range represents approximately $24.02-$27.45 per share. Reaching $30 per share at the $5.25 billion midpoint would require approximately 175 million shares, assuming the operating and financing framework remains unchanged. That is approximately 29 million shares below the current level.
The remaining $8 billion authorization could mathematically retire 29 million shares at an average price of approximately $276, before stock issuance and other complications. This illustrates why share repurchases are integral to the long-term per-share objective. It also shows why current scarcity-period DCF above $30 per share and a future normalized $30 objective are not economically interchangeable.
The CFO’s reference to approximately $9 billion of run-rate EBITDA should be interpreted alongside the written framework, which includes both initial expansion phases. It should not be treated as a newly issued standalone forecast for Sabine Pass alone or as formal 2027 guidance. Management explicitly deferred a refreshed run-rate outlook until the next FID milestone.
Illustrative 2027 scenarios can be constructed around the disclosed marketing exposure without inventing a complete corporate forecast. In a base case assigned a 50% probability, production reaches approximately 57 million tonnes, the 4 million forward-sold tonnes realize approximately $10/MMBtu, and the remaining 1 million tonnes realize $15/MMBtu. The resulting marketing-margin calculation is approximately $2.75 billion. This is not attributable DCF and excludes the separate modeling of contracted fees, operating expenses, optimization, financing, taxes, and minority interests.
In a bull case assigned a 25% probability, the same open volume realizes approximately $25/MMBtu as supply remains disrupted and winter demand is firm. The marketing-margin calculation rises to approximately $3.25 billion, or $500 million above the base case. Stronger production and optimization could add further upside, but those effects should be modeled separately rather than implicitly added to the price sensitivity.
In a bear case assigned a 25% probability, supply recovery or mild weather reduces the open-volume margin to approximately $5/MMBtu. The marketing-margin calculation falls to approximately $2.25 billion, or $500 million below the base case. The limited difference across these price scenarios demonstrates the value of forward selling. A more severe corporate downside would require operational underperformance, contract-delivery costs, weaker optimization, higher taxes, or development setbacks in addition to lower market prices.
The probabilities are analytical judgments, not market-implied odds. Their principal message is that 2027 price exposure is now constrained, while execution risk remains economically significant. The equity should increasingly be evaluated as contracted infrastructure with a marketing and development component, rather than as an unhedged instrument for expressing a view on international gas prices.
Enterprise-value analysis must also respect ownership. Cheniere consolidates Cheniere Energy Partners despite holding a 48.6% limited-partner interest and the general-partner interest. Applying a multiple to consolidated EBITDA and subtracting consolidated net debt without accounting for outside equity interests would overstate value attributable to Cheniere common shareholders. The company’s DCF measure incorporates economic minority interests and is often the cleaner starting point, provided growth funding is treated consistently.
The most relevant catalysts are final Sabine Pass approvals and FID around late 2026 or early 2027, Q4 realization of the unusually high implied earnings requirement, February 2027 financial guidance, a refreshed normalized run-rate framework, and continued share-count reduction. Corpus Christi permitting and EPC development provide additional milestones through 2027. Midscale Trains 8 and 9 remain a later production catalyst, with no 2027 contribution in the base case.
The thesis would weaken materially if 2027 production expectations fall below the disclosed range, fixed marketing margins fail to translate into realized earnings, replacement cargo costs expose greater delivery risk than anticipated, or expansion budgets fail the stated return standards. A sustained decline in optimization profitability would also reduce the repeatability of recent outperformance. Recovery of Hormuz supply is principally a risk to residual merchant earnings and valuation expectations, not an automatic impairment of long-term fixed-fee contracts.
The appropriate investment stance is HOLD existing exposure, with incremental accumulation conditional on a valuation supported by normalized equity cash flow after funding commitments. A verified current quotation and a fully timed project-financing model are necessary for a defensible price target. The historical repurchase price should not substitute for either.
For portfolio construction, Cheniere provides exposure to contracted energy infrastructure, international gas dislocations, and capital-return execution, but it remains sensitive to energy risk appetite, interest rates, Gulf Coast operations, and geopolitical developments. It should not be treated as a low-correlation bond substitute. An illustrative initial allocation of 1%-2% of portfolio capital, with a 12.5% price-based review or reduction threshold, would place approximately 12.5-25 basis points of portfolio capital at risk before gaps and slippage. Actual sizing remains dependent on existing energy, infrastructure, and geopolitical exposures. Fundamental deterioration should trigger reassessment independently of price, while valuation-driven appreciation without a corresponding increase in normalized cash flow would justify trimming.
The strongest conclusion from the call is that Cheniere is monetizing a favorable market in ways that can survive the market itself. Forward sales protect near-term margins, long-term contracts support expansion, and repurchases increase ownership of the resulting cash flows per share. The principal analytical error would be to capitalize temporary scarcity earnings as permanent while simultaneously assigning full value to future capacity and buybacks. The principal opportunity is the durable value created as those temporary earnings are converted into contracted assets and a smaller equity base.
COMPANY EMPLOYEES ON THE CALL
• Jack Fusco, Chairman, President and Chief Executive Officer. • Anatol Feygin, Executive Vice President and Chief Commercial Officer. • Zach Davis, Executive Vice President and Chief Financial Officer. • Randy Bhatia, Vice President, Investor Relations and Communications.
RESEARCH ANALYSTS ON THE CALL
• Theresa Chen, Barclays. • Doug Irwin, Citi. • Keith Stanley, Wolfe Research. • Jeremy Tonet, JPMorgan. • Brandon Bingham, Scotiabank. • Jean Ann Salisbury, Bank of America.
Key Read-Throughs
KEY READ-THROUGHS FROM CHENIERE ENERGY’S Q3 2026 EARNINGS CALL
Cheniere’s call identifies a redistribution of earnings across the LNG value chain rather than a uniform benefit for energy companies. International gas scarcity disproportionately rewards producers retaining international benchmark exposure, competitively positioned nitrogen manufacturers, and suppliers with awarded liquefaction equipment contracts. Conversely, commissioning-to-commercial transitions can transfer exceptional LNG margins from exporters to customers, while geographically concentrated supply portfolios remain vulnerable despite strong national import demand. The most actionable distinction is between ownership of the commodity spread, ownership of infrastructure earning contracted fees, and dependence on physically deliverable gas. Cheniere’s approximately $10/MMBtu increase in 2027 forward benchmarks, persistent Hormuz disruption, and accelerating brownfield investment provide substantial evidence for these differentiated exposures. Directional assessments below concern operating fundamentals and estimate risk, not an assumption that the information is unpriced. Countries denote corporate domicile.
UPSTREAM NATURAL GAS
INTERNATIONALLY INDEXED CANADIAN GAS HAS MORE DIRECT UPSIDE THAN GENERIC NORTH AMERICAN GAS EXPOSURE (READ-THROUGH 1)
Tourmaline Oil (TOU: Canada): Positive. Magnitude is potentially high for the international marketing portfolio and meaningful for consolidated free cash flow, although hedging materially limits immediate participation.
The supporting call evidence is unusually specific. Cheniere reported that calendar 2027 TTF and JKM prices had increased more than $10/MMBtu since August and that prices and netbacks had strengthened through the end of the decade. Management also explained that volatility creates opportunities to monetize “the optionality we have in our IPM contracts.” These integrated production marketing arrangements can transmit international LNG pricing to the upstream gas supplier rather than leave the entire spread with the liquefaction operator.
Tourmaline has a directly verified Cheniere relationship: a 15-year agreement covering 140,000 MMBtu per day, priced against JKM after deductions for fixed LNG shipping costs and a fixed liquefaction fee. The precise transmission mechanism is therefore higher international benchmark realizations against predominantly fixed contractual deductions. This is fundamentally different from a producer selling only at AECO or Henry Hub, whose realized price does not automatically increase alongside TTF or JKM.
Tourmaline’s July 29 disclosure identified approximately 220,000 MMBtu per day of international pricing exposure in 2026, increasing to 253,000 MMBtu per day by the end of 2027. At the 2026 volume, each $1/MMBtu increase represents approximately US$80 million of annualized gross revenue sensitivity before hedging, taxes, foreign exchange, and other adjustments. The Cheniere agreement alone represents approximately US$51 million per $1/MMBtu. These are exposure calculations, not EBITDA forecasts.
The critical qualification is hedge coverage. Tourmaline disclosed approximately 100 MMcf per day hedged in international markets for the remainder of 2026 at an average C$16.25/Mcf. The full international portfolio therefore cannot be marked to current spot prices. Nevertheless, the forward-curve increase improves the economics of remaining open volumes and creates opportunities to lock in attractive future realizations. Cheniere’s decision to monetize higher forward margins supports the commercial feasibility of that strategy.
The near-term catalyst is Tourmaline’s November 4 results release and November 5 call, particularly updated international hedges, realized pricing, and capital-return decisions. The longer-duration implication is a structurally more valuable marketing portfolio that reduces dependence on Canadian regional pricing. The highest-conviction exposure is contractual access to international netbacks, not an undifferentiated bullish view on all Canadian gas production.
EUROPE’S STORAGE DEFICIT SUPPORTS RELIABLE NORWEGIAN GAS SUPPLY BEYOND THE INITIAL WINTER PRICE SPIKE (READ-THROUGH 2)
Equinor (EQNR: Norway): Positive. Magnitude is high for European gas realizations and potentially substantial for group cash generation, moderated by taxation, sales arrangements, and its diversified production portfolio.
Cheniere reported European storage at approximately 72% at the beginning of October, the lowest level for that date since 2011. Its winter balance requires approximately 69 million tonnes of LNG, approximately 7% more than the preceding winter, even assuming an end-winter storage level near 28%. Management’s central observation was that “Europe has sufficient infrastructure to balance the winter, but the margin for error is limited.”
The transmission mechanism to Equinor is direct. Reliable Norwegian pipeline gas competes economically with the marginal LNG cargo Europe must attract. When additional LNG requires a higher price, European hub-linked gas realizations can increase without Equinor needing to construct new liquefaction capacity or incur the corresponding ocean freight expense. Tight storage also supports demand for reliable existing supply independently of whether Europe has enough regasification terminals.
Equinor’s October 28 results corroborate the exposure rather than leave it hypothetical. The company reported a European realized gas price of US$20/MMBtu and identified higher European gas prices among the principal contributors to earnings. Cheniere’s subsequent call is therefore confirmation of the mechanism and an update to winter and 2027 assumptions, not advance evidence of an unreported Q3 earnings beat.
The non-consensus implication concerns duration. A relatively mild winter could reduce immediate spot scarcity without eliminating the following summer’s refill requirement. Conversely, a cold winter could create both a winter earnings benefit and a larger 2027 replenishment requirement. Cheniere’s statement that European gas demand is already approximately 20% below pre-Ukraine-war levels, with limited additional demand destruction evident, suggests that further balancing may require disproportionately large price adjustments.
Near-term catalysts are winter weather, Norwegian maintenance and availability, storage withdrawal rates, and evidence of sustained Hormuz recovery. The longer-duration benefit is the strategic value of reliable European supply while Russian imports are being reduced. This should not be treated as a permanent scarcity valuation: Cheniere itself expects global LNG supply growth to resume from 2028 even without full recovery of constrained Middle Eastern volumes, while Norway’s high upstream taxation reduces the conversion of pretax commodity gains into shareholder cash.
LNG LIQUEFACTION AND EQUIPMENT
COMMERCIAL STARTUP CAN REDUCE MERCHANT EARNINGS EVEN WHILE INTERNATIONAL LNG PRICES REMAIN ELEVATED (READ-THROUGH 3)
Venture Global (VG: United States): Negative for extrapolation of commissioning-period margins into commercial operations. Magnitude is high at the transitioning Plaquemines phase and potentially material for consolidated earnings mix. This is not a conclusion that total company earnings must decline.
Cheniere provided the essential economic contrast: long-term Henry Hub-linked FOB cargoes were loading at approximately $6/MMBtu while international spot prices were at times above $30/MMBtu. That differential illustrates how much economic value can accrue to a long-term customer rather than to the exporting plant once contractual deliveries begin. It should not be interpreted as an exact margin comparison because freight, contractual fees, and hedges differ.
Venture Global’s October 1 report to the U.S. Department of Energy anticipated commercial operations for Plaquemines Phase 1 on October 31, 2026, followed by Phase 2 in mid-2027. The same filing confirmed long-term sales agreements covering the project’s 20 million tonne nameplate capacity and additional annual quantities above nameplate. Plaquemines had already been producing and exporting commissioning LNG.
The transmission mechanism is a change in who retains the commodity spread. Before commercial commencement, commissioning cargoes can be sold under merchant arrangements. As long-term obligations begin, the associated volumes move toward contracted pricing and customers receive the benefit of low-cost U.S. supply relative to international markets. High spot prices make that transition more economically significant, not less significant.
An important modeling distinction follows: commercial commencement is not necessarily an equivalent addition to global physical supply when the facility was already exporting commissioning cargoes. It changes contractual allocation and earnings distribution. Treating the commercial date as both a large new physical supply increment and continuation of unrestricted merchant margins risks double-counting.
Venture Global’s August disclosure also stated that 91% of available 2026 cargoes were already contracted. The remaining spot opportunity therefore cannot be extrapolated across its entire output. Cheniere’s own limited remaining open exposure reinforces the broader point that export volumes and commodity-price sensitivity are different variables.
The immediate catalyst is confirmation of the anticipated October 31 transition and subsequent disclosure of contracted versus commissioning volumes. The longer-duration issue is the progression of Phase 2 toward commercial operations in 2027. Remaining merchant volumes, production above contracted quantities, and the planned CP2 ramp can offset the earnings-mix headwind. The high-conviction negative read-through is narrower: exceptional commissioning margins are not an appropriate perpetual earnings base, even if the LNG market remains tight.
BROWNFIELD EXPANSION AND DEBOTTLENECKING FAVOR AN AWARDED EQUIPMENT SUPPLIER, NOT THE ENTIRE EPC UNIVERSE (READ-THROUGH 4)
Baker Hughes (BKR: United States): Positive. Magnitude is high for LNG-related equipment and lifecycle-service visibility and moderate at the consolidated company level. The latest Cheniere call primarily reduces execution risk around existing awards rather than establishing a new quarterly order surprise.
Cheniere stated that almost $500 million had been spent on early engineering and procurement with Bechtel and Baker Hughes, including “key high value and long lead time equipment orders.” Management also described adding debottlenecking equipment that improves production from existing trains, not only the incremental train. The initial Sabine Pass expansion is expected to add more than 6 million tonnes per annum, with FID targeted around the end of 2026 or early 2027.
The supplier relationship is specific and awarded. Baker Hughes’ July announcement covered 7 PGT25+ G4 gas turbines driving 15 centrifugal compressors, equipment for the boil-off gas re-liquefaction unit, and upgrades across the installed Sabine Pass turbine fleet over approximately 4 years. This is materially stronger evidence than assigning a generic LNG construction opportunity to unrelated listed engineering companies.
The transmission mechanism combines new equipment revenue, conversion of committed project work, and an expanded service and upgrade opportunity. Cheniere’s emphasis on extracting more production from existing infrastructure is particularly favorable to a supplier capable of increasing turbine output and compressor performance. Avoiding new tanks, berths, and pipelines does not eliminate spending; it changes the spending mix toward process equipment and productivity improvements.
Baker Hughes’ October 27 results already reported record Industrial & Energy Technology remaining performance obligations of approximately $39.4 billion. Consequently, Cheniere’s call should be treated as confirmation of backlog quality and project progression, not as evidence that the same Sabine Pass awards should be added again to orders. The approximately $500 million cited by Cheniere also covers multiple counterparties and activities; it is not Baker Hughes revenue.
Ownership matters for the broader equipment exposure. Baker Hughes completed its acquisition of Chart Industries on July 16, 2026. Chart’s cryogenic equipment exposure therefore belongs within Baker Hughes rather than a separate GTLS investment thesis. Baker Hughes has already demonstrated combined equipment scope at Venture Global’s Plaquemines expansion, including compression equipment and Chart cold boxes.
Near-term catalysts are Sabine Pass permitting, financing close, and FID. The longer-duration opportunity is equipment delivery, fleet upgrades, and aftermarket activity, followed by possible participation in Corpus Christi’s next expansion. That future participation is not yet an awarded revenue stream. High utilization also does not automatically accelerate all service revenue: Cheniere’s lack of major 2027 turnarounds may support parts demand while limiting access for maintenance requiring extended shutdowns.
NITROGEN FERTILIZERS
THE EUROPEAN GAS SHOCK STRENGTHENS NORTH AMERICAN NITROGEN’S COST ADVANTAGE (READ-THROUGH 5)
CF Industries (CF: United States): Positive. Magnitude is high for relative production economics and potentially substantial for consolidated margins, conditional on nitrogen selling prices, plant availability, and agricultural demand.
The supporting call evidence is the persistence and forward extension of the international gas shock. Cheniere reported Q3 TTF above $21/MMBtu, a more than $10/MMBtu increase in calendar 2027 forward benchmarks since August, and European winter LNG requirements above the preceding year. Management also observed that Europe has already absorbed substantial industrial demand destruction and has limited obvious additional flexibility.
Natural gas is both a feedstock and a major energy input in ammonia production. Higher European gas costs raise the marginal cost of ammonia and nitrogen production, encourage curtailments, and increase the price required for marginal European capacity to operate. CF’s predominantly North American manufacturing base is not directly repriced to TTF, allowing it to benefit when global nitrogen prices reflect high-cost international supply while its own feedstock remains tied to North American markets.
CF’s August 5 release explicitly identified this mechanism: higher European gas prices were expected to “further pressure marginal European nitrogen production and support the global clearing price needed to meet demand.” Cheniere’s October call strengthens the duration of that earlier assessment because the latest repricing extends into 2027 rather than being confined to a temporary summer disruption.
An illustrative engineering sensitivity demonstrates the potential materiality. At 30 MMBtu of gas consumption per tonne of ammonia, a $10/MMBtu change in gas cost represents approximately $300 per tonne before other costs. This is not a forecast of CF’s plant efficiency or earnings. It shows why the geographic gas-price differential can dominate modest variations in freight or operating expense.
The earnings mechanism is an improvement in nitrogen selling prices relative to CF’s own feedstock costs, not a direct transfer of the entire European gas-price increase into CF margins. Chinese exports, farmer affordability, deferred purchasing, operating outages, and North American gas prices can all constrain the benefit. CF’s own realized gas costs can also move differently from spot Henry Hub because of procurement timing and derivatives.
The near-term catalyst is CF’s forthcoming Q3 results and commentary on forward sales, North American gas procurement, and the 2027 agricultural season. The longer-duration positive is a persistent relative production advantage if Europe must compete for scarce LNG through winter and refill season. This is a more precise expression of the gas dislocation than a blanket bullish position in fertilizer companies irrespective of their feedstock geography.
EUROPEAN AMMONIA PRODUCTION FACES A COST HEADWIND THAT HIGHER FERTILIZER PRICES DO NOT FULLY ELIMINATE (READ-THROUGH 6)
Yara International (YAR: Norway): Negative for European ammonia manufacturing economics and relative competitiveness. Magnitude is high at the affected plants and moderate at group level before mitigation. Yara’s global sourcing network and planned U.S. acquisition materially reduce the severity of an unqualified bearish conclusion.
Cheniere’s European storage and forward-price commentary implies that elevated feedstock costs could persist beyond the current quarter. Its statement that forward prices have increased through the end of the decade is particularly relevant to production planning and investment decisions, even though those prices are not guaranteed future realizations.
Yara’s October 22 results already demonstrated the transmission mechanism. EBITDA excluding special items declined to US$675 million from US$804 million, and the company identified higher gas prices and deferred demand as pressures on margins and deliveries. Management stated that strong commercial performance helped offset “accelerating European gas costs” and described active adjustments to its European production footprint.
The precise mechanism is the difference between the increase in gas procurement cost and the increase in realized nitrogen-product value. Where that spread becomes uneconomic, production curtailment avoids variable losses but reduces fixed-cost absorption. Imported ammonia can preserve downstream fertilizer production, although it changes logistics, working-capital requirements, and the margin retained across the integrated chain.
The relative read-through against CF is therefore stronger than a simple prediction that every fertilizer producer benefits from higher product prices. The same global nitrogen price can be attractive for a North American producer and insufficient for a European ammonia plant. Geographic feedstock exposure determines who retains the scarcity rent.
Important counterevidence prevents treating Yara as an uncomplicated short. The company exited Q3 with a European order book stronger than normal for the season, has a global production and sourcing network, and announced a Gulf Coast Ammonia acquisition intended to reduce European energy exposure. That acquisition remained subject to closing conditions in the October release and should not yet be treated as fully consolidated operating protection.
The near-term catalysts are winter gas costs, production curtailment decisions, realized fertilizer pricing, and acquisition progress. The longer-duration implication is pressure to shift the supply of basic ammonia toward lower-cost gas regions while preserving European downstream upgrading and distribution where economics justify it. Cheniere’s call reinforces that structural adjustment; it does not establish an additional Q3 earnings miss after Yara had already reported.
ASIAN LNG IMPORTERS AND REGASIFICATION
INDIAN IMPORT GROWTH DOES NOT ELIMINATE QATAR-CONCENTRATION RISK AT A SPECIFIC IMPORTER (READ-THROUGH 7)
Petronet LNG (PETRONET: India): Negative for assumptions of rapid contracted-supply normalization and unrestricted utilization recovery. Magnitude is moderate operationally; the consolidated earnings effect is smaller and less direct because third-party processing, tariffs, and contractual protections can offset lost proprietary supply.
The apparent contradiction in Cheniere’s call is the investment insight. India’s LNG imports increased 21% year to date and 9% in Q3 despite much higher international prices. Simultaneously, management emphasized that the brief improvement in Hormuz transits “should not be read as evidence of normalization” and described a renewed deterioration in security.
National import resilience therefore cannot be translated mechanically into a positive volume forecast for every Indian importer. Buyers can replace constrained Qatar supply with cargoes from the U.S., Oman, Nigeria, and other origins. The benefit depends on which company controls alternative supply, receives third-party cargoes, or provides the regasification service.
Petronet has a directly identified long-term agreement for approximately 7.5 million tonnes annually from QatarEnergy. Its August operating commentary reported 56 affected contractual cargoes and continued uncertainty over the delivery schedule. The risk transmission is disrupted access to contracted molecules, followed by reliance on alternative cargoes and customer-arranged processing to sustain terminal throughput.
Its June-quarter results show why the magnitude must be measured carefully. Dahej processed 192 TBtu compared with 207 TBtu a year earlier. Reported utilization declined to approximately 66% from 92%, but capacity had increased from 17.5 million to 22.5 million tonnes per annum. The utilization decline therefore materially overstates the reduction in physical throughput if the changing denominator is ignored.
The earnings counterevidence is equally important. Petronet’s June-quarter standalone net profit increased approximately 33% even though revenue declined approximately 53%. Lost commodity pass-through revenue is not equivalent to lost regasification margin. The high-conviction negative conclusion is about supply reliability and the pace of volume recovery, not a claim that earnings must fall in proportion to LNG trading revenue.
Near-term catalysts are actual Qatar delivery schedules, replacement cargo availability, and terminal throughput through the winter. The longer-duration implication is that diversification by supply origin has independent economic value beyond the existence of a long-term contract. QatarEnergy’s decision to secure U.S. supply from Cheniere validates that logic, but deliveries beginning in the early 2030s do not resolve Petronet’s immediate supply exposure.
Report record
- Sector
- Energy
- Industry
- Oil & Gas Storage & Transportation
- Fiscal period end
- September 30, 2026
- Report date
- October 29, 2026
- Analysis
- 6327 words
- Read-throughs
- 2985 words
- Content fingerprint (PDF)
337b678141fe- Content fingerprint (analysis)
1996c65bb69d- Content fingerprint (read-throughs)
6bc107d9dfbb
Prepared from the company's earnings release and earnings call transcript. Figures as reported by the company. For information only. Not investment advice.
More from Cheniere Energy Inc
All Cheniere Energy Inc reports
More in Energy
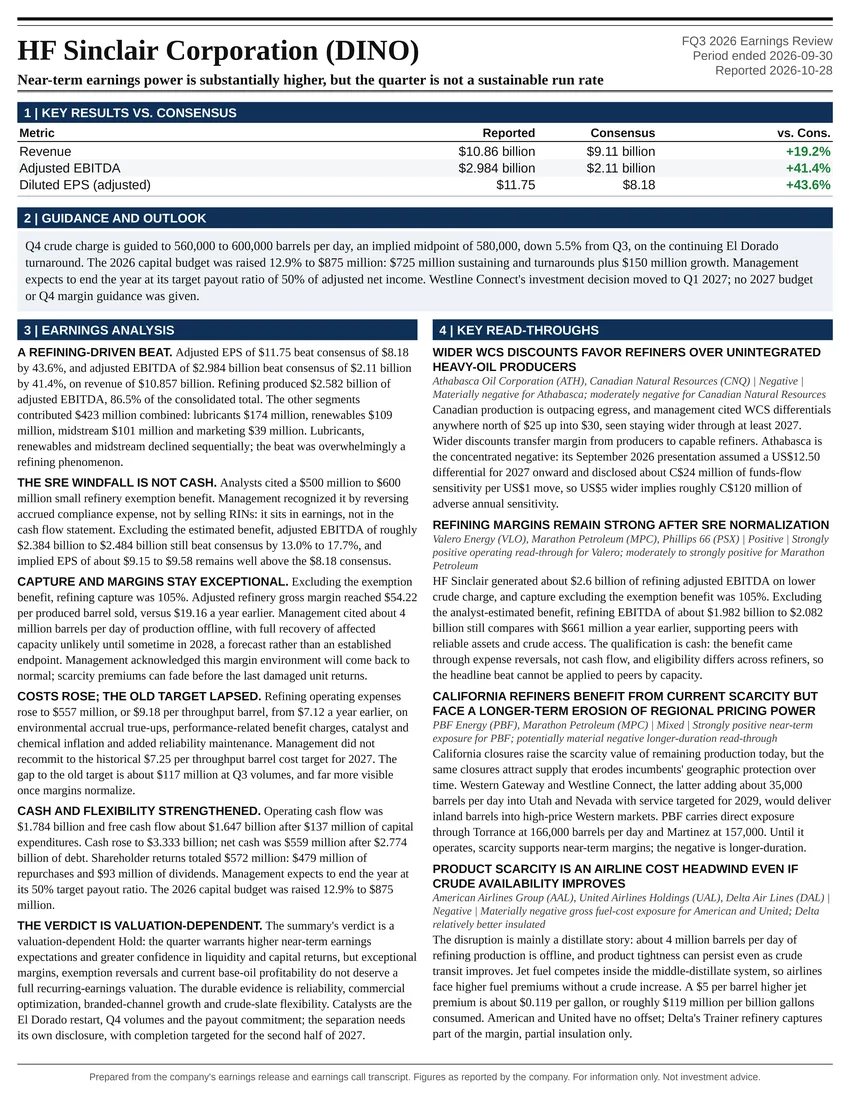
Near-term earnings power is substantially higher, but the quarter is not a sustainable run rate
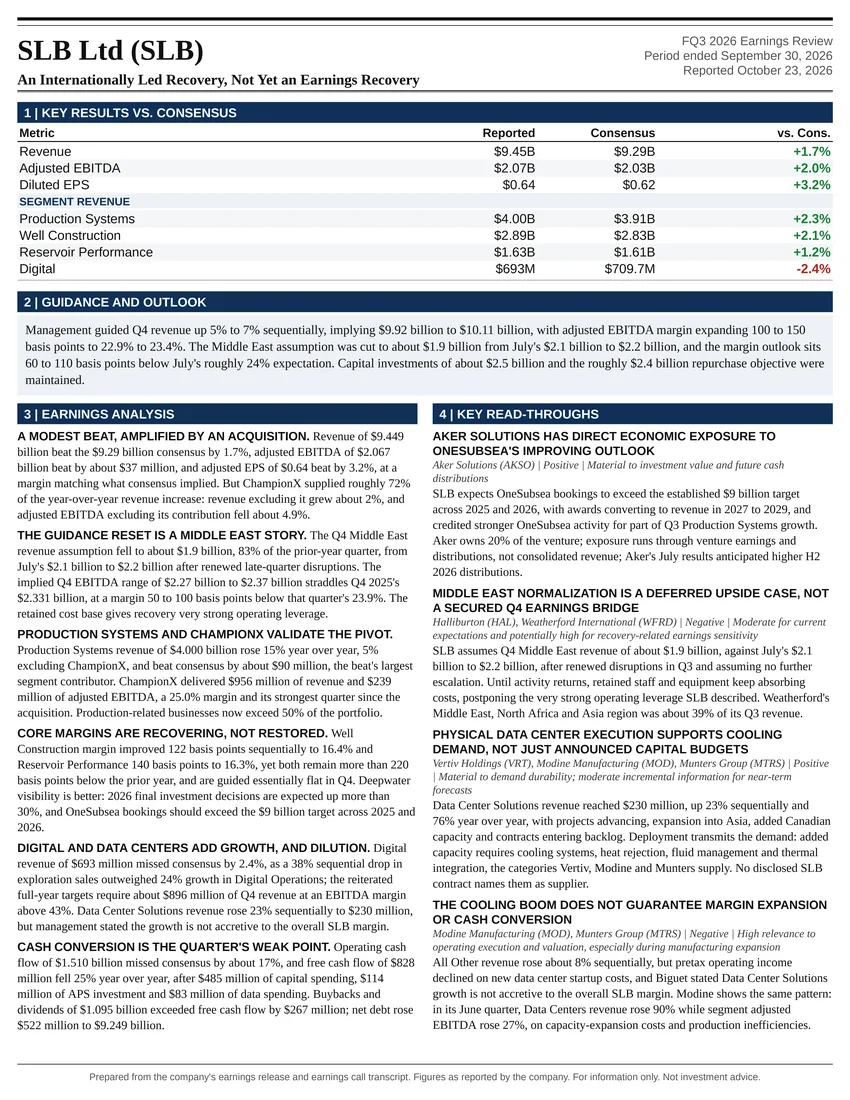
An Internationally Led Recovery, Not Yet an Earnings Recovery
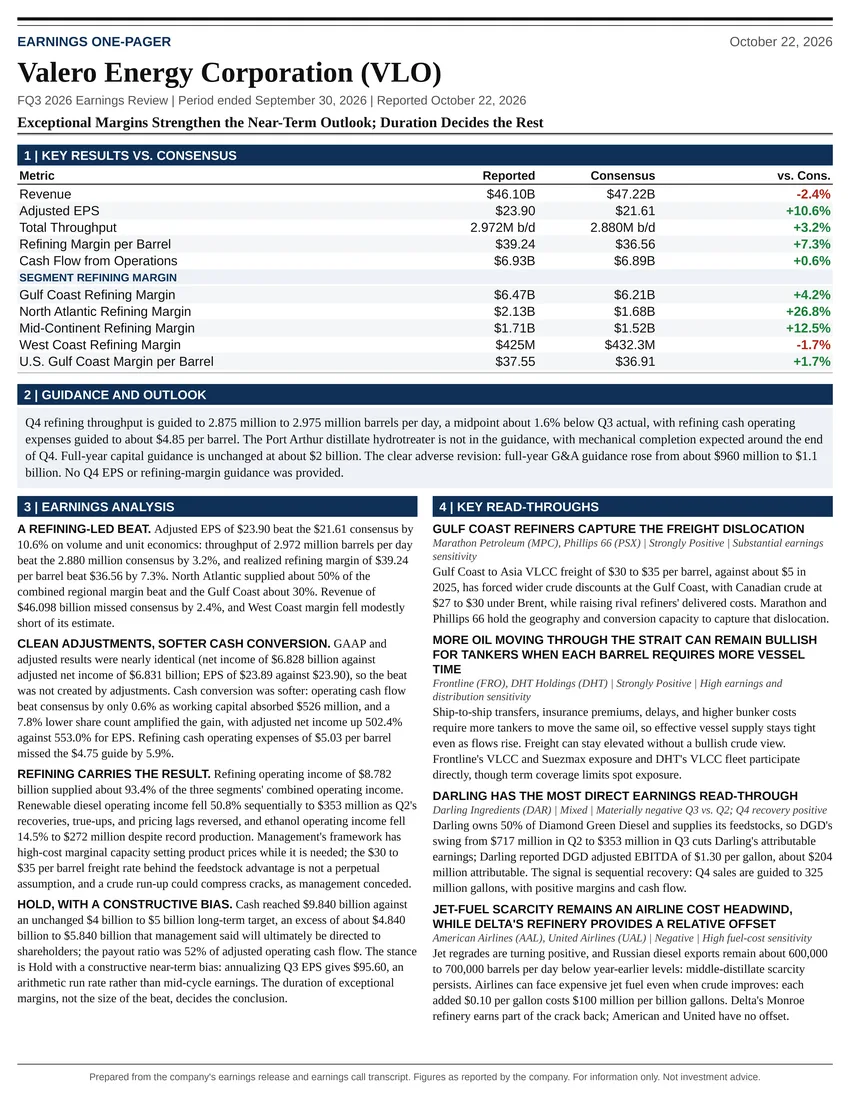
Exceptional Margins Strengthen the Near-Term Outlook; Duration Decides the Rest
Follow @AtlasPeakRes on X for new earnings reports as they publish.
