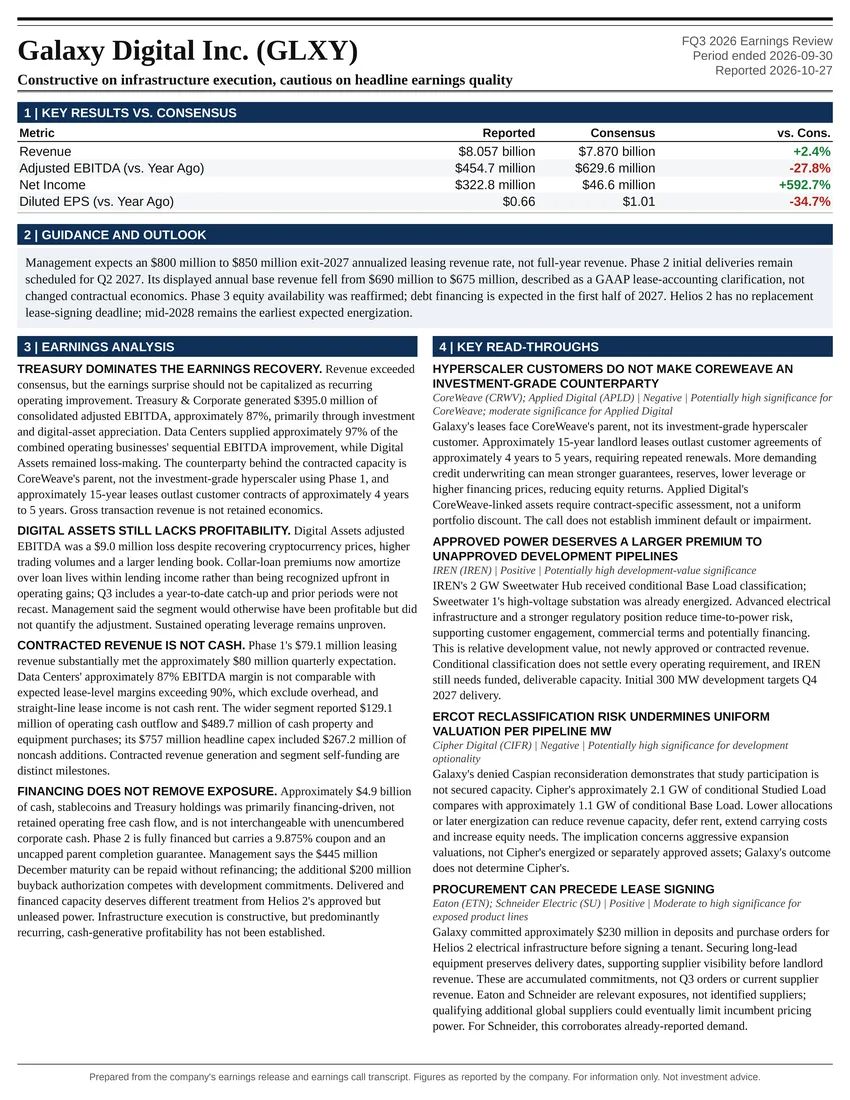
Constructive on infrastructure execution, cautious on headline earnings quality
Earnings Reports
Visa FQ4 2026 Earnings Report
Visa (V) FQ4 2026 earnings: Strategic position strengthened more than the near-term earnings surprise. Full earnings analysis, key read-throughs, and the one-page exhibit from Atlas Peak Research.
Visa (V)
Sector: Financials · FQ4 2026 · Period end September 30, 2026 · Reported October 27, 2026
Visa’s fiscal Q4 2026 earnings call supports a constructive view of the underlying business, but not an aggressive increase in exposure based solely on the reported earnings beat.
Download the one-page report (PDF)
View one-page exhibit
Download analysis (.md)
Download read-throughs (.md)
Post to X
One-Page Exhibit
Earnings Analysis
EXECUTIVE CALL SUMMARY: Visa Inc. (10/27/26)
Visa’s fiscal Q4 2026 earnings call supports a constructive view of the underlying business, but not an aggressive increase in exposure based solely on the reported earnings beat. Payment activity remained resilient, cross-border growth strengthened, and value-added services continued to expand substantially faster than the core network. However, the quarter’s financial outperformance was modest, the EPS beat was primarily supported by favorable below-operating-income items, and fiscal 2027 guidance incorporates meaningful offsets from client renewals, lower currency volatility, and a higher tax rate. The principal investment question is increasingly how much of Visa’s expanding product monetization can be retained after client incentives and reinvestment, rather than whether payment volumes can continue growing.
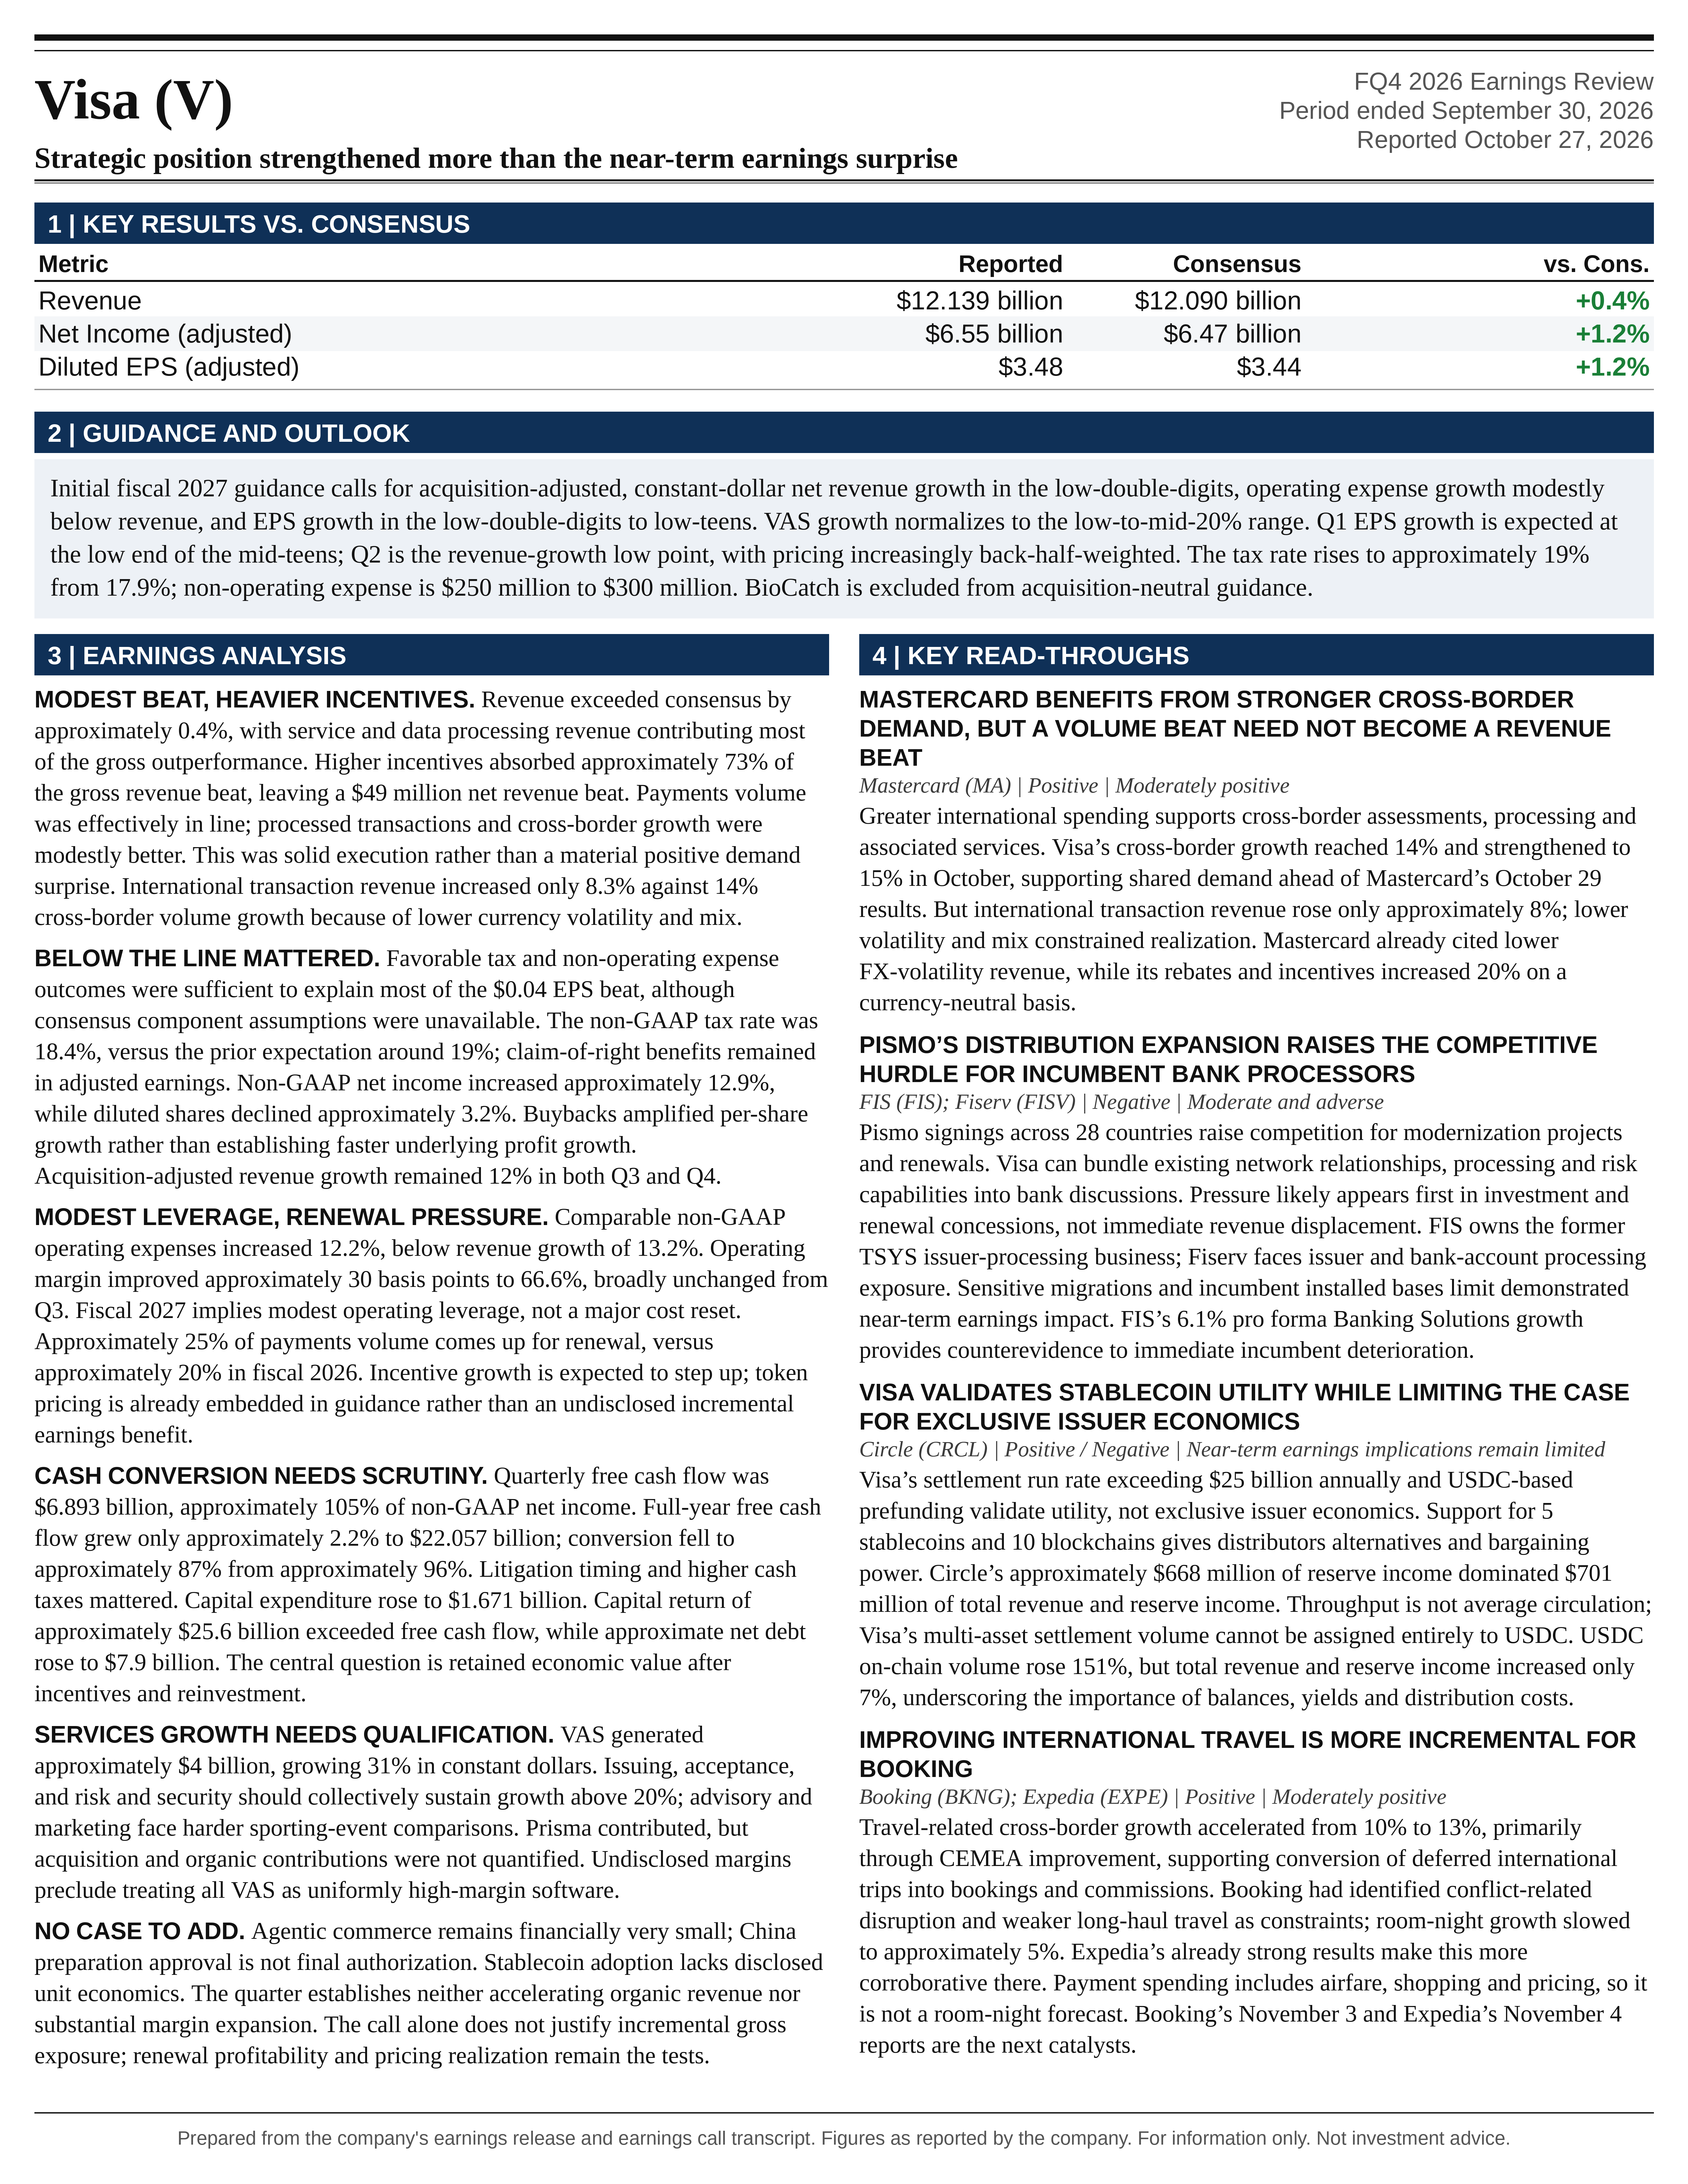
Q4 net revenue of $12.139 billion increased 13.2% and exceeded Bloomberg consensus of $12.090 billion by approximately 0.4%. Non-GAAP EPS of $3.48 increased 16.8% from $2.98 and exceeded consensus of $3.44 by 1.2%. Payments volume of approximately $4.08 trillion was consistent with expectations, while processed transactions and cross-border growth were modestly better than consensus. Management appropriately described revenue as “in line with our expectations.” This was a solid execution quarter rather than a material positive demand surprise.
The more important operating development was the durability of growth outside traditional consumer card payments. Value-added services, or VAS, generated approximately $4 billion of quarterly revenue, growing 31% in constant dollars. Commercial and money movement solutions, or CMS, grew 16%, commercial payments volume increased 13%, and Visa Direct transactions increased 23%. VAS and CMS collectively represented more than 40% of annual net revenue. These businesses increasingly determine Visa’s growth trajectory, although their transaction dependence, acquisition contributions, pricing exposure, and undisclosed profitability prevent them from being treated as a separate, uniformly high-margin software business.
Fiscal 2027 guidance calls for adjusted net revenue growth in the low-double-digits, operating expense growth modestly below revenue growth, and EPS growth in the low-double-digits to low-teens. The outlook is credible given current operating trends, but requires successful renewal of approximately 25% of payments volume, sustained VAS growth in the low-to-mid-20% range, and execution of increasingly back-half-weighted pricing actions. Agentic commerce, stablecoins, and potential domestic processing in China strengthen the strategic opportunity set, but none supports a substantial near-term earnings contribution on the evidence disclosed.
The appropriate earnings-based stance is to maintain existing core exposure rather than increase position size simply because EPS exceeded consensus. The business remains a strong compounder, but the quarter does not establish accelerating underlying organic revenue growth, substantial margin expansion, or a new earnings contribution from emerging payment technologies. The next material underwriting milestones are renewal economics, VAS growth after major sporting-event comparisons, and the conversion of pricing and productivity improvements into retained operating profit and cash flow.
QUARTERLY RESULTS AND THE QUALITY OF THE BEAT
The revenue surprise was small and heavily influenced by the relationship between gross revenue and client incentives. Service revenue was $5.255 billion, compared with consensus of approximately $5.200 billion. Data processing revenue was $6.245 billion versus $6.190 billion, and international transaction revenue was $4.115 billion versus $4.110 billion. Other revenue reached $1.647 billion, increasing 40%, supported by advisory, marketing services, other VAS offerings, and pricing.
Client incentives of $5.123 billion exceeded the approximately $4.990 billion consensus estimate by $133 million. Using the supplied consensus figures, actual gross revenue before incentives exceeded implied consensus gross revenue by approximately $182 million. Higher incentives absorbed approximately 73% of that gross revenue outperformance, leaving the $49 million net revenue beat. This is the clearest numerical illustration of the quarter’s central economic tension: Visa is generating substantial additional gross revenue, but a meaningful portion is being returned to clients.
Operating activity also points to a modest rather than transformative beat. Processed transactions were approximately 74.2 billion versus consensus of 73.98 billion, an outperformance of roughly 0.3%. Constant-dollar cross-border growth excluding intra-Europe was 14% versus consensus of 13.6%. Payments volume was effectively in line. The Bloomberg notice’s dollar symbol beside processed transactions is a presentation error: 74.2 billion is a transaction count, not a dollar volume.
Accounting comparability is particularly important for operating expenses. The earnings notice lists $4.88 billion of total operating expenses against a $4.19 billion estimate, but the $4.877 billion actual is GAAP. Visa’s actual non-GAAP operating expenses were $4.051 billion. The $826 million difference principally comprised a $469 million excluded litigation provision, a $282 million charitable contribution of investments, $61 million of acquired intangible amortization, and $14 million of acquisition-related costs. Without confirmation that the consensus expense estimate uses the same accounting basis, the apparent GAAP expense miss should not be interpreted as an underlying operating cost overrun.
On a comparable non-GAAP basis, operating expenses increased 12.2%, below revenue growth of 13.2%. Operating income increased approximately 13.7% to $8.088 billion, and operating margin improved approximately 30 basis points to 66.6% from 66.3%. The incremental operating margin on additional revenue was approximately 68.9%, demonstrating strong economics but not a dramatic step-up in operating leverage. The margin was also broadly unchanged from Q3’s approximately 66.7%.
EPS growth benefited materially from the share count. Non-GAAP net income increased approximately 12.9%, while diluted shares declined approximately 3.2% to 1.882 billion. That reduction mechanically amplified per-share growth, helping EPS increase 16.8%. Buybacks remain an important component of the earnings model, but the distinction between underlying profit growth and per-share financial accretion should be preserved.
THE EPS BEAT WAS PRINCIPALLY BELOW THE OPERATING LINE
The July 28, 2026 earnings call had established Q4 expectations for approximately $80 million of non-operating expense and a tax rate around 19%. Actual non-operating expense was $57 million, and the non-GAAP tax rate was 18.4%. The lower tax rate reflected claim-of-right benefits associated with recent legal settlements, while higher average cash balances helped non-operating income.
Holding actual operating income and diluted shares constant, applying a 19% tax rate and $80 million of non-operating expense produces illustrative EPS of approximately $3.45, versus reported non-GAAP EPS of $3.48. This calculation is not a formal bridge to consensus because the consensus tax and interest assumptions were not supplied. Nevertheless, it demonstrates that the favorable tax and non-operating expense outcomes were sufficient to explain most of the $0.04 headline EPS beat.
The tax distinction also matters for earnings quality. The claim-of-right benefit remained within non-GAAP earnings. Separately, Visa excluded a $37 million deferred tax expense associated with a change in the taxation of certain foreign earnings. These are different items. Non-GAAP EPS therefore excludes certain unusual tax effects while retaining others, and should not automatically be equated with fully normalized recurring EPS.
The quarter’s EPS acceleration also overstates the change in underlying revenue momentum. Q3 revenue increased 14% nominally and 13% in constant dollars; Q4 increased 13% on both bases. After acquisition adjustments, revenue growth was 12% in both quarters. Non-GAAP adjusted constant-dollar EPS growth accelerated from 10% in Q3 to 16% in Q4, but that improvement reflected better expense growth, more favorable tax comparisons, and capital return rather than a comparable acceleration in organic revenue.
FULL-YEAR PERFORMANCE PROVIDES A STRONGER GROWTH STORY, BUT A MORE MIXED PROFIT STORY
Full-year net revenue was $45.903 billion, rounded to $46 billion in the call, versus $40.000 billion in fiscal 2025. Growth accelerated to approximately 15% nominally and 14% in constant dollars, compared with 11% nominal growth in fiscal 2025. Non-GAAP EPS increased to $13.27 from $11.47, approximately 16%.
The operating drivers did not all accelerate equally. Annual payments volume growth increased to 9% in constant dollars from 8% in fiscal 2025, while processed transaction growth moderated to 9% from 10%. Commercial payments volume growth accelerated to 12% from 7%, CMS revenue growth increased to 19% from 15%, and VAS growth increased to 30% from 23%. The stronger revenue performance therefore reflected a combination of payments activity, commercial expansion, services, pricing, and acquisitions rather than simply a faster increase in transaction counts.
Full-year profitability was less exceptional than the headline revenue growth. Non-GAAP operating expenses increased approximately 15.6%, slightly faster than revenue. Operating margin declined approximately 24 basis points to 67.5%, while non-GAAP net income increased approximately 12.3%. A roughly 3.0% reduction in diluted shares helped deliver the stronger EPS growth.
The resulting interpretation is balanced. Fiscal 2026 demonstrated that Visa can grow materially faster than underlying transaction volumes by expanding services and improving monetization. It did not establish that this revenue mix automatically produces accelerating margins. The company reinvested heavily, incurred higher below-the-line costs, and relied on buybacks to amplify EPS growth.
CONSUMER SPENDING AND CROSS-BORDER ACTIVITY
US payments volume increased 10%, with credit growing 11% and debit 9%, broadly consistent with Q3. Both discretionary and nondiscretionary spending remained strong. Management stated, “We did not see signs of the lower-spend consumer weakening in our volumes.” The highest-spending cohort continued to grow fastest, but the disclosed data did not indicate a new deterioration among lower-spending Visa customers.
This is supportive evidence for Visa’s current demand environment, but not a comprehensive measure of household financial health. Visa’s spending cohorts are not identical to household income cohorts, and network spending does not reveal borrowers’ delinquency, savings depletion, or debt-service burdens. Payments volume also reflects price levels, payment mix, and Visa Direct activity. Consequently, 10% US payments volume growth should not be interpreted as 10% real consumer spending growth.
Management identified fuel costs, retail activity, Visa Direct, and FIFA-related spending as contributors. The World Cup clearly benefited specific locations: inbound cross-border card-present spending in US host cities increased more than 20% during July 1 through July 19. However, that selected geographic and temporal observation cannot establish the tournament’s incremental contribution to consolidated revenue. Displacement of other spending and the duration of the benefit were not quantified.
October activity is important because it weakens the argument that the entire US acceleration was dependent on the tournament. Through October 21, US payments volume remained up 10%, with credit at 11% and debit at 9%. Processed transactions remained up 10%. This does not isolate the structural component of growth, but it provides evidence that strong activity persisted after the event.
Cross-border volume excluding intra-Europe increased 14%, compared with approximately 12% in Q3. Travel accelerated to 13% from 10%, primarily reflecting improvement in CEMEA inbound and outbound activity. Cross-border e-commerce increased 17%, compared with approximately 16% in Q3, supported by retail and spending on AI platforms. The latter broadens the demand base beyond tourism and conventional discretionary goods, although no separate AI-related volume contribution was disclosed.
The economic realization of this volume growth was less strong. International transaction revenue increased only 8.3%, materially below the 14% cross-border volume increase, because of lower currency volatility and mix. The gap should not be interpreted as a direct reduction in contractual pricing, but it establishes that stronger cross-border volume does not necessarily translate proportionately into revenue.
October cross-border growth of 15%, with travel at 13% and e-commerce at 17%, indicates continued strength entering fiscal 2027. Management’s guidance nevertheless assumes that CEMEA travel activity remains generally indexed to Q4 levels. Improvement in annual growth can therefore arise from easier conflict-related comparisons without requiring a full normalization of underlying travel conditions.
PRICING AND CLIENT INCENTIVES ARE THE CENTRAL FISCAL 2027 DEBATE
Service revenue increased 14%, compared with the 10% growth in the prior quarter’s constant-dollar payments volume on which service revenue is recognized. Data processing revenue increased 16%, compared with approximately 10% processed transaction growth. Pricing was a major contributor to both differentials, supplemented in data processing by cross-border mix and VAS.
These growth premiums demonstrate monetization, but they are not additional volume growth. Nor should they be treated as pure price realization, because product mix, services, transaction characteristics, and currency can affect the relationship between revenue and operating drivers.
The token-pricing exchange was especially consequential. Management stated that fiscal 2027 pricing assumptions include “all the pricing plans that we have in motion today.” Token pricing therefore should not be layered on top of guidance as an undisclosed incremental earnings benefit. The relevant questions are whether adoption, usage, or implementation timing exceeds the assumptions already embedded in the forecast.
New pricing is expected to contribute an amount similar to fiscal 2026, with implementation even more concentrated in the second half. That creates execution and timing exposure. A broadly similar annual contribution does not imply an even quarterly contribution, and delays in deployment would have less time to be recovered before fiscal year-end.
Client incentives are the principal offset. Approximately 25% of payments volume is expected to come up for renewal in fiscal 2027, versus approximately 20% in fiscal 2026. This is a 5-percentage-point increase in the portion of volume being renegotiated, or a 25% relative increase in renewal exposure. Management expects incentive growth to step up from fiscal 2026.
Q4 already demonstrated the pressure: incentives increased 21%, compared with approximately 18% in Q3, reflecting deals signed in Q3 and early Q4. Incentives represented approximately 29.7% of gross revenue before incentives. Their classification as a revenue deduction rather than an operating expense does not diminish their economic importance.
Renewals are not inherently negative. Long-duration contracts can protect volume, expand services, and improve customer retention. However, the call did not disclose contract-level pricing, duration, incentives, exclusivity, or expected contribution margins. Successful renewal and attractive renewal economics are not synonymous.
The strongest version of the investment case is that a broader suite of services increases client dependence and improves lifetime economics. The weaker version is that additional VAS and CMS revenue is partially purchased through larger incentives on the core relationship. Gross services growth alone cannot distinguish those outcomes. Net revenue and contribution profit at the relationship level are the more relevant economic measures.
An illustrative sensitivity demonstrates the materiality. Fiscal 2026 gross revenue before incentives was approximately $64.2 billion. An additional 1 percentage point of incentives relative to that gross revenue base would reduce net revenue by approximately $642 million, holding gross revenue unchanged. At a 19% tax rate and fiscal 2026 diluted shares, that would equate to approximately $0.27 of EPS before any cost response. This is not a forecast, but it explains why renewal economics can offset substantial product-level pricing benefits.
VALUE-ADDED SERVICES: THE STRONGEST GROWTH ENGINE, WITH IMPORTANT QUALIFICATIONS
VAS revenue increased 31% in constant dollars to approximately $4 billion in Q4, following 34% growth to approximately $3.8 billion in Q3. Annual revenue reached approximately $14 billion, up 30%, and was roughly double the fiscal 2023 level. VAS represented approximately 30.5% of annual net revenue and approximately 33% of quarterly net revenue.
The sequential moderation from 34% to 31% is not evidence of deterioration by itself. Both rates were exceptionally strong, and Q4 remained above the full-year growth rate. However, fiscal 2027 guidance for growth in the low-to-mid-20% range implies meaningful normalization from the fiscal 2026 pace. Maintaining 30% growth should not be the base assumption.
The distinction between VAS components is critical. Management expects issuing, acceptance, and risk and security collectively to sustain growth above 20% in fiscal 2027. These portfolios have more direct links to transactions, credentials, accounts, fraud prevention, and payment infrastructure. Advisory and other services benefited significantly from the Olympics, FIFA, marketing engagements, and other sponsorship activation. The latter creates a more difficult comparison and is less naturally extrapolated from fiscal 2026’s performance.
Management’s statement that transactions, cards, and accounts drove more than 80% of VAS revenue over the past 5 years provides a stronger framework than treating the business as discretionary consulting. Much of the revenue base scales with customer activity and infrastructure usage. Nevertheless, transaction-linked revenue is not equivalent to fixed subscription revenue. These services remain exposed to payment activity and customer economics.
The reported growth rates also are not fully organic measures. Q4 VAS benefited from Prisma, and the call did not quantify the separate contributions from acquisitions, pricing, underlying volumes, new customers, and attach rates. Pismo, the cloud-based core banking and issuer-processing platform, is distinct from Prisma and should not be conflated with the acquisition contribution cited in quarterly financial results.
VAS is now large enough that its growth substantially influences consolidated guidance. In an illustrative constant-perimeter model, a business representing approximately 30.5% of revenue and growing 23% would contribute about 7 percentage points to consolidated revenue growth. If total revenue grew 11%, the remaining business would need to grow approximately 6% in aggregate. This is not Visa’s disclosed revenue bridge because acquisition scope, currency, and incentive allocation can differ. It nevertheless shows that low-double-digit consolidated growth increasingly depends on sustained strong VAS performance.
Profitability remains a disclosure limitation. Tokenization, risk scoring, issuer processing, consulting, and marketing services have different labor requirements, implementation costs, and incremental margins. The call did not disclose VAS operating profit or margins by portfolio. It is therefore inappropriate to capitalize all VAS growth at a software-like incremental margin.
COMMERCIAL PAYMENTS AND VISA DIRECT
Commercial payments volume grew 13% in Q4, consistent with Q3 and materially faster than overall payments volume growth of 9%. Annual commercial growth of 12%, versus 7% in fiscal 2025, supports the view that Visa is gaining traction in commercial payment use cases rather than relying exclusively on consumer spending.
CMS revenue grew 16%, compared with 17% in Q3 and 19% for the full year. Visa Direct transactions accelerated to 23% growth from approximately 21%. The divergence between faster Visa Direct transactions and slightly slower aggregate CMS revenue growth demonstrates why transaction growth should not be used as a substitute for revenue growth. Product mix, corridor mix, transaction size, pricing, and contract timing all matter.
Visa Direct exceeded 15 billion annual transactions and approximately $1.5 trillion in payment volume. Its reach expanded to more than 18 billion endpoints from 12 billion in fiscal 2025. Endpoint availability increases potential utility, but an addressable endpoint is not an active customer, transaction, or revenue-generating relationship.
The more economically significant disclosure was that more than 40 clients used over 5 Visa Direct use cases during the year. Navy Federal’s planned expansion into additional domestic uses and Wells Fargo’s activation of cross-border payroll, accounts payable, and disbursements suggest deeper integration into customer workflows. Such integrations can improve retention and make Visa harder to replace, although the call did not quantify incremental revenue or profitability from these relationships.
The WEX renewal, fleet expansion, travel offerings, and multinational corporate-card arrangements broaden the commercial opportunity. However, renewals preserve existing business as well as enable new growth. Announced relationships should not be treated entirely as incremental revenue, particularly in a year with substantial incentive commitments.
FISCAL 2027 GUIDANCE AND COMPARISON WITH PRIOR EXPECTATIONS
The latest formal Q4 fiscal 2026 guidance, issued July 28, called for adjusted net revenue growth at the high end of the low-double-digits, operating expense growth in the low-double-digits, and EPS growth at the low end of the mid-teens. Actual adjusted constant-dollar growth was 12% for revenue, 11% for operating expenses, and 16% for EPS. Revenue and expenses were broadly consistent with the plan, while EPS was stronger.
The July forecast also anticipated full-year non-operating expense of approximately $165 million and a tax rate of 18% to 18.25%. Actual results were $141 million and 17.9%, respectively. The favorable full-year earnings outcome therefore included below-the-line assistance, not just stronger operating performance.
At the start of fiscal 2026, management had guided to low-double-digit adjusted revenue and EPS growth, assumed approximately 20% renewal exposure, and expected a tax rate of 18.5% to 19%. Revenue and EPS ultimately exceeded the initial qualitative framework. However, the 15% reported revenue growth should not be directly compared with the initial acquisition-excluded, constant-dollar guide without recognizing currency and acquisition differences. The history supports the possibility of upside to initial assumptions, but does not establish that fiscal 2027 guidance is deliberately conservative.
Fiscal 2027 guidance is an initial forecast, not a reduction to an earlier formal fiscal 2027 outlook. It assumes resilient consumer spending, broadly stable macroeconomic conditions, modest improvement in operating drivers as conflict-related comparisons are lapped, similar pricing benefits, higher incentive growth, and lower volatility than the comparable prior-year periods.
The revenue cadence is not uniform. Q1 adjusted revenue growth is expected to be slightly less than 1 percentage point below Q4’s 12% adjusted growth, principally reflecting the absence of FIFA-related revenue and pricing timing. Q2 is expected to be the annual growth low point because of a strong prior-year comparison and the largest volatility headwind. Pricing becomes more important in the second half.
Operating expense growth is expected to remain in the low-double-digits, “modestly below net revenue growth.” Expense growth should be relatively consistent through the year, with moderation in Q4 as FIFA spending is lapped. This implies modest operating leverage, not a major cost reset. The likely shape is more favorable late in the year, when pricing benefits and easier marketing comparisons overlap.
The tax rate is expected to rise to approximately 19% from 17.9%. Holding pretax earnings constant, that change alone would reduce net income by approximately 1.3%. Non-operating expense of $250 million to $300 million would increase by $109 million to $159 million from fiscal 2026. These headwinds explain part of the gap between strong operating drivers and the more measured EPS outlook.
An illustrative model demonstrates the consistency of the guidance. Applying 11% revenue growth, 10% operating expense growth, $275 million of non-operating expense, a 19% tax rate, and a 2.5% reduction in diluted shares to fiscal 2026 results produces EPS of approximately $14.93, or roughly 12.5% growth. These are analytical assumptions, not management’s numerical guidance, but they show that the outlook does not require either a collapse in pricing economics or substantial unrecognized agentic revenue.
BioCatch is excluded from the acquisition-neutral guidance framework, and management expects to provide its financial impact when the transaction closes. The current forecast should not be supplemented with assumed acquisition accretion before that disclosure.
AGENTIC COMMERCE: STRATEGIC DEFENSE AND OPTIONALITY, NOT A NEAR-TERM EARNINGS DRIVER
Agentic commerce occupied a significant portion of the discussion, but management was appropriately restrained on financial materiality. McInerney repeatedly described adoption as “still very early” and characterized existing activity as a “very small amount” relative to Visa’s business. The fiscal 2027 discussion explicitly did not support a material contribution over the next 4 quarters.
Visa’s proposed role is technically more substantial than simply providing a payment credential at checkout. The architecture links an identifiable user to an authenticated agent, captures authorized purchase intent, applies transaction constraints, and establishes dispute-resolution rules. Agentic tokens can incorporate controls such as time windows, merchant categories, spending limits, and authenticated instructions. These capabilities address the difference between an agent having access to a payment instrument and an agent having valid authority to execute a specific transaction.
The existing tokenization footprint provides a distribution advantage. More than 60% of e-commerce transactions are tokenized, and more than 50% of available credentials have been tokenized. These percentages have different denominators and should not be combined. Nevertheless, they indicate that a significant portion of the required infrastructure already exists.
Approximately 50 AI partners were live and in production, with that number expected to double in the coming months. Shopify’s Shop Pay, Anthropic, Ramp, BILL, and Billtrust provide evidence of ecosystem engagement. However, partner counts do not disclose transaction intensity, exclusive commitments, pricing, or incremental revenue. An integration can be strategically valuable while remaining financially immaterial.
The incremental-volume question remains unresolved. Moving an existing e-commerce purchase from a human-operated interface to an AI agent does not necessarily create additional Visa volume. Potential incremental demand includes machine-to-machine transactions, automated business payments, previously uneconomic small purchases, and higher conversion from reduced friction. Against this, agents could optimize prices, consolidate spending, or route payments toward lower-cost alternatives.
The most defensible near-term investment interpretation is that Visa is reducing the probability that a new commerce interface bypasses its credentials and trust infrastructure. That supports franchise durability. It does not yet justify a separate material revenue forecast or an aggressive valuation premium.
STABLECOINS: EVIDENCE OF COMMERCIALIZATION, WITH UNPROVEN UNIT ECONOMICS
Stablecoin activity showed clearer operational progress than agentic commerce. Visa Direct stablecoin prefunding and cross-border money movement moved from pilot to commercial production, with Inyo Global as the first live partner. Stablecoin settlement exceeded a $25 billion annualized volume run rate, approximately 10 times the prior-year level. Visa supported 10 blockchains and 5 stablecoins for settlement, and more than 225 stablecoin-linked card programs operated across over 50 countries.
These disclosures indicate growing product-market engagement, but their financial interpretation requires discipline. A settlement run rate is not recognized revenue. Circulating stablecoin supply is not Visa-owned cash. Card-program counts do not establish active usage, and a pipeline of more than 300 partners is not equivalent to contracted revenue.
Open USD’s reported supply of more than $800 million by October 15 demonstrates initial circulation, but the call did not disclose Visa’s reserve-income participation, revenue share, operating costs, or associated balance-sheet obligations. No defensible earnings estimate can be derived from that supply figure alone.
Management’s statement, “we are stablecoin agnostic. We are blockchain agnostic,” clarifies the strategic approach. Visa is seeking to provide interoperability, compliance, distribution, settlement, and orchestration across multiple assets and networks rather than depend on the success of a single proprietary token.
Stablecoins can improve cross-border liquidity management and reduce prefunding friction. They may also lower conversion and intermediation economics in some existing corridors. The net opportunity therefore depends on whether Visa captures new flows and service fees faster than pricing compresses in affected legacy activities. The call supplied adoption evidence, but not the unit economics necessary to resolve that trade-off.
CYBERSECURITY, PISMO, AND THE ECONOMIC CONTENT OF “TRUST”
The description of trust as “the next growth vector for Visa” has economic substance only to the extent that it translates into separately monetizable capabilities or stronger retention. The call identified several such capabilities: threat intelligence, identity and behavioral analysis, transaction risk scoring, tokenization, authorization resilience, and cybersecurity advisory.
Visa’s potential advantage comes from payment-specific data, established financial-institution relationships, distribution, and integration into transaction workflows. These assets can be particularly valuable where fraud signals cross institutions or payment methods. However, payment-network scale does not automatically confer leadership across every cybersecurity category. Competition remains fragmented, and the call did not provide product-level market shares, win rates, or margins.
BioCatch would extend Visa further upstream into account behavior and identity signals, addressing fraud before it reaches the payment authorization stage. The company disclosed a $2.4 billion cash purchase price and an expected closing by the end of fiscal Q2 2027, subject to approvals. Its reported reach across more than 1.8 billion devices, 760 million users, and over 100 large banks indicates significant distribution, but those figures do not establish the acquisition’s return on invested capital.
The acquisition’s economics remain open because revenue, profitability, integration costs, and expected synergies were not disclosed in the call. Funding a purchase with cash also creates an opportunity cost through lower interest income or reduced repurchase capacity. Acquisition-neutral guidance should not obscure those eventual effects on reported earnings and cash allocation.
Pismo expands Visa’s role in core banking and issuer processing. New client signings across 28 countries during the year suggest that Visa’s distribution is helping international expansion. The US opportunity is more nuanced: management described a combined DPS and Pismo proposition for smaller and middle-market institutions, while large-bank core banking opportunities tend to involve separate buying decisions.
Core-platform migrations are operationally sensitive and can have long implementation cycles. Geographic signings are therefore more informative about the pipeline than immediate revenue realization. Pismo can increase strategic relevance and switching costs, but the call did not establish rapid displacement of major incumbent processors.
NETWORK SCALE, PRODUCTIVITY, AND CHINA
Visa ended the year with 5.2 billion credentials, approximately 6% growth, and described acceptance across more than 400 million seller and wallet locations. The latter includes substantial wallet-enabled reach and should not be interpreted as 400 million directly acquired, unique physical merchant sites. The relevant monetization variables remain active usage, processing penetration, transaction mix, and service attachment.
Tap to Pay reached nearly 85% of global face-to-face transactions and 75% in the US. Tap to Phone exceeded 25 million active Visa-accepting mobile devices and 1 billion annual transactions, with 30% of participating sellers new to the ecosystem during the year. The strongest incremental opportunity is where lower-cost acceptance brings cash-based sellers into electronic payments, rather than where contactless simply replaces another card interaction.
Global processing penetration of approximately 80% leaves room for additional processing growth, but the residual opportunity is not automatically accessible. Local infrastructure, regulation, domestic schemes, client arrangements, and competing payment methods can limit conversion.
AI-enabled development may improve product velocity. More than 60% of product development and engineering teams had adopted the new agentic tool chain, and Visa delivered more than 350 product releases, up 25%. The stablecoin-platform implementation completed in 7 weeks by 12 people provides an example of speed, but not an independently quantified enterprise-wide productivity gain. No comparable project-cost baseline or net savings estimate was disclosed.
The financial evidence favors a reinvestment interpretation. Fiscal 2026 adjusted expenses grew faster than revenue, and fiscal 2027 calls for only modest operating leverage. Faster development can improve competitive positioning without producing immediate margin expansion, particularly when savings are redirected into additional products, security, and distribution.
China represents a potentially important longer-duration opportunity, but the regulatory distinction is essential. Approval to begin preparations for domestic processing is not equivalent to final operating authorization, live domestic transaction processing, or a disclosed revenue launch date. The call does not support a material fiscal 2027 China earnings contribution.
CASH GENERATION AND CAPITAL ALLOCATION
Q4 cash generation was strong. Operating cash flow was $7.386 billion, capital expenditure was $493 million, and free cash flow was $6.893 billion. Quarterly free cash flow represented approximately 105% of non-GAAP net income. Share repurchases and dividends totaled approximately $5.24 billion, below quarterly free cash flow.
The full-year picture was more mixed. Operating cash flow increased approximately 2.9% to $23.728 billion, while capital expenditure increased to $1.671 billion from $1.482 billion. Free cash flow rose only approximately 2.2% to $22.057 billion, materially below revenue and EPS growth.
Free cash flow represented approximately 87% of non-GAAP net income, compared with approximately 96% in fiscal 2025. Using annual diluted shares, analytical free cash flow per share increased approximately 5.4%, substantially less than EPS. The difference is important because the valuation ultimately rests on distributable cash, not only adjusted earnings.
The cash-flow statement identifies a major timing and litigation component. Changes in accrued litigation reduced operating cash flow by $2.040 billion, compared with a $1.303 billion increase in the prior year. Cash taxes also increased. These movements mean that the slower cash growth should not automatically be classified as deterioration in the payment business, but neither should it be ignored or assumed to reverse immediately.
Full-year share repurchases and dividends totaled approximately $25.6 billion, or roughly 116% of free cash flow. Cash and investment securities declined, while approximate net debt increased to $7.9 billion from $5.2 billion, excluding restricted escrow and customer collateral. Financial capacity remains substantial relative to earnings, but fiscal 2026’s capital return exceeded internally generated free cash flow.
The 16% dividend increase to $0.78 quarterly implies an annualized dividend of $3.12, approximately 24% of fiscal 2026 non-GAAP EPS. Dividend coverage is comfortable. Buybacks are the more flexible variable, particularly with the pending $2.4 billion BioCatch purchase and higher expected non-operating expense.
The $405 million litigation escrow contribution has an economic effect on diluted EPS similar to repurchasing Class A shares because it reduces the as-converted Class B share count. It is not a cash distribution to Class A shareholders and should not be described interchangeably with an ordinary open-market repurchase. The retrospective responsibility mechanism protects Class A economics for specified litigation, but does not eliminate all legal, regulatory, or business-model risk.
COMPETITIVE AND REGULATORY IMPLICATIONS
The spending data provide a constructive demand signal for other diversified payment networks and processors. However, Visa’s pricing actions, client incentives, acquired businesses, and services mix are company-specific. Strong Visa results do not independently establish market-share gains against Mastercard or equivalent earnings upside for other payment companies.
Visa’s expansion into issuer processing, core banking, risk management, and payment orchestration increases competitive overlap with established processing and financial-technology vendors. The disclosed progress supports a stronger long-term competitive position, but the call did not quantify enough displaced revenue to justify immediate earnings reductions for specific competitors.
Regulatory exposure remains material because monetization is increasingly important to growth. Pricing restrictions, routing requirements, merchant challenges, or changes in network rules could affect revenue without requiring a deterioration in underlying spending. The continued size of litigation charges also demonstrates that legal costs are not merely theoretical, even when excluded from adjusted earnings.
Distribution partners create both opportunity and bargaining risk. Banks, large merchants, wallets, payment facilitators, and AI platforms can expand Visa’s reach, but powerful intermediaries can also demand greater economics. The 2027 renewal cycle is therefore a direct test of whether broader services strengthen Visa’s negotiating position or simply broaden the revenue pool being shared.
INVESTMENT SCENARIOS AND VALUATION SENSITIVITY
A base case with an illustrative 60% probability assumes resilient spending, cross-border growth remaining comfortably positive, successful major renewals, VAS growth consistent with the low-to-mid-20% outlook, and modest operating leverage. An analytical EPS growth range of 11% to 13% would imply approximately $14.73 to $15.00 using fiscal 2026 EPS of $13.27. These are scenario assumptions, not a numerical restatement of management’s qualitative guidance.
A bull case with an illustrative 25% probability assumes stronger travel recovery, VAS growth above the initial outlook, favorable tokenization adoption, and better retained economics on renewals. EPS growth of 15% to 18% would imply approximately $15.26 to $15.66. The strongest evidence for this case would be improved revenue realization and profit conversion, not simply additional agentic or stablecoin partnership announcements.
A bear case with an illustrative 15% probability assumes weaker spending or travel, higher-than-planned incentives, disappointing services normalization, and limited expense flexibility. EPS growth of 0% to 5% would imply approximately $13.27 to $13.93. A recession, significant regulatory remedy, or major operational incident could produce an outcome below this range; this is not a worst-case valuation.
The probabilities are judgmental and have only moderate confidence because renewal terms, current valuation, and the complete forward consensus distribution are unavailable. They are useful for separating operating outcomes, but do not establish a reliable expected stock return.
Multiple risk remains significant even if the base earnings case is achieved. EPS growth of 12% combined with a 10% decline in the valuation multiple produces approximately 0.8% price appreciation before dividends. The same EPS growth with a 20% multiple decline produces approximately 10.4% price downside. Strong business growth does not remove entry-price risk.
The supplied analyst distribution of 46 buys, 2 holds, and 0 sells indicates broad agreement on business quality, not proof of attractive valuation. A contemporaneous share price and verified fiscal 2027 consensus are required for a defensible absolute price target, entry level, or conclusion that guidance materially exceeded or disappointed market expectations.
CATALYSTS, REVIEW TRIGGERS, AND PORTFOLIO IMPLICATIONS
The first major catalyst is fiscal Q1 performance and confirmation that post-FIFA activity remains strong. The next is fiscal Q2, when the largest volatility headwind and strongest comparison should test the durability of the annual plan. Second-half pricing implementation and major client renewals are the most important operating catalysts for fiscal 2027 earnings revisions.
BioCatch’s expected closing by the end of fiscal Q2 should provide the first meaningful opportunity to evaluate acquisition economics and reported earnings effects. China authorization milestones and agentic transaction adoption are strategic catalysts, but should remain secondary to renewal profitability and services growth until financial materiality is demonstrated.
Visa will discontinue monthly driver disclosures after fiscal Q1 and return to quarterly reporting. This does not itself indicate weakening trends, but it reduces external visibility into inflections and increases uncertainty around geopolitical events, travel changes, and spending deceleration. Management’s commitment to discuss meaningful intra-quarter developments partially mitigates, but does not eliminate, the loss of regular data.
The positive thesis would weaken if acquisition-adjusted revenue growth fell sustainably below double digits beyond the anticipated comparison-related trough, if issuing, acceptance, and risk services failed to sustain the expected growth, or if larger incentives prevented revenue gains from translating into operating profit. Continued deterioration in cash conversion after identifiable litigation and timing effects would also warrant reassessment.
Portfolio exposure should be understood as a combination of global consumption, cross-border travel, pricing power, and quality-growth valuation sensitivity. Visa can diversify direct technology capital-spending exposure, but it is not independent of economic activity, interest rates, or broad growth-equity multiple compression. Adding Visa alongside other payment networks and processors increases overlapping spending and regulatory exposure.
The call alone does not justify incremental gross exposure. A 6-to-12-month underwriting horizon should focus on the renewal cycle and second-half pricing realization. No portfolio-specific allocation is supportable without the existing holdings and valuation. As an illustrative risk framework, a 30-basis-point portfolio loss budget paired with a 15% price-based exit threshold would cap an unhedged position at 2% of net asset value, before allowing for gaps or execution slippage. Fundamental deterioration should trigger reassessment before that price threshold is reached.
The central investment conclusion is that Visa’s strategic position strengthened more than its near-term earnings surprise. The company is successfully broadening the services attached to payments and preserving relevance across new transaction architectures. The outstanding question is whether these capabilities generate enough retained economic value to offset greater client bargaining demands, normalization of event-related growth, and continued reinvestment. Fiscal 2027 should be judged primarily on that conversion, not on the volume of product announcements.
SOURCE BASIS AND COMPARABILITY
Financial comparisons reflect Visa’s October 27, 2026 earnings release and presentation, the supplied Q4 earnings-call transcript and Bloomberg earnings notice, Visa’s July 28, 2026 presentation and earnings-call transcript, and the October 28, 2025 earnings-call transcript. Growth rates are year-over-year unless identified otherwise. Guidance is non-GAAP, constant-dollar, and acquisition-adjusted unless specifically stated. VAS and CMS are management growth-engine classifications and should not be added to service, data processing, international transaction, and other revenue, which are different classifications of the same consolidated revenue base. Scenario probabilities, sensitivities, and normalized earnings calculations are analytical assumptions rather than company guidance.
COMPANY EMPLOYEES ON THE CALL
• Ryan McInerney, Chief Executive Officer. • Chris Suh, Chief Financial Officer. • Jennifer Como, Senior Vice President and Global Head of Investor Relations.
RESEARCH ANALYSTS ON THE CALL
• Sanjay Sakhrani, KBW. • James Faucette, Morgan Stanley. • Kenneth Suchoski, Autonomous Research. • Bill Carcache, Piper Sandler. • Timothy E. Chiodo, UBS. • Bryan Keane, Citi. • Darrin Peller, Wolfe Research. • Jason Kupferberg, Wells Fargo. • Rayna Kumar, Oppenheimer. • Harshita Rawat, Bernstein. • Andrew Jeffrey, William Blair. • Tien-Tsin Huang, J.P. Morgan.
Key Read-Throughs
KEY READ-THROUGHS FROM VISA’S Q4 FISCAL 2026 EARNINGS CALL
Visa’s October 27, 2026 call provides a constructive signal for payment networks, international travel, and premium consumer spending, but a more selective signal for financial technology. The most actionable distinction is between strong transaction demand and the economics retained by individual intermediaries. Cross-border activity accelerated, yet currency-related revenue realization weakened; commercial payments expanded, yet individual processors can still underperform; and new AI and stablecoin infrastructure increasingly incorporates established payment platforms rather than simply replacing them. The strongest negative implications concern competition in bank processing and assumptions that stablecoin adoption automatically creates attractive issuer economics. The assessments below distinguish confidence in the transmission mechanism from the size of any earnings change. Magnitudes describe business implications, not predicted stock-price moves. Country labels denote corporate domicile.
PAYMENT NETWORKS
MASTERCARD BENEFITS FROM STRONGER CROSS-BORDER DEMAND, BUT A VOLUME BEAT NEED NOT BECOME A REVENUE BEAT (READ-THROUGH 1)
Affected company: Mastercard (MA: United States). Direction and magnitude: Moderately positive for near-term payment activity, with a meaningful offset from currency-related revenue and customer incentives.
Visa’s cross-border volume excluding intra-Europe increased 14%, versus approximately 12% in Q3. Travel accelerated to 13% from 10%, while cross-border e-commerce increased 17%. Through October 21, total cross-border growth strengthened to 15%, and US payments volume remained up 10%. These observations support a healthy shared demand environment immediately ahead of Mastercard’s scheduled October 29 results.
The transmission mechanism is direct: greater international spending generates additional cross-border assessments, processing activity, and demand for associated fraud, authentication, and payment services. Sustained October activity is particularly useful because it indicates that strength did not disappear when the FIFA tournament ended. This reduces the likelihood that strong summer payment activity was entirely event-dependent.
However, Visa’s international transaction revenue increased only approximately 8%, materially below cross-border volume growth, because of lower volatility and mix. This is relevant to Mastercard rather than merely a Visa accounting issue. Mastercard’s July 30 call also identified “lower revenue from FX volatility” as an offset within transaction processing assessments. Currency translation and revenue earned from currency-related activity are separate exposures: currency-neutral reporting does not eliminate the latter.
Customer economics provide another constraint. Visa’s incentives increased 21%, while Mastercard’s Q2 payment-network rebates and incentives had already increased 20% on a currency-neutral basis. Strong volumes therefore do not establish proportionate net revenue or profit upside.
Near-term catalyst: Mastercard’s October 29 report and its quarter-to-date operating metrics. The strongest positive signal would be healthy cross-border activity accompanied by resilient revenue realization and manageable incentive growth. Longer duration, the call supports continued network relevance and services demand, but Visa’s 31% VAS growth should not be transferred to Mastercard or interpreted as evidence of Mastercard share loss. Portfolio exposure to both networks remains highly correlated through global spending, travel, and client bargaining dynamics.
ONLINE TRAVEL AND DISTRIBUTION
IMPROVING INTERNATIONAL TRAVEL IS MORE INCREMENTAL FOR BOOKING THAN ANOTHER GENERIC “RESILIENT CONSUMER” SIGNAL (READ-THROUGH 2)
Affected companies: Booking Holdings (BKNG: United States) and Expedia Group (EXPE: United States). Direction and magnitude: Moderately positive for international booking demand, with the clearest incremental signal for Booking.
Visa attributed the acceleration in travel-related cross-border growth from 10% to 13% primarily to improved CEMEA inbound and outbound activity. Travel growth remained 13% through October 21. This matters because Booking’s June-quarter filing explicitly identified the Middle East conflict, elevated airfares, reduced capacity on certain routes, and weaker long-haul international travel as constraints. Booking’s room-night growth had slowed to approximately 5%.
The transmission mechanism is improved travel conversion and gross booking value across accommodation and associated travel services. If international travelers encounter fewer disruptions or regain confidence, deferred trips can convert into reservations, generating agency commissions and merchant revenue. The incremental value of Visa’s disclosure is the improvement in a previously constrained geographic component, not merely confirmation that global tourism remains active.
Expedia also benefits through its consumer brands and B2B distribution business. However, its Q2 results were already strong, with gross bookings increasing 12%, revenue increasing 14%, and B2B revenue increasing 23%. Visa’s data therefore provide more corroboration of Expedia’s momentum than evidence of a newly emerging acceleration.
The financial translation requires restraint. Cross-border payment growth is a spending measure, not a room-night measure. It includes airfare, restaurants, shopping, pricing, and shifts in payment behavior. Visa’s reported increase of more than 20% in inbound card-present spending in US host cities during part of July is not a forecast for aggregate hotel revenue or online travel agency earnings.
Near-term catalysts: Booking’s November 3 results and Expedia’s November 4 results, particularly international room nights, booking windows, cancellations, and fourth-quarter commentary. Longer duration, sustained recovery in international travel would support transaction revenue and operating leverage. The principal cross-portfolio implication is that payment-network and online-travel longs share a common travel-demand factor; they should not be treated as independent diversification.
BANK TECHNOLOGY AND ISSUER PROCESSING
PISMO’S DISTRIBUTION EXPANSION RAISES THE COMPETITIVE HURDLE FOR INCUMBENT BANK PROCESSORS (READ-THROUGH 3)
Affected companies: Fidelity National Information Services (FIS: United States) and Fiserv (FISV: United States). Direction and magnitude: Negative for longer-duration competitive positioning and renewal economics; limited demonstrated near-term earnings impact.
Visa reported Pismo client signings across 28 countries during fiscal 2026, almost double the previous year’s geographic footprint. Management described demand for both core banking and issuer processing and stated that geographic expansion opportunities had “exceeded my expectations.” In the US, Visa identified a combined DPS and Pismo offering for smaller and middle-market institutions, with separate core-banking opportunities among larger banks.
The transmission mechanism is increased competition for new implementations, modernization projects, and contract renewals. Visa can bring an existing network relationship, credentials, processing, risk products, and commercial-payment capabilities into the same client discussion. That broader distribution position can make a cloud-native platform more credible than a standalone technology vendor with limited banking relationships.
For FIS, the exposure includes the former TSYS issuer-processing business acquired from Global Payments in January 2026, now marketed as FIS Total Issuing Solutions. The competitive exposure belongs to FIS, rather than to the former owner of that business. For Fiserv, the relevant businesses are issuer processing and bank account processing, not simply merchant acquiring.
The likely economic pressure appears first in sales-cycle competition, implementation spending, product investment, and renewal concessions. Revenue displacement would generally follow later because bank migrations are operationally sensitive and existing contracts provide substantial inertia. Geographic signings are not equivalent to completed migrations or lost incumbent revenue.
Counterevidence remains important: FIS reported 6.1% pro forma Banking Solutions revenue growth in Q2. Visa’s progress therefore does not establish that incumbent revenue is already deteriorating because of Pismo. Both incumbents also possess substantial installed bases and modernization capabilities.
Near-term catalyst: Fiserv’s November 3 report and subsequent bank-technology disclosures concerning bookings, renewal pricing, and implementations. Longer duration, the competitive implication is moderate and adverse, particularly if Visa converts geographic expansion into production deployments. No quantified earnings reduction is justified without named migrations, implementation dates, or contract economics.
COMMERCIAL PAYMENTS AND FINANCIAL WORKFLOW SOFTWARE
WEX’S VISA RENEWAL PROTECTS DISTRIBUTION, BUT STRONG INDUSTRY VOLUMES RAISE THE BAR FOR ITS OWN RECOVERY (READ-THROUGH 4)
Affected company: WEX (WEX: United States). Direction and magnitude: Modestly positive for corporate-payments franchise durability; potentially meaningful at the segment level but smaller for the consolidated company.
Visa disclosed, “We recently renewed our global agreement with WEX to enable B2B travel and solutions for their corporate clients.” The same call reported commercial payments volume growth of 13%, compared with 9% for total payments volume.
The direct benefit is continuity of network access and acceptance for WEX’s commercial and travel-payment offerings. Virtual-card and corporate-payment products require reliable acceptance, transaction processing, and integration with customer workflows. A renewed global agreement protects that infrastructure and supports future product distribution.
The distinction between protection and incremental growth is essential. Visa did not disclose additional committed volume, exclusivity, contract duration, incentive payments, or improved economics for WEX. The renewal cannot be treated as a new revenue award or an automatic margin benefit.
WEX’s own recent results provide an important counterpoint. Q2 Corporate Payments purchase volume declined 3.6%, although segment revenue increased 5.8% and total processed volume increased 4.5%. Corporate Payments represented approximately 17% of consolidated revenue. Visa’s strong commercial volume therefore does not establish that WEX’s interchange-generating volume has already recovered.
The more actionable implication is diagnostic: if WEX continues to report weak purchase volume despite a strong broader commercial-payments environment, customer mix, timing, execution, or competitive positioning become more important explanations than generalized macro weakness. Conversely, recovery in purchase volume would combine with a renewed network relationship to strengthen confidence in the segment.
Near-term catalyst: WEX’s scheduled October 28 results and October 29 conference call, particularly purchase volume, net interchange yield, and travel-client commentary. Longer duration, the renewal is a positive franchise-maintenance event, but sustained value creation requires growth in monetized volume rather than only gross processed activity.
BILL’S AGENTIC PILOT TARGETS PAYMENT CAPTURE, NOT AN UNPROVEN INCREASE IN BUSINESS SPENDING (READ-THROUGH 5)
Affected company: BILL Holdings (BILL: United States). Direction and magnitude: Positive for product differentiation and payment monetization over time; currently small and unquantified for earnings.
Visa stated that BILL’s payment agent is piloting Visa Intelligent Commerce to pay invoices, while Billtrust’s supplier portal identifies the agent and accepts the payment. The October 20 joint announcement described a live pilot using tokenized credentials, approved buyer instructions, agent registration, and authenticated supplier-portal access.
The precise commercial opportunity is removal of the manual step between invoice approval and payment execution. Supplier portals can require users to authenticate, enter card details, and complete workflows that otherwise prevent end-to-end automation. An authorized agent can preserve the approved instructions while completing that final payment step through BILL’s workflow.
This matters because BILL is economically more than a subscription-software business. In its June quarter, transaction fees were $324.3 million of $436.2 million in total revenue, approximately 74%. Capturing more payments within its platform can therefore matter more than simply increasing software usage.
The potential financial channels are additional retained payment volume, stronger customer retention, and improved payment-method monetization where suppliers accept the relevant card product. None is automatic. Automating an existing BILL card payment may improve customer experience without generating incremental transaction revenue, and the pilot does not give agents authority to create new purchasing budgets.
The distinction between BILL and Billtrust also matters: the publicly listed exposure is BILL Holdings. The call does not establish a separate listed investment in Billtrust.
Near-term catalyst: BILL’s November 5 report and commentary on pilot expansion. The initiative was announced October 20, so there is no basis to attribute September-quarter revenue outperformance to that announcement. The call confirms an already public pilot rather than announcing a new contract. Longer duration, the positive implication is that agentic technology can reinforce an established financial workflow platform instead of necessarily disintermediating it.
STABLECOIN INFRASTRUCTURE
VISA VALIDATES STABLECOIN UTILITY WHILE LIMITING THE CASE FOR EXCLUSIVE ISSUER ECONOMICS (READ-THROUGH 6)
Affected company: Circle Internet Group (CRCL: United States). Direction and magnitude: Positive for USDC’s commercial relevance, but negative for assumptions of exclusive distribution or automatic earnings capture. Near-term earnings implications remain limited; the competitive implications are more important over multiple years.
Visa reported a stablecoin settlement run rate exceeding $25 billion annually, approximately 10 times the prior-year level. Visa Direct stablecoin prefunding moved into commercial production, initially using USDC. These developments validate the practical use of stablecoins in institutional payments and liquidity management.
However, management explicitly stated, “we are stablecoin agnostic. We are blockchain agnostic.” Visa supports 5 stablecoins and 10 blockchains for settlement, intends to add currencies to Visa Direct, and plans broader integration of Open USD, whose circulation had surpassed $800 million by October 15.
The economic implication is that access to Visa’s distribution does not require exclusive dependence on USDC. Multiple supported assets give financial institutions and payment providers alternatives based on liquidity, jurisdiction, currency, economics, and operational requirements. This strengthens the bargaining position of distributors and infrastructure providers relative to any individual issuer.
Circle’s financial model makes the distinction between volume and value capture particularly important. Its Q2 reserve income was approximately $668 million out of $701 million of total revenue and reserve income, roughly 95%. USDC on-chain transaction volume increased 151%, while total revenue and reserve income increased only 7%. Average balances, reserve yields, and distribution payments were more important to earnings than transaction throughput alone.
Visa’s $25 billion settlement run rate therefore cannot be translated directly into Circle revenue. It also cannot all be assigned to USDC because Visa supports multiple stablecoins. Greater transaction velocity can increase utility without requiring an equivalent increase in average outstanding balances.
Near-term trading implication: Visa’s announcements can support stablecoin sentiment, but they do not independently justify a Circle earnings upgrade. Subsequent financial updates should be evaluated through average USDC circulation, reserve yields, and retained economics after distribution costs. Longer duration, multi-issuer interoperability is a credible competitive constraint on exclusivity and pricing-power assumptions, not evidence that USDC adoption is failing.
E-COMMERCE INFRASTRUCTURE
SHOP PAY’S PRODUCTION INTEGRATION SUPPORTS SHOPIFY’S ROLE EVEN IF AI AGENTS CONTROL SHOPPING DISCOVERY (READ-THROUGH 7)
Affected company: Shopify (SHOP: Canada). Direction and magnitude: Positive for longer-duration franchise durability; small and unquantified for near-term earnings.
Visa disclosed nearly 50 AI partners live in production, “including more recently Shopify’s Shop Pay,” and expected the partner count to double in the coming months. The call also described the infrastructure needed to authenticate users and agents, capture purchase intent, and resolve disputes.
The significant transmission mechanism is preservation of the transaction layer when the shopping interface changes. Consumers may discover and select products through an AI agent rather than a conventional storefront, but merchants still require product infrastructure, checkout, payment credentials, order handling, and settlement. Shop Pay’s participation supports Shopify’s ability to remain embedded in that transaction even when discovery occurs elsewhere.
Where purchases continue through Shopify Payments or other monetized Shopify channels, this can protect payment revenue and merchant attachment. The less obvious positive is defensive: agentic commerce need not eliminate Shopify’s economic role merely because it changes who controls the customer-facing interface.
The call does not establish incremental gross merchandise volume. An agent completing a purchase that would otherwise have occurred manually is channel migration, not necessarily additional demand. Nor does a production partnership disclose revenue sharing, exclusivity, payment take rates, or the cost of supporting agentic transactions.
Management’s caution is therefore important. Visa repeatedly described agentic commerce as “still very early” and financially small relative to its business. Production readiness is stronger evidence than a conceptual partnership, but materially weaker evidence than demonstrated revenue contribution.
Near-term catalyst: Shopify’s November 3 results, particularly payment penetration, merchant-solutions economics, and any quantified agentic adoption. Longer duration, the integration supports continued relevance of Shopify’s commerce and payment infrastructure. It does not establish that AI-driven transactions will generate higher margins than existing checkout activity.
PREMIUM CONSUMER FINANCE
AFFLUENT SPENDING SUPPORTS AMERICAN EXPRESS, BUT VISA DOES NOT VALIDATE LOWER CREDIT LOSSES (READ-THROUGH 8)
Affected company: American Express (AXP: United States). Direction and magnitude: Modestly positive for forward spending and discount-revenue assumptions; limited incremental near-term surprise because American Express has already reported.
Visa’s US credit volume increased 11%, the highest-spending cohort continued to grow fastest, and cross-border travel increased 13%. Management also stated, “We did not see signs of the lower-spend consumer weakening in our volumes.” October US credit growth remained 11%, indicating that the spending signal extended beyond the September quarter.
The direct earnings channel for American Express is billed business and the associated discount revenue generated by merchant spending. Strength in premium consumers and travel is particularly relevant to its customer proposition. Sustained activity also supports engagement with premium cards and the perceived value of their benefits.
This is primarily corroboration and a forward update, not a forecast of an unreported quarter. American Express released Q3 results on October 23, reporting approximately $454 billion of billed business, up 8%, and revenue growth of 9%. Visa’s subsequent October data reduce concern about an abrupt deterioration entering Q4, but do not create a new Q3 earnings catalyst.
The credit inference must remain separate. Visa’s lower-spending cohort is not the same as a household-income or credit-risk cohort, and Visa does not observe the full borrower balance sheet. Strong card spending can coexist with increased borrowing, reduced savings, or higher future delinquencies. No reduction in American Express credit-loss assumptions is supported by this call alone.
Profit conversion also depends on rewards, marketing, customer benefits, funding costs, and credit provisions. Higher spending is favorable, but not equivalent to proportionate EPS growth.
Near-term catalyst: American Express’s next spending and guidance update rather than its already completed Q3 release. Longer duration, the call reinforces the resilience of premium spending and travel-linked payment franchises. The cross-portfolio implication is concentration: American Express, the major card networks, and international travel platforms share exposure to affluent consumption and travel, despite operating in different industry classifications.
Report record
- Sector
- Financials
- Industry
- Financial Services
- Fiscal period end
- September 30, 2026
- Report date
- October 27, 2026
- Analysis
- 6418 words
- Read-throughs
- 2800 words
- Content fingerprint (PDF)
8f3e04cb54a3- Content fingerprint (analysis)
1ab5df6d2ead- Content fingerprint (read-throughs)
5817a7a8c5d6
Prepared from the company's earnings release and earnings call transcript. Figures as reported by the company. For information only. Not investment advice.
More from Visa
No other reports yet.
More in Financials
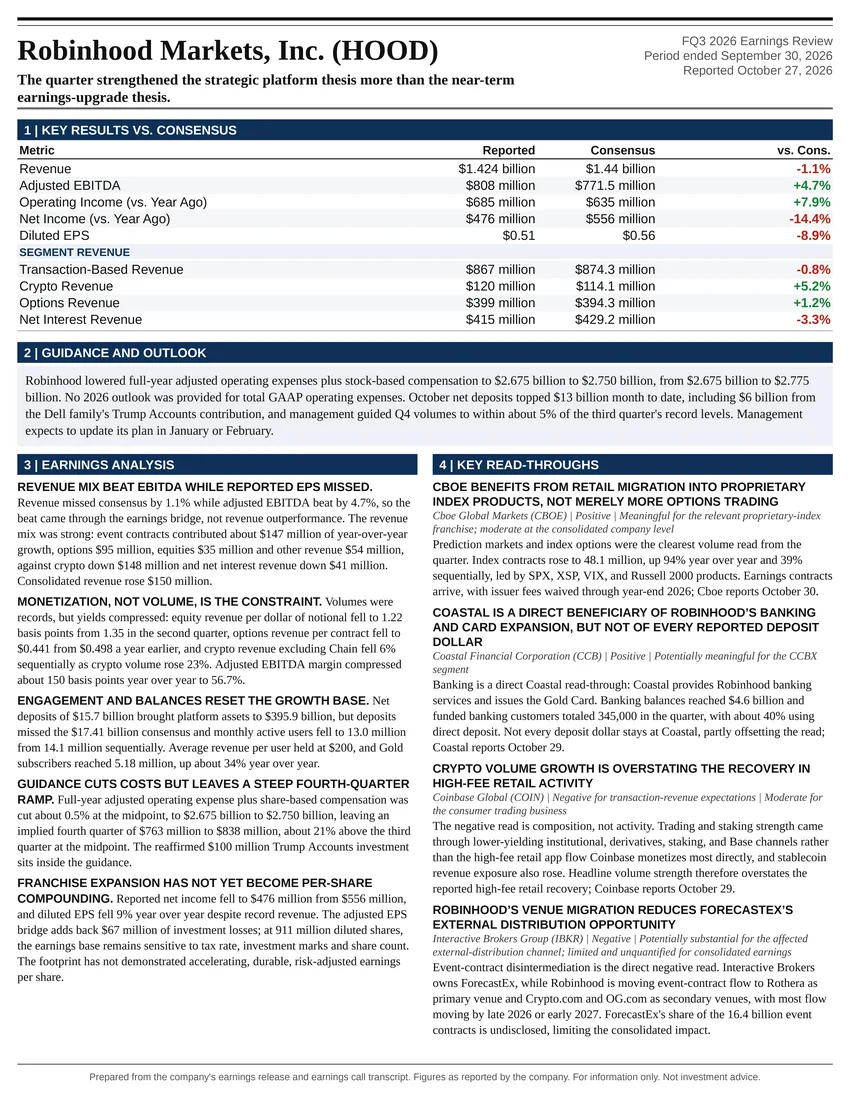
The quarter strengthened the strategic platform thesis more than the near-term earnings-upgrade thesis.
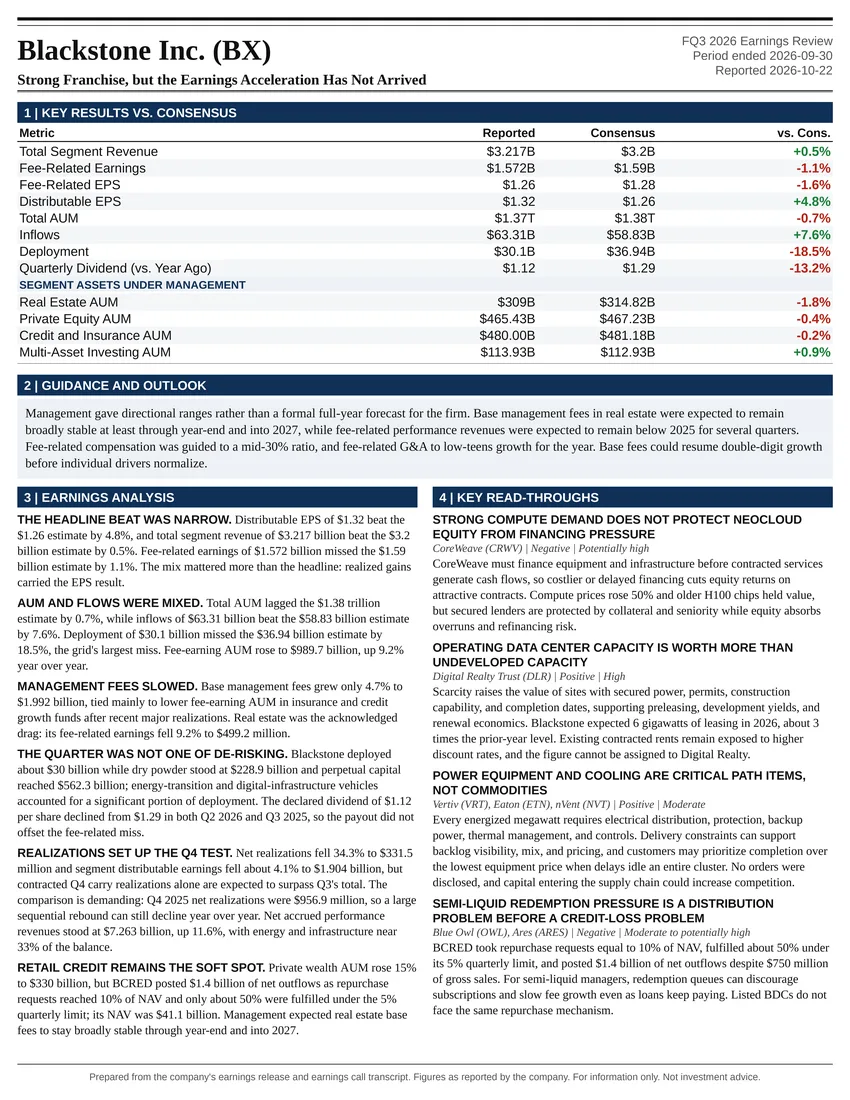
Strong Franchise, but the Earnings Acceleration Has Not Arrived
Follow @AtlasPeakRes on X for new earnings reports as they publish.