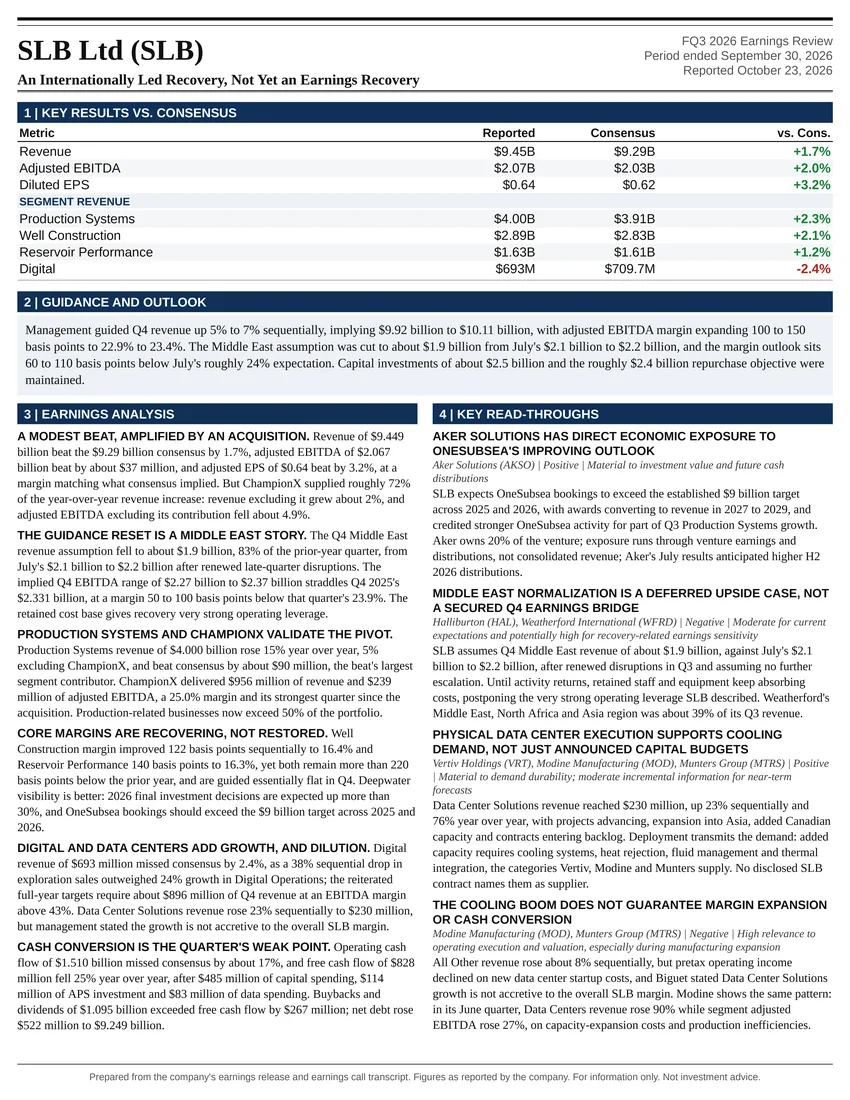
An Internationally Led Recovery, Not Yet an Earnings Recovery
Earnings Reports
Weatherford International FQ3 2026 Earnings Report
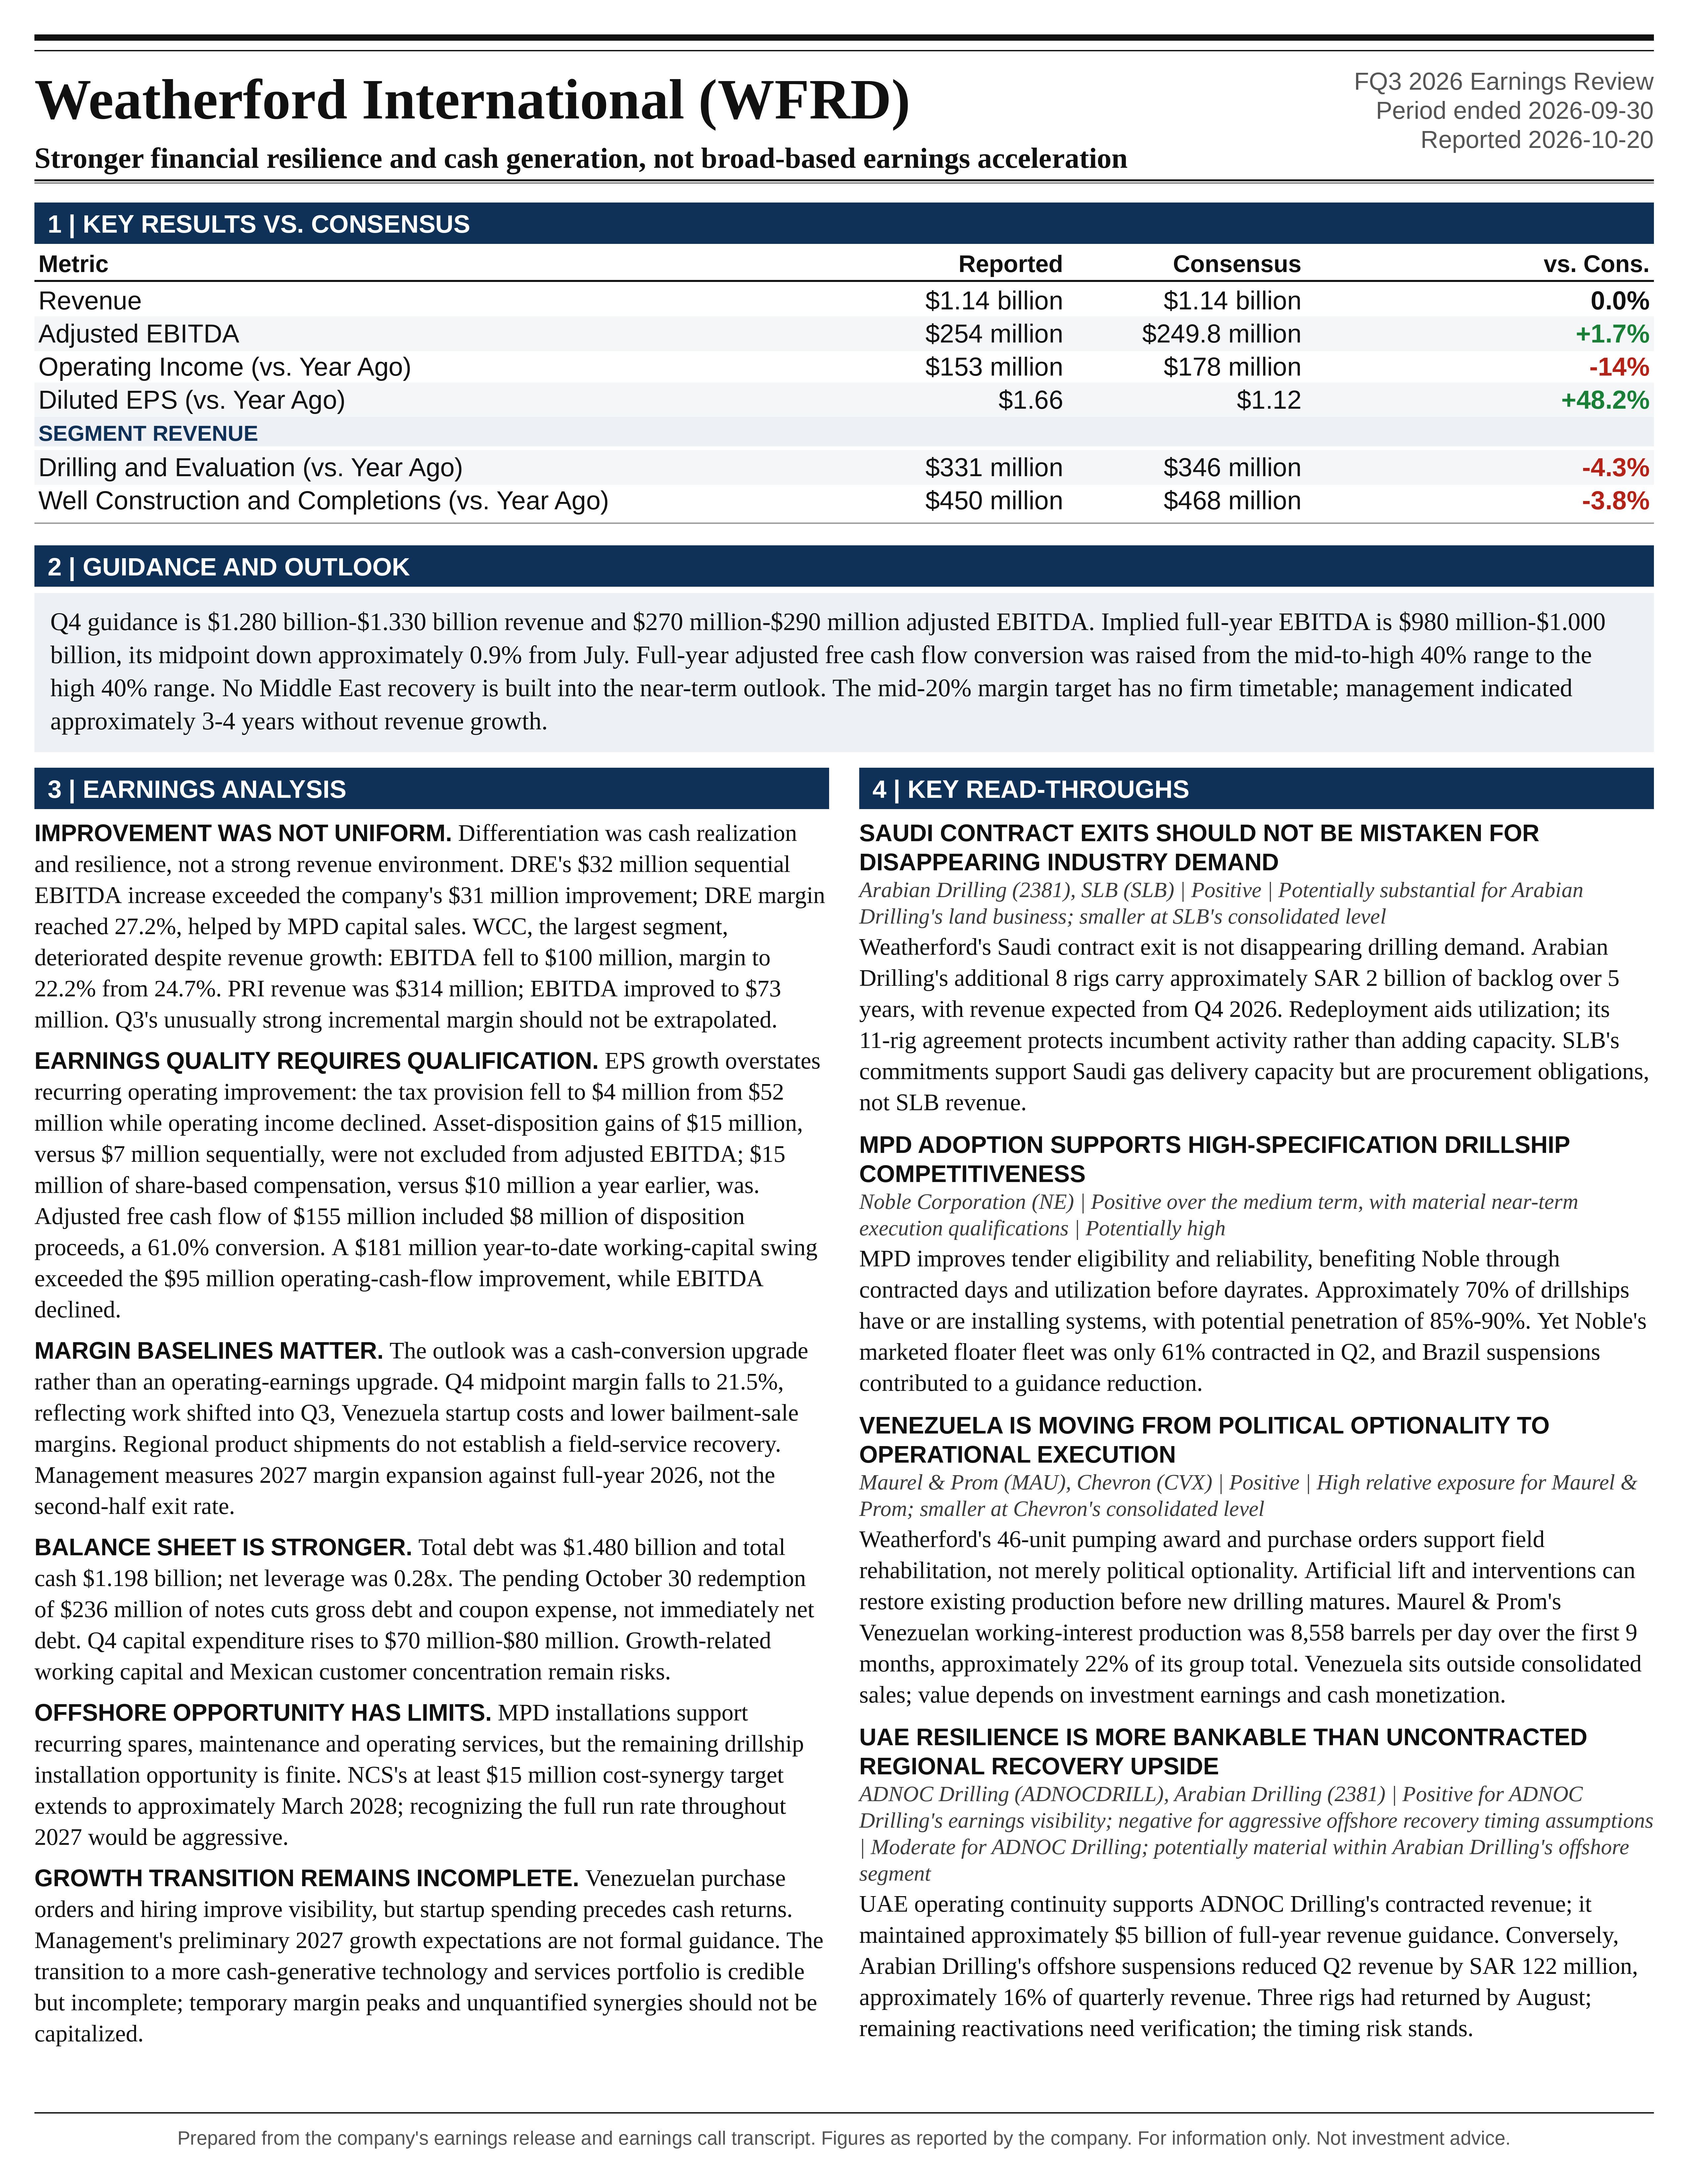
Weatherford International (WFRD) FQ3 2026 earnings: Stronger financial resilience and cash generation, not broad-based earnings acceleration. Full earnings analysis, key read-throughs, and the one-page exhibit from Atlas Peak Research.
Weatherford International (WFRD)
Sector: Energy · FQ3 2026 · Period end September 30, 2026 · Reported October 20, 2026
Weatherford’s Q3 results support a constructive, valuation-disciplined investment stance. The quarter strengthened the evidence that the company can protect profitability and generate substantial cash through an adverse operating environment. However, the results do not establish a broad-based earnings acceleration.
Download the one-page report (PDF)
View one-page exhibit
Download analysis (.md)
Download read-throughs (.md)
Post to X
One-Page Exhibit
Earnings Analysis
EXECUTIVE CALL SUMMARY: Weatherford International PLC (10/21/26)
Weatherford’s Q3 results support a constructive, valuation-disciplined investment stance. The quarter strengthened the evidence that the company can protect profitability and generate substantial cash through an adverse operating environment. However, the results do not establish a broad-based earnings acceleration. Consolidated margin improvement was disproportionately driven by managed pressure drilling, favorable equipment-sale economics and business mix, while the largest reported segment experienced significant margin deterioration. Conditional accumulation below approximately $80-$85 is supported by the illustrative valuation framework developed below; a higher entry price requires greater confidence in the 2027 growth outlook, recurring aftermarket economics and sustainable cash conversion.
Revenue of $1.143 billion increased 3.4% sequentially but declined 7.2% year-over-year. Adjusted EBITDA of $254 million increased 13.9% sequentially and declined 5.6% year-over-year, with margin increasing to 22.2%. Adjusted free cash flow of $155 million increased 56.6% year-over-year and represented 61.0% conversion of adjusted EBITDA. The most important positive development was the preservation of profitability despite the expiration of the Saudi lump-sum turnkey contract, the transition to a smaller Oman contract scope and continued Middle East disruption. The most important qualification was that Q3’s unusually strong incremental margin should not be extrapolated.
The outlook was a cash-conversion upgrade rather than an operating-earnings upgrade. Q4 guidance implies approximately $1.305 billion of revenue and $280 million of adjusted EBITDA at the midpoint, producing a 21.5% margin. Full-year figures implied by reported results and Q4 guidance are $4.68 billion-$4.73 billion of revenue and $980 million-$1.000 billion of adjusted EBITDA. Relative to July, the revenue midpoint increased approximately 0.7%, but the EBITDA midpoint declined approximately 0.9%. Management raised full-year adjusted free cash flow conversion from the mid-to-high 40% range to the high 40% range.
The principal 2027 investment proposition combines above-market reported revenue growth, annual margin expansion, approximately 50% adjusted free cash flow conversion and a substantially repaired balance sheet. The strongest supporting elements are offshore technology adoption, the annualization of NCS Multistage, Venezuela’s transition from prospective opportunities to purchase orders, improving Mexican collections and identifiable financing and corporate-structure savings. The principal underwriting risks are the quality and repeatability of margin improvement, working-capital requirements as growth resumes, Middle East disruption, customer payment concentration and acquisition integration.
The supplied Bloomberg earnings notice reported an intraday share-price increase of as much as 7.7%. That reaction was considerably larger than the 1.7% adjusted EBITDA beat against Bloomberg consensus. The market response therefore appears more consistent with increased confidence in cash generation and the 2027 outlook than with the magnitude of the quarterly earnings surprise alone.
QUARTERLY PERFORMANCE AND EARNINGS QUALITY
Weatherford’s October 20 earnings release provides a more differentiated picture than the consolidated headline. Revenue increased $38 million sequentially, while adjusted EBITDA increased $31 million, implying an 81.6% incremental EBITDA margin. That is not a reasonable recurring enterprise-level conversion assumption. It reflects a combination of favorable project timing, equipment-sale mix, cost performance and offsetting movements across businesses.
Against July guidance, revenue exceeded the $1.130 billion midpoint by $13 million, or 1.2%, and adjusted EBITDA exceeded the $250 million midpoint by $4 million, or 1.6%. Both results remained within the previously guided ranges of $1.105 billion-$1.155 billion and $235 million-$265 million. Management had indicated at least 100 basis points of sequential margin improvement; the actual increase was 204 basis points. Nevertheless, the ratio of July’s EBITDA and revenue midpoints already implied approximately 22.1% margin, only approximately 10 basis points below the actual result. The quarter exceeded the minimum margin-improvement commitment by substantially more than it exceeded the midpoint economics of the formal guidance.
The consensus comparison was similarly modest on earnings but stronger on cash. Adjusted EBITDA exceeded the supplied Bloomberg consensus of $249.8 million by $4.2 million. Revenue was approximately in line with the rounded $1.14 billion consensus figure. Operating cash flow of $192 million exceeded the $173.7 million estimate by 10.5%. The differentiation was therefore primarily cash realization and resilience, not an unexpectedly strong revenue environment.
Reported EPS requires substantial qualification. Diluted EPS increased to $1.66 from $1.12, while operating income declined to $153 million from $178 million and pretax income declined to $129 million from $139 million. The income tax provision fell to $4 million from $52 million. Consequently, the effective tax rate fell to approximately 3.1% from 37.4%, explaining more than the entire increase in net income attributable to Weatherford before offsetting changes elsewhere.
The cash-flow statement also records a $44 million deferred tax benefit in Q3. Reported EPS therefore materially overstates the improvement in recurring operating earnings. For sensitivity, applying a 22.5% tax rate to reported pretax income, while retaining the reported noncontrolling-interest deduction, produces approximately $1.32 per diluted share. This is an analytical tax normalization, not company-adjusted EPS, and it leaves other potentially unusual operating items unchanged. July’s low-to-mid 20% full-year tax-rate expectation is not an appropriate basis for annualizing the unusually low Q3 tax provision.
Asset-sale economics are another important qualification. The cash-flow statement identifies $15 million of gains on disposition of assets, compared with $7 million in Q2 and $2 million in Q3 2025. These gains are not separately excluded in the published adjusted EBITDA reconciliation. Management explicitly acknowledged that sales of older equipment can generate unusually high contribution margins. The associated revenue and accounting detail are insufficient to construct a fully comparable asset-sale-adjusted margin, but the increase is material relative to the modest 39-basis-point year-over-year improvement in consolidated adjusted EBITDA margin.
The distinction between adjusted and GAAP profitability also remains relevant. Adjusted EBITDA exceeded operating income by $101 million, comprising $70 million of depreciation and amortization, $15 million of share-based compensation, $6 million of restructuring charges, $6 million of redomestication expenses and $4 million of other charges. Share-based compensation increased from $10 million a year earlier. Although noncash in the current period, it remains an economic cost to shareholders through dilution or offsetting repurchases.
The broader historical comparison remains weaker than the sequential recovery suggests. Year-to-date revenue declined 6.3% to $3.400 billion, adjusted EBITDA declined 8.5% to $710 million and adjusted EBITDA margin declined to 20.9% from 21.4%. Q3 represents a meaningful recovery from the first-half trough, not a return to sustained year-over-year earnings growth.
SEGMENT PERFORMANCE: IMPROVEMENT WAS NOT UNIFORM
Drilling and Evaluation was the decisive contributor. DRE revenue increased to $331 million from $291 million sequentially, while adjusted EBITDA increased to $90 million from $58 million. Margin expanded to 27.2% from 19.9%, an increase of 726 basis points. DRE’s $32 million sequential EBITDA increase exceeded the entire company’s $31 million improvement.
The underlying operating contribution included managed pressure drilling and drilling services in Latin America, alongside MPD and wireline activity in the Middle East, North Africa and Asia region. However, management also identified MPD capital sales as an important margin driver. In the Q&A, Saligram acknowledged that these transactions create “a little bit of a natural spike” and that older-equipment sales can make a particularly significant contribution.
DRE’s year-over-year performance was encouraging but should be interpreted through that mix qualification. Revenue declined 4.3%, yet EBITDA increased 8.4% and margin expanded approximately 320 basis points. This demonstrates the potential of the technology portfolio, but it does not establish that a 27% segment margin is now a stable quarterly baseline.
Well Construction and Completions was the principal weakness. WCC revenue increased to $450 million from $433 million sequentially, but EBITDA declined to $100 million from $107 million. Margin fell to 22.2% from 24.7%. Relative to Q3 2025, revenue declined 3.8%, EBITDA declined 20.0% and margin contracted approximately 449 basis points. The release attributed the deterioration principally to weaker North American fall-through and lower activity in Europe, Sub-Saharan Africa and Russia, partly offset by improvement in the Middle East region.
This matters because completions is now Weatherford’s largest product line, and NCS will be consolidated within WCC. The strongest strategic growth narrative therefore resides within a segment currently showing deteriorating profitability. The proposition requires future offshore awards, technology differentiation, geographic expansion and integration synergies to translate into better segment economics. Contract announcements alone do not establish that outcome.
Production and Intervention provided a more convincing example of margin improvement without revenue growth. PRI revenue declined to $314 million from $316 million sequentially and $326 million a year earlier. EBITDA nevertheless increased to $73 million from $70 million sequentially and $59 million year-over-year. Margin reached 23.2%, up approximately 110 basis points sequentially and 515 basis points year-over-year. Improved international pressure-pumping economics and better intervention and digital activity supported the result.
The All Other category, which includes integrated services and projects, explains a meaningful portion of the consolidated revenue decline. Revenue fell to $48 million from $65 million sequentially and $92 million a year earlier. Excluding this category, the 3 reported operating segments generated revenue growth of 5.3% sequentially and a decline of 3.9% year-over-year, materially better than the consolidated decline. This illustrates the effect of contract exits and portfolio changes, although it is not an organic-growth calculation because acquisitions remain included.
Corporate costs increased to $19 million from $12 million a year earlier. The $7 million increase absorbed a meaningful portion of the operating progress elsewhere. The transformation thesis ultimately requires corporate infrastructure spending to support measurable productivity gains rather than becoming a persistently expanding overhead base.
GEOGRAPHIC PERFORMANCE AND MIDDLE EAST EXPOSURE
North American revenue increased 15.1% sequentially to $236 million, although it remained 2.9% below the prior year. NCS contributed for approximately 1 month, making the sequential result partly acquisition-driven. Management did not anticipate a noteworthy near-term increase in underlying North American activity, despite higher rig counts. The reported growth rate should therefore not be treated as evidence of a strong organic land-market recovery.
Latin American revenue increased 14.2% sequentially to $225 million and 5.1% year-over-year. Mexico and the Caribbean were the principal contributors. Importantly, Venezuela was only beginning to generate revenue, so the quarter’s improvement was not dependent on the prospective Venezuelan ramp. Better Mexican collections also improved the quality of the regional recovery.
Europe, Sub-Saharan Africa and Russia declined 8.6% sequentially to $235 million and 2.9% year-over-year. The Norway labor strike was a material disruption early in the quarter. Management indicated that Norway recovered during the period, but expected the broader region to remain approximately flat in Q4. The 2027 opportunity depends on stronger Norwegian activity and conversion of opportunities in the Caspian and Sub-Saharan Africa, rather than a recovery already evident in the aggregate revenue figures.
Middle East, North Africa and Asia revenue was $447 million, essentially unchanged from $446 million sequentially but down 16.1% year-over-year. Maintaining revenue despite the Saudi LSTK conclusion and Oman contract transition indicates that other businesses within the region grew. It does not demonstrate that the underlying regional service market recovered.
Management’s clearest statement was: “We have deliberately not built a regional recovery into our near-term outlook.” That represents a more conservative operating assumption than July, when the company’s guidance incorporated progressive recovery in Middle East activity. The change is economically important even though the full-year EBITDA midpoint moved only modestly.
Saudi Arabia represented approximately 20% of the broader region’s Q3 revenue, equivalent to roughly $89 million or 7.8% of enterprise revenue. That compares with approximately 10% of enterprise revenue in 2025. The UAE, Oman and Kuwait collectively represented approximately 41% of the region, or approximately 16.0% of enterprise revenue. These figures demonstrate meaningful country diversification, but not independence from common regional logistics, security and customer-budget risks.
The regional label also includes North Africa and Asia. Treating the entire 39% revenue exposure as Middle East exposure would overstate direct geographic concentration. Conversely, treating the lower Saudi percentage as eliminating Middle East sensitivity would understate the importance of the broader Gulf portfolio.
Management described the UAE and Oman as relatively strong and normalized, Kuwait and Saudi Arabia as somewhat weaker, and Iraq as substantially weaker. This country-level differentiation is more useful than a generalized assumption that restored oil exports imply restored service demand. Rig mobilization, tendering, field access and customer inventories can remain impaired after export flows improve.
Q4 GUIDANCE AND THE CHANGE FROM JULY
Q4 revenue guidance of $1.280 billion-$1.330 billion implies sequential growth of 12.0%-16.4%. Adjusted EBITDA guidance of $270 million-$290 million implies sequential growth of 6.3%-14.2%. At the midpoints, revenue increases 14.2%, EBITDA increases 10.2% and margin declines approximately 77 basis points to 21.5%.
The implied incremental EBITDA margin is approximately 16.0%, dramatically below Q3’s 81.6%. That contrast is a direct warning against extrapolating quarterly operating leverage. Q4 combines additional NCS revenue, Middle East product deliveries, deepwater MPD shipments, higher North American product activity and Venezuela startup revenue, but with less favorable aggregate margin economics.
Management identified several causes. Some higher-margin project activity shifted into Q3 from Q4. Venezuela startup expenses increased relative to July expectations. North American year-end bailment sales carry lower initial margins and potentially stronger aftermarket economics later. NCS also changes the revenue mix, although management did not quantify its standalone margin contribution or provide a numerical bridge separating acquisition effects, equipment mix and startup expenses.
The expected mid-to-high single-digit sequential increase in Middle East, North Africa and Asia revenue does not contradict the assumption of flat underlying service activity. Saligram explained that Q4 includes a larger product-delivery component, supported by purchase orders and manufacturing activity. These shipments will replenish customer inventories entering 2027. The distinction is between contracted product deliveries and a recovery in field-service activity.
The full-year guidance bridge is less positive than a simple “narrowed range” description implies. July guidance was $4.54 billion-$4.80 billion of revenue and $951 million-$1.046 billion of EBITDA. Current reported results plus Q4 guidance imply $4.68 billion-$4.73 billion and $980 million-$1.000 billion. The revenue midpoint increases $35 million, but the EBITDA midpoint decreases $8.5 million. The resulting midpoint margin falls approximately 34 basis points relative to July’s midpoint ratio.
A mechanical residual-quarter comparison is also instructive. July’s annual midpoint, less first-half actual results and the Q3 guidance midpoint, implied approximately $1.283 billion of Q4 revenue and $292.5 million of EBITDA. The current Q4 midpoint is approximately $22 million higher in revenue but $12.5 million lower in EBITDA. These were not formal standalone July Q4 forecasts, and acquisition-perimeter assumptions are not sufficiently specified to call the difference organic. Nevertheless, the arithmetic demonstrates that the improved Q3 result did not translate into an improved remaining-year earnings expectation.
The company remains on track to deliver the promised second-half improvement. First-half EBITDA margin was approximately 20.2%. Q3 actual results combined with the Q4 midpoint imply a second-half margin of approximately 21.8%, an increase of approximately 161 basis points. This supports management’s execution narrative.
The year-over-year comparison is less favorable. Q4 2025 generated $1.289 billion of revenue, $291 million of EBITDA and a 22.6% margin. The current Q4 midpoint implies approximately 1.2% revenue growth, a 3.8% EBITDA decline and approximately 112 basis points of margin contraction. Full-year 2026 midpoint revenue would be 4.3% below 2025, EBITDA would be 7.2% lower and margin would be approximately 21.0%, versus 21.7% in 2025. Sequential recovery and annual deterioration can coexist.
2027 OUTLOOK AND THE MARGIN TARGET
Management expects international activity excluding the Middle East to increase by mid-to-high single digits in 2027, North America to increase by low single digits and global activity to increase by mid-single digits under a flat Middle East assumption. Weatherford expects to outperform that global activity growth through NCS annualization, selected market-share gains and Venezuela.
These are management’s preliminary activity and company-growth expectations, not formal 2027 revenue guidance. Activity growth is also not automatically equivalent to service-company revenue growth. Pricing, product intensity, geographic mix, contract transitions and acquisitions can all create substantial differences.
The timing is important. Management anticipates more noticeable improvement beginning in Q2 and a stronger contribution in the second half. The first half must absorb comparisons against the Saudi and Oman integrated-project revenues present in early 2026, together with a stronger pre-disruption activity profile. NCS provides a partial offset because 2026 includes approximately 4 months of ownership, versus a full year in 2027.
The most important Q&A clarification concerned the margin baseline. Asked whether 2027 margin expansion should be measured against full-year 2026 or the second-half exit rate, Saligram answered: “At this point, best to take it as a full year, Dave.” A 2027 margin modestly above approximately 21.0% could therefore satisfy the stated direction even without exceeding the approximately 21.8% second-half 2026 level. The commentary should not be interpreted as a commitment to expand margins from Q3’s 22.2% or from the second-half run rate.
The long-term target remains a mid-20% EBITDA margin with approximately 50% free cash flow conversion. However, management did not endorse the analyst’s suggestion of a firm 2-year timetable. Saligram stated that “our role really is to drive 25 bps to 75 bps of margin expansion on flat revenue” and indicated that reaching the mid-20% range without revenue growth could take approximately 3-4 years.
The arithmetic warrants scrutiny. Starting from Q3’s 22.2%, reaching 25.0% requires approximately 280 basis points. That is achievable over approximately 4 years near the upper end of the stated annual improvement range, but not over 3-4 years at its midpoint. Starting from the full-year 2026 midpoint margin of approximately 21.0% creates an even larger gap. Faster delivery therefore requires activity growth, favorable mix or structural improvements beyond a simple extrapolation of the midpoint productivity target.
At approximately $4.7 billion of annual revenue, each 100 basis points of margin represents roughly $47 million of EBITDA. A move from approximately 21% to 25% at unchanged revenue would require nearly $190 million of additional annual EBITDA. The $15 million NCS cost-synergy target is meaningful, but represents only approximately 32 basis points of enterprise margin at that revenue level. The longer-term margin thesis necessarily depends on much more than acquisition cost savings.
OFFSHORE MPD: A DURABLE BUSINESS WITH A FINITE INSTALLATION OPPORTUNITY
Offshore is the strongest structural component of the call. Weatherford’s exposure spans managed pressure drilling, tubular running services, interventions and completions. These offerings address drilling complexity, well integrity, execution risk and asset productivity rather than simply supplying undifferentiated capacity.
Management expects MPD revenue to grow at a double-digit rate in 2026 and to grow further in 2027. Offshore is outperforming onshore. The strategic shift is toward installed systems that support recurring spares, maintenance and operating services. Saligram described customer expectations as extending beyond basic compatibility: “It’s something that customers expect, not just MPD enablement, but the capability on the rig.”
That distinction supports durable demand but does not eliminate saturation risk. Management estimated that approximately 70% of drillships already have, or are installing, MPD systems, with potential penetration of 85%-90%. The remaining opportunity is therefore a finite number of installations across the industry, not an indefinitely expanding equipment market.
Management referenced approximately 80-90 deepwater rigs in the Q&A, but did not provide a fully reconciled addressable-fleet definition linking that figure to the drillship penetration estimates. Depending on fleet scope and penetration assumptions, the remaining installation opportunity is directionally measured in the low double digits. It is an industry opportunity, not a Weatherford order forecast or an exclusive share entitlement.
The longer-duration value proposition lies in aftermarket monetization and expansion into underpenetrated semisubmersible and jackup applications. Management expects the aftermarket component to more than double in 2026 and potentially double again over the following several years. The absolute revenue base, service attachment rate, margins and recurring contract coverage were not disclosed. High percentage growth from an undisclosed base cannot independently support a large enterprise earnings estimate.
The release’s awards provide tangible support. They include an MPD equipment package for an ultra-deepwater drillship operating offshore Indonesia, a 30-month MPD services contract in Argentina and a 4-year Australian contract spanning tubular running and intervention services. These complement earlier Brazil awards. However, equipment deliveries, service commencement and cash collection occur on different schedules, making quarterly earnings inherently uneven.
There is also no basis for assuming that all equipment sales dilute margins while all service revenue improves them. Q3 benefited from high-margin MPD capital sales, including the favorable economics associated with older assets. Q4 includes other product categories with lower margins. The relevant underwriting unit is the specific product and contract economics, not a generic equipment-versus-services classification.
OFFSHORE COMPLETIONS AND NCS INTEGRATION
The offshore completions opportunity is strategically significant because customer qualification barriers are high and successful installations can support repeat business. The Q3 Equinor award combines a 2-year extension with a new offshore completions award for Norwegian Continental Shelf operations. Seplat awarded a 5-year completions and gas-lift contract in Nigeria. These follow previously announced TotalEnergies and ExxonMobil-related awards.
The distinction between new awards and existing relationships matters. Contract extensions support retention and installed-base continuity; new technical scope supports incremental penetration. Neither establishes a specific revenue uplift without contract values, well counts, utilization and deployment schedules. Framework duration should not be treated as guaranteed revenue coverage.
The company’s September 1 closing announcement confirms that NCS was acquired early enough to contribute approximately 1 month to Q3. The analyst’s reference to only 9 days since closing is inconsistent with the official transaction date and should not inform the consolidation model.
The correct annual cost-synergy commitment is at least $15 million within 18 months of closing, not the $50 million figure introduced in an analyst question. Management reaffirmed the $15 million target. The full implementation window extends to approximately March 2028, so recognizing the entire annual run rate throughout 2027 would be aggressive.
The commercial rationale is broader than cost reduction. NCS adds frac sleeves, service tools and reservoir diagnostics that can be distributed through Weatherford’s international footprint. Management cited early opportunities in Argentina, the Middle East and the North Sea, as well as offshore and engineered geothermal applications. The acquisition was predominantly equity-funded, preserving cash but making per-share accretion and dilution relevant alongside absolute EBITDA growth.
The deepwater frac-sleeve award scheduled to begin in Q1 2027 is a credible commercialization milestone after approximately 4 years of development. It is not yet evidence of a scaled offshore franchise. Management appropriately acknowledged that the first award begins as an isolated project, with the objective of creating a broader channel over time.
Revenue synergies were not quantified. Management’s aspiration to grow NCS faster than its natural trajectory should not be translated into a specific enterprise growth contribution. Customer qualification, field execution, additional manufacturing requirements and selling costs remain relevant. The investment case improves most when cross-selling generates incremental recurring cash returns, not merely a larger quotation pipeline.
VENEZUELA: GREATER VISIBILITY, BUT NOT YET A MATURE CASH STREAM
Venezuela was among the clearest positive changes in the call. Initial revenue was recorded in Q3, a tangible contribution is expected in Q4 and management sees potential for annual revenue to reach at least approximately $100 million in 2027, with further growth in 2028.
The confidence is now based on more than customer discussions. Saligram stated that conversations had moved “from sort of what if to now, how soon, how fast” and emphasized actual purchase orders, hiring and work already beginning. The earnings release disclosed a 46-unit progressive cavity pumping award, providing a concrete example of the reopening opportunity.
Approximately $100 million would equal 2.1% of the 2026 revenue midpoint. Each additional $50 million would represent approximately 1.1% of that base. The full 2027 revenue amount would not be incremental year-over-year because Q3 and Q4 2026 already contain activity. Nevertheless, Venezuela could become a meaningful contributor to company growth without approaching historical peak revenue.
The change from July is notable. On the prior call, management discussed a historical revenue peak of approximately $500 million but cautioned against expecting a near-term return close to that level. The current call allowed for the possibility of approaching the prior peak over several years, assuming environmental stability. This represents increased confidence, not a formal multiyear revenue commitment.
The near-term earnings and cash effects differ. Hiring, facility refurbishment and mobilization can depress EBITDA before utilization improves. Inventory purchases consume cash before revenue collection. Some refurbishment may be capitalized while other spending is expensed. Management did not provide a detailed split, so all startup spending should not be classified as either temporary operating expense or recoverable working capital.
International operators may offer stronger contractual structures than direct exposure to a distressed domestic counterparty, but they do not remove sanctions, licensing, remittance, infrastructure, security or customer-concentration risks. The appropriate base case recognizes a measured ramp supported by orders; a return toward historical peak revenue belongs in longer-duration upside optionality.
CASH FLOW: STRONG RESULTS WITH IMPORTANT DEFINITIONS AND TIMING EFFECTS
Weatherford defines adjusted free cash flow as operating cash flow less capital expenditures plus proceeds from asset dispositions. Q3 reconciles as $192 million of operating cash flow less $45 million of capital expenditures plus $8 million of disposition proceeds, producing $155 million. Conventional operating cash flow less capital expenditures was $147 million.
Year-to-date adjusted free cash flow was $379 million, consisting of $503 million of operating cash flow less $141 million of capital expenditures plus $17 million of disposition proceeds. The corresponding measure excluding disposition proceeds was $362 million. Asset monetization is therefore a relatively modest, but nonzero, contributor to reported conversion.
Year-to-date adjusted free cash flow increased $135 million from $244 million. Operating cash flow contributed $95 million of the increase, lower capital expenditures contributed $34 million and higher asset-disposition proceeds contributed $6 million. This is a stronger cash profile, but it is not entirely the result of higher operating profitability: EBITDA declined over the same period.
Working-capital timing is material. The cash-flow statement’s combined changes in receivables, inventory, payables, accrued compensation and income taxes contributed $65 million year-to-date, versus a $116 million use a year earlier. That $181 million swing exceeds the $95 million improvement in operating cash flow. It demonstrates the importance of balance-sheet movements and collection timing, even if part of the improvement reflects better processes.
Management’s statement that Q3 cash conversion benefited from higher EBITDA is correct sequentially, but not year-over-year. EBITDA declined from $269 million to $254 million, while adjusted free cash flow rose from $99 million to $155 million. The year-over-year conversion improvement therefore came from factors below EBITDA rather than increased EBITDA dollars.
The consecutive conversion rates above 60% are encouraging but not an appropriate annualized baseline. Q2 conversion was approximately 62.3% and Q3 was 61.0%, while year-to-date conversion was 53.4%. Quarterly interest payments, compensation payments, customer receipts and product-delivery timing produce substantial volatility.
Q4 adjusted free cash flow guidance of more than $100 million is internally consistent with the upgraded full-year conversion outlook. Adding $100 million to the $379 million generated year-to-date produces $479 million, or approximately 48.4% of the $990 million full-year EBITDA midpoint. The guidance is therefore not necessarily unusually conservative simply because Q3 generated $155 million.
Q4 capital expenditures are expected to rise to $70 million-$80 million, an increase of $25 million-$35 million sequentially. A scheduled cash interest payment also falls in Q4, while inventory deliveries should provide some working-capital relief. Quarterly capital intensity could exceed 5%, but full-year expenditure of approximately $211 million-$221 million would represent approximately 4.5%-4.7% of revenue, within the stated 3%-5% range.
The longer historical comparison moderates the headline growth narrative. Q4 2025 adjusted free cash flow was $222 million, benefiting from strong collections and timing. Consequently, year-to-date 2026 cash-flow growth of 55% does not imply comparable full-year growth. The current Q4 floor implies full-year adjusted free cash flow above $479 million, only approximately 2.8% above 2025’s $466 million.
WORKING CAPITAL AND MEXICAN COLLECTIONS
Adjusted net working capital was 29.2% of trailing revenue, versus the goal of 25% or better. Approximately 150 basis points of the reported ratio reflected consolidation of NCS’s full balance sheet with only approximately 1 month of revenue.
As additional NCS revenue enters the trailing denominator, that distortion should diminish without requiring an equivalent cash release. This is a measurement normalization, not an operating cash inflow. Even after removing the indicated acquisition effect, the ratio is approximately 27.7%, leaving a meaningful gap to the target.
Using approximately $4.689 billion of trailing revenue, the total 4.2-percentage-point gap to 25% equates mechanically to approximately $197 million. Excluding the 1.5-percentage-point acquisition distortion leaves approximately $127 million. These figures illustrate scale, not a cash-release forecast. Revenue growth, seasonal inventories, acquisition accounting and supplier financing can change the calculation substantially.
Growth can also improve the working-capital ratio while consuming cash. At a 25% working-capital intensity, each $100 million of additional annual revenue requires approximately $25 million of incremental operating funding absent efficiency gains or timing offsets. Venezuela and international NCS deployment therefore create a potential tension between the revenue-growth thesis and the conversion target.
Mexican payment behavior is clearly better. Management described several consecutive quarters of regular collections and a receivable exposure at a multiyear low on relative measures. However, the prepared remarks referenced the largest customer’s receivables relative to enterprise revenue, while the Q&A also referenced its share of total receivables. Those are different denominators and should not be combined into a precise exposure estimate.
The absolute receivable balance, aging profile and specific Q4 collection assumption were not disclosed. Management continued to identify the customer as the largest quarterly cash-flow variable. Better payment regularity reduces the risk premium, but does not eliminate concentration risk or establish that the remaining balance is immaterial.
BALANCE SHEET, REDEMPTION AND CAPITAL ALLOCATION
The balance sheet is materially stronger than the operating environment might suggest. Quarter-end total debt was $1.480 billion, total cash was $1.198 billion and company-defined net debt was $282 million. Total cash included $37 million of restricted cash. Net leverage was 0.28x trailing adjusted EBITDA, compared with 0.51x a year earlier.
The planned redemption of $236 million of 8.625% notes at par is an attractive reduction of high-cost gross debt. The official release specifies an October 30 redemption date, making it pending rather than completed at the time of the call. The annual coupon reduction is approximately $20.4 million.
Funding the redemption with cash does not immediately reduce net debt. Ignoring accrued interest and intervening operations, gross debt falls to approximately $1.244 billion and total cash falls to approximately $962 million, leaving net debt unchanged at approximately $282 million. The benefits are lower gross leverage, lower coupon expense, reduced refinancing risk and a simpler maturity structure.
The gross interest reduction is not identical to the net economic earnings benefit because the cash used would otherwise earn interest. Each 1% yield on $236 million represents approximately $2.4 million of annual income. At an illustrative 4% cash yield, foregone interest income would be approximately $9.4 million, reducing the pretax net financing benefit to approximately $10.9 million. This sensitivity does not replace management’s guidance, but it prevents treating the coupon saving as costless incremental earnings.
The expected $20 million-$30 million of annual cash savings from redomestication remain unchanged from July. The important development is execution progress: shareholder approval was secured, while Irish High Court approval and other closing conditions remained outstanding. The initiative is more advanced, but not fully completed.
Management’s combined financing and redomestication savings imply approximately 4-5 percentage points of EBITDA-to-free-cash-flow conversion improvement at an EBITDA base near $1 billion. The realized benefit will depend on timing, taxes, foregone interest income and any remaining implementation costs. These savings should not be added again to a forecast that already assumes the company’s 50% conversion target.
The anticipated Q4 tax benefit from subsidiary restructuring is explicitly noncash. It should be separated from recurring annual cash savings and excluded from assessments of sustainable EPS growth. The company recognized $30 million of redomestication charges year-to-date, although the earnings release does not establish that the entire amount was a current-period cash outflow.
Capital returns remain measured. Weatherford returned $47 million in Q3 through $19 million of dividends and $28 million of repurchases, approximately 30% of adjusted free cash flow. Year-to-date returns of $113 million were also approximately 30% of adjusted free cash flow. The balance sheet provides flexibility, but the investment case should not assume an immediate distribution of most available cash.
Positive outlooks from S&P, Fitch and Moody’s support improving credit quality. They do not constitute an investment-grade rating. The company remains rated below investment grade, even though leverage metrics resemble those of stronger-rated issuers.
ILLUSTRATIVE INVESTMENT SCENARIOS AND VALUATION
The following scenarios are analytical assumptions, not company guidance, consensus estimates or observed peer trading multiples. They use the approximately $4.705 billion 2026 revenue midpoint, approximately 73 million diluted shares and $282 million of net debt held constant for comparability. Actual future shares, distributions, acquisitions and cash accumulation would change equity value.
The base case carries a 55% probability. Revenue reaches approximately $5.05 billion in 2027, an increase of 7.3%, supported by NCS annualization, offshore growth and a measured Venezuelan contribution without a Middle East recovery. An EBITDA margin of 22.5% produces approximately $1.136 billion of EBITDA. At 50% conversion, adjusted free cash flow is approximately $568 million. A 7.0x enterprise-value-to-EBITDA assumption produces approximately $105 per share.
The base case requires more than merely satisfying management’s directional guidance for annual margin improvement. It assumes a margin above both the full-year 2026 level and the second-half midpoint. Its justification is the combination of higher revenue, synergies, lower structural costs and improved mix. Failure of WCC profitability to recover would weaken this case materially.
The bull case carries a 20% probability. Revenue reaches approximately $5.35 billion, up 13.7%, as Middle East activity improves, Venezuela scales more quickly and offshore completions and MPD deliver strong growth. A 24.0% EBITDA margin generates approximately $1.284 billion of EBITDA, and 52% conversion produces approximately $668 million of adjusted free cash flow. An 8.0x multiple produces approximately $137 per share. This case requires both stronger earnings and a valuation premium for improved durability.
The bear case carries a 25% probability. Revenue declines to approximately $4.45 billion as regional disruption persists, product deliveries soften and growth initiatives underperform. A 20.5% EBITDA margin produces approximately $912 million of EBITDA. Conversion falls to 43% because of weaker collections, startup requirements and limited working-capital release, generating approximately $392 million of adjusted free cash flow. A 5.5x multiple produces approximately $65 per share.
The probability-weighted illustrative value is approximately $101 per share. At an $80 entry, that implies approximately 27% expected price appreciation, with approximately 19% downside to the bear case. At $85, expected appreciation falls to approximately 19%, with approximately 24% bear-case downside. Dividends are excluded. The probability assignments are judgmental rather than statistically estimated, and an executable market price is not established by the earnings materials.
Valuation remains sensitive to the assumed multiple. At base-case EBITDA and the assumed share count, each 1.0x change in enterprise-value-to-EBITDA changes equity value by approximately $15.6 per share. A rerating therefore requires evidence that cash generation is becoming more repeatable, rather than simply confidence that the next equipment-delivery quarter will be strong.
The supplied analyst commentary is directionally consistent with a constructive view, but not independent proof of fair value. Bloomberg reported 10 buy recommendations, 1 hold and no sells, with an average target of $115.36. The cited targets ranged from $115 at Melius to $148 at Barclays. Strong existing bullish positioning increases the importance of delivery and limits the value of treating positive sentiment itself as a catalyst.
CATALYSTS, POSITION SIZING AND EXIT CONDITIONS
The nearest catalysts are the scheduled October 30 debt redemption, completion of redomestication during Q4, delivery of year-end product orders and continued Mexican collections. These events primarily affect financial execution, cash generation and confidence in the conversion target rather than establishing a broad service-market recovery.
The next major information event is the early-February 2027 earnings call, when management expects to provide specific 2027 guidance. The critical disclosures are the organic-versus-acquired revenue bridge, margin progression relative to the second-half 2026 baseline, Venezuela’s contracted revenue and spending profile, WCC profitability and the expected timing of NCS synergies. The Q1 2027 offshore NCS deployment provides a subsequent commercialization milestone, while management’s anticipated activity acceleration should become more visible from Q2 onward.
A conditional initial position of approximately 0.5%-1.0% of portfolio NAV is appropriate below the $80-$85 valuation range, with any increase toward 2.0% contingent on formal 2027 guidance and evidence of sustained cash conversion. These are illustrative risk limits, not portfolio-specific optimized weights. Existing holdings, energy exposure, liquidity requirements and factor concentrations are unspecified.
Weatherford should be classified as an internationally exposed cyclical services investment with improving financial quality, not as a defensive cash compounder. It adds commodity-capital-spending sensitivity, offshore-cycle exposure, emerging-market collection risk and geopolitical risk. NCS increases unconventional exposure, while offshore awards improve duration but do not eliminate cyclical correlation.
An initial 15% price-loss threshold would limit planned loss to approximately 7.5-15 basis points of NAV at a 0.5%-1.0% position, or approximately 30 basis points at 2.0%, before gaps and execution slippage. A stop is a risk-control assumption, not a guaranteed maximum loss in a geopolitical or customer-payment event.
Fundamental exit or reduction triggers include a sustained return below 20% consolidated EBITDA margin outside clearly identified startup effects, reversal of Mexican payment regularity, persistent acquisition-adjusted working capital above approximately 28%, failure of WCC margins to stabilize, or a 2027 cash-conversion outlook materially below the targeted 50% without a credible high-return investment explanation. Large acquisitions that materially increase leverage or weaken per-share cash returns would also warrant reassessment.
Valuation-based trimming becomes appropriate if the shares move materially above approximately $105 without corresponding earnings upgrades. A move toward $120-$135 would require stronger evidence for the bull-case revenue, margin and recurring-cash assumptions. A failure of the anticipated growth acceleration to become visible by the second half of 2027 would also undermine the intended catalyst timetable.
BOTTOM LINE
Q3 strengthened Weatherford’s financial-resilience and cash-generation credentials, but the quality of the improvement is more nuanced than the headline margin expansion suggests. DRE drove more than the entire sequential EBITDA increase, WCC deteriorated, tax benefits inflated EPS growth and working-capital timing contributed materially to cash-flow improvement. The full-year EBITDA midpoint was reduced despite the quarterly beat.
The strongest investment case is a transition toward a more cash-generative technology and services portfolio, supported by offshore adoption, selective completions expansion, NCS distribution opportunities and disciplined capital allocation. That transition is credible but incomplete. Attractive returns depend on buying the improving cash profile at an appropriate valuation, rather than capitalizing temporary margin peaks, unquantified revenue synergies or an assumed Middle East recovery.
COMPANY PARTICIPANTS
• Girish K. Saligram, President and Chief Executive Officer. • Anuj Dhruv, Executive Vice President and Chief Financial Officer. • Luke Lemoine, Senior Vice President, Corporate Development and Investor Relations.
RESEARCH ANALYST PARTICIPANTS
• J. David Anderson, Barclays. • Scott Gruber, Citi Research. • James West, Melius Research. • Saurabh Pant, Bank of America. • Derek Podhaizer, Piper Sandler. • James Rollyson, Raymond James & Associates. • Douglas Becker, Capital One Securities. • Keith Mackey, RBC Capital Markets. • Phillip Jungwirth, BMO Capital Markets. • Josh Silverstein, UBS. • Alexa Breno, Goldman Sachs. • Joshua Jayne, Daniel Energy Partners.
Key Read-Throughs
KEY READ-THROUGHS FROM WEATHERFORD’S Q3 2026 EARNINGS CALL
Weatherford’s results point to a selective international investment cycle, not a synchronized recovery across oilfield services. The strongest positive implications concern offshore development, contracted Saudi gas activity, Venezuelan field rehabilitation and mature-field production optimization. The principal negative implication is that higher oil prices, equipment deliveries and announced projects do not necessarily translate into immediate service activity, stronger utilization or better margins. Company-specific contract transitions and technology exposure increasingly explain divergent performance. Subsequent peer disclosures reinforce this distinction: SLB reported 13% sequential Middle East growth, while Halliburton reported an 8% increase in Middle East/Asia revenue, despite Weatherford’s approximately flat regional result. The most actionable conclusions therefore depend on contract ownership, product exposure and project timing rather than extrapolating Weatherford’s consolidated growth rate. Country labels below identify equity listing markets, not operating-asset locations.
GULF DRILLING AND INTERNATIONAL OILFIELD SERVICES
SAUDI CONTRACT EXITS SHOULD NOT BE MISTAKEN FOR DISAPPEARING INDUSTRY DEMAND (READ-THROUGH 1)
Affected companies: Arabian Drilling (2381: Saudi Arabia) and SLB (SLB: United States). Direction: positive. Magnitude: potentially substantial for Arabian Drilling’s land business; smaller at SLB’s consolidated level.
Weatherford reported its first full quarter without the Saudi LSTK contract and a reduction in Saudi Arabia’s contribution to approximately 7.8% of enterprise revenue, versus approximately 10% in 2025. However, regional revenue remained approximately flat sequentially because other businesses expanded. Management reiterated that it would not pursue revenue at inadequate returns. The critical distinction is between Weatherford’s retained contract portfolio and the underlying availability of Saudi drilling work.
Arabian Drilling’s separately disclosed contracts demonstrate why that distinction matters. Its August agreement with SLB covered 11 incumbent land rigs, while its September agreement added 8 rigs from its available fleet. The additional 8 rigs carry approximately SAR 2 billion of backlog over 5 years, with revenue expected to begin in Q4 2026. The 11-rig agreement principally protects existing activity; the 8-rig agreement increases active capacity. Treating all 19 rigs as incremental would materially overstate growth.
The transmission mechanism for Arabian Drilling is direct: redeployment of available rigs increases revenue-generating utilization and improves absorption of fleet and organizational costs. A simple average of the incremental contract value is approximately SAR 400 million annually, equivalent to approximately 13% of annualized first-half 2026 revenue. That is an order-of-magnitude indicator, not a revenue forecast, because mobilization timing, contract terms and operating availability determine recognition.
For SLB, the rig commitments support delivery capacity within Saudi gas programs. They are procurement obligations, not SLB revenue, and should not be added directly to SLB’s sales or earnings estimates. Weatherford’s emphasis on returns also cautions against assuming that all transferred or newly awarded integrated work carries attractive margins. The available disclosures do not establish that Arabian Drilling’s incremental rigs correspond to the specific contract Weatherford exited.
Near-term catalyst: Q4 mobilization and revenue commencement for Arabian Drilling’s additional rigs. Longer-duration implication: contracted Saudi gas development can support multiyear activity even while other Saudi operations remain disrupted. This is a stronger investment signal than a generalized expectation that all Saudi rig activity will normalize simultaneously.
UAE RESILIENCE IS MORE BANKABLE THAN UNCONTRACTED REGIONAL RECOVERY UPSIDE (READ-THROUGH 2)
Affected companies: ADNOC Drilling (ADNOCDRILL: United Arab Emirates) and Arabian Drilling (2381: Saudi Arabia). Direction: positive for ADNOC Drilling’s earnings visibility; negative for aggressive assumptions about the timing of Arabian Drilling’s remaining offshore recovery. Magnitude: moderate at ADNOC Drilling’s group level; potentially material within Arabian Drilling’s offshore segment.
Weatherford differentiated the region explicitly: “UAE and Oman remain pretty strong and kind of normalized at this point, Kuwait and Saudi a little bit down, Iraq substantially.” Management also explained that expected Q4 regional revenue growth primarily reflects product deliveries rather than stronger underlying service activity. Purchase orders for completions and cementing products should therefore not be treated as equivalent to additional operating rig days.
ADNOC Drilling’s first-half disclosure independently supports the favorable UAE signal. The company reported uninterrupted operations, high fleet utilization and maintained approximately $5 billion of full-year revenue guidance. Its contracted drilling base and expanding integrated services create a direct channel from sustained domestic activity to rig revenue, service revenue and cash generation. Weatherford provides external corroboration that the UAE’s operating continuity is not confined to ADNOC Drilling’s own reporting.
The negative implication concerns the timing of recovery assumptions elsewhere. Arabian Drilling’s Q2 offshore suspensions reduced revenue by SAR 122 million, approximately 16% of total quarterly revenue. Its August disclosure confirmed that 3 rigs had returned to service and anticipated the remaining suspended rigs returning by year-end. Weatherford’s October description of continuing disruption increases the importance of verifying those remaining reactivations rather than capitalizing them automatically.
This does not establish new Arabian Drilling suspensions or invalidate its signed land contracts. It identifies the portion of its earnings recovery that remains more exposed to operating permissions, customer sequencing and regional disruptions. The land-contract growth in the preceding read-through and the offshore timing risk are separate economic exposures.
Near-term catalyst: Q4 operating updates showing actual offshore rig returns and ADNOC Drilling’s continued operational continuity. Longer-duration implication: Gulf exposure should be allocated by country, contract protection and revenue type. A uniform regional valuation discount obscures important differences in cash-flow visibility.
OFFSHORE EQUIPMENT AND CONTRACT DRILLING
SUBSEA ORDER VISIBILITY IMPROVES, BUT WEATHERFORD’S DELIVERIES ARE NOT NEW SUBSEA BOOKINGS (READ-THROUGH 3)
Affected company: TechnipFMC (FTI: United States). Direction: positive. Magnitude: meaningful for the group because Subsea represented approximately 90% of Q2 revenue; the immediate earnings impact remains unquantified.
Weatherford identified increasing deepwater sanctioning in Brazil, West Africa, the Mediterranean and Asia, describing the work as “longer cycle, technology intensive, and far less exposed to the short cycle volatility we see on land.” Its offshore awards span drilling, interventions and completions, indicating activity across multiple stages of field development rather than a single equipment category.
TechnipFMC benefits through subsea production systems, flowlines, risers, integrated project execution and subsequent services. Additional sanctioned developments and brownfield tiebacks expand the addressable order pipeline. Once awarded, these projects support engineering and manufacturing utilization, offshore installation activity and multiyear backlog conversion.
The signal is consistent with TechnipFMC’s existing outlook rather than a wholly new industry discovery. Its July release reported approximately $15.8 billion of Subsea backlog and reiterated approximately $10 billion of expected 2026 Subsea orders, followed by an anticipated increase in 2027. Weatherford adds independent support that customer activity is broadening across the same offshore basins.
The project sequence is critical. A Weatherford completion delivery can occur after the associated subsea equipment was already ordered. It may confirm execution of an existing project rather than signal a new TechnipFMC award. Neither Weatherford’s contracts nor its revenue should be assigned to TechnipFMC without a disclosed project relationship.
Near-term catalyst: TechnipFMC’s October 29 results, particularly order intake, the 2027 opportunity pipeline and conversion of named projects. Longer-duration implication: stronger confidence in offshore investment durability supports backlog replenishment and manufacturing efficiency into 2027-2029. The strongest read-through is improved visibility, not an independently established Q3 earnings beat.
MPD ADOPTION SUPPORTS HIGH-SPECIFICATION DRILLSHIP COMPETITIVENESS, NOT AN IMMEDIATE FLEET-WIDE EARNINGS RECOVERY (READ-THROUGH 4)
Affected company: Noble Corporation (NE: United States). Direction: positive over the medium term, with material near-term execution qualifications. Magnitude: potentially high because utilization and contract duration have substantial operating leverage.
Weatherford estimated that approximately 70% of drillships have, or are installing, managed pressure drilling systems, with penetration potentially rising to 85%-90%. Management stated: “It’s something that customers expect, not just MPD enablement, but the capability on the rig.” Weatherford also highlighted increasing deepwater sanctioning and expanding aftermarket requirements. Its earlier disclosures identified MPD contracts and an aftermarket agreement with Noble, establishing a direct commercial relationship rather than merely a shared theme.
MPD expands a rig’s ability to address difficult pressure windows and technically complex reservoirs. For Noble, the economic benefit is improved eligibility for demanding tenders, greater operating reliability and potentially longer customer commitments. The benefit flows through contracted days and utilization first; higher dayrates require evidence of sufficiently tight competing capacity.
Noble’s own Q2 results demonstrate why the distinction matters. Its marketed floater fleet was only 61% contracted during the quarter, while operational suspensions in Brazil contributed to a guidance reduction. At the same time, leading-edge Tier-1 drillship dayrates had increased into the mid-$400,000s. Stronger pricing for selected premium rigs can coexist with weak aggregate fleet utilization.
The earnings sensitivity is considerable. Illustratively, an additional contracted rig-year at $450,000 per day and 90% revenue-producing availability represents approximately $148 million of annual revenue before operating expenses, mobilization and capital expenditure. This is a sensitivity, not a Noble forecast or an assumption that MPD alone creates an additional contract.
There is also an economic cost. Equipment upgrades and associated services require spending, and broader MPD adoption eventually makes the technology a qualification requirement rather than a permanent source of differentiation. Some value accrues to the technology supplier rather than the rig owner.
Near-term catalyst: Noble’s October 26 results and October 27 call, especially fleet status, Brazil operations, idle-time exposure and new fixtures. Longer-duration implication: Weatherford supports the 2027-2028 demand case for technically capable rigs, but does not resolve Noble’s immediate utilization and execution risks.
NORTH AMERICAN DRILLING AND COMPLETIONS
TECHNOLOGY DIFFERENTIATION MATTERS MORE THAN A GENERALIZED SHALE RECOVERY TRADE (READ-THROUGH 5)
Affected companies: Patterson-UTI Energy (PTEN: United States), Liberty Energy (LBRT: United States) and Halliburton (HAL: United States). Direction: positive for differentiated equipment and execution; negative for relying on a broad hydraulic-fracturing recovery to drive Halliburton’s near-term upside. Magnitude: meaningful within drilling and completions businesses, but not uniform across consolidated companies.
Weatherford cautioned that it was “not expecting a noteworthy increase in overall activity levels over the next few months.” Its North American revenue nevertheless increased 15% sequentially, partly because of NCS consolidation, with another acquisition-related increase expected in Q4. Reported supplier growth therefore cannot be interpreted automatically as stronger underlying market activity.
Peer disclosures show that the market is also more differentiated than Weatherford’s cautious activity outlook might imply. Patterson-UTI’s July commentary described improved pricing and demand for larger, technically capable rigs, natural-gas-powered completion equipment and advanced automation. Liberty’s Q3 release reported modest price increases and emphasized the operating advantage of higher natural-gas substitution across its fleet. These observations contradict a blanket conclusion that all North American service providers lack pricing opportunities.
The positive transmission mechanism is customer-level productivity and cost reduction. Equipment that supports longer laterals, demanding well designs, lower fuel expense and more reliable execution can attract better utilization and pricing without a large increase in total industry activity. That supports Patterson-UTI’s and Liberty’s differentiated offerings, although Weatherford does not quantify their prospective market-share gains.
Halliburton provides the clearest negative contemporaneous evidence for a broad pumping recovery thesis. Its October 20 release reported a 5% sequential decline in North American revenue, principally from lower U.S. land pressure-pumping activity, and a 4% decline in Completion and Production revenue. Weatherford’s caution reinforces the risk of treating higher oil prices or improved rig counts as an immediate catalyst for substantially stronger pumping earnings.
The negative conclusion should not be overstated. Halliburton’s preliminary 2027 outlook already assumes a flat North American market and does not require hydraulic-fracturing recovery. Weatherford therefore reduces confidence in additional cyclical upside; it does not independently establish that Halliburton’s stated base case must be cut. Nor does it prove that Halliburton lost work specifically to Patterson-UTI or Liberty.
Near-term catalyst: Patterson-UTI’s late-October earnings update and customer activity plans entering Q4. Liberty and Halliburton had already reported the relevant quarter by October 24, making Weatherford corroborating or contrasting evidence rather than a prediction of their results. Longer-duration implication: favor demonstrated technology economics over undifferentiated exposure to higher rig counts. Liberty’s separate power business should not be valued using an oilfield-activity read-through.
PRODUCERS AND MATURE-FIELD REDEVELOPMENT
VENEZUELA IS MOVING FROM POLITICAL OPTIONALITY TO OPERATIONAL EXECUTION (READ-THROUGH 6)
Affected companies: Maurel & Prom (MAU: France) and Chevron (CVX: United States). Direction: positive. Magnitude: high relative exposure for Maurel & Prom; smaller at Chevron’s consolidated level, although strategically meaningful.
Weatherford recorded its first Venezuelan revenue in Q3, expects a tangible Q4 contribution and sees potential for approximately $100 million or more of revenue in 2027. Management emphasized purchase orders, hiring and facility preparation, stating that customer conversations had moved “from sort of what if to now, how soon, how fast.” The disclosed 46-unit progressive cavity pumping award provides a concrete example of production-oriented equipment demand.
The mechanism is operational rather than merely financial sentiment. Artificial lift, interventions and well rehabilitation can restore production from existing assets before large new drilling programs mature. Improved access to equipment and field-service capacity helps operators convert investment plans into working wells. It does not establish that Weatherford’s unnamed award belongs to either company identified here.
Maurel & Prom has the more concentrated exposure. Its October 22 update reported a 40% working interest in Urdaneta Oeste and Venezuelan working-interest production of 8,558 barrels per day over the first 9 months, approximately 22% of total reported group working-interest production. It also disclosed continuing workovers, 3 Q3 crude liftings and a drilling campaign planned for 2027. Weatherford’s service mobilization corroborates a wider rehabilitation cycle around an already economically important asset.
The accounting distinction is material. Maurel & Prom reports Venezuelan production outside consolidated sales. Additional field output should not be inserted directly into group revenue as though the operation were fully consolidated. Value depends on the economic interest, investment-level earnings and actual cash monetization or remittances. Successful liftings improve monetization visibility but do not automatically establish distributable cash.
Chevron’s September agreements provide a separate, larger-scale operating framework. Its joint ventures plan to invest more than $7 billion over 5 years and more than double production to approximately 600,000 barrels per day. Those are joint-venture figures, not Chevron net production or entirely Chevron-funded capital. Weatherford’s commentary supports implementation momentum, but does not independently accelerate Chevron’s published production timetable.
Near-term catalyst: Q4 purchase-order execution, field mobilization, workovers and continued crude liftings. Maurel & Prom’s October 22 update already corroborated the operating direction. Longer-duration implication: 2027 rehabilitation and drilling can increase recoverable production and cash monetization. Political, contractual, infrastructure and remittance risks remain, and early spending can precede the cash benefit.
The service-sector evidence is not sufficiently precise to support a high-conviction bearish oil-price forecast or a near-term heavy-crude differential trade.
SEPLAT’S AWARD SUPPORTS THE BROWNFIELD RECOVERY THESIS, NOT AN AUTOMATIC PRODUCTION UPGRADE (READ-THROUGH 7)
Affected company: Seplat Energy (SEPL: United Kingdom). Direction: positive. Magnitude: potentially meaningful at the group level because offshore production is a substantial share of its asset base.
Weatherford disclosed a 5-year contract to provide completions products and services, including gas-lift solutions, for Seplat’s shallow-water Nigerian operations. This is a direct customer relationship and a more specific signal than a general statement that African offshore activity is improving.
Gas lift and completion interventions address the productivity of existing wells by improving fluid movement, maintaining drawdown and restoring or sustaining well performance. For Seplat, the investment channel is incremental recoverable production and better use of existing processing and export infrastructure. Successful rehabilitation can improve cash generation without requiring an entirely new offshore development system.
Seplat’s first-half results provide the scale. Offshore operations contributed 78,819 barrels of oil equivalent per day out of group production of 139,509 barrels of oil equivalent per day, approximately 56%. Its idle-well restoration program added approximately 26,000 barrels per day of gross joint-venture production capacity from 24 wells during the first half. Weatherford’s contract supports continued execution of this operating model.
The qualification is important: added capacity is not the same as sustained realized production. Seplat’s first-half offshore production remained approximately 1% below the prior year despite the restoration work. Rehabilitation may offset depletion, downtime or other constraints before generating net growth. The supplier award is therefore positive for execution visibility, but insufficient by itself to raise production guidance.
Ownership also matters. Seplat disclosed an agreement to sell a 10% interest in the NNPCL-SEPNU joint venture. Any production or earnings model must use the applicable retained interest and transaction timing rather than applying historical ownership automatically to gross capacity additions.
Near-term catalyst: Q4 operating updates showing restored wells, actual uptime, delivery schedules and expenditure. The Weatherford call did not specify contract value or commencement volumes. Longer-duration implication: a sustained intervention program can improve recovery and extend asset life through 2027 and beyond, but the initial cash effect may be negative because service spending precedes production and collection.
CUSTOMER CREDIT AND OILFIELD-SERVICE CASH FLOW
MEXICAN PAYMENT NORMALIZATION REDUCES CREDIT RISK, BUT CASH RELEASES SHOULD NOT BE CAPITALIZED AS RECURRING EARNINGS (READ-THROUGH 8)
Affected companies: SLB (SLB: United States) and Halliburton (HAL: United States). Direction: positive for Mexican demand and customer-credit quality. Magnitude: potentially material to quarterly cash-flow timing, but smaller and less precisely measurable at consolidated earnings level.
Weatherford reported 14% sequential Latin American revenue growth, led partly by Mexico, alongside several consecutive quarters of regular payments from its largest Mexican customer. The CFO described collections as arriving “like clockwork,” while retaining that customer as the largest variable in quarterly free cash flow.
The transmission mechanism has 2 distinct components. Better payment regularity lowers overdue receivables and reduces the financing burden of serving the customer. It can also support a more sustainable level of field activity because suppliers have greater confidence that additional work will be paid. The first component improves cash realization; the second can support revenue and utilization.
The demand signal is corroborated across companies. Halliburton’s October 20 release reported increased activity across multiple product lines in Mexico. SLB’s October 23 release identified stronger Mexican offshore activity and double-digit Mexican growth within Reservoir Performance. Weatherford therefore supports a broader recovery in activity rather than an isolated collection outcome.
Cash timing, however, remains company-specific. Contract terms, receivable aging, invoicing, financing arrangements and customer priorities differ. Halliburton generated only $156 million of Q3 free cash flow despite its improving Mexican activity. Weatherford’s 61% quarterly EBITDA-to-free-cash-flow conversion cannot be transferred to Halliburton or SLB.
An arrears collection also does not create new EBITDA. Illustratively, collecting an additional $100 million of previously recognized receivables can add approximately $100 million to operating cash flow before other movements, but does not generate another $100 million of operating profit. A temporary release of accumulated receivables should not be valued as a permanent annual cash-flow increase.
Near-term catalyst: Q4 collection performance and year-end receivable disclosures, followed by early-2027 cash-flow reporting. Longer-duration implication: regular payments justify greater confidence in Mexican activity and potentially a lower customer-credit discount. They do not eliminate concentration risk or establish that historical arrears have been fully resolved.
Report record
- Sector
- Energy
- Industry
- Oil & Gas Equipment & Services
- Fiscal period end
- September 30, 2026
- Report date
- October 20, 2026
- Analysis
- 6454 words
- Read-throughs
- 3078 words
- Content fingerprint (PDF)
b6ba801c97d3- Content fingerprint (analysis)
b6de240d58bf- Content fingerprint (read-throughs)
5c89bb1bccb8
Prepared from the company's earnings release and earnings call transcript. Figures as reported by the company. For information only. Not investment advice.
More from Weatherford International
No other reports yet.
All Weatherford International reports
More in Energy
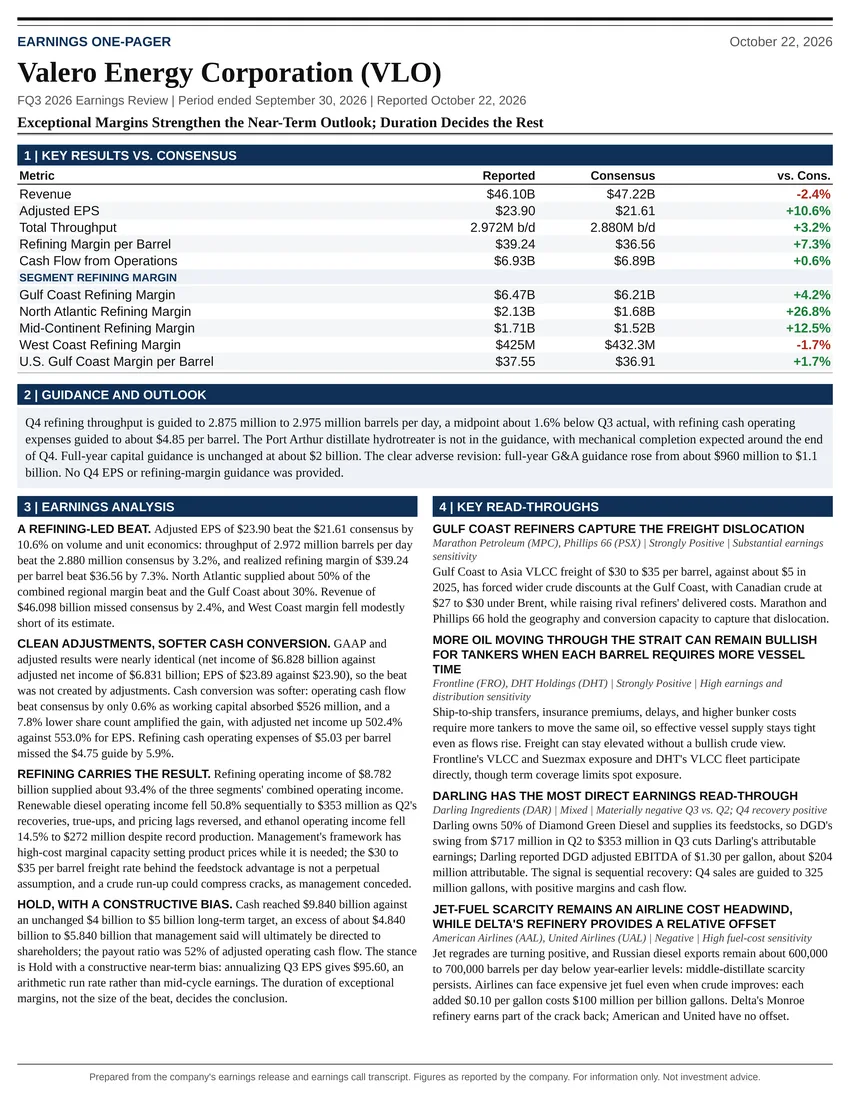
Exceptional Margins Strengthen the Near-Term Outlook; Duration Decides the Rest
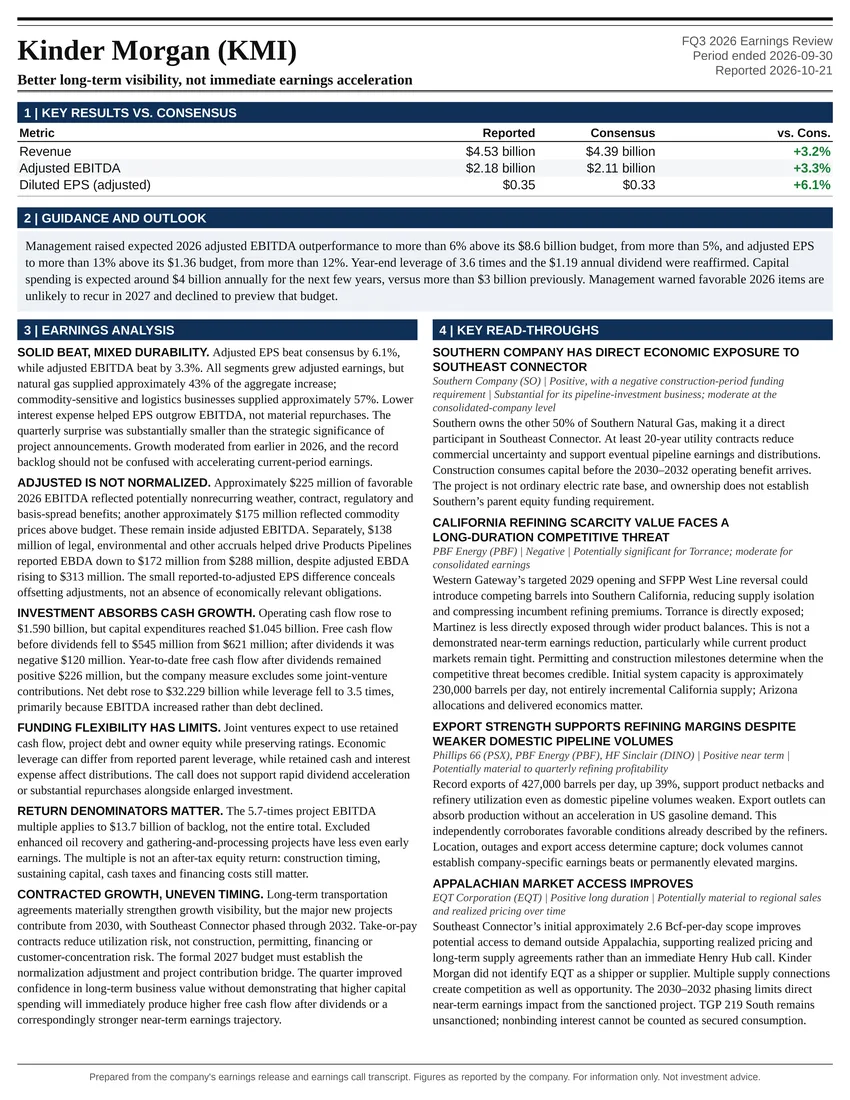
Better long-term visibility, not immediate earnings acceleration
Follow @AtlasPeakRes on X for new earnings reports as they publish.