A Larger and More Profitable Equipment Franchise, Not Yet a Cash-Generative Platform
Earnings Reports
ABB FQ3 2026 Earnings Report
ABB (ABB) FQ3 2026 earnings: Constructive on operating fundamentals but valuation-sensitive. Full earnings analysis, key read-throughs, and the one-page exhibit from Atlas Peak Research.
ABB (ABB)
Sector: Industrials · FQ3 2026 · Period end September 30, 2026 · Reported October 20, 2026
ABB’s Q3 2026 results strengthened the case for sustained earnings growth through 2027, but did not deliver a proportionate increase in near-term earnings expectations.
Download the one-page report (PDF)
View one-page exhibit
Download analysis (.md)
Download read-throughs (.md)
Post to X
One-Page Exhibit
Earnings Analysis
EXECUTIVE CALL SUMMARY: ABB Ltd (10/20/26)
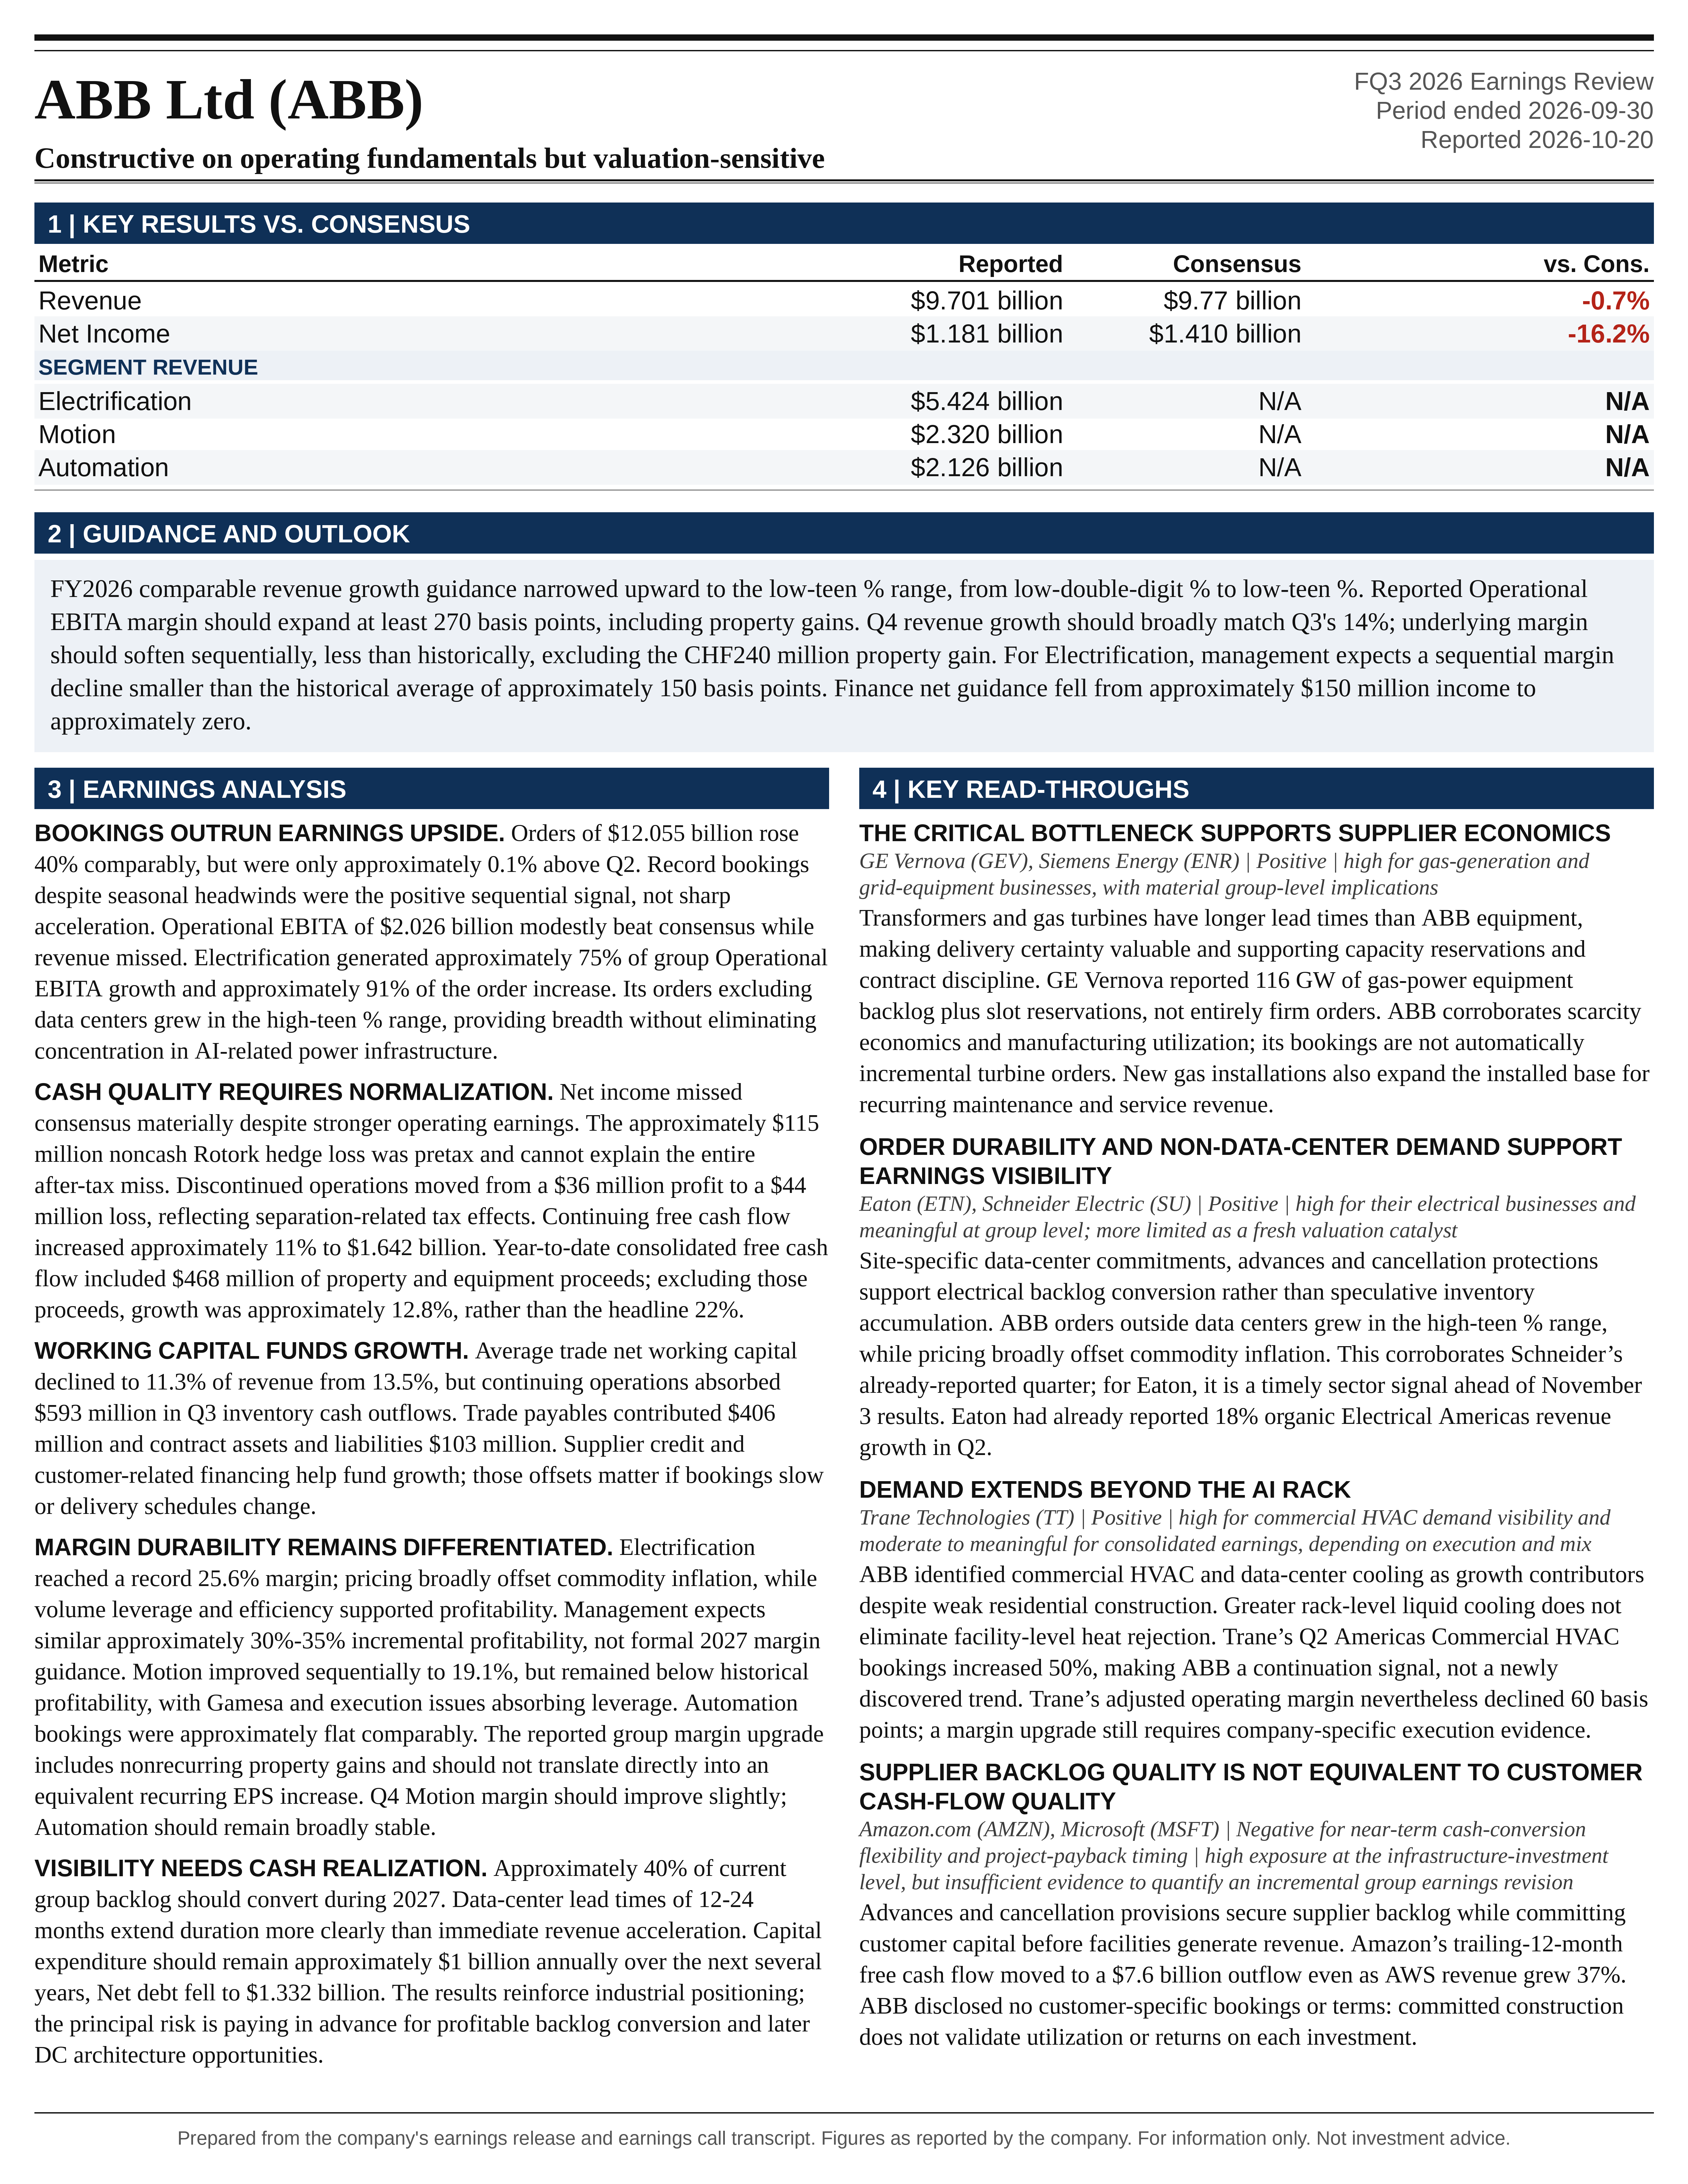
ABB’s Q3 2026 results strengthened the case for sustained earnings growth through 2027, but did not deliver a proportionate increase in near-term earnings expectations. The principal positive was exceptionally strong Electrification demand, supported by improving pricing, record profitability and continued strength outside data centers. The principal qualification was that orders are extending revenue visibility more than immediately accelerating revenue conversion. The investment conclusion is constructive on operating fundamentals but valuation-sensitive: the results support maintaining fundamentally justified exposure, rather than increasing exposure solely because of the headline order beat.
Orders reached $12.055 billion, increasing 40% on a comparable basis and exceeding the supplied Bloomberg consensus by approximately 5.5%. Revenue increased 14% to $9.701 billion, approximately 0.7% below consensus. Operational EBITA increased 24% to $2.026 billion, approximately 1.3% above consensus, while the 20.8% margin exceeded expectations by 20 basis points. Operating cash flow exceeded consensus by approximately 14.9%. This was a substantial bookings beat, a modest operating earnings beat and a strong cash-flow result, not a broad-based upside surprise across every financial measure.
The call’s most consequential forward-looking disclosures were the expectation that approximately 40% of the current group backlog will convert during 2027; management’s confidence that Electrification can maintain approximately 30%-35% incremental operating profitability; a broadly stable annual capital expenditure envelope of approximately $1 billion over the next several years; and Q4 revenue growth broadly consistent with Q3’s 14%. These statements support a relatively capital-efficient growth trajectory. They do not establish that revenue growth will converge with the much faster rate of order growth.
The full-year guidance improvement requires careful normalization. Comparable revenue growth was narrowed upward from the previous qualitative range spanning approximately 10% growth through the low-teen % range to the low-teen % range. The new forecast for at least 270 basis points of reported Operational EBITA margin expansion includes substantial property gains. Against the 2025 margin of 19.0%, it implies at least 21.7% in 2026, but that is not a recurring operating margin target. A $377 million Q1 property gain and a further CHF240 million Q4 gain materially elevate the reported outcome.
The negative share-price reaction was therefore consistent with an expectations and valuation problem rather than clear evidence of deteriorating demand. The accompanying Bloomberg notice reported an intraday decline of as much as 6.7%, alongside weakness in a broader European AI-related equity basket. Electrification bookings were exceptional, but strong data-center demand was already anticipated, current-quarter earnings were only modestly above consensus, and Q4 guidance did not imply a major acceleration. ABB’s operating exposure is diversified, but its incremental earnings growth and equity-market sensitivity are becoming increasingly concentrated in Electrification and AI-related power infrastructure.
OPERATING PERFORMANCE AND THE QUALITY OF THE QUARTER
ABB’s comparable revenue growth accelerated from 11% in Q1 to 12% in Q2 and 14% in Q3. Reported revenue reached a record $9.701 billion, versus $8.491 billion a year earlier and $9.475 billion in Q2. Foreign exchange and portfolio changes had approximately neutral aggregate effects on Q3 revenue growth, making the reported increase substantially representative of underlying commercial expansion. Volume was the primary driver, supplemented by net pricing of approximately 2%.
Order growth was stronger than revenue growth, but the sequential comparison is important. Q3 orders of $12.055 billion were only approximately 0.1% above Q2’s $12.042 billion. The acceleration in comparable order growth from 28% to 40% therefore reflects the year-earlier comparison as well as underlying demand. The genuinely positive sequential signal was that bookings remained at a record level despite the usual seasonal decline. It would be inaccurate to interpret the 40% growth rate as evidence that total quarterly bookings accelerated sharply from Q2.
Operational EBITA increased by $393 million year over year, while reported revenue increased by $1.210 billion. This implies approximately 32.5% incremental profitability using reported revenue. On ABB’s operational revenue definition, which adjusts foreign exchange and commodity timing effects, the corresponding incremental margin was approximately 31.1%. Both calculations indicate strong operating leverage, but the distinction matters because ABB’s published Operational EBITA margin is calculated against operational revenue rather than statutory revenue.
The quality of operating profit growth was favorable but uneven. Electrification generated approximately 75% of the increase in group Operational EBITA and approximately 76% of the increase in reported revenue. It also accounted for approximately 91% of the increase in reported group orders. Electrification represented approximately 56% of group revenue and 69% of group Operational EBITA, measured against consolidated totals after corporate costs and eliminations. ABB is not a single-market company, but the marginal source of growth was highly concentrated.
Gross margin declined 60 basis points to 40.6%, compared with consensus of 40.8%. This does not contradict the improved operating performance, because unrealized foreign exchange and commodity derivatives affected gross profit but are adjusted out of Operational EBITA. Nevertheless, it demonstrates why gross margin, statutory operating profit and Operational EBITA should not be treated as interchangeable indicators. Pricing and operational efficiency improved, while accounting timing effects and certain cost pressures obscured part of that improvement in statutory measures.
SG&A increased in absolute dollars but declined from 19.1% to 17.8% of revenue. R&D spending also increased. This is an important feature of the quarter: ABB expanded profitability while continuing to invest, rather than relying exclusively on absolute cost reductions. The durability of that leverage depends on continued revenue growth, because a material portion of the benefit reflects spreading overhead across a larger revenue base.
Corporate and Other losses narrowed to $132 million from $166 million, contributing $34 million, or approximately 9%, of group Operational EBITA growth. E-mobility losses declined to $18 million from $26 million, while stranded corporate costs declined to $25 million from $31 million. These improvements are supportive but should not be confused with a completed E-mobility turnaround or the elimination of Robotics-related stranded costs.
ELECTRIFICATION: THE CENTRAL EARNINGS DRIVER
Electrification orders reached $7.671 billion, increasing 70% comparably and approximately 6.1% sequentially. This was the 7th consecutive quarter of sequential order growth. Revenue increased 21% comparably to $5.424 billion, versus 19% comparable growth in Q2. Operational EBITA increased 27% to $1.394 billion, with margin expanding 110 basis points year over year and 70 basis points sequentially to 25.6%.
These results fulfilled the direction of the prior quarter’s guidance. At the Q2 call, management had expected Q3 comparable revenue growth at least similar to Q2’s 19% and a margin above 24.9%. Q3 delivered 21% growth and a 25.6% margin. The result was strong execution against an already demanding outlook, rather than an unanticipated change in trajectory.
Pricing contributed approximately 3% to revenue growth, strengthening from Q2. The CFO stated, “pricing now broadly offset commodity inflation.” This is a meaningful improvement from Q2, when pricing had not fully covered higher raw-material costs. It reduces the risk that volume growth is masking a deteriorating price-cost relationship and supports the persistence of incremental profitability.
The distinction between recovering input inflation and generating structural pricing power remains important. Pricing that offsets commodity inflation protects profit dollars but does not necessarily increase the margin percentage. Q3’s margin improvement therefore depended on volume leverage, efficiency and expense discipline in addition to price realization.
Demand was broader than data centers. Orders excluding data centers increased at a rate in the high-teen % range, and all large customer segments increased by at least 10%. Utilities, commercial buildings, industrial applications, transport infrastructure and semiconductor-related demand contributed. This breadth provides a meaningful buffer against a moderation in data-center bookings, although it does not eliminate the concentration of incremental growth in that market.
The geographic evidence was particularly strong. Electrification orders increased 117% comparably in the Americas, 20% in Europe and 46% in Asia, the Middle East and Africa. China increased 38% comparably. China’s performance partly reflected a favorable comparison and targeted execution in hospitality, healthcare and education, rather than a broad recovery in property demand. The strength should therefore be interpreted as exposure selection and execution within a weak overall construction environment.
Electrification’s backlog increased to $16.007 billion, up 83% in reported terms and 85% comparably. The book-to-bill ratio of 1.41 indicates substantial additional workload accumulation despite very strong revenue growth. This supports revenue visibility, but also raises the importance of manufacturing execution, supply-chain coordination and customer delivery schedules.
The CFO’s response on incremental margins was particularly relevant: “that gearing is going to be similar as we move forward.” The question referenced approximately 30%-35% operational gearing. This is not formal 2027 margin guidance, but it signals that management does not currently expect capacity expansion to cause a material deterioration in conversion economics. The statement is broadly consistent with Q3’s approximately 31% incremental Electrification margin on operational revenues.
US profitability remains an opportunity rather than a completed achievement. Management indicated that US Electrification margins remained below the business-area average and referred to a level around the high-teen % range. The wording does not support a precise regional margin estimate. The investment implication is that strong US revenue growth initially creates a potentially less favorable geographic mix, but also provides substantial scope for local efficiency improvements as capacity and execution mature.
DATA-CENTER ORDER QUALITY AND THE LIMITS OF BACKLOG PROTECTION
Management’s statements on order quality were reassuring. Wierod said that most large data-center orders arrive with “a significant advance payment or clear cancellation policies.” He also emphasized that orders relate to specific sites with permits, grid connections and financing in place. His conclusion was explicit: “We do not see any pre-ordering.”
These protections distinguish ABB’s project exposure from a conventional distributor inventory cycle. Site-specific engineering and customer advances reduce the attractiveness of speculative bookings, while cancellation provisions can protect committed costs and portions of project economics. They also make the backlog more credible than an unqualified aggregation of customer capacity intentions.
However, the call did not quantify advance-payment coverage, cancellation penalties, customer concentration, the proportion of orders that can be rescheduled or the financial strength of individual counterparties. Consequently, management’s statement establishes its current assessment of order quality, not a contractual guarantee that all backlog will convert on schedule and at the originally expected margin.
The distinction between cancellations and delays is especially important. A customer may remain committed to a project while postponing equipment delivery because of construction, power availability, transformer supply or generation constraints. Such delays can defer revenue without producing a visible cancellation. They can also increase inventory, storage, engineering and coordination costs.
Management indicated that the clear majority of data-center exposure is to hyperscalers and colocation operators, with a smaller contribution from neocloud providers. This is favorable from a counterparty-risk perspective, but colocation exposure is not independent of the ultimate economics of AI demand. A financially strong direct customer can still reduce future investment if tenant demand, leasing economics or financing conditions weaken.
The discussion of hyperscaler returns was less definitive than the discussion of current orders. Management reported customer confidence that investments would generate attractive returns, but did not provide independent evidence of utilization, AI monetization, incremental return on invested capital or the sustainability of financing structures. Customer confidence is relevant commercial information, but it is not sufficient validation of the ultimate return on the industry’s capital spending.
The clearest distinction is therefore between near-term project execution and the next investment cycle. ABB has strong evidence of currently committed demand. The call provided substantially less evidence about the economic sustainability of successive waves of AI infrastructure investment.
BACKLOG CONVERSION, CAPACITY AND CAPITAL INTENSITY
Group backlog reached $32.256 billion, increasing 35% in reported terms and 37% comparably. This is approximately 97% of 2025 revenue, but the apparent scale should not be mistaken for equivalent annual revenue coverage. Backlog includes projects with widely varying delivery schedules and does not capture all future short-cycle activity.
The CFO stated that the current backlog “will convert into next year at around 40%.” Applied to the quarter-end balance, this represents approximately $12.9 billion of potential 2027 revenue from backlog already booked. It does not imply 40% revenue growth, nor does it mean that all remaining backlog converts after 2027, because some will be delivered in Q4 2026. Additional 2027 revenue will depend on subsequent bookings, short-cycle products, service and project execution.
Electrification data-center lead times are generally 12-24 months, with orders booked during 2026 expected to ship principally during 2027 and 2028. Automation can contain projects extending as long as 10 years. Backlog growth therefore increases duration as well as visibility. A longer-duration backlog is valuable, but its present value is more sensitive to execution timing, input costs and the discount rate.
Management acknowledged that certain product lines, mainly in Electrification, are approaching high utilization until ongoing investments become operational during 2027. This is a genuine internal constraint. At the same time, Wierod said ABB is “very seldom really the bottleneck” for entire projects, because power transformers, gas turbines and construction can have longer lead times.
These statements are compatible. ABB can have individual production bottlenecks without controlling the critical path of a complete data-center project. The implication is that additional ABB capacity is necessary to sustain growth, but is not sufficient to guarantee faster customer delivery acceptance.
The approximately $1 billion annual capital expenditure envelope is a positive feature of the investment case. The CFO stated that spending was not expected to increase significantly over the next several years. ABB’s release described incremental capacity additions, automation and selective third-party assembly rather than an unrestricted expansion of fixed manufacturing assets.
If this capital envelope supports sustained revenue growth, capital expenditure intensity should decline and cash conversion should improve. The countervailing risks are greater reliance on supplier execution, third-party assembly economics and working capital. A stable capital expenditure budget is not equivalent to a fixed total cash requirement for growth.
MOTION: IMPROVING SEQUENTIALLY, STILL BELOW HISTORICAL PROFITABILITY
Motion orders increased 12% comparably to $2.455 billion. Revenue increased 9% comparably to $2.320 billion, with reported growth of 11% including approximately 2% from portfolio changes. The business benefited from short-cycle demand, grid investment, commercial HVAC, data-center cooling and selected industrial markets.
Revenue growth accelerated materially from Q2’s 4% comparable increase. Operational EBITA increased 7% to $449 million. Margin improved sequentially from 18.5% to 19.1%, although it remained 100 basis points below the prior-year level of 20.1%.
The sequential improvement was better than the Q2 call’s expectation that Q3 margin would be similar to Q2. Revenue growth also reached the upper end of the prior qualitative outlook for growth in the mid- to high-single-digit % range. Motion therefore provided a more favorable delivery against its own prior guidance than the year-over-year margin decline alone suggests.
Gamesa Electric accounted for approximately 40 basis points of margin dilution, down from approximately 70 basis points in Q2. It remained modestly loss-making. The remaining approximately 60 basis points of year-over-year margin deterioration reflected other operating and mix pressures, including inefficiencies in the High Power business and the arithmetic dilution associated with passing through commodity inflation.
The CFO said pricing offset commodity inflation in absolute terms, although not fully in percentage-margin terms. This is economically different from outright deterioration in gross profit dollars. Nevertheless, higher volume should normally support operating leverage, making the residual margin shortfall an execution issue requiring continued scrutiny.
Management expects Q4 comparable revenue growth similar to Q3 and a slight sequential margin improvement, contrary to the usual seasonal pattern. This depends partly on improved execution in project and systems activities. The near-term catalyst is therefore not simply stronger demand, but delivery on operational remediation.
Motion offers an additional earnings driver if margins recover toward historical levels. It also demonstrates that participation in electrification-related end markets does not automatically generate expanding margins when acquired businesses and execution problems absorb operating leverage.
AUTOMATION: MORE RESILIENT UNDERLYING PROFITABILITY THAN THE SEQUENTIAL HEADLINES SUGGEST
Automation orders were $2.114 billion, approximately flat comparably year over year and down approximately 13.9% sequentially. Revenue increased 5% comparably to $2.126 billion, while Operational EBITA increased 13% to $315 million. Margin improved 90 basis points year over year to 14.8%.
The sequential margin decline from Q2’s 15.4% requires normalization. Q2 included approximately $15 million, or 70 basis points, of support from a project-related provision release. Removing that item leaves an underlying Q2 margin near 14.7%, making Q3’s 14.8% broadly stable to slightly better. The headline sequential decline therefore overstates deterioration in recurring profitability.
The quarter also met the prior outlook for approximately mid-single-digit % comparable revenue growth and year-over-year margin improvement. The weakness was more evident in bookings than execution of existing work.
Management attributed the sequential order decline partly to large-project timing, while reporting growth in base orders. Importantly, Nordh clarified that order timing and Middle East weakness were separate issues: “the timing comment was not a direct link to Middle East.” Middle East softness had persisted since Q1 and should not be dismissed as a single delayed contract.
Marine, ports, energy resilience, selected oil and gas applications and machine building remained supportive. Chemicals, pulp and paper, and other process industries remained weak. Mining discussions improved, but management explicitly described this as an early change in sentiment rather than confirmed orders. Nuclear activity was high from a small base.
These distinctions matter for forecasting. The machine-building recovery remains supported by low comparisons, mining is not yet a confirmed bookings catalyst, and nuclear opportunities are long duration. The official release’s Rolls-Royce SMR memorandum of understanding represents an exploratory commercial relationship, not booked revenue or a guaranteed award.
Automation’s book-to-bill ratio of 0.99 and backlog of $10.567 billion indicate stability rather than deterioration in its accumulated workload. However, the business lacks Electrification’s powerful near-term demand acceleration. Q4 guidance for approximately low- to mid-single-digit % revenue growth and a margin broadly stable with Q3 implies continued execution improvement, not a broad process-industry recovery.
GUIDANCE: WHAT CHANGED AND WHAT DID NOT
The latest full-year outlook continues a series of upward revenue revisions. At the January 2026 release, ABB expected 6%-9% comparable revenue growth. The Q1 release raised the qualitative outlook to a range spanning high-single-digit % through low-double-digit % growth. The Q2 release raised it again to a range spanning low-double-digit % through low-teen % growth. Q3 narrowed the expectation to the low-teen % range.
The cumulative change since January is substantial. The incremental change since July is more modest, principally removing the lower end of the previous outlook. This distinction supports Citi’s observation in the supplied commentary that the revised guidance implied little change to Q4 expectations.
Q4 group revenue growth is expected to be broadly similar to Q3’s 14%. Electrification is expected to grow in the high-teen % to low-20% range, Motion broadly around Q3’s 9%, and Automation at approximately low- to mid-single-digit % rates. The mix implies continued leadership from Electrification rather than a synchronized acceleration across the portfolio.
For Electrification, management expects a seasonal sequential margin decline smaller than the historical average of approximately 150 basis points. A mechanical subtraction from Q3’s 25.6% would produce 24.1%, so the qualitative guidance points to an outcome somewhat above that benchmark, without establishing an official numerical floor. Motion is expected to improve slightly sequentially, while Automation aims to remain broadly stable.
The full-year reported Operational EBITA margin target implies at least 21.7%, compared with 19.0% in 2025. However, the $377 million Q1 property gain and CHF240 million Q4 gain remain inside this reported operational measure. The phrase “Operational EBITA” therefore does not mean that the result excludes all nonrecurring gains.
An illustrative revenue bridge demonstrates the importance of this distinction. Applying 14% growth to Q4 2025 revenue of $9.052 billion, while assuming no net currency or portfolio effect, produces approximately $10.3 billion of Q4 revenue and $38.2 billion for 2026. This is an analytical sensitivity, not company guidance. Using approximately equivalent operational revenues, the 21.7% annual margin threshold requires a Q4 reported margin near 22.4%, including the property gain.
There is no contradiction between that implied reported margin and management’s guidance for sequentially lower underlying profitability. The property gain can contribute several percentage points to Q4 margin. The correct comparison is underlying Q4 profitability excluding the gain, not the reported quarterly margin including it.
The financial framework also contains offsets below Operational EBITA. Full-year finance net guidance moved from approximately $150 million of income to approximately zero, including the acquisition-related foreign exchange hedge. Separation and integration costs increased from approximately $75 million to $100 million. Corporate and Other Operational EBITA guidance, excluding E-mobility, improved from an approximately $100 million loss to approximately $200 million of profit, predominantly reflecting the property transaction.
Consequently, the reported margin upgrade should not be translated directly into a comparable increase in recurring EPS. The new property gain is partially offset by weaker finance net and higher transaction-related expenses. Further hedge volatility remains possible before Rotork closes.
STATUTORY EARNINGS AND THE EPS DECLINE
Net income attributable to ABB declined 2% to $1.181 billion, and EPS declined to $0.65 from $0.66. Against the supplied Bloomberg net-income consensus of $1.410 billion, the shortfall was approximately 16.2%. This was materially weaker than the operating earnings comparison.
The approximately $115 million noncash revaluation loss on the Rotork-related foreign exchange hedge was a major contributor. It is reasonable to separate this item from recurring industrial performance, but not to assume that it explains the entire consensus miss. The charge is pretax, while the consensus comparison is after tax, and other items also affected earnings.
Continuing-operations net income attributable to ABB increased to $1.225 billion from $1.172 billion. Continuing-operations EPS increased to $0.68 from $0.64. Discontinued operations attributable to ABB moved from a $36 million profit to a $44 million loss. This $80 million deterioration explains why total EPS declined despite improvement in continuing earnings.
The Robotics-related discontinued business generated pretax income of $53 million, compared with $56 million a year earlier. Its tax expense increased to $96 million from $19 million, reflecting separation-related tax effects. The reported discontinued loss therefore should not be interpreted as an equivalent collapse in Robotics’ underlying operating profitability.
Additional factors also constrained statutory earnings. Non-operational pension income shifted from a $12 million credit to a $35 million expense, an adverse movement of $47 million. The gap between Operational EBITA and statutory operating income widened from $31 million to $180 million, reflecting foreign exchange and commodity timing, acquisition and divestment costs, and other adjustments.
Statutory operating income still increased 15% to $1.846 billion, with margin reaching 19.0%. However, its margin improvement was only approximately 10 basis points, versus 160 basis points for Operational EBITA. Both measures are relevant: adjusted performance supports the underlying growth thesis, while statutory results capture genuine transaction, restructuring and accounting costs borne by shareholders.
CASH FLOW: STRONG CONTINUING OPERATIONS, MATERIAL PROPERTY BENEFITS
Q3 operating cash flow increased 5% to $1.862 billion, while free cash flow increased 2% to $1.576 billion. Continuing operations performed materially better than the consolidated growth rate suggests: continuing operating cash flow increased 12% to $1.888 billion, and continuing free cash flow increased approximately 11% to $1.642 billion.
Discontinued operations generated a $66 million free-cash-flow outflow, compared with a $73 million inflow a year earlier. This $139 million deterioration absorbed most of the improvement in continuing free cash flow. The modest consolidated increase therefore understates the strength of the retained business.
Year-to-date free cash flow increased 22% to $3.707 billion. ABB’s definition includes proceeds from sales of property, plant and equipment, so normalization is essential. These proceeds were $468 million across continuing and discontinued operations during the first 9 months, compared with $177 million a year earlier.
Excluding those proceeds, consolidated free cash flow was approximately $3.239 billion, compared with $2.872 billion, an increase of approximately 12.8%. For continuing operations alone, excluding property and equipment sale proceeds, free cash flow increased approximately 32.4% to $3.535 billion. This is strong evidence that cash improvement is not solely an asset-disposal phenomenon.
Working-capital efficiency also improved. Average trade net working capital declined to 11.3% of revenue from 13.5% a year earlier. However, the cash-flow statement shows substantial inventory investment: continuing operations absorbed $593 million in Q3 inventory cash outflows, partly offset by $406 million from trade payables and $103 million from contract assets and liabilities.
This is a more nuanced picture than an absence of working-capital pressure. ABB is funding growth through a combination of supplier credit, customer-related financing and disciplined asset management. Those offsets are economically useful, but their sustainability matters if booking growth slows or delivery schedules change.
The CFO endorsed a path toward approximately $5 billion of 2026 free cash flow. From the 9-month level, this requires approximately $1.293 billion in Q4, compared with $1.517 billion in Q4 2025. The threshold is therefore not especially demanding, particularly with another property sale contributing.
The transcript contains an unresolved difference in the expected Q4 property-related cash contribution: approximately $300 million in prepared remarks and $260 million in the Q&A. The CHF240 million accounting gain is a separate measure and should not be substituted for either cash figure. A reasonable analytical treatment is to retain a $260 million-$300 million cash range pending reconciliation.
At exactly $5 billion of annual free cash flow, removing the $468 million of property and equipment proceeds already received and the additional $260 million-$300 million discussed for Q4 would leave approximately $4.23 billion-$4.27 billion, before any other Q4 disposal proceeds. The comparable 2025 figure excluding property and equipment proceeds was approximately $4.37 billion. This conditional calculation does not establish deterioration in the retained business, given discontinued-operation and tax effects, but it demonstrates that a $5 billion headline alone would not prove growth in recurring consolidated cash generation.
DIRECT CURRENT ARCHITECTURE: STRATEGIC UPSIDE WITH A LONGER COMMERCIAL TIMELINE
The Infinitus portfolio is strategically important because it positions ABB to participate across several possible data-center power architectures rather than relying on a single technical outcome. Its 5 building blocks span medium-voltage powertrains, DC sources and power quality, DC distribution, DC protection and cooling optimization.
Management’s strongest strategic claim concerns the location of electrical infrastructure spending. Wierod said that “as much as 75% of the spend on electrical power infrastructure can be linked to the gray space,” compared with approximately 55% in legacy AC architecture. Gray space already represents the majority of ABB’s data-center exposure.
At a constant total electrical infrastructure budget, that shift would increase the gray-space spending pool by approximately 36%. This is a potentially significant expansion of ABB’s addressable scope. It is not equivalent to a 36% increase in ABB revenue, because the total budget, product substitution, competitive share and realized pricing may all change.
Centralized DC architecture can eliminate conversion stages and move power conversion away from compute space. However, simplification may also remove components that suppliers currently sell. The relevant economic measure is ABB’s captured revenue and profit per unit of installed compute power, not simply the movement of spending between physical areas of a facility.
The engineering opportunity is substantive. High-density racks place increasing demands on current handling, conductor size, thermal management and protection. DC interruption lacks the natural current zero-crossing available in AC systems, increasing the importance of fast, selective protection and robust semiconductor-based switching. ABB’s combination of protection, conversion, controls and medium-voltage expertise is therefore commercially relevant.
The moat is not established solely by breadth of product offering. Reliability, certification, interoperability, fault coordination, efficiency across operating loads, maintainability and customer qualification will determine adoption. A technology transition can favor incumbents with system expertise while simultaneously allowing new power-electronics specialists to capture parts of the value chain.
The timing is later than a superficial reading of the launch might suggest. Solid-state transformers are expected to become available to order in H2 2027. ABB’s September 21 launch announcement indicated that the first DC-native facilities using the complete Infinitus portfolio were expected to become operational within 2-3 years, implying approximately 2028-2029. Component availability in 2027 is not equivalent to full-system deployment or material revenue recognition in that year.
This supports separating the investment thesis into current demand for conventional and transitional architectures, and later potential content gains from native DC. Much of the present backlog supports the former. The latter is an important strategic option rather than a demonstrated contributor to current earnings.
Management’s efficiency examples also require careful interpretation. A 5% reduction in the power requirement of a continuously operating 500 MW facility would represent approximately 219 GWh annually, broadly consistent with the call’s approximately 200 GWh illustration after allowing for operating assumptions. At an illustrative electricity price of $100 per MWh, 200 GWh would be worth approximately $20 million annually.
The terminology matters. A 5% reduction in conversion losses is not mathematically equivalent to a 5% reduction in total facility electricity consumption. ABB’s launch material describes system-level efficiency gains above 5%, which is the interpretation consistent with its power and energy illustrations.
The claim that 5-6 MW of additional compute capacity could support approximately $100 million in annual operator revenue is a scenario, not a measured outcome. It depends on hardware availability, utilization, workload economics and realized compute pricing. ABB’s September launch used a different example of more than $300 million from 25 MW of incremental IT capacity, demonstrating that monetization assumptions are not standardized.
Energy savings and incremental compute revenue also should not be fully added together when they represent alternative uses of the same released power capacity. A facility can reduce electricity consumption, expand compute within a fixed power envelope, or combine the benefits, but double counting would overstate the economics.
The Ferrari Hypersail project is best viewed as a demanding technical demonstration of DC microgrid capabilities, not a meaningful earnings catalyst. Likewise, the ABB-BCG report supports the strategic logic of hybrid AC/DC systems but is not independent evidence of ABB’s future market share or realized returns.
MITSUBISHI ELECTRIC: ATTRACTIVE MARKET ACCESS, DELAYED EARNINGS CONTRIBUTION
The Mitsubishi Electric transaction addresses a clear strategic gap: ABB’s limited position in Japan’s low-voltage distribution market. It adds local customer relationships, manufacturing, product qualifications and channels that would be difficult to reproduce quickly through organic investment.
The official transaction announcement provides detail beyond the call. ABB will invest approximately $495 million for a 51% controlling stake in the newly carved-out company and full ownership of related sales operations outside Japan. Those overseas sales operations represent approximately 15% of revenue. The transaction therefore is not simply a purchase of 51% of a uniformly owned $640 million revenue business.
The acquired business generated approximately $640 million in revenue in Mitsubishi Electric’s fiscal 2025, which ended in March 2026. Enterprise value of approximately $890 million implies 1.4x sales and 11.1x EBITDA. The stated EBITDA multiple implies approximately $80 million of historical EBITDA, or a margin near 12.5%.
The transcript refers to the initial profitability measure as EBITDA in prepared remarks and EBITA in the Q&A. The official transaction materials specify EBITDA. Accordingly, the starting margin should not be compared directly with the target of at least 20% Operational EBITA without recognizing the different definitions.
At unchanged revenue, a 20% Operational EBITA margin would imply approximately $128 million of annual Operational EBITA. That is substantially above the approximately $80 million implied historical EBITDA, illustrating the scale of the intended improvement without pretending the measures are directly comparable. Actual results will also depend on revenue growth, restructuring and integration costs.
Management targets the 20% margin within 5 years of completion and expects EPS accretion after the first year. With closing anticipated in H2 2027, the full margin objective extends approximately to 2032. This is a medium-term value-creation program, not a solution to near-term earnings expectations.
ABB’s GE Industrial Solutions experience provides a relevant operational precedent, but does not eliminate execution risk. Product localization, Japanese customer requirements, technology selection, manufacturing changes and joint-venture governance remain important.
The planned full consolidation of the JV means ABB can report its full controlled revenue and operating result, while minority ownership affects earnings attributable to ABB shareholders. The transaction can therefore contribute more to reported revenue than a simple 51% multiplication suggests, without giving ABB shareholders 100% of its economics.
Even the 20% target margin remains below Electrification’s current 25.6%. The transaction may therefore be margin-dilutive to the business area while still producing attractive returns and EPS accretion. Margin accretion is not a necessary condition for value creation.
Management’s language about a firm route to full ownership was stronger than the official announcement’s description of an option for full ownership. The option should not be treated as a guaranteed acquisition on a disclosed timetable or at a known future price. Expansion into other Mitsubishi Electric businesses was described as a potential future discussion, not an agreed transaction.
CAPITAL ALLOCATION, ROTORK AND BALANCE-SHEET CAPACITY
Net debt declined to $1.332 billion from $2.320 billion at the end of Q2, and net debt to EBITDA declined to approximately 0.2x. The CFO indicated that leverage could rise toward 2.0x while remaining within the current rating area, implying approximately $13 billion-$14 billion of additional gross financing capacity.
This is substantial flexibility, but not an uncommitted acquisition budget. Signed transactions, shareholder distributions, closing timing, taxes and liquidity reserves must be considered. The leverage statement reflects management’s assessment, not a binding rating-agency commitment.
The approximately $5.5 billion Rotork acquisition is intended to be substantially funded by approximately $4.8 billion of expected net Robotics disposal proceeds. Adding the approximately $495 million Mitsubishi investment produces an initial funding requirement of roughly $1.2 billion beyond those disposal proceeds, before intervening cash generation, distributions and other adjustments.
Rotork is expected to close in H1 2027, while the Robotics disposal remains targeted for completion by the end of 2026. That sequencing is favorable if achieved. Regulatory or closing delays could change temporary funding needs and prolong transaction-related earnings volatility.
ABB’s previously disclosed Rotork rationale emphasized complementary actuators, installed-base relationships and automation capabilities. The transaction was expected to add approximately 3% to group revenue, improve Operational EBITA margin immediately and become EPS-accretive in the 2nd year after integration. Those benefits should not be brought forward into a full-year 2027 forecast without accounting for actual closing timing and purchase accounting.
The decentralized ABB Way model provides a plausible mechanism for running multiple integrations because different divisions own the programs. It does not remove execution risk, particularly while Motion is still improving Gamesa’s performance and Electrification is simultaneously expanding capacity.
ROCE of 29.9% increased from 24.8% a year earlier and 28.4% in Q2. This demonstrates strong current capital productivity. However, management’s commitment to remain above 20% after larger acquisitions allows a substantial decline from the current level. The investment case should distinguish between preserving an attractive absolute return and preserving today’s exceptional return.
INTERNAL AI: OPTIONALITY WITHOUT A QUANTIFIED EARNINGS BRIDGE
Management described approximately 10,000 internally created AI agents and a program spanning employee productivity, business-process redesign and customer-facing technology. Examples included service agents, faster internal processes and redesigned workflows.
The program is strategically relevant, but no consolidated savings, revenue contribution or return-on-investment figure was provided. Wierod explicitly declined to quantify a company-wide productivity improvement. The number of agents is therefore an adoption metric, not an earnings metric.
The focus on token costs and application-level returns is constructive. Nevertheless, the current evidence does not justify adding a separate AI productivity benefit on top of the observed operating leverage and expense-ratio improvements. That would risk counting the same efficiency benefit twice.
INVESTMENT IMPLICATIONS, SCENARIOS AND RISK PARAMETERS
The central positive change is greater confidence in the duration of Electrification growth and its conversion into profit. The central unresolved issue is how much of that confidence is already embedded in the share price. The supplied analyst commentary spans neutral, hold and sell recommendations, with valuation and AI sentiment prominent in the more cautious assessments.
The statement in the supplied Vontobel summary that margin expansion was driven by all business areas requires correction against the actual results. Operational EBITA increased in all 3 business areas, but Motion’s margin declined 100 basis points year over year. The distinction reinforces the need to separate profit growth from margin expansion.
Illustrative 2027 scenarios can frame the operating opportunity, but they are not management guidance. Using an approximately 20% recurring 2026 Operational EBITA margin as a rounded analytical starting point, after removing the major property gains, a base case with 50% probability assumes 10%-13% comparable revenue growth and a 20.75%-21.5% recurring margin. This implies approximately 14%-21% growth in underlying Operational EBITA at constant currency and perimeter.
That base case assumes orderly backlog conversion, continuing strength outside data centers, modest improvement in US Electrification profitability and gradual Motion remediation. It does not require another year of data-center order growth above 100%, a broad process-industry recovery or material earnings from fully deployed native-DC facilities.
A bull case with 25% probability assumes 15%-18% comparable revenue growth and a 22%-22.5% recurring margin, implying approximately 27%-33% underlying Operational EBITA growth. It requires faster backlog conversion, successful capacity additions, sustained incremental profitability and stronger recovery in the businesses currently restraining group margins. Early DC design wins could support valuation, although substantial complete-system deployments would still be later.
A bear case with 25% probability assumes 0%-5% comparable revenue growth and an 18.5%-19.5% recurring margin, implying approximately an 8% decline to 2% growth in underlying Operational EBITA. This would arise from project deferrals, weaker new AI infrastructure commitments, price-cost deterioration, underutilized capacity or persistent execution problems. A severe cancellation cycle is not required to produce a disappointing outcome if the starting valuation assumes continued rapid growth.
These probabilities are analytical judgments rather than statistically estimated forecasts. They exclude acquisition contributions and currency movements to isolate the operating thesis. They should not be translated directly into EPS growth or share-price returns.
Valuation can dominate even a favorable earnings outcome. Illustratively, 15% EPS growth combined with a 20% decline in the earnings multiple produces an approximately 8% share-price decline before dividends. The same EPS growth with a 10% multiple decline produces only approximately 3.5% appreciation. The quarter’s negative market reaction is therefore compatible with improving business fundamentals.
The portfolio implication is that ABB provides exposure to electrical infrastructure, industrial efficiency and grid investment, but should not be treated as independent diversification from an existing AI capital-spending basket. Demand can be correlated through hyperscalers, colocation operators, semiconductor facilities, grid connections and behind-the-meter generation. The correlation may be greater in a downside scenario than sector classifications suggest.
The appropriate event-level action is to maintain exposure where recurring cash generation and valuation already justify it, while avoiding an increase based solely on the order beat or reported margin upgrade. A precise entry price, price target and portfolio weight are not supportable without a verified contemporaneous valuation, investment horizon and portfolio exposure. Position risk should be constrained by a predefined loss budget and tested against simultaneous earnings downgrades and multiple compression, not against the operating scenario alone.
Fundamental review triggers include failure to deliver Q4 revenue growth broadly around Q3’s level; a larger-than-signaled underlying Electrification margin decline; failure of Motion’s margin to improve sequentially; weakening customer advances or deteriorating cancellation terms; rising inventory without corresponding delivery progress; and an increase in capital expenditure materially beyond the current approximately $1 billion framework without improved returns.
The most important exit criterion is not a single quarter of lower order growth against an unusually strong comparison. It is evidence that the relationship among backlog conversion, incremental margins and cash realization has structurally weakened. A second exit criterion is valuation that requires the bull case while providing inadequate protection against project delays or multiple compression.
CATALYSTS AND THE EVIDENCE REQUIRED NEXT
The next major catalyst is the Q4 results release scheduled for January 28, 2027, when management expects to provide full-year 2027 guidance. That forecast will determine whether backlog visibility translates into sufficiently strong revenue and recurring margin expectations to support further earnings revisions.
Before then, completion of the Robotics disposal remains a balance-sheet catalyst, while Q4 property gains will affect reported earnings and cash flow without establishing a stronger recurring run rate. H1 2027 brings the expected Rotork closing and continued capacity additions. H2 2027 includes the planned Mitsubishi transaction completion and solid-state transformer order availability. Complete Infinitus-based DC-native facilities represent a later, approximately 2028-2029, commercial milestone.
The most valuable incremental disclosures would be data-center revenue and backlog exposure; the proportion of backlog protected by advances and meaningful cancellation terms; delivery rescheduling trends; US Electrification margin progression; regional capacity utilization; and recurring free cash flow excluding property transactions and discontinued operations.
Overall, Q3 materially reinforced ABB’s industrial positioning and medium-term revenue visibility. It provided less evidence of an immediate step-change in recurring earnings than the bookings and reported margin headlines suggest. The durable investment opportunity rests on converting backlog into profitable, cash-generative growth while preserving capital discipline. The principal investment risk is paying in advance for that conversion and for a DC architecture opportunity whose broad commercial realization remains several years away.
COMPANY EMPLOYEES ON THE CALL
• Morten Wierod, Chief Executive Officer. • Christian Nilsson, Chief Financial Officer. • Ann-Sofie Nordh, Group Senior Vice President and Head of Investor Relations.
RESEARCH ANALYSTS ON THE CALL
• Alexander Virgo, Evercore ISI. • Andre Kukhnin, UBS. • Ben Heelan, Bank of America. • Ben Uglow, Oxcap Analytics. • Daniela Costa, Goldman Sachs Group, Inc. • Delphine Brault, ODDO BHF. • Eric Lemarie, CIC Market Solutions. • James Moore, Rothschild & Co Redburn. • Magnus Kruber, Nordea. • Max Yates, Morgan Stanley. • William Mackie, Kepler Cheuvreux.
ADDITIONAL ONLINE QUESTION CONTRIBUTORS IDENTIFIED IN THE TRANSCRIPT
• Frederic, phonetic identification with surname not provided, SEB. • Thomas Jaeger, phonetic identification, affiliation not provided. • Mattias Holmberg, phonetic identification, affiliation not provided. • George, phonetic identification with surname and affiliation not provided.
Key Read-Throughs
KEY READ-THROUGHS FROM ABB’S Q3 2026 EARNINGS CALL
ABB’s results reinforce a differentiated market conclusion: investment in electricity availability, distribution and cooling remains exceptionally strong, while conventional process-industry capital spending remains subdued. The most actionable implication is not simply continued AI infrastructure growth. It is the separation between suppliers controlling scarce power infrastructure, equipment manufacturers converting existing commitments into earnings, and customers absorbing cash outflows before new capacity becomes productive. ABB’s order protections support the durability of committed projects, but long delivery schedules limit the immediate earnings implications. Meanwhile, the move toward centralized DC architecture expands the competitive overlap between electrical equipment suppliers and data-center infrastructure specialists. The highest-conviction implications are presented below. Countries indicate corporate domicile, and magnitude assessments describe business or financial exposure rather than predicted share-price movements.
POWER GENERATION AND GRID EQUIPMENT: THE CRITICAL BOTTLENECK SUPPORTS SUPPLIER ECONOMICS (READ-THROUGH 1)
Affected companies: GE Vernova (GEV: United States) and Siemens Energy (ENR: Germany). Direction: positive. Magnitude: high for gas-generation and grid-equipment businesses, with material group-level implications.
The strongest evidence is management’s identification of the equipment constraining project completion. Wierod stated that “power transformers” and “gas turbines” have longer lead times than ABB’s equipment and that ABB is “very seldom really the bottleneck.” He also described utility investment as being driven simultaneously by aging infrastructure, electricity-demand expansion and the energy transition, with strength across all reporting regions.
The transmission mechanism extends beyond higher equipment volumes. When transformers and turbines determine when an entire facility can become operational, delivery certainty becomes economically valuable. Customers have incentives to reserve manufacturing capacity earlier, commit deposits and prioritize dependable suppliers. This supports order visibility, contract discipline and the opportunity to secure attractive economics on future production slots. For gas turbines, new installations also expand the eventual installed base for recurring maintenance and service revenue.
Existing peer disclosures corroborate this mechanism. GE Vernova reported 116 GW of gas-power equipment backlog plus slot reservations at the end of Q2, compared with 100 GW previously. These categories should not be confused with an entirely firm equipment-order backlog. Siemens Energy’s fiscal Q3 disclosure showed Gas Services orders increasing 61.9% comparably, while Grid Technologies orders increased 27.6%; transformer demand, including data-center projects, was a major contributor. Siemens Energy also explicitly identified customer advances and reservation fees as supporting cash generation.
ABB therefore provides additional evidence that the scarcity is commercially consequential, rather than merely a supplier narrative. However, ABB’s downstream electrical bookings are not automatically incremental turbine orders: some upstream equipment may already have been reserved for the same projects. The higher-conviction conclusion is continued support for backlog quality, future contract economics and manufacturing utilization.
Near-term catalyst: GE Vernova’s October 28 results and Siemens Energy’s forthcoming fiscal-year results and FY2027 outlook. The decisive disclosures are equipment pricing, reservation-to-order conversion, capacity expansion and customer advances, not simply headline order growth. Longer-duration impact: favorable earnings and service-revenue implications through 2027-2030 and beyond. The principal risk is that excessive expansion eventually weakens scarcity economics, not that ABB’s current evidence signals an immediate demand reversal.
ELECTRICAL DISTRIBUTION: ORDER DURABILITY AND NON-DATA-CENTER DEMAND SUPPORT EARNINGS VISIBILITY (READ-THROUGH 2)
Affected companies: Eaton (ETN: Ireland) and Schneider Electric (SU: France). Direction: positive. Magnitude: high for their electrical businesses and meaningful at group level; more limited as a fresh valuation catalyst.
ABB’s Electrification orders increased 70%, with data-center orders growing above 100%. More importantly for assessing resilience, orders excluding data centers increased at a rate in the high-teen % range. US group base orders increased approximately 50%. Management stated that large data-center orders generally carry “a significant advance payment or clear cancellation policies,” and relate to specific sites with permits, grid connections and financing. Wierod concluded: “We do not see any pre-ordering.”
This combination supports a more durable demand interpretation than a conventional distributor restocking cycle. Site-specific engineering, customer commitments and contractual protections reduce the likelihood that strong electrical bookings consist primarily of speculative inventory accumulation. For Eaton and Schneider, the relevant transmission is sustained demand for switchgear, breakers, power distribution, protection and associated systems, followed by backlog conversion and fixed-cost absorption.
The profitability signal is also constructive. ABB’s Electrification pricing contributed approximately 3% to revenue growth and “broadly offset commodity inflation.” When questioned about approximately 30%-35% incremental profitability, the CFO indicated that similar gearing could continue. This supports the proposition that strong demand is translating into profit rather than being entirely absorbed by raw-material inflation and capacity costs. It does not justify transferring ABB’s exact incremental margin to competitors with different product, geographic and acquisition mixes.
The novelty differs materially by company. Schneider had already reported Q3 on October 16, including 19% organic Energy Management revenue growth and data-center demand growth above 100%. ABB is therefore corroboration of Schneider’s published results, not a new prediction of that quarter. For Eaton, ABB is a timely positive sector signal before its November 3 results. Eaton had already reported 18% organic Electrical Americas revenue growth in Q2 and 41% growth in its rolling 12-month organic order measure, making strong demand an established expectation rather than a surprise.
The geographic qualification is important. ABB’s strong China orders were supported partly by utilities, industrial applications and selected hospitality, healthcare and education projects despite weak property markets. This supports electrical exposure to targeted investment, not an indiscriminate China construction-recovery trade.
Near-term catalyst: Eaton’s November 3 earnings, particularly electrical backlog conversion, pricing and capacity utilization. For Schneider, the next meaningful catalyst is additional evidence on 2027 conversion and profitability. Longer-duration impact: favorable 2027-2028 revenue visibility. The principal limitation is that ABB’s 12-24-month data-center delivery schedules support duration more clearly than immediate quarterly revenue acceleration.
JAPANESE ELECTRICAL EQUIPMENT: MITSUBISHI ELECTRIC GAINS CAPITAL RELEASE AND RETAINED TURNAROUND PARTICIPATION (READ-THROUGH 3)
Affected company: Mitsubishi Electric (6503: Japan). Direction: positive for portfolio restructuring and capital efficiency, with a negative mechanical effect on consolidated revenue after deconsolidation. Magnitude: modest for recurring group operations, but potentially material for reported transaction-year earnings.
ABB announced a controlling 51% investment in Mitsubishi Electric’s low-voltage distribution business, which generated approximately $640 million of revenue. Wierod described the transaction as providing immediate leadership in Japan and targeted an Operational EBITA margin of at least 20% within 5 years of completion. The strategic mechanism is the combination of Mitsubishi Electric’s local customer relationships and manufacturing position with ABB’s product platforms, global distribution and operational improvement capabilities.
For Mitsubishi Electric, this is not simply the sale of an asset at a stated multiple. The company releases capital and transfers operating control while retaining a 49% economic interest in the Japanese joint venture. Its own transaction disclosure confirms that the business is expected to become an equity-method affiliate. Future participation therefore flows through its share of the venture’s earnings and any distributions, not through continued consolidation of 49% of the venture’s revenue.
The seller’s disclosure adds a significant accounting catalyst not quantified on ABB’s call. Mitsubishi Electric’s corrected October 21 announcement estimates an approximately ¥90 billion gain in the fiscal year ending March 2028. That is approximately 17% of its ¥526 billion pretax profit for the year ended March 2026, illustrating potential materiality without treating the gain as recurring earnings or equivalent cash proceeds. The correction matters: the original ¥900 billion figure was erroneous.
Recurring group exposure is much smaller. The business’s approximately ¥102 billion revenue represented roughly 1.7% of Mitsubishi Electric’s preceding annual consolidated revenue. Consequently, ABB’s targeted operational improvement can be significant for the venture without transforming Mitsubishi Electric’s total earnings trajectory. The initial profitability measure is EBITDA, whereas the 20% target is Operational EBITA; the apparent margin expansion should not be calculated as a directly comparable spread.
Near-term catalyst: clarification of transaction accounting, restructuring costs and capital allocation in Mitsubishi Electric’s next financial update. The transaction itself is not an immediate cash receipt. The seller’s planned closing date is October 1, 2027, subject to approvals and contractual conditions, consistent with ABB’s H2 2027 expectation. Longer-duration impact: retained participation in operational improvement extending approximately to 2032. The high-conviction positive is capital recycling with continuing economic participation, not a guaranteed near-term increase in recurring EPS.
DATA-CENTER POWER ARCHITECTURE: CENTRALIZED DC INCREASES COMPETITION FOR SYSTEM-LEVEL CONTENT (READ-THROUGH 4)
Affected companies: Vertiv (VRT: United States) and Schneider Electric (SU: France). Direction: negative for assumptions of protected market share or an exclusive architecture advantage, while underlying market demand remains positive. Magnitude: limited for near-term earnings, potentially material for long-term competitive positioning.
ABB expects gray-space infrastructure to represent as much as 75% of electrical infrastructure spending in a target DC architecture, compared with approximately 55% in legacy AC designs. Wierod explicitly stated that ABB wants to be “one of the disruptors” and capture a larger share. The Infinitus offering spans conversion, distribution, protection, power quality and cooling optimization, increasing ABB’s ability to compete for integrated electrical system designs.
The precise mechanism is greater overlap in the products and engineering capabilities offered to hyperscalers and data-center developers. As conversion moves away from individual racks toward pods or centralized power rooms, purchasing decisions increasingly involve system architecture, protection coordination, controls, commissioning and lifecycle service. ABB’s broader offering makes more of that spending contestable and increases the importance of winning designs before the architecture is standardized.
However, interpreting the call as evidence that Vertiv’s products are becoming obsolete would be incorrect. Vertiv’s July technical disclosure already described its transition from sidecars toward pod-level and centralized DC, including both medium-voltage DC UPS and solid-state transformer approaches. Schneider also participates in 800 VDC architecture development. The adverse read-through is therefore stronger competition among capable suppliers, not demonstrated technological exclusion, share loss or pricing deterioration.
The gray-space calculation also needs discipline. Moving from 55% to 75% would enlarge that spending category by approximately 36% if total electrical spending were unchanged. It does not establish a corresponding increase in total infrastructure spending, ABB revenue or competitor revenue losses. Centralization can eliminate certain conversion stages while creating value elsewhere.
Timing sharply limits the near-term bearish interpretation. ABB’s solid-state transformers become available to order in H2 2027, and its launch materials place initial complete DC-native deployments approximately in 2028-2029. Existing AC infrastructure and sidecar systems remain relevant during the transition. Vertiv’s own roadmap similarly anticipates multiple architectures coexisting.
Near-term catalyst: Vertiv’s October 28 results and subsequent disclosures on qualified designs, customer pilots and commercial deployment. Longer-duration impact: competitive pressure on architecture-related valuation premiums and the distribution of revenue per MW during 2027-2029. ABB’s announcement weakens an exclusivity thesis; it does not, by itself, support a near-term earnings short against Vertiv or Schneider.
COMMERCIAL HVAC AND COOLING: DEMAND EXTENDS BEYOND THE AI RACK AND DOES NOT REQUIRE A HOUSING RECOVERY (READ-THROUGH 5)
Affected company: Trane Technologies (TT: Ireland). Direction: positive. Magnitude: high for commercial HVAC demand visibility and moderate to meaningful for consolidated earnings, depending on execution and mix.
ABB’s Motion business identified “HVAC for commercial buildings and data center cooling” as growth contributors. Electrification also reported strong commercial-building demand, while residential construction remained weak or subdued. Management linked higher electricity requirements partly to more cooling of buildings, not exclusively to AI infrastructure.
The transmission mechanism is broader investment in building-level and campus-level thermal systems. Higher compute power density creates additional heat-rejection requirements, while commercial buildings also require more efficient cooling, controls and retrofits. Trane participates through applied HVAC equipment, chillers, controls and service. This is a shared end-market signal; ABB’s call does not establish a specific supply contract between the companies.
The less obvious implication is that commercial cooling can remain strong while residential HVAC and general property construction follow different cycles. Trane’s commercial exposure should not be analyzed as if it requires a broad housing rebound. Similarly, greater use of liquid cooling at the rack does not eliminate facility-level heat rejection. It changes the thermal architecture and product mix rather than removing the need to move heat out of the building.
Trane had already reported strong evidence before ABB’s call: Q2 Americas Commercial HVAC bookings increased 50%, applied-equipment bookings increased 130%, and group backlog reached $12.1 billion, up 70%. ABB therefore provides an independent continuation signal into Q3 rather than revealing an entirely new demand trend.
The margin qualification is material. Trane’s Q2 adjusted operating margin declined 60 basis points despite strong bookings and revenue growth. ABB’s own Motion margin also remained below its prior-year level. Neither company’s demand indicators justify assuming that manufacturing expansion, acquired operations, product mix and execution costs are automatically benign.
Near-term catalyst: Trane’s October 29 results, particularly commercial bookings, delivery schedules and margin conversion. Longer-duration impact: favorable 2027 equipment and service visibility. The highest-conviction positive is the durability and breadth of commercial cooling demand; an additional margin upgrade requires company-specific evidence.
PROCESS INDUSTRIES: ABB DOES NOT VALIDATE A BROAD CAPITAL-SPENDING RECOVERY (READ-THROUGH 6)
Affected company: Valmet (VALMT: Finland). Direction: negative for expectations of a rapid, broad-based recovery in process-industry equipment orders. Magnitude: moderate for order momentum and subsequent revenue conversion; less direct for near-term group earnings.
ABB repeatedly characterized chemicals and pulp and paper demand as muted. Its CFO stated that process-industry demand “continues to be overall muted.” Automation orders were approximately flat comparably, and management distinguished improving mining conversations from actual bookings. Nordh also clarified that Middle East weakness was separate from quarterly order timing and had persisted since Q1.
The transmission to Valmet is through customers’ decisions to authorize new plants, major mill upgrades, automation projects and related process equipment. Weak discretionary capital spending constrains large-project order intake. Even when existing backlog supports current revenue, insufficient replacement bookings can reduce later-period utilization and operating leverage.
The most useful comparison is with Valmet’s own cautious recovery language. Its Q2 disclosure described early indications of gradually improving biomaterial capital-project activity, while organic group orders declined 9% and biomaterial services remained soft. ABB’s Q3 commentary does not disprove that company-specific sequential improvement, but it does not support extrapolating it into an industry-wide acceleration.
This distinction prevents an excessively bearish conclusion. Valmet reported organic revenue growth and improved comparable EBITA in Q2, supported by cost savings, and reiterated guidance. Its acquired Severn business and broader process-performance exposure also change the earnings mix. ABB’s call is therefore a negative signal for the pace and breadth of a demand recovery, not sufficient evidence for a Valmet earnings miss or a guidance reduction.
Near-term catalyst: Valmet’s October 28 results. The relevant questions are whether capital-project bookings improved beyond a low comparison, whether service demand stabilized and whether cost reductions continued to protect profitability. Longer-duration impact: potential pressure on 2027 equipment revenue if order recovery remains narrow.
The cross-portfolio implication is important: strong electrical and utility spending should not be used as a proxy for a synchronized industrial upcycle. The same customer economy can support exceptionally strong power-infrastructure investment while continuing to defer conventional process-industry projects.
CLOUD OPERATORS: SUPPLIER BACKLOG QUALITY IS NOT EQUIVALENT TO CUSTOMER CASH-FLOW QUALITY (READ-THROUGH 7)
Affected companies: Amazon.com (AMZN: United States) and Microsoft (MSFT: United States). Direction: negative for near-term cash-conversion flexibility and project-payback timing, not a negative signal for underlying cloud demand. Magnitude: high exposure at the infrastructure-investment level, but insufficient evidence to quantify an incremental group earnings revision.
ABB’s order-quality protections have an opposite implication for the buyer. Significant advances and cancellation provisions make supplier backlog more secure, but also commit customer capital before the associated facility generates revenue. Data-center delivery schedules of 12-24 months and bottlenecks in transformers, turbines and construction can extend the interval between commitment, cash payment and productive capacity.
Wierod also argued that hyperscalers would increasingly contribute capital to electricity generation and grid expansion. This broadens the investment perimeter beyond servers and buildings. If operators must finance power availability as well as computing infrastructure, the relevant return calculation includes more enabling capital and potentially longer development schedules.
The company mapping is based on Amazon’s and Microsoft’s disclosed hyperscale investment exposure, not an allocation of ABB orders to named customers. ABB did not disclose customer-specific bookings or contract terms, so no precise advance-payment liability or incremental capital budget can be attributed to either company from this call.
The cash-flow asymmetry is already visible in Amazon’s own results. Q2 trailing-12-month operating cash flow increased 33% to $161.4 billion, while free cash flow moved to a $7.6 billion outflow, primarily because of increased property and equipment investment. At the same time, AWS revenue increased 37%. Microsoft reported 43% Azure and other cloud-services revenue growth in its June quarter. These results show why strong demand and weak near-term cash conversion can coexist.
ABB’s response to questions about AI investment returns relied on customer confidence rather than independently disclosed utilization or return-on-capital data. Its equipment backlog therefore supports the existence of committed construction activity, not the profitability of every additional dollar of hyperscaler spending. Likewise, the illustrative claim that released power could support approximately $100 million of annual operator revenue is not a forecast for Amazon or Microsoft.
Near-term catalysts: Microsoft’s October 28 results and Amazon’s October 29 results. The critical evidence is capacity entering service, capital expenditure and finance-lease commitments, utilization, cloud margins and cash conversion. Longer-duration impact: potentially higher infrastructure ownership costs and longer payback periods if power-enabling investment expands faster than monetization.
The portfolio implication is an asymmetry rather than a blanket bearish cloud thesis. Contractually protected electrical suppliers can collect cash and build backlog while their customers bear construction delays, utilization risk and the eventual burden of earning an adequate return on the complete infrastructure investment.
Report record
- Sector
- Industrials
- Industry
- Electrical Equipment
- Fiscal period end
- September 30, 2026
- Report date
- October 20, 2026
- Analysis
- 6898 words
- Read-throughs
- 2888 words
- Content fingerprint (PDF)
9cbcc3790051- Content fingerprint (analysis)
69bbfd8da5b9- Content fingerprint (read-throughs)
ac29d0bb72d6
Prepared from the company's earnings release and earnings call transcript. Figures as reported by the company. For information only. Not investment advice.
More from ABB
No other reports yet.
More in Industrials
Earnings Expansion Durable, but the Beat Was Not Unequivocal
Improved visibility into 2027 rather than a substantial upgrade to 2026 earnings
Follow @AtlasPeakRes on X for new earnings reports as they publish.