A Larger and More Profitable Equipment Franchise, Not Yet a Cash-Generative Platform
Earnings Reports
Carpenter Technology Corporation FQ1 2027 Earnings Report
Carpenter Technology Corporation (CRS) FQ1 2027 earnings: Earnings Expansion Durable, but the Beat Was Not Unequivocal. Full earnings analysis, key read-throughs, and the one-page exhibit from Atlas Peak Research.
Carpenter Technology Corporation (CRS)
Sector: Industrials · FQ1 2027 · Period end September 30, 2026 · Reported October 22, 2026
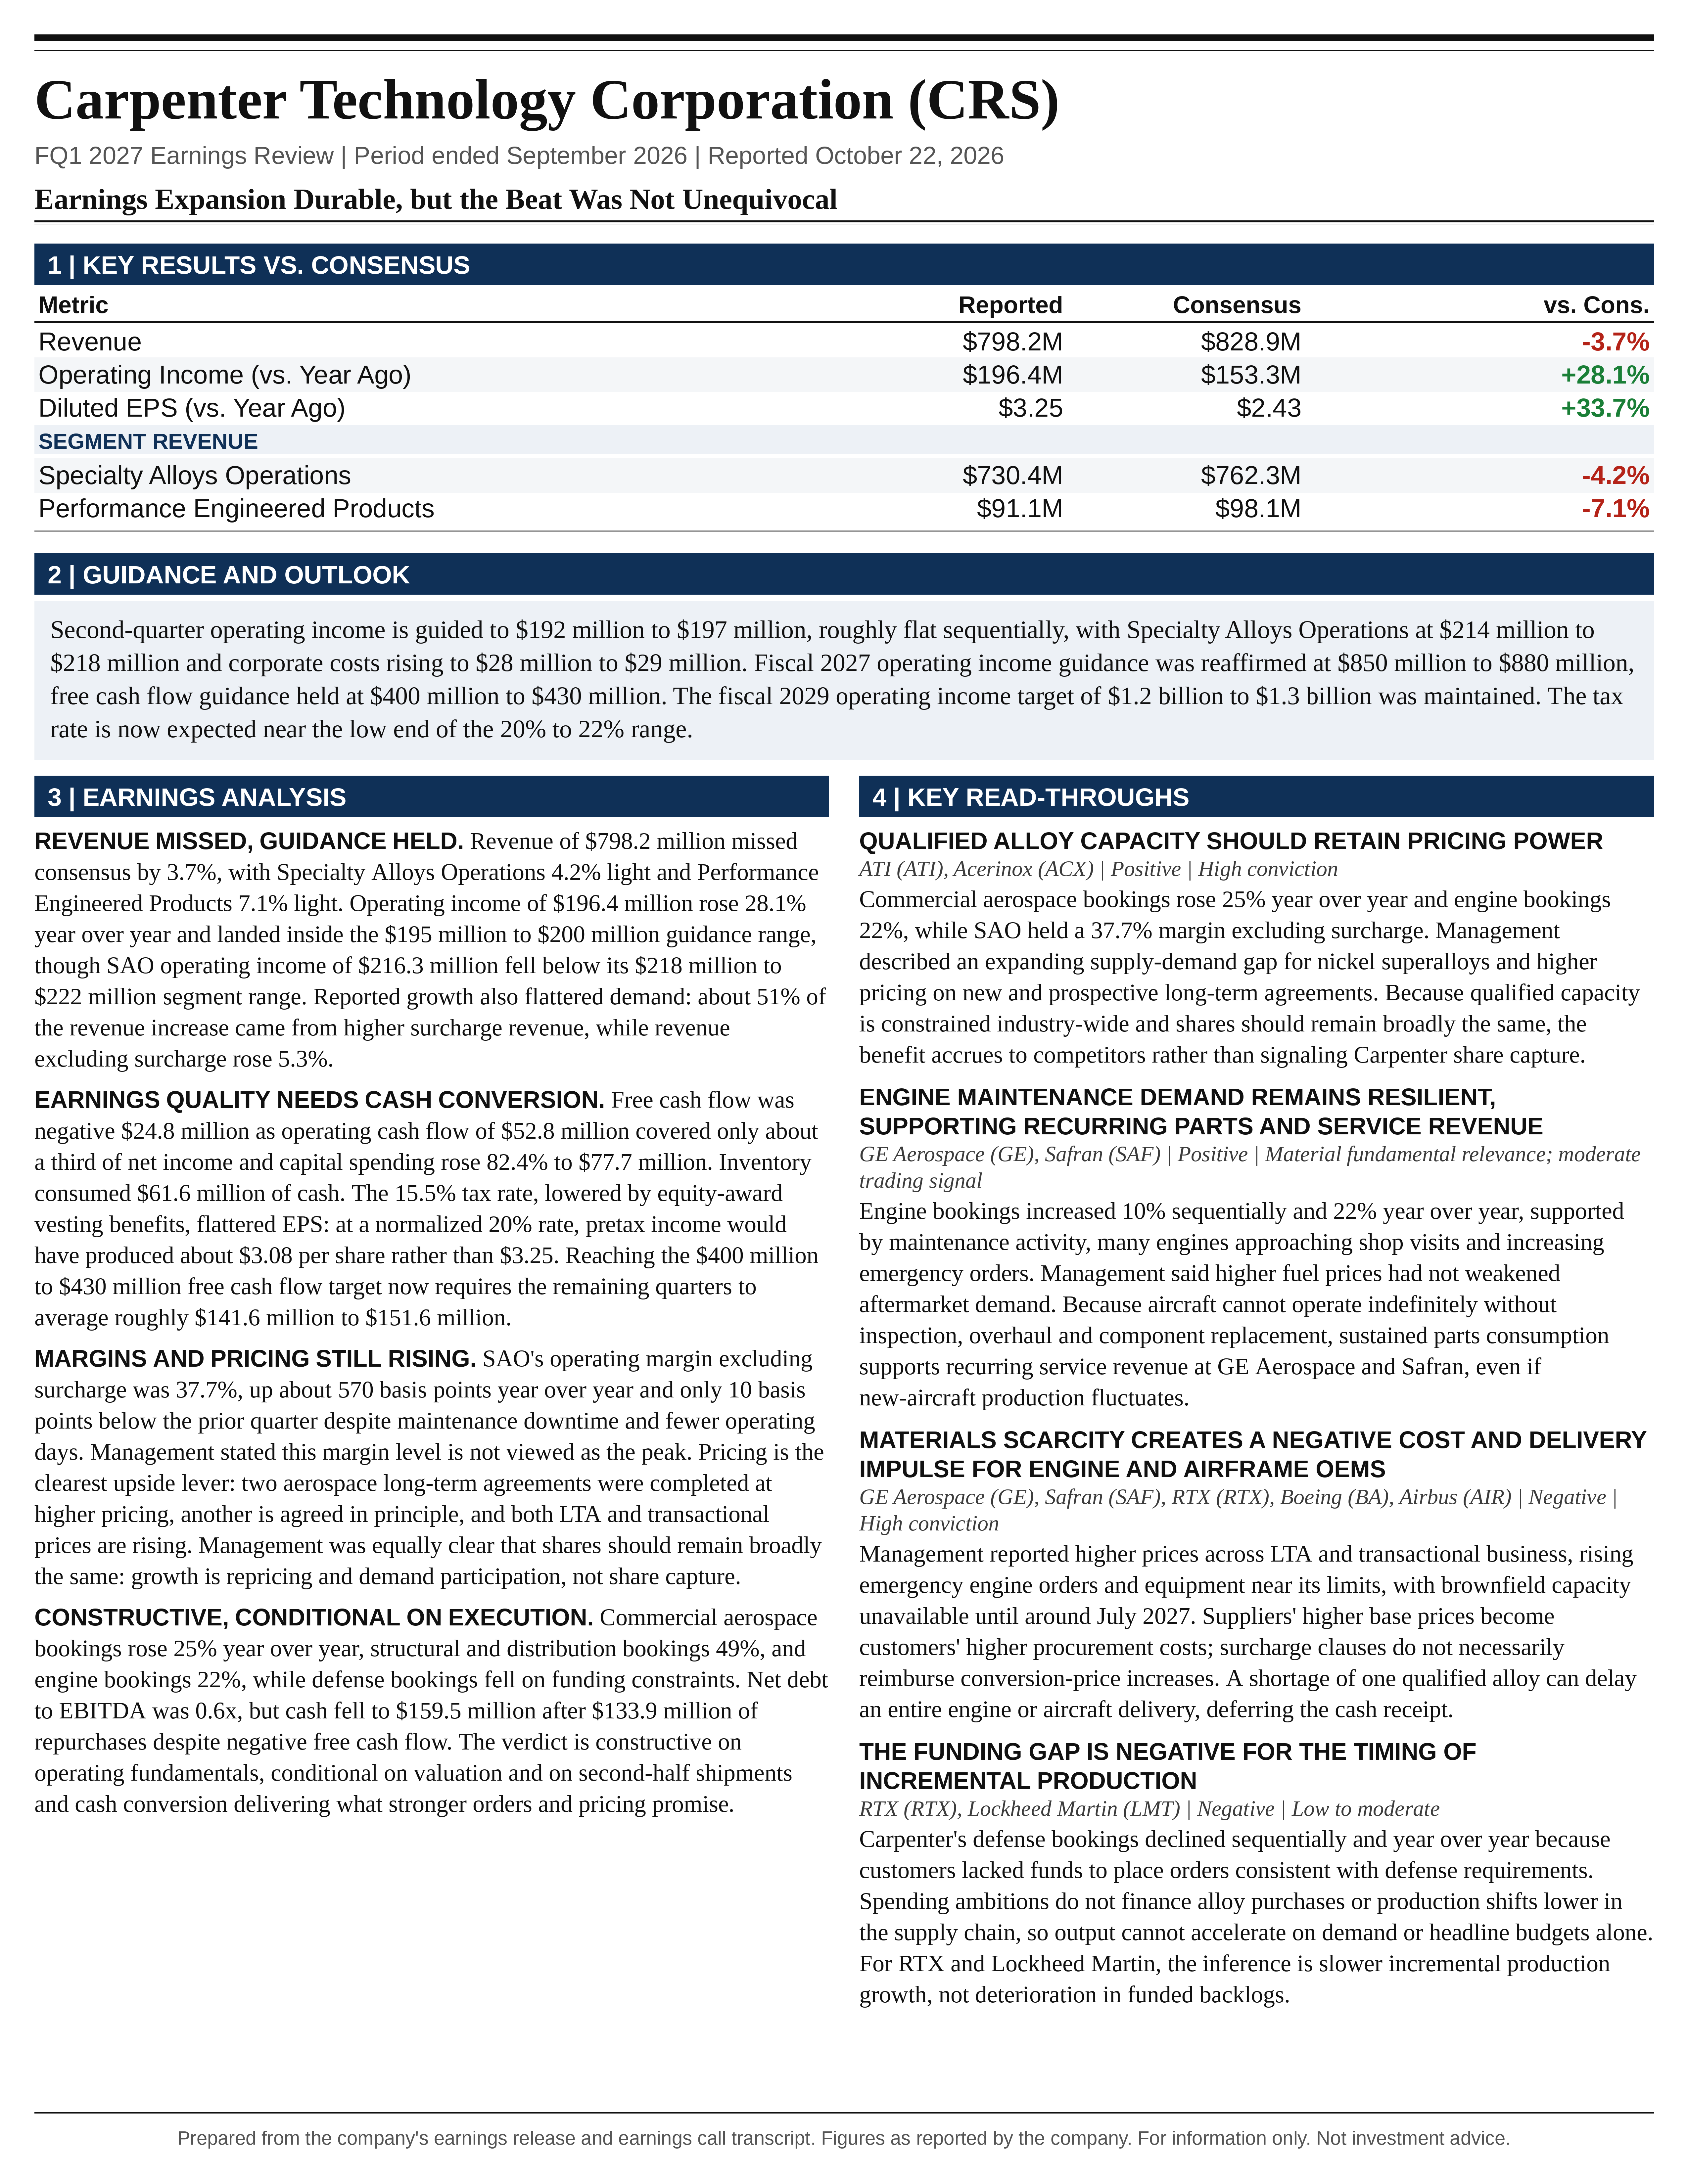
Carpenter Technology’s fiscal Q1 2027 results support the durability of its specialty-alloy earnings expansion, but the quarter was not an unequivocal execution beat. Operating income of $196.4 million increased 28.1% year-over-year and remained within the previously issued $195 million-$200 million guidance range.
Download the one-page report (PDF)
View one-page exhibit
Download analysis (.md)
Download read-throughs (.md)
Post to X
One-Page Exhibit
Earnings Analysis
EXECUTIVE CALL SUMMARY: Carpenter Technology (10/22/26)
Carpenter Technology’s fiscal Q1 2027 results support the durability of its specialty-alloy earnings expansion, but the quarter was not an unequivocal execution beat. Operating income of $196.4 million increased 28.1% year-over-year and remained within the previously issued $195 million-$200 million guidance range. However, reported revenue missed Bloomberg consensus by 3.7%, Specialty Alloys Operations operating income fell below its segment guidance, and free cash flow was negative $24.8 million. The principal positive was the preservation of exceptional SAO profitability despite maintenance-related production constraints. The principal unresolved issue is whether accelerating orders and stronger pricing can translate into the higher shipments and cash conversion required over the remainder of fiscal 2027.
Management became more confident without increasing its formal earnings targets. Fiscal 2027 operating income guidance remained $850 million-$880 million, fiscal 2027 free cash flow remained $400 million-$430 million, and the fiscal 2029 operating income target remained $1.2 billion-$1.3 billion. Tony Thene’s most consequential statement was: “My outlook on demand is stronger than it was a quarter ago. My outlook on pricing is stronger than it was a quarter ago, and my confidence in 2027, 2029 is stronger than it was a quarter ago.” This represents an improvement in management’s assessment of upside potential, not a numerical guidance increase.
The strongest evidence supporting that confidence was commercial aerospace bookings growth of 25% year-over-year, including structural and distribution bookings growth of 23% sequentially and 49% year-over-year, and engine bookings growth of 10% sequentially and 22% year-over-year. These indicators suggest that ordering is broadening beyond the strongest portions of the aerospace recovery. However, bookings were not disclosed in absolute dollars or physical quantities, and management discontinued shipment-volume disclosure. Consequently, order growth cannot be separated cleanly into price, quantity, contract timing, and inventory replenishment.
The appropriate investment conclusion is constructive on operating fundamentals but conditional on valuation and execution. The quarter does not establish that margins have peaked, that aerospace demand is weakening, or that annual guidance is at risk. Equally, it does not establish that management’s increasingly optimistic language warrants an immediate earnings upgrade. The most important forthcoming evidence will be Q2 cash conversion, the anticipated increase in production during fiscal H2, conversion of defense demand into funded orders, and commissioning of the brownfield expansion around the beginning of fiscal 2028.
REPORTED PERFORMANCE, CONSENSUS AND PRIOR GUIDANCE
Reported revenue was $798.2 million, compared with $733.7 million in fiscal Q1 2026 and $851.0 million in fiscal Q4 2026. Revenue increased 8.8% year-over-year but declined 6.2% sequentially. Against the supplied Bloomberg consensus estimate of $828.9 million, the shortfall was $30.7 million, or 3.7%. SAO reported revenue of $730.4 million versus consensus of $762.3 million, a 4.2% shortfall. Performance Engineered Products revenue of $91.1 million was 7.1% below the $98.1 million estimate. The revenue disappointment therefore extended across both operating segments.
Revenue excluding raw-material surcharge provides the more relevant operating comparison. This measure was $634.8 million, up 5.3% from $603.1 million a year earlier and down 6.6% from $679.7 million sequentially. Surcharge revenue increased from $130.6 million to $163.4 million, contributing $32.8 million of the $64.5 million increase in reported revenue. Approximately 51% of reported revenue growth therefore came from higher surcharge revenue rather than growth in the underlying sales measure emphasized by management. Reported revenue growth should not be interpreted as an equivalent increase in physical demand or underlying pricing power.
Operating income increased from $153.3 million to $196.4 million year-over-year, but declined from $206.9 million sequentially. This was a record Q1, not an all-time quarterly record. Gross profit increased 18.4% year-over-year to $256.3 million, while SG&A declined $3.2 million to $59.9 million. Gross-profit improvement supplied $39.9 million of the $43.1 million increase in operating income; lower SG&A supplied the remaining $3.2 million. The improvement was therefore predominantly operational, although reduced variable-compensation accruals also helped.
The distinction between a consensus miss and a guidance miss is important. The July 30 earnings release established Q1 operating income guidance of $195 million-$200 million. Actual operating income was $1.4 million above the bottom of that range and $1.1 million, or 0.6%, below its midpoint. Thene’s statement, “We effectively came in at our guidance,” is consistent with the consolidated result. The analyst’s reference to a miss should not be generalized into a failure to achieve the company’s formal consolidated range.
Segment execution was less favorable. The prior call guided SAO operating income to $218 million-$222 million, compared with the actual $216.3 million. SAO missed the bottom of its range by $1.7 million and its midpoint by $3.7 million. PEP operating income of $7.3 million exceeded its $6 million-$7 million guidance, while corporate costs of $26.1 million were below the approximately $29 million initially anticipated. Those favorable offsets helped preserve consolidated guidance attainment. Planned maintenance had already been incorporated into the original outlook, so maintenance explains the expected sequential slowdown but is not, by itself, a complete explanation for the SAO shortfall.
The financial statements also resolve minor inconsistencies in the spoken presentation. SAO’s prior-quarter margin was 37.8%, making the current 37.7% margin a 10-basis-point decline rather than an exact match of the record. SG&A declined $2.1 million sequentially from $62.0 million, equivalent to 3.4%, rather than the 2.1% stated in the transcript. These differences are economically small but reinforce the importance of using the detailed financial schedules for precise comparisons.
MARGIN QUALITY AND THE SOURCES OF EARNINGS GROWTH
Consolidated operating margin excluding surcharge increased to 30.9%, compared with 25.4% a year earlier and 30.4% sequentially. On reported revenue, operating margin was 24.6%, versus 20.9% a year earlier. SAO’s 37.7% margin is likewise calculated on revenue excluding surcharge; its operating margin on reported segment revenue was 29.6%. The surcharge-excluded measure is useful for evaluating conversion economics, but it should not be compared indiscriminately with peers’ margins calculated on total revenue.
SAO generated $573.5 million of revenue excluding surcharge, up 7.4% year-over-year, and $216.3 million of operating income, up 26.7%. Its margin expanded approximately 570 basis points from 32.0% a year earlier. Maintaining nearly the prior-quarter margin during a period of fewer operating days and elevated maintenance is a meaningful indication that pricing, productivity and product scheduling are offsetting substantial operating friction. It is not evidence of uninterrupted improvement, but it is evidence against a sharp deterioration in underlying economics.
The increase in consolidated operating income exceeded the increase in revenue excluding surcharge. Operating income increased $43.1 million against a $31.7 million revenue increase, producing an apparent incremental margin of approximately 136%. That figure should not be extrapolated as a sustainable contribution margin on new sales. It reflects improvement in profitability across the existing revenue base, including pricing, mix, productivity and reduced overhead. The critical investment distinction is between repricing and improving an installed production base, which can generate unusually high incremental earnings, and adding physical volume, which normally carries additional production costs.
Management explicitly rejected the view that current SAO margins represent a ceiling: “To be clear, we do not view this margin level as the peak, as we expect strengthening demand, productivity, and pricing actions to drive us to higher levels.” The mechanism is plausible. Additional throughput can improve fixed-cost absorption, better scheduling can increase output from constrained equipment, and higher base prices can expand contribution without requiring proportionate incremental capital. However, the call provided no quantified bridge separating these drivers.
The operating leverage is substantial even under modest sensitivities. At current quarterly SAO revenue excluding surcharge, a 100-basis-point margin improvement would add approximately $5.7 million of quarterly operating income. A 1% increase in realized base pricing across the same revenue base would also add approximately $5.7 million of revenue, with potentially substantial earnings conversion if costs and mix were unchanged. These are mechanical sensitivities, not forecasts. Only improvements beyond those already embedded in guidance represent incremental upside.
The principal limitation is physical capacity. Management described equipment operating close to available limits and productivity gains being achieved by addressing successive bottlenecks. Thene’s observation that “volume isn't generic and it's not 100% fungible” is particularly important. Different alloys and product forms require different combinations of melting, remelting, forging, rolling and finishing capacity. Strong aggregate demand cannot eliminate underutilization or scheduling problems in a particular production route. The weakness in defense orders therefore can hurt efficiency even while aerospace-engine demand remains strong.
Management cited AI-assisted productivity initiatives as an additional opportunity, but disclosed no independently measurable contribution, deployment scope, yield improvement or financial return. No separate AI-related valuation premium is justified by this call. The economically relevant evidence remains actual throughput, quality, margins and cash generation.
COMMERCIAL AEROSPACE: STRONGER ORDERS, WITH IMPORTANT QUALIFICATIONS
Aerospace and defense revenue excluding surcharge was $425.4 million, up 9.6% year-over-year and down 5.3% sequentially. It represented 67.0% of consolidated revenue excluding surcharge, compared with 64.4% a year earlier. Its $37.1 million revenue increase exceeded the company’s total $31.7 million increase, meaning the remaining end markets collectively declined approximately 2.5%. The earnings growth story is becoming more concentrated in aerospace and defense rather than uniformly stronger across the portfolio.
Commercial aerospace bookings increased 25% year-over-year. Structural and distribution bookings increased 23% sequentially and 49% year-over-year, while engine bookings increased 10% sequentially and 22% year-over-year. Structural and distribution sales were approximately flat sequentially, creating a potentially favorable divergence between orders and current shipments. Customers reportedly are experiencing bookings above billings and declining inventories, which is consistent with future replenishment requirements.
The interpretation nevertheless requires care. Bookings growth can reflect higher prices, larger contractual commitments, changes in order timing, genuine consumption growth or precautionary purchasing. Falling customer inventory alongside rising orders is more constructive than rising orders accompanied by accumulating inventory, but management provided no inventory days, absolute inventory levels or customer-level distribution. The available evidence supports strengthening demand, not a precise restocking forecast.
Management’s assertion that some customers are ordering below levels needed to support current aircraft production is potentially significant. If accurate and sustained, inventory depletion should eventually force increased procurement even before OEM production rises. However, the timing depends on customer inventory buffers, financing capacity, product-specific requirements and competing supply sources. An eventual need for more material does not establish when that need will become Carpenter revenue.
Engine demand appears supported by both new production and maintenance. Management cited increasing OEM ordering, elevated MRO activity, engines approaching initial shop visits and emergency orders. These drivers can provide complementary demand: slower new-aircraft deliveries can prolong operation of existing fleets, supporting maintenance consumption. However, the call did not disclose the division of engine revenue between original equipment and aftermarket applications. These markets should therefore not be modeled as fully independent growth streams without further information.
Aerospace fastener bookings declined sequentially, although sales were the 2nd highest on record. Management attributed the bookings decline to normal quarterly variability and stated that customers still were not ordering at rates consistent with current aircraft production. This is not sufficient evidence of a broader slowdown, but it prevents characterizing the commercial aerospace order picture as uniformly accelerating in every submarket.
The industry production discussion was directionally supportive but not a direct Carpenter forecast. Management cited approximately 1,400-1,500 aircraft builds in calendar 2026 and target production above 2,100. Reaching 2,100 would represent approximately 40%-50% growth from that starting range. The approximately 50% characterization is therefore an illustrative industry opportunity, not a company volume commitment. A backlog above 16,000 aircraft establishes demand visibility but does not eliminate cancellation, financing, certification or supply-chain risk.
Boeing’s October 20 announcement independently supports management’s statement that the 737-10 received FAA certification. Boeing specified that the variant represents more than 30% of the 737 MAX order book, a narrower denominator than Boeing’s entire backlog. Certification removes an important program risk, but its benefit to Carpenter depends on incremental production rather than substitution among MAX variants and on material already procured before certification.
Management’s statement that air traffic increased 14% quarter-over-quarter should receive limited weight without a specified geography, traffic measure or seasonal adjustment. Sequential aviation traffic is seasonal. Customer order acceleration, funded production schedules and demonstrated inventory depletion are more informative for Carpenter’s near-term earnings than that isolated traffic statistic.
PRICING, LONG-TERM AGREEMENTS AND COMPETITIVE POSITION
Pricing remained the clearest potential source of upside beyond the existing volume outlook. Management reported completion of 2 significant aerospace long-term agreements during Q1, an additional agreement in principle, and negotiations on other major contracts, all at higher pricing. Both LTA and transactional prices were described as increasing. This supports the view that favorable pricing is extending beyond isolated emergency orders into the contracted portfolio.
However, the call did not disclose contractual price increases, effective dates, duration, escalation provisions, minimum purchase obligations or customer cancellation protections. Higher prices on newly signed agreements may phase into revenue over time. A favorable renewal is therefore evidence of future pricing opportunity, not necessarily an immediate step-up in quarterly realization.
The market-share discussion clarified the nature of the growth thesis. After initially describing higher customer commitments, Thene stated: “The shares are probably going to remain pretty well the same. There's not a share gain battle going on.” Higher committed volume should therefore be modeled primarily as participation in expanding demand, not as incremental share capture. Adding a separate share-gain assumption would risk overstating growth.
The proportion of aerospace business covered by LTAs is expected to remain broadly stable. Renewals largely involve existing customers, while the majority of aerospace business already operates under LTAs. Consequently, the investment case is not a transition from predominantly transactional revenue to newly contracted revenue. It is the repricing and expansion of an already contracted business.
Qualification requirements, demanding material specifications and constrained production capacity provide meaningful barriers to entry. Nevertheless, criticality does not imply sole-source status or unlimited pricing power. Customers can qualify alternatives, redesign sourcing arrangements or support competitor investment over longer periods. The relevant question is how long supply scarcity can persist relative to the duration of current contract repricing and Carpenter’s own capacity expansion.
DEFENSE AND NON-AEROSPACE MARKETS
Defense was the clearest divergence between management’s description of end demand and realized customer activity. Both sales and bookings declined sequentially, while bookings also declined year-over-year. Management attributed the weakness to funding constraints that prevent downstream suppliers from placing orders consistent with anticipated requirements.
Thene described the expected response to funding clarity forcefully: “Once that clears up, I think saying that there will be a rush on orders will be an understatement.” This represents potentially material upside, but it remains conditional on appropriations, funding release, customer ordering and production scheduling. Elections do not automatically resolve these steps. The reference to greater clarity after the midterm elections should not be treated as a firm conversion date.
Defense recovery could have a disproportionate earnings effect if it restores demand to production routes that commercial aerospace cannot fully utilize. It could also disrupt schedules, increase working-capital needs or require expedited production. The net benefit depends on the profitability and manufacturability of the specific material mix, not simply the gross value of orders received.
Boeing’s September 29 announcement independently confirms its selection for the Navy’s F/A-XX program. Carpenter’s involvement in critical applications supports long-term program relevance, but the call disclosed neither contracted revenue nor quantified content. Early design engagement is strategically valuable; it is not evidence of a material fiscal 2027 contribution.
The reported non-aerospace results were weaker than management’s generally positive forward commentary. Medical revenue excluding surcharge was $51.7 million, down 16.1% year-over-year and 4.4% sequentially. Energy revenue was $32.9 million, down 22.6% year-over-year and 16.1% sequentially. These results do not invalidate management’s expectations for improvement, but they establish that recovery was not yet visible in aggregate reported sales.
The medical result also qualifies the prior-quarter optimism. Fiscal Q4 2026 medical sales had increased sequentially, and management emphasized improving demand. Q1 reversed that sequential improvement. The explanation that weakness is concentrated in a specific subset may be correct, but no sufficient submarket data were disclosed to quantify the expected recovery. Similarly, strong industrial gas turbine demand can coexist with weak total energy revenue because of shipment timing, product scheduling and oil-and-gas exposure.
PEP operating income declined 22.3% year-over-year to $7.3 million, despite slightly exceeding guidance. Its surcharge-excluded margin improved sequentially from approximately 7.2% to 8.8%, but remained below 10.8% a year earlier. The segment is stabilizing rather than demonstrating a decisive recovery. SAO represented approximately 96.7% of combined segment operating income before corporate costs and eliminations, emphasizing that the investment outcome remains overwhelmingly dependent on SAO.
GUIDANCE: WHAT CHANGED AND WHAT THE NUMBERS REQUIRE
Fiscal 2027 operating income guidance of $850 million-$880 million was unchanged from July 30 and implies growth of 21.1%-25.4% from fiscal 2026 operating income of $702.0 million. Fiscal 2029 guidance of $1.2 billion-$1.3 billion was also unchanged. The incremental development was management’s conviction that volume, pricing and productivity could outperform the assumptions supporting those ranges.
Q2 operating income guidance was $192 million-$197 million, with a midpoint of $194.5 million. This is approximately flat sequentially and represents growth of approximately 24%-27% from the prior-year $155.2 million. SAO guidance of $214 million-$218 million is also essentially flat to Q1, while PEP is expected to generate approximately $7 million. Corporate costs are expected to increase to $28 million-$29 million. The outlook is therefore not for immediate sequential earnings acceleration despite stronger bookings; holidays and available production time remain limiting factors.
Combining actual Q1 with the Q2 range implies fiscal H1 operating income of $388.4 million-$393.4 million. Achieving the annual range would require fiscal H2 operating income of approximately $456.6 million-$491.6 million, or $228.3 million-$245.8 million per quarter. At the annual and Q2 midpoints, H2 must generate $474.1 million, approximately 21.3% above H1.
That requirement is meaningful but not unusually aggressive relative to recent seasonality. Fiscal H2 2026 generated approximately $393.4 million, about 27.5% above H1. The current midpoint requires approximately 20.5% H2 year-over-year growth, below the approximately 27% growth implied for H1. The forecast depends on a substantial sequential improvement, but not on a more pronounced seasonal increase than occurred in fiscal 2026.
The timing of capacity matters. The brownfield project is expected to become available around the beginning of fiscal 2028, approximately July 2027. Fiscal 2027 guidance must therefore be delivered principally from existing assets through better throughput, pricing, scheduling and mix. The new project cannot be used to explain away a fiscal 2027 production shortfall.
The fiscal 2029 target implies a 3-year operating income CAGR of approximately 19.6%-22.8% from fiscal 2026. The lower bound is slightly below 20%, while the midpoint implies approximately 21.2%. Management’s “20%+” description is a reasonable rounded characterization of the range, but not a precise description of its lower endpoint.
EARNINGS PER SHARE AND TAX NORMALIZATION
Diluted EPS increased 33.7% year-over-year to $3.25, versus $2.43, and increased slightly from $3.23 sequentially. Net income increased 32.7% year-over-year to $162.5 million. EPS growth exceeded operating income growth partly because net interest expense declined from $11.5 million to $7.1 million and diluted weighted-average shares declined from 50.4 million to 50.0 million.
The 15.5% effective tax rate also materially supported the absolute earnings level. Management attributed it to benefits associated with equity-award vesting. The prior-year Q1 tax rate was similarly low, so the tax benefit is not the primary explanation for year-over-year growth. It is, however, critical to interpreting sequential EPS and annualizing the quarter.
At a normalized 20% tax rate, the reported $192.4 million of pretax income would produce approximately $3.08 per diluted share rather than $3.25. At 22%, EPS would be approximately $3.00. These are analytical normalizations, not company-reported adjusted EPS. The quarter should not be annualized mechanically at $13.00 without accounting for seasonal operating income and tax-rate differences.
The only explicit favorable change to a numerical annual assumption was management’s expectation that the fiscal 2027 tax rate would be near the low end of the previously issued 20%-22% range. At approximately $850 million of annual pretax earnings, a 1-percentage-point reduction in the tax rate would add roughly $0.17 per share, assuming 50 million diluted shares. EPS estimates can therefore increase modestly even if operating income estimates remain unchanged.
Sequential EPS stability also masks weaker pretax performance. Pretax income declined from $204.7 million in Q4 to $192.4 million in Q1, while the effective tax rate fell from approximately 20.7% to 15.5%. The nearly unchanged net income result is consequently less representative of operating momentum than the decline in operating income.
CASH FLOW, WORKING CAPITAL AND THE RECOVERY REQUIREMENT
Operating cash flow was $52.8 million, compared with $39.2 million a year earlier. Capital expenditures increased 82.4% to $77.7 million. Including $0.1 million of asset-disposal proceeds, company-defined free cash flow was negative $24.8 million, versus negative $3.4 million a year earlier. The asset proceeds explain the small difference between reported free cash flow and a simple subtraction of capital expenditures from operating cash flow.
Operating cash flow represented approximately 32.5% of net income, close to 32.0% in the prior-year Q1. This historical comparison argues against treating weak Q1 conversion alone as evidence of deteriorating earnings quality. Nevertheless, the amount of cash tied up in the business increased substantially, and the annual cash target still requires a pronounced recovery.
Inventory consumed $61.6 million of cash, compared with a $15.6 million cash release a year earlier. Accounts receivable consumed $18.7 million, other current assets consumed $13.3 million, and accrued liabilities consumed $88.5 million, partially offset by a $24.1 million accounts-payable inflow. These categories together absorbed $158.0 million, versus $125.8 million a year earlier. Inventory was the major adverse year-over-year swing, but the total cash profile cannot be reduced to inventory alone.
Inventory increased to $884.4 million from $822.9 million at June 30. Management expects that inventory to convert into shipments as available operating days increase. The key unresolved detail is its composition. An inventory build in qualified, saleable material awaiting shipment has different implications from a build in raw materials, unfinished work or products mismatched to near-term orders. The supplied disclosure does not permit that distinction.
To reach $400 million-$430 million of annual free cash flow after negative $24.8 million in Q1, the remaining quarters must generate $424.8 million-$454.8 million, averaging approximately $141.6 million-$151.6 million per quarter. That average approaches fiscal Q4 2026 free cash flow of $155.0 million. However, the remaining-period requirement is only approximately 16.2%-24.4% above the comparable fiscal 2026 total, broadly consistent with the company’s targeted earnings growth. The cash target is demanding but not disconnected from historical performance.
The July presentation established fiscal 2027 capital expenditure assumptions of $355 million-$375 million. The current call did not announce a replacement range. Using those original assumptions, the free cash flow target implies approximately $755 million-$805 million of annual operating cash flow, before small disposal proceeds. After Q1, approximately $702 million-$752 million of operating cash flow would remain to be generated, alongside approximately $277 million-$297 million of capital spending.
Tim Lain acknowledged the dependence on recovery directly: “the cash has to accelerate here, in Q2 and then even more in the second half.” This is a central underwriting requirement, not a secondary reporting issue. Improving earnings without corresponding working-capital conversion would reduce the capacity to fund expansion and repurchases simultaneously.
A further liquidity consideration sits outside company-defined free cash flow. The company paid $65.2 million of withholding taxes associated with share-based awards, classified as a financing cash outflow. Deducting that payment from reported free cash flow produces negative $90.0 million before dividends and discretionary repurchases. This is not an alternative company-reported free cash flow measure or an additional corporate income-tax expense. It is relevant because it consumed cash and reduced the amount available for other capital-allocation uses.
BROWNFIELD EXPANSION, BALANCE SHEET AND REPURCHASES
The brownfield expansion remains on budget and on schedule, with major equipment installation underway. That is a positive execution update, but neither the completion timetable nor the earnings targets were accelerated. The July call indicated that the project should contribute incremental operating income in fiscal 2028 and reach approximately $150 million of incremental annual operating income by fiscal 2030, with a nonlinear ramp.
The fiscal 2029 target already incorporates brownfield contribution. Adding the full $150 million to the $1.2 billion-$1.3 billion target would double count the project and pull forward a contribution originally associated with fiscal 2030. Construction completion, operational startup, qualification, yield stabilization and full commercial utilization are distinct milestones.
Management expects existing agreements to absorb the additional output. Thene stated: “It will be absorbed by our current LTAs.” This reduces concern about finding entirely new customers, but does not establish that all incremental capacity is supported by unconditional, immediately executable purchase commitments. Contracted relationships and forecast demand are not equivalent to guaranteed production utilization.
The balance sheet remains a material strength. Reported net debt to EBITDA was 0.6x, available revolver capacity was $499.1 million, and no debt maturities were identified before 2034. However, liquidity declined from $892.4 million at June 30 to $658.6 million, while cash fell from $393.3 million to $159.5 million. Low leverage limits financing risk, but the quarter meaningfully reduced cash reserves.
The company repurchased $133.9 million of stock and paid $9.9 million in dividends despite negative free cash flow. Including award-related withholding payments explains substantially all of the $233.8 million reduction in cash. Repurchases acquired 241,924 shares at an implied average price of approximately $553.48, equivalent to approximately 0.48% of the quarter’s diluted weighted-average share count. That average is a historical transaction reference, not a current market quotation.
Repurchase authorization remaining at quarter-end was $985.0 million. Authorization is not a commitment or proof of undervaluation. Annualizing Q1 repurchases would imply approximately $535.6 million of annual spending, exceeding the $400 million-$430 million free cash flow target before dividends and award-related cash payments. Sustaining that pace would require cash reserves, additional borrowing, stronger cash generation or a later reduction in repurchases.
Management’s willingness to remain active in repurchases signals confidence, but its economic merit depends on purchase price relative to normalized future cash flow. Funding the brownfield project should remain the priority where its prospective risk-adjusted return exceeds that of retiring shares.
INVESTMENT SCENARIOS AND VALUATION IMPLICATIONS
An illustrative base case with a 55% probability assumes fiscal 2027 operating income of $850 million-$880 million and fiscal 2029 operating income of $1.2 billion-$1.3 billion. This requires continued favorable contract repricing, seasonal throughput improvement, manageable maintenance, partial recovery in weaker markets and an orderly brownfield ramp. Confidence is moderate because the reported margin base is strong, while the volume and cash-flow bridges remain incompletely disclosed.
An illustrative bull case with a 25% probability assumes fiscal 2027 operating income of $900 million-$950 million and fiscal 2029 operating income of $1.4 billion-$1.5 billion. This requires improvements beyond the existing plan: faster defense funding conversion, stronger replenishment orders, better productivity and greater pricing realization. Management identified these mechanisms, but did not quantify their incremental contribution. Confidence in this upside case is lower than in the base case.
An illustrative bear case with a 20% probability assumes fiscal 2027 operating income of $760 million-$810 million and fiscal 2029 operating income of $900 million-$1.1 billion. This need not require an aerospace recession. Continued defense delays, softer non-aerospace markets, production bottlenecks, weaker incremental pricing or slower brownfield qualification could prevent the expected earnings progression. An outright aviation downturn would create downside beyond this moderate bear case.
These probabilities are analytical scenario weights rather than statistically estimated outcomes. They describe operating performance, not prospective stock returns. Equity returns also depend on the entry valuation and the multiple applied to future earnings.
A simple earnings sensitivity illustrates the distinction. Assuming 50 million diluted shares, a 20% tax rate and $16 million of annual net nonoperating expense, approximately equal to annualizing Q1’s net burden, the fiscal 2027 operating income range translates into approximately $13.34-$13.82 of EPS. The fiscal 2029 target translates into approximately $18.94-$20.54. These are illustrative calculations, not company EPS guidance, and exclude subsequent changes in share count, financing and other nonoperating items.
At the historical Q1 repurchase price of approximately $553.48, those sensitivities imply approximately 40.0x-41.5x fiscal 2027 earnings and 26.9x-29.2x fiscal 2029 earnings. The fiscal 2027 free cash flow target would correspond to approximately a 1.4%-1.6% equity free cash flow yield using the same price and 50 million shares. These figures do not establish the valuation at the time of this report, but demonstrate how much future execution was embedded in the prices paid during the quarter.
The broader implication is that strong business performance can coexist with disappointing equity returns if valuation compresses. Conversely, a sufficiently lower entry price can create attractive returns without requiring management to exceed its existing targets. The call strengthens the operating thesis more clearly than it establishes the stock’s risk-adjusted attractiveness at an unspecified market price.
CATALYSTS, REVIEW TRIGGERS AND POSITION IMPLICATIONS
The nearest operating catalyst is Q2 reporting, expected in early 2027, when the company should demonstrate whether revenue and cash conversion improve despite holiday production constraints. Fiscal Q3 and Q4, covering January-June 2027, are the principal tests of management’s expectation for significantly higher throughput and further pricing realization. Brownfield startup around July 2027 is the next major capacity milestone. Defense funding is an event-driven catalyst with uncertain timing rather than a dependable calendar assumption.
The most important adverse review triggers are a reduction in annual operating income or free cash flow guidance, continued inventory accumulation without corresponding shipments, sustained SAO margin deterioration after the maintenance-heavy period, failure of stronger bookings to convert into sales, or slippage in brownfield startup and qualification. A 10-basis-point quarterly margin fluctuation is not a thesis-breaking event. A persistent change in margins, cash conversion or contract economics would be.
Disclosure quality warrants a higher verification threshold. Shipment volume was discontinued, absolute backlog was not provided, and management declined to separate price and volume. Aggregate tonnage is imperfect because product mix can distort average revenue per pound, as management explained on the prior call. Nevertheless, removing the measure without a replacement reduces the ability to test productivity and demand claims. Strong margins remain observable; the precise sources and sustainability of those margins are less transparent.
Operational resilience also matters disproportionately when equipment is highly utilized. Maintenance discipline supports reliability but does not eliminate unplanned outage, quality or labor risk. The reported safety incident rate of 1.7 cannot establish an improving trend without comparable-period information. Capacity-constrained operations can be both highly profitable and unusually sensitive to localized disruption.
For portfolio construction, Carpenter should be treated primarily as concentrated exposure to aerospace production, engine maintenance, specialty-material scarcity and industrial operating leverage. It is not a substitute for diversified defense exposure, given the dependence on funding transmission through customers. It also carries potential growth-valuation and momentum sensitivity despite its industrial classification. Marginal diversification benefits would be limited in a portfolio already heavily exposed to the same aerospace production recovery.
An existing position can be supported by the unchanged earnings framework and stronger order indicators, but increasing exposure solely on management’s optimism is not justified by this call. A specific entry price, target price, position size or price-based stop cannot be established responsibly without a verified current valuation and portfolio risk budget. Fundamental exit discipline should center on deterioration in the earnings trajectory, cash conversion, pricing durability or expansion economics. The decisive question is whether increasingly favorable demand signals become delivered, cash-generating earnings rather than remaining management expectations.
SOURCE BASIS
Financial comparisons and calculations use Carpenter Technology’s October 22, 2026 earnings release and supplied call transcript; its July 30, 2026 earnings release, presentation and prior-call guidance; and its January 29, 2026 earnings release. Consensus comparisons use the supplied Bloomberg earnings notice. Aircraft-program context uses Boeing’s September 29, 2026 F/A-XX announcement and October 20, 2026 737-10 certification announcement. Calculations use rounded disclosed amounts. Forward scenarios and valuation sensitivities are analytical assumptions rather than management forecasts.
COMPANY EMPLOYEES ON THE CALL
• Tony Thene, Chairman, President and Chief Executive Officer. • Tim Lain, Senior Vice President and Chief Financial Officer. • John Huyette, Vice President, Investor Relations.
RESEARCH ANALYSTS ON THE CALL
• Andre Madrid, U.S. Bancorp BTIG, as identified in the transcript. • Gautam Khanna, TD Cowen. • Scott Deuschle, Deutsche Bank. • Josh Sullivan, JonesTrading. • Bennett Moore, J.P. Morgan. • David Strauss, Wells Fargo. • Charles Minervino, Susquehanna.
Key Read-Throughs
KEY READ-THROUGHS FROM CARPENTER TECHNOLOGY’S FISCAL Q1 2027 EARNINGS CALL
Carpenter’s October 22, 2026 call strengthens the case for a sustained expansion in qualified aerospace materials, engine aftermarket activity and gas-turbine supply chains, but not for an indiscriminate industrial recovery. The most important combination was accelerating aerospace bookings, continued increases in contracted alloy prices and nearly unchanged record-level margins despite maintenance downtime. This favors companies controlling difficult-to-replicate production processes, while creating cost and delivery pressure for businesses purchasing those materials. The principal negative signal was the disconnect between defense requirements and funded procurement. Across the portfolio, the key distinction is between demand visibility and the ability to convert that demand into production, earnings and cash. Impact assessments below describe business-level direction and materiality, not predicted share-price changes. Country designations refer to issuer domicile.
SPECIALTY METALS AND MATERIALS
QUALIFIED ALLOY CAPACITY SHOULD RETAIN PRICING POWER, BENEFITING COMPETITORS RATHER THAN SIGNALING CARPENTER SHARE CAPTURE (READ-THROUGH 1)
Affected companies: ATI (ATI: United States), positive with potentially material earnings implications; Acerinox (ACX: Spain), positive with material implications for its high-performance alloys operations but a more moderate consolidated impact.
Call evidence: Commercial aerospace bookings increased 25% year-over-year, engine bookings increased 22%, and SAO maintained a 37.7% operating margin excluding surcharge. Management described “an expanding supply-demand gap for nickel superalloys” and reported higher pricing on newly signed and prospective LTAs. Critically, when questioned about competitive share, Thene clarified: “The shares are probably going to remain pretty well the same. There's not a share gain battle going on.”
The transmission mechanism is industry-wide demand growth against constrained, qualified capacity, rather than Carpenter taking business from competitors. ATI’s nickel alloys and aerospace forgings participate in the same requirement for high-temperature materials, demanding qualification standards and production consistency. More customer demand should support higher utilization and favorable contract renewals across the qualified supplier base. ATI’s own Q2 disclosure that aerospace and defense demand continued to exceed available supply independently reinforces this interpretation.
Acerinox provides a less obvious geographic expression through Haynes International and VDM Metals. Haynes brings substantial exposure to high-temperature aerospace and industrial gas-turbine alloys. A Spanish-listed company therefore participates in the same predominantly US and global aerospace supply-chain opportunity. The benefit should not be extrapolated to Acerinox’s entire stainless-steel portfolio, and Carpenter’s margin level is not an appropriate direct benchmark for either peer because product mixes, integration and reporting denominators differ.
Near-term trading relevance is positive corroboration for peer pricing and backlog commentary, particularly against concerns that aerospace profitability has peaked. The larger fundamental effect develops over several contract-renewal and production cycles. Capacity additions are the principal eventual counterweight, but installation alone does not establish qualified commercial output. This is a high-conviction positive read-through for specialized conversion capacity, not a bullish signal for bulk nickel prices or commodity steel generally.
AEROSPACE DISTRIBUTOR REPLENISHMENT IS BECOMING A VOLUME CATALYST, WITH A WORKING-CAPITAL COST (READ-THROUGH 2)
Affected company: Reliance (RS: United States), positive for aerospace-related shipment activity and gross-profit dollars; moderate impact within relevant subsidiaries and smaller consolidated impact. Inventory replenishment introduces a negative near-term cash-conversion offset.
Call evidence: Aerospace structural and distribution bookings increased 23% sequentially and 49% year-over-year. Management said distributors generally were experiencing bookings above billings and that “the majority, if not all of the customers in that sub-market are reporting decreasing inventories.” Customers reportedly expected double-digit growth in calendar 2027 and stronger growth in 2028.
Reliance owns Service Steel Aerospace, which distributes aerospace-grade steel, titanium and nickel products, providing a concrete exposure to the channel described by Carpenter. Declining channel inventories alongside increasing downstream orders create a requirement to replenish material even before aircraft production reaches higher targeted rates. That supports distributor purchasing, subsequent shipments and value-added processing activity.
The less obvious implication is that higher distributor orders to mills are not immediately equivalent to higher distributor free cash flow. Rebuilding physical inventory at higher replacement prices increases cash invested per unit, while customer receipts follow later. Distributor gross-profit dollars can improve while cash conversion temporarily weakens. Rising mill prices also do not guarantee wider distributor margins because replacement costs and customer repricing can move at different speeds.
Near-term catalysts are distributor aerospace shipment trends, inventory turns and commentary on customer releases over the next reporting cycles. The longer-duration benefit depends on sustained aircraft production rather than a temporary replenishment surge. Carpenter did not identify Reliance as a customer on the call; this is an exposure-based read-through through a verified aerospace distribution business, not a disclosed bilateral order.
AEROSPACE COMPONENTS
THE FASTENER RECOVERY APPEARS INCOMPLETE, MAKING A QUARTERLY BOOKINGS DECLINE A POOR PEAK-CYCLE SIGNAL (READ-THROUGH 3)
Affected company: Howmet Aerospace (HWM: United States), positive with moderate consolidated significance and more substantial relevance to Fastening Systems.
Call evidence: Carpenter’s aerospace fastener sales were the 2nd highest on record despite declining sequential bookings. Management characterized bookings as quarterly-variable and stated that fastener customers’ activity “has not yet fully caught up to current aircraft build rates.”
The transmission mechanism is a potential catch-up in fastener production and material procurement, followed by additional demand as aircraft output increases. If current ordering remains below consumption implied by aircraft production, a sequential bookings decline need not indicate weakening final demand. The combination of elevated shipments and under-ordering instead suggests continued replenishment requirements.
Howmet is directly exposed through its qualified aerospace fastening operations. Its April 2026 acquisition of Consolidated Aerospace Manufacturing expanded that exposure. The incremental CAM earnings therefore belong to Howmet rather than its former owner, Stanley Black & Decker. Carpenter’s commentary supports the demand environment into which Howmet is integrating that business, although it does not establish any acquisition-specific synergy outcome.
The near-term trading implication is to avoid treating Carpenter’s fastener bookings decline as a standalone bearish signal for Howmet. More informative catalysts are Howmet’s organic fastener growth, customer production schedules and conversion of backlog into shipments. Over the longer term, higher aircraft output supports utilization and fixed-cost absorption across qualified fastener capacity. The magnitude cannot be translated directly from Carpenter’s bookings because the companies occupy different production stages and do not share identical product mixes.
COMMERCIAL ENGINES AND AFTERMARKET
ENGINE MAINTENANCE DEMAND REMAINS RESILIENT, SUPPORTING RECURRING PARTS AND SERVICE REVENUE (READ-THROUGH 4)
Affected companies: GE Aerospace (GE: United States) and Safran (SAF: France), positive with material fundamental relevance to commercial propulsion and aftermarket earnings. The incremental trading signal is moderate because the call corroborates an existing demand trend rather than establishes a new service forecast.
Call evidence: Engine bookings increased 10% sequentially and 22% year-over-year. Management cited elevated MRO activity, a large population of engines approaching initial shop visits and increasing emergency orders. Asked whether higher fuel prices were affecting aftermarket demand, Thene stated: “We have not seen it, and we have not heard that from any of our customers.”
The mechanism is sustained demand for replacement engine components and repair inputs as aircraft utilization and maintenance requirements remain elevated. Engine maintenance is less discretionary than many industrial purchases: aircraft cannot continue operating indefinitely without satisfying inspection, overhaul and component-life requirements. Upstream ordering strength therefore supports confidence in the parts consumption underlying GE Aerospace’s and Safran’s service franchises.
This also makes the aftermarket thesis less dependent on an uninterrupted new-aircraft production ramp. Existing aircraft must remain serviceable while new deliveries are constrained, supporting maintenance demand even if OEM production schedules fluctuate. Carpenter’s material orders do not identify individual engine programs, but they provide an independent upstream confirmation that maintenance-related procurement has not weakened alongside aerospace equity sentiment.
The important qualification is contractual economics. More shop visits do not automatically produce proportionate profit growth under every maintenance agreement. Unexpected removals can raise costs under fixed-price or usage-based service contracts. The positive inference is sustained maintenance demand and parts consumption, not that every additional visit is incrementally profitable.
Near-term catalysts are service orders, spare-parts sales and shop throughput. The longer-duration benefit comes from an expanding installed engine base progressing through maintenance cycles. This is a stronger read-through for commercial propulsion aftermarket exposure than for unrelated aircraft aftermarket categories.
MATERIALS SCARCITY CREATES A NEGATIVE COST AND DELIVERY IMPULSE FOR ENGINE AND AIRFRAME OEMS (READ-THROUGH 5)
Affected companies: GE Aerospace (GE: United States), Safran (SAF: France) and RTX (RTX: United States), negative for production-input costs and supply-chain execution; Boeing (BA: United States) and Airbus (AIR: Netherlands), negative for the reliability of production ramps and delivery-related cash conversion. Direct material-cost effects are likely smaller than the potential consequences of a missing critical component.
Call evidence: Management reported higher prices across both LTA and transactional business, increasing emergency engine orders and equipment operating close to available limits. The brownfield expansion remains scheduled to become available around the beginning of fiscal 2028, approximately July 2027. Thene emphasized that “volume isn't generic and it's not 100% fungible.”
The immediate mechanism is that suppliers’ higher base prices become customers’ higher procurement costs unless offset by productivity, contractual recovery or downstream pricing. Raw-material surcharge clauses do not necessarily reimburse increases in the supplier’s conversion price. The existence and timing of recovery depend on individual customer contracts, which Carpenter did not disclose.
The potentially larger mechanism is production synchronization. An engine or aircraft cannot be delivered merely because most of its components are available. Scarcity in a particular qualified alloy or manufacturing route can delay a high-value assembly even if aggregate metal capacity appears adequate. Higher customer demand can therefore increase inventory and work in process without generating an equivalent increase in completed deliveries.
For GE Aerospace, Safran and RTX’s Pratt & Whitney business, the negative impulse is a combination of higher input costs, scheduling friction and potential expediting requirements. For Boeing and Airbus, the exposure is mainly indirect through engines and other critical components. A relatively small shortage can defer a much larger delivery milestone and associated cash receipt.
Near-term catalysts are supplier delivery performance, production targets and inventory conversion rather than aircraft order announcements. The longer-duration issue is the time required to add qualified capacity throughout the production chain. This is a high-conviction negative supply-side overlay, not an overall bearish earnings conclusion for engine manufacturers: strong aftermarket economics can offset or exceed the pressure on original-equipment production.
THE 737-10 CERTIFICATION BENEFIT IS CONCENTRATED IN BOEING AND THE CFM PROPULSION FRANCHISE (READ-THROUGH 6)
Affected companies: Boeing (BA: United States), positive with meaningful program and delivery significance; GE Aerospace (GE: United States) and Safran (SAF: France), positive through CFM International, with a moderate near-term production benefit and a longer-duration aftermarket opportunity.
Call evidence: Management highlighted FAA approval of the 737 MAX 10 as an additional aerospace demand catalyst. Boeing’s certification announcement confirms that the variant represents more than 30% of the 737 MAX order book, rather than 30% of Boeing’s total backlog.
The precise propulsion relationship matters. The LEAP-1B is the exclusive engine for the 737 MAX family, and CFM International is owned equally by GE Aerospace and Safran. Consequently, the propulsion read-through is concentrated in those companies rather than spread evenly across commercial engine manufacturers.
For Boeing, certification removes a gating condition for customer deliveries and improves the ability to convert contracted demand for the larger MAX variant into revenue and cash. For GE Aerospace and Safran, additional aircraft deliveries expand the installed engine base, eventually supporting spare engines, replacement parts and service revenue.
The near-term benefit should not be calculated by multiplying the entire 737-10 backlog by aircraft or engine content. Some material and engines may already have been procured, some deliveries may substitute for other MAX variants within a constrained production system, and certification does not eliminate manufacturing bottlenecks. Early original-equipment deliveries also do not necessarily carry the margins of a mature aftermarket franchise.
Certification was already public before Carpenter’s call. The incremental information is an upstream supplier’s confirmation that customers view it as a stronger demand signal. The structural value is in deliveries and the installed-base service opportunity, not a fresh certification surprise or an automatic earnings step-up in the current quarter.
DEFENSE AND REARMAMENT
THE FUNDING GAP IS NEGATIVE FOR THE TIMING OF INCREMENTAL PRODUCTION, EVEN WHEN STRATEGIC DEMAND IS STRONG (READ-THROUGH 7)
Affected companies: RTX (RTX: United States) and Lockheed Martin (LMT: United States), negative for confidence in the speed of additional US missile and military-aircraft production expansion. The company-level read-through is low to moderate and concerns incremental growth timing, not evidence of deterioration across existing funded backlogs.
Call evidence: Carpenter’s defense bookings declined both sequentially and year-over-year. Management attributed the weakness to customers lacking the funds required to place material orders consistent with defense requirements. Thene stated: “The real issue is that the Department of War doesn't place orders. There's multiple companies in the supply chain that place those orders, and they don't have that funds flow to be able to do it.”
The transmission mechanism is the gap between a strategic requirement and executable procurement through lower-tier suppliers. Announced spending ambitions do not immediately finance alloy purchases, component inventory or additional production shifts. Suppliers that cannot commit working capital delay procurement, extending the interval between budget intentions and completed missile or aircraft output.
This matters to RTX and Lockheed Martin because their weapons and military-aircraft businesses require synchronized material and component availability. The call does not identify a specific affected contract at either company, so it does not justify reducing their reported backlog or applying Carpenter’s defense decline directly to their revenue. The defensible negative inference is that industry production cannot be accelerated solely by pointing to demand or headline budgets.
The same mechanism can create a subsequent positive procurement wave once funds move through the system. However, the near-term catalyst is enacted funding, contract obligations and actual supplier releases, not the midterm election itself. A funding-driven order surge could initially increase component lead times and working-capital requirements before improving finished-system deliveries.
The cross-portfolio implication is to distinguish funded production programs from exposures relying on anticipated replenishment or new starts. Carpenter’s weakness is not evidence of a broad decline in defense demand, but it challenges assumptions that every participant will monetize rearmament at the same speed. Program announcements such as Boeing’s F/A-XX selection establish long-duration opportunity; they do not eliminate near-term procurement constraints.
POWER GENERATION AND INDUSTRIAL EQUIPMENT
GAS-TURBINE DEMAND REMAINS STRONG DESPITE WEAK HEADLINE ENERGY SALES AT THE MATERIALS SUPPLIER (READ-THROUGH 8)
Affected companies: GE Vernova (GEV: United States) and Siemens Energy (ENR: Germany), positive with moderate incremental significance for their gas-turbine franchises; Howmet Aerospace (HWM: United States) and Acerinox (ACX: Spain), positive through turbine components and high-temperature alloys, with materiality varying by business mix.
Call evidence: Carpenter’s reported energy revenue excluding surcharge declined 22.6% year-over-year, but management specifically stated that “on the IGT side has been very strong” and expected that strength to continue. The company distinguished industrial gas turbines from its much smaller oil-and-gas business.
The key implication is that a broad end-market revenue label obscures the relevant product cycle. Carpenter’s aggregate energy decline is not a sound basis for concluding that gas-turbine demand is weakening. Material shipments can fluctuate with production scheduling, while underlying turbine requirements remain strong.
For GE Vernova and Siemens Energy, the positive transmission mechanism is upstream confirmation of continuing demand for the high-temperature materials required in gas-turbine manufacturing and maintenance. This is consistent with their own disclosures of strong gas-equipment orders and capacity expansion. Carpenter’s commentary does not establish that either is a named direct customer, nor does it identify the specific projects responsible for demand.
For Howmet and Acerinox’s high-performance alloys businesses, the mechanism is more directly tied to component and material content. Additional turbine production and maintenance consume qualified castings, alloys and other temperature-resistant products. These suppliers can participate in power-generation growth without depending solely on commercial aircraft production.
The less obvious cross-sector implication is competition for specialized industrial resources. Aerospace engines and industrial turbines draw on overlapping metallurgical capabilities, skilled labor and certain production processes. Their simultaneous expansion can sustain supplier pricing power even if 1 end market experiences temporary order volatility. The capacities are not fully interchangeable, so this is a shared constraint rather than a simple pool of fungible supply.
Near-term trading relevance is protection against an incorrect bearish interpretation of Carpenter’s aggregate energy revenue. The longer-duration benefit is continued turbine production and service demand, supported by expanding power requirements. For Siemens Energy, the exposure also illustrates why a German listing should not be equated with dependence on a weak European industrial cycle: significant demand originates outside Europe, including the US. The read-through is specific to gas turbines and their supply chain, not a broad positive call on oilfield services, all energy equipment or every data-center-related equity.
Report record
- Sector
- Industrials
- Fiscal period end
- September 30, 2026
- Report date
- October 22, 2026
- Analysis
- 5338 words
- Read-throughs
- 2748 words
- Content fingerprint (PDF)
141b7e13fdbc- Content fingerprint (analysis)
83cfbe1ab0e1- Content fingerprint (read-throughs)
6267916825a9
Prepared from the company's earnings release and earnings call transcript. Figures as reported by the company. For information only. Not investment advice.
More from Carpenter Technology Corporation
No other reports yet.
All Carpenter Technology Corporation reports
More in Industrials
Improved visibility into 2027 rather than a substantial upgrade to 2026 earnings
Profit dollars substantially exceeded expectations, but profitability per revenue dollar fell short
Follow @AtlasPeakRes on X for new earnings reports as they publish.