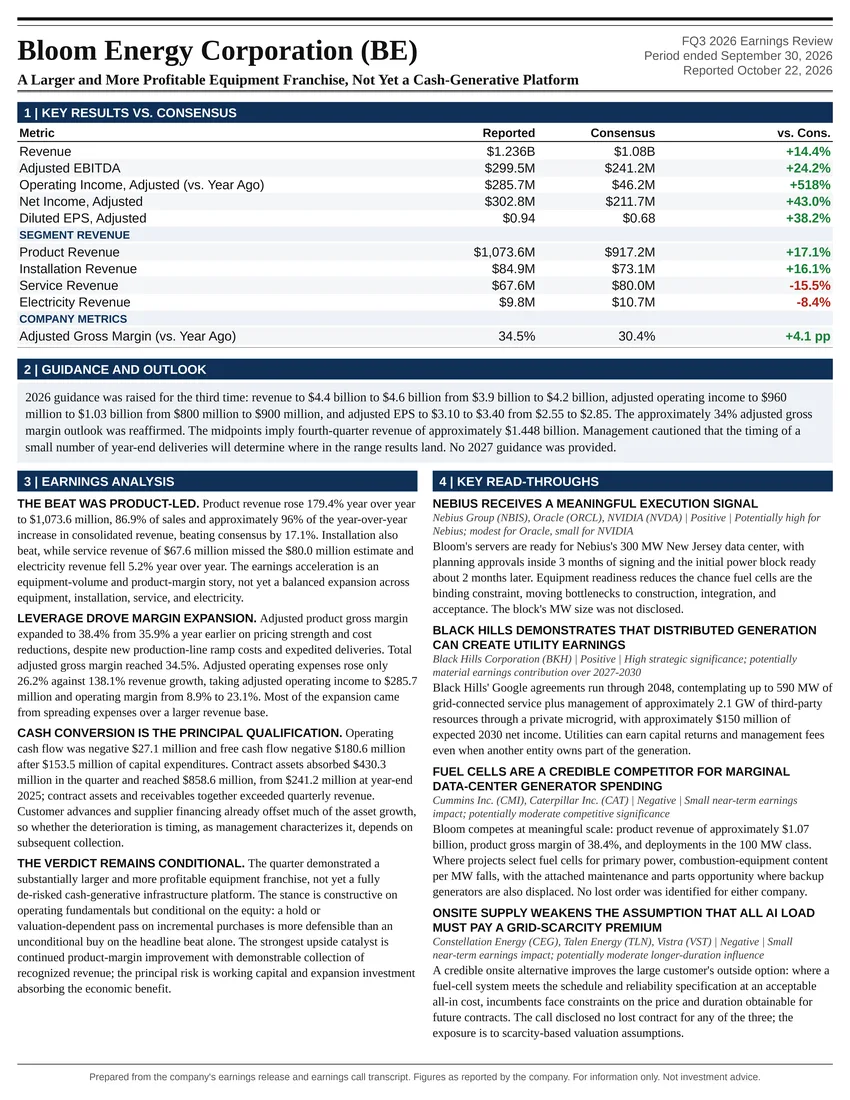
A Larger and More Profitable Equipment Franchise, Not Yet a Cash-Generative Platform
Earnings Reports
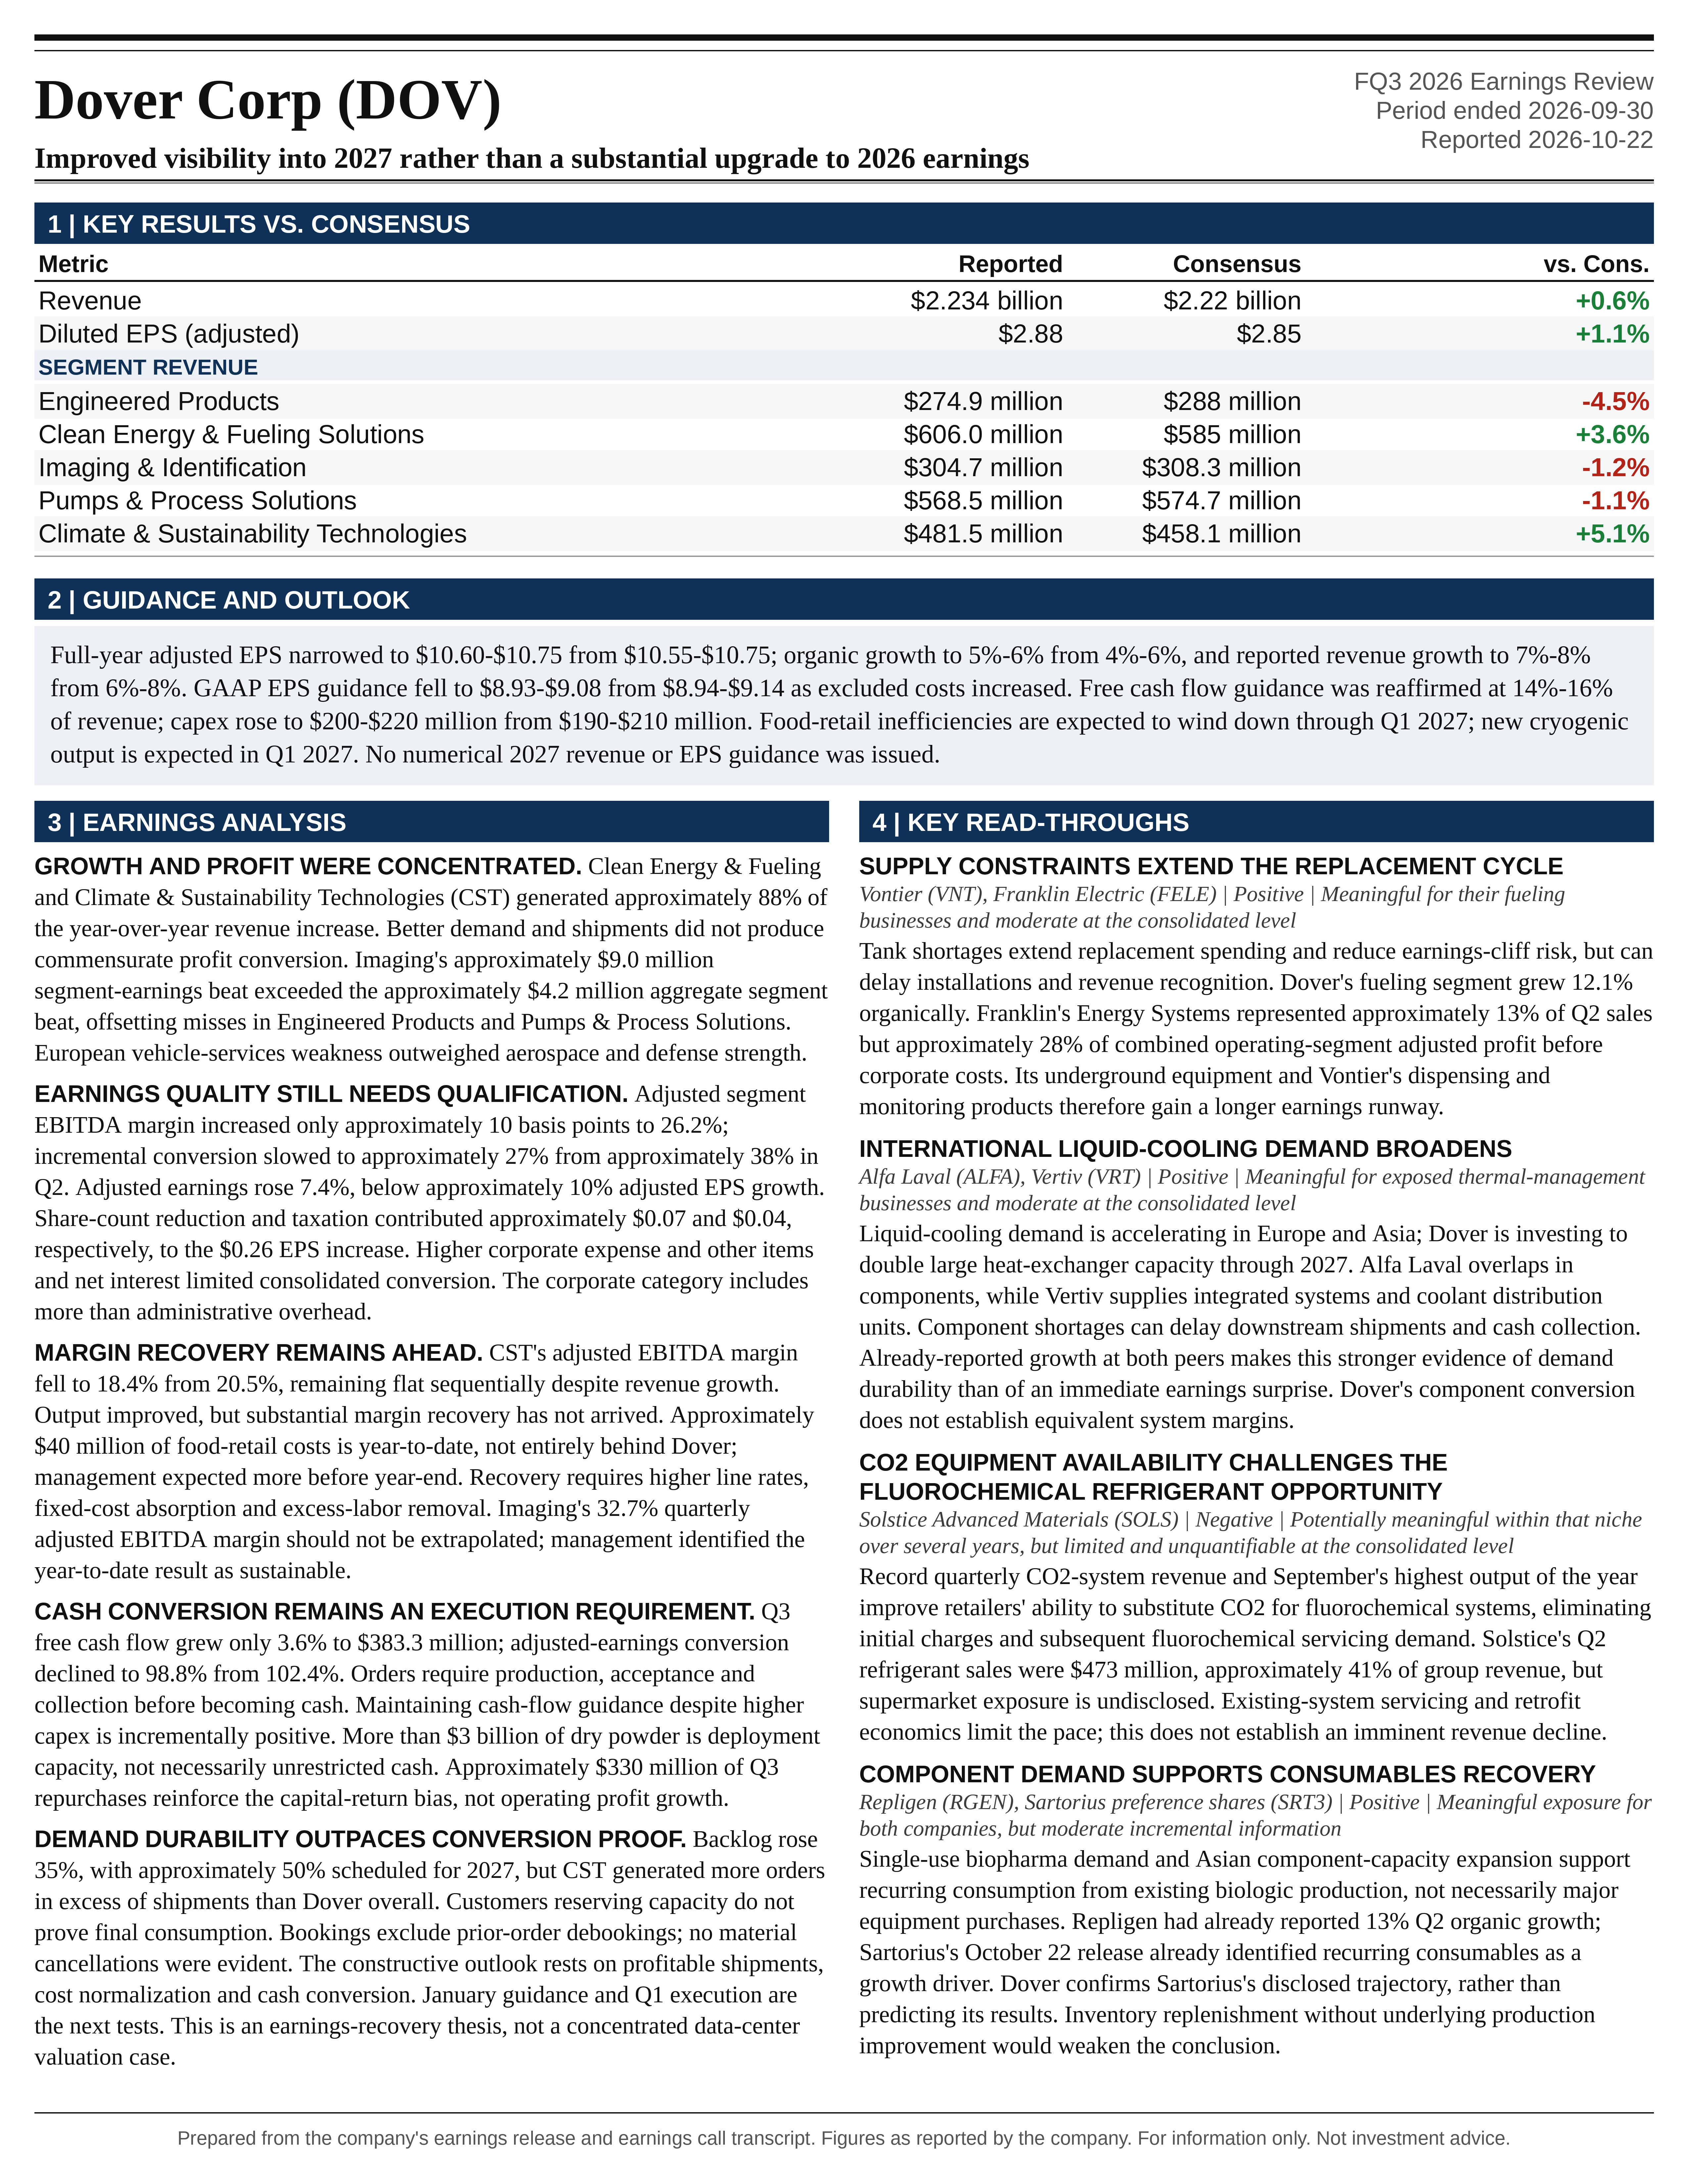
Dover Corp FQ3 2026 Earnings Report
Dover Corp (DOV) FQ3 2026 earnings: Improved visibility into 2027 rather than a substantial upgrade to 2026 earnings. Full earnings analysis, key read-throughs, and the one-page exhibit from Atlas Peak Research.
Dover Corp (DOV)
Sector: Industrials · FQ3 2026 · Period end September 30, 2026 · Reported October 22, 2026
Dover’s Q3 2026 earnings call supports a constructive fundamental outlook, but the principal investment development was improved visibility into 2027 rather than a substantial upgrade to 2026 earnings.
Download the one-page report (PDF)
View one-page exhibit
Download analysis (.md)
Download read-throughs (.md)
Post to X
One-Page Exhibit
Earnings Analysis
EXECUTIVE CALL SUMMARY: Dover Corporation (10/22/26)
Dover’s Q3 2026 earnings call supports a constructive fundamental outlook, but the principal investment development was improved visibility into 2027 rather than a substantial upgrade to 2026 earnings. Organic growth accelerated, capacity-constrained businesses continued to accumulate orders, and management identified a more tangible path toward recovering food-retail production inefficiencies. The investment thesis increasingly depends on converting existing demand into profitable shipments as capacity becomes available. The appropriate distinction is between stronger evidence of revenue durability, which the quarter provided, and proof of materially better earnings conversion, which remains incomplete.
Revenue increased 7.5% to $2.234 billion, approximately 0.6% above the supplied Bloomberg consensus of $2.22 billion. Organic growth of 7.1% exceeded the 5.78% consensus by 132 basis points and accelerated from 4.8% in Q2. Adjusted EPS of $2.88 exceeded the $2.85 consensus by $0.03, or 1.1%, and increased from $2.62 a year earlier. The stronger organic-growth surprise than EPS surprise is important. Dover delivered better demand and shipment performance without a commensurate improvement in aggregate profit conversion.
The strongest forward indicator was the order book. Quarterly bookings increased approximately 16%, trailing 12-month book-to-bill reached 1.08, and backlog increased 35% year over year, with approximately 50% scheduled for shipment in 2027. However, the quarterly order surplus was concentrated in Climate & Sustainability Technologies, or CST. That segment generated more orders in excess of shipments than Dover generated in aggregate. Growth in bookings across all 5 segments therefore should not be confused with equally strong backlog accumulation throughout the portfolio.
Full-year adjusted EPS guidance increased only modestly, from $10.55-$10.75 to $10.60-$10.75. The midpoint rose by $0.025, or approximately 0.2%, while the upper bound remained unchanged. Organic-growth guidance narrowed from 4%-6% to 5%-6%. These revisions reduce downside to the existing outlook but do not constitute a significant earnings reset. Moreover, GAAP EPS guidance declined slightly because expected excluded restructuring and other costs increased.
The central 2027 opportunity is the combination of capacity additions, food-retail cost normalization, restructuring benefits, acquisition carryover, and a lower share count. The central risk is that advance ordering and capacity reservations overstate the durability of underlying consumption just as Dover and competitors expand supply. A favorable operating interpretation is warranted, but a valuation-independent purchase recommendation is not. The strongest evidence supports an earnings-recovery thesis with identifiable execution milestones, not an assumption that current bookings mechanically translate into comparable revenue growth or that Dover should receive the valuation of a concentrated data-center supplier.
QUARTERLY PERFORMANCE AND EARNINGS QUALITY
Dover’s reported revenue growth consisted of 7.1% organic growth, a 0.5% acquisition contribution, and a 0.1% currency headwind. Compared with Q2, when reported growth of 6.9% included 4.8% organic growth, 1.2% from acquisitions, and 0.9% from currency, Q3 growth was materially more organic. This improves the quality of the revenue acceleration. It does not establish that all organic growth was unit-volume growth, since pricing remains part of the organic measure and the call did not quantify a complete price-volume bridge.
The acceleration was concentrated. Clean Energy & Fueling and CST together generated approximately 88% of Dover’s year-over-year revenue increase. Clean Energy & Fueling revenue increased by $64.6 million, while CST increased by $72.9 million, against a consolidated increase of $156.0 million. Imaging & Identification and Pumps & Process Solutions contributed more modestly, while Engineered Products declined. Dover’s portfolio diversification remains meaningful, but its incremental growth is substantially more concentrated than its segment count suggests.
Geographic performance was also uneven. Organic growth reached 12.6% in the US and 15.1% in Asia, compared with 7.9% and 8.5%, respectively, in Q2. Europe declined 3.0%, an improvement from a 5.0% decline in Q2, but not a return to growth. Other Americas declined 7.0%, reversing Q2 growth of 8.8%. Management’s positive demand commentary is consequently better interpreted as strength across selected applications and regions rather than evidence of a synchronized global industrial recovery.
The margin definitions require particular care. The approximately 33%, 34%, and 18% margins discussed on the call for Imaging & Identification, Pumps & Process Solutions, and CST correspond to adjusted segment EBITDA margins, not the segment earnings figures labeled adjusted EBIT in the Bloomberg notice. Dover’s financial supplement reports Q3 adjusted EBITDA margins of 32.7%, 33.9%, and 18.4%, respectively. The corresponding segment earnings margins were 31.2%, 31.3%, and 16.7%. Comparing the call’s EBITDA percentages directly with EBIT dollars would materially misstate profitability.
Total adjusted segment EBITDA increased to $585.0 million from $542.7 million. Its margin increased only approximately 10 basis points, to 26.2%, despite the stronger organic-growth rate. Incremental adjusted segment EBITDA conversion was approximately 27%, compared with approximately 38% in Q2. Total segment earnings margin similarly increased only modestly, to 24.3% from 24.2%. The sequential improvement in absolute profitability is real, but year-over-year operating leverage weakened relative to Q2.
Adjusted earnings from continuing operations increased 7.4% to $387.9 million, less than the approximately 10% increase in adjusted EPS. Diluted weighted-average shares declined 2.3%, from 138.0 million to 134.9 million. The adjusted effective tax rate, calculated from the release’s reconciliation, declined to approximately 20.6% from 21.7%. Relative to the prior-year share count and tax rate, these factors contributed approximately $0.07 and $0.04, respectively, to quarterly EPS. A meaningful portion of the $0.26 EPS increase therefore came from capital allocation and taxation rather than operating earnings growth.
Adjusted pretax earnings increased approximately 5.8%. The $40.6 million increase in total segment earnings was partly offset by a $10.9 million increase in corporate expense and other items and a $2.9 million increase in net interest expense. The corporate category includes more than administrative overhead, so its deterioration should not automatically be attributed to headquarters spending. Nevertheless, the bridge demonstrates why strong segment-level revenue growth did not produce a larger consolidated earnings surprise.
The composition of the earnings beat was also less broad than the headline suggests. Imaging & Identification’s segment earnings exceeded consensus by approximately $9.0 million. The sum of all 5 segment earnings exceeded the sum of the supplied segment estimates by only approximately $4.2 million. Imaging therefore more than accounted for the aggregate segment-profit outperformance, offsetting misses in Engineered Products and Pumps & Process Solutions. This matters because management explicitly discouraged extrapolating Imaging’s unusually strong quarterly margin.
ORDERS, BACKLOG, AND THE QUALITY OF 2027 VISIBILITY
Quarterly bookings were $2.310 billion, up 15.5% from $2.000 billion a year earlier. They declined approximately 0.9% sequentially from Q2, while book-to-bill declined from approximately 1.06 to 1.03. The sequential decline does not independently establish weaker demand, particularly given stronger shipments and management’s explanation of normal seasonality. It does establish that order dollars are not accelerating monotonically.
The quarterly composition is more informative than the aggregate ratio. CST bookings increased 43.1% to $594.1 million, producing book-to-bill of approximately 1.23. Clean Energy & Fueling bookings increased 16.3%, and Pumps & Process Solutions increased 9.0%. Engineered Products and Imaging & Identification bookings increased only approximately 0.4% and 0.2%, respectively. Every segment grew orders, but the magnitude varied substantially.
CST generated approximately $112.6 million of orders in excess of revenue, compared with approximately $76.3 million for Dover overall. Excluding CST, consolidated book-to-bill was approximately 0.98. CST also contributed approximately 58% of the year-over-year increase in consolidated bookings. These figures qualify the breadth of the forward signal without invalidating it. Strong backlog accumulation is concentrated in businesses where demand is outrunning available production capacity.
The trailing 12-month data are more reassuring than a narrow quarterly interpretation. Management reported 16% bookings growth against 8% revenue growth, trailing book-to-bill of 1.08, and bookings growth exceeding revenue growth in every segment. This sustained divergence supports a genuine increase in future shipment coverage, although it does not determine the timing, cancellation risk, or profitability of those shipments.
The most consequential change relative to the prior call is the extension of backlog visibility into 2027. In July, management described orders extending into 2027 as concentrated in the long-cycle portion of the portfolio and not material to total backlog. In October, approximately 50% of backlog was scheduled for 2027, and Tobin emphasized that the build was driven by capacity-constrained businesses rather than being disproportionately influenced by traditional long-cycle operations. That is a meaningful improvement in visibility within a relatively short period.
Tobin explained the mechanism directly: “customers are basically getting in line to reserve that capacity.” This supports the durability of the near-term shipment opportunity but introduces a distinction between capacity reservations and final consumption. Customers facing long lead times can place orders earlier, increase coverage, or reserve supply across vendors. The call did not disclose cancellation provisions, deposits, customer concentration, or a complete backlog aging schedule.
Dover’s published bookings definition adds another qualification: bookings exclude debookings associated with orders received in prior periods. Reported bookings growth is therefore not a comprehensive measure of net order activity after all prior-order cancellations. There is no evidence in the call of material cancellations, but the metric’s definition limits the conclusions that can be drawn from it.
Management appropriately rejected a direct conversion of the order-revenue gap into a 2027 organic-growth forecast. Tobin stated, “To get into the high-level math when you don’t know what the duration is of the timing of those orders, it’s a fool’s game.” That caution is economically justified. Backlog growth incorporates shipment constraints, delivery scheduling, and potentially changes in ordering behavior. It is not equivalent to growth in underlying annual demand.
A reduction in book-to-bill as capacity becomes available would not necessarily be negative. If shipments accelerate and backlog converts into cash, a lower ratio could indicate successful execution. The adverse outcome would be weaker bookings accompanied by cancellations, delivery deferrals, excess inventory, and declining utilization. Those combinations, rather than book-to-bill in isolation, should determine whether the backlog thesis is strengthening or deteriorating.
GUIDANCE CHANGES AND THE Q4 REQUIREMENT
The latest adjusted EPS range of $10.60-$10.75 compares with $10.55-$10.75 issued on 07/23/26. The lower bound increased $0.05, the upper bound was unchanged, and the range narrowed by 25%. Against 2025 adjusted EPS of $9.61, the revised range implies approximately 10.3%-11.9% growth. The change is consistent with management’s double-digit earnings algorithm, but its incremental magnitude is small.
Organic-growth guidance narrowed from 4%-6% to 5%-6%, increasing the midpoint by 50 basis points. Reported revenue-growth guidance narrowed from 6%-8% to 7%-8%. Relative to the supplied full-year organic-growth consensus of 5.39%, the revised midpoint of 5.5% is only modestly higher. The stronger Q3 result primarily increases confidence in the existing annual outcome rather than establishing a materially different forecast.
Using reported year-to-date adjusted EPS of $7.89, the annual range implies approximately $2.71-$2.86 of Q4 adjusted EPS, subject to rounding and weighted-average share-count effects. That represents approximately 8%-14% growth against Q4 2025 adjusted EPS of $2.51. The implied sequential decline from Q3 is consistent with seasonality and should not be interpreted as evidence of an earnings deterioration without considering the prior-year pattern.
Applying the 7%-8% reported growth range to 2025 revenue of $8.093 billion implies 2026 revenue of approximately $8.659-$8.740 billion. After subtracting year-to-date revenue of $6.477 billion, Q4 revenue would be approximately $2.182-$2.262 billion, or 3.9%-7.8% growth. The midpoint implies approximately 5.9% growth, below Q3’s 7.5%.
Management attributed this apparent moderation to shipment timing rather than weakening demand. Tobin stated, “there’s nothing based on the trajectory that we see that’s any slowing. It’s pure calendarization.” The relevant risk is customer acceptance and year-end working-capital management. Having orders and production capacity does not ensure that customers will accept delivery before the fiscal year closes.
The GAAP guidance revision is less favorable than the adjusted headline. GAAP EPS guidance changed from $8.94-$9.14 to $8.93-$9.08. Its midpoint declined by $0.035, while adjusted EPS midpoint increased by $0.025. The difference is explained by projected net adjustments increasing from $1.61 to $1.67 per share. Purchase-accounting adjustments declined from $1.20 to $1.16, but restructuring and other adjustments increased from $0.41 to $0.51.
This distinction prevents the adjusted guidance increase from being characterized as an unqualified improvement in economic earnings. Expected operating performance improved modestly, but expected excluded costs also increased. Formal restructuring charges, ordinary production inefficiencies, capital expenditures, and cash restructuring payments must remain separate when evaluating the recovery.
No numerical 2027 revenue or EPS guidance was issued. Management identified favorable components of the earnings bridge and committed to quantifying restructuring carryover when annual guidance is provided in January. Assertions that Dover has already guided to a particular 2027 growth rate or margin would exceed the disclosures.
CLIMATE & SUSTAINABILITY TECHNOLOGIES: THE MAIN EXECUTION TEST
CST revenue increased 17.9% organically to $481.5 million, accelerating from 8.3% organic growth in Q2 and exceeding the 11.7% consensus by 620 basis points. Revenue exceeded the dollar consensus by approximately 5.1%. The result demonstrates that output is improving and that demand remains strong across heat exchangers and important refrigeration applications.
The profitability result was substantially less impressive. Segment earnings increased only 6.0% to $80.6 million, while segment earnings margin declined to 16.7% from 18.6%. Adjusted EBITDA margin declined to 18.4% from 20.5%. Incremental segment earnings conversion was approximately 6%, and incremental EBITDA conversion was approximately 7%. These are weak conversion rates for a business reporting nearly 18% revenue growth.
Sequentially, adjusted EBITDA margin remained approximately 18.4%, despite a 5.8% increase in revenue from Q2. The quarter therefore provides evidence of throughput improvement, but not yet of the substantial margin recovery embedded in management’s 2027 commentary. The distinction is central to the investment case.
Operating milestones are encouraging. CO2 systems achieved record quarterly revenue, September output reached its highest level of the year, and refrigerated door-case line rates exiting Q3 were 15% above the Q2 exit rate. The Sylmar door-frame production consolidation was completed at quarter-end. However, an exit-rate improvement is not equivalent to a 15% increase in full-quarter production, and physical consolidation does not immediately eliminate training, overtime, scrap, scheduling, or redundant-labor costs.
The timing comparison with Q2 warrants scrutiny. In July, management acknowledged that refrigeration throughput had fallen short and expected the correction to improve second-half revenue and margins. October results demonstrate the revenue component more clearly than the margin component. Management now expects remaining production inefficiencies to wind down through the end of Q1 2027. This is not sufficient evidence of a formally missed margin forecast, since no precise quarterly target was provided, but it does mean that the strongest profitability benefit remains ahead rather than having already been delivered.
The approximately $40 million of food-retail costs is a year-to-date figure, not a completed annual expense and not an amount entirely behind the company. Tobin explicitly corrected that interpretation and indicated that the total would probably increase before year-end. The remaining recovery depends on higher line rates, improved fixed-cost absorption, and the removal of excess labor as operations stabilize.
Relative to CST’s $1.348 billion of year-to-date revenue, $40 million represents approximately 297 basis points. That explains the analyst’s reference to approximately 300 basis points of margin pressure. It does not mean that 2027 segment margin automatically increases by 300 basis points. The future revenue denominator will differ, some costs can persist into Q1, and the timing of productivity realization matters.
An illustrative $40 million pretax recovery would contribute approximately $0.23 to annual EPS at a 21% tax rate and roughly 135 million diluted shares. Each additional $10 million of recovery would contribute approximately $0.06. The opportunity is meaningful, but $40 million alone represents only approximately 2.2% of the current full-year adjusted EPS midpoint. It cannot independently explain a much larger 2027 earnings-growth forecast.
The financial supplement separately excludes $9.0 million of year-to-date footprint-reduction-related other costs in CST. Management’s $40 million discussion appears to concern operating inefficiencies that continue to depress segment performance, but a detailed reconciliation between the categories was not provided. Consequently, operating cost recovery, excluded restructuring charges, and future restructuring savings should not simply be added together without checking for overlap.
The clearest near-term commitment was Tobin’s statement, “I think that we will beat our comp in Q1.” That establishes a measurable milestone, but the comparison is relatively undemanding: CST’s Q1 2026 adjusted EBITDA margin was 17.5%, below Q3’s 18.4%. Exceeding the Q1 comparison would be progress, but would not by itself prove that the full consolidation benefit has been captured.
HEAT EXCHANGERS AND DATA-CENTER COOLING
SWEP is the strongest example of Dover’s capacity-investment strategy producing favorable operating leverage. Management stated that heat-exchanger margins remained robust despite ongoing capacity investment because revenue growth was outrunning the incremental cost base. Direct labor accounts for less than 10% of costs, making the business less dependent on a large labor ramp than food-retail manufacturing.
The competitive advantage is not simply access to a fast-growing market. It combines engineered product requirements, manufacturing automation, established customer relationships, and lengthy capacity-development lead times. Tobin stated, “You need to make capacity decisions 18 months in advance before them coming online.” This creates a near-term advantage for suppliers that invested before the demand acceleration became fully visible.
Dover is investing to double global capacity for large heat exchangers through 2027. This should not be interpreted as doubling all SWEP capacity, doubling data-center revenue, or doubling Dover revenue. Nor should the Q2 and Q3 references be treated as separate capacity-doubling programs. July commentary referred to doubling relevant capacity over approximately 12 months; October described the program as extending through 2027, with a significant capacity step around Q4 and Q1. The disclosures do not establish that the entire increase will be available by Q1.
The expansion of data-center cooling demand into Europe and Asia adds breadth to an opportunity initially concentrated in the US. Nevertheless, strong demand for a specific cooling application does not imply that Dover’s broader European industrial exposure has recovered. The consolidated geographic results remain negative in Europe.
The anticipated shift from central cooling applications toward a greater coolant distribution unit, or CDU, mix is strategically important. Heat exchangers can participate at different locations within a liquid-cooling architecture, and their content, specifications, and pricing can vary with system design. Dover’s opportunity depends on the product content captured within those architectures, not simply on aggregate data-center capital spending.
The call did not quantify revenue content per rack, content per CDU, the relative economics of central-cooling versus CDU applications, or the degree to which the transition is additive rather than substitutive. It is therefore premature to assume that a larger CDU mix necessarily produces higher revenue or margins. The positive evidence is that management is explicitly incorporating the architectural transition into capacity planning.
Competition is the principal longer-duration risk. Management acknowledged that existing competitors are also expanding capacity. A concentrated supply base can support attractive economics, but concentration does not eliminate the risk of synchronized investment and eventual excess supply. Tobin’s statement that “we’re going to find out altogether about the duration of the demand” is an important qualification to the otherwise favorable outlook.
The most attractive outcome is sustained demand growth that absorbs the new capacity while preserving pricing and utilization. The adverse outcome is that customers’ advance reservations unwind as supply normalizes, leaving several manufacturers with higher fixed costs. Capacity utilization, lead-time normalization, order cancellations, pricing, and cash conversion will be more informative than capacity announcements alone.
CLEAN ENERGY & FUELING: STRONG GROWTH, DEFERRED MARGIN LEVERAGE
Clean Energy & Fueling revenue increased 12.1% organically to $606.0 million, accelerating from 8.6% in Q2 and substantially exceeding the 7.4% consensus. Revenue was approximately 3.6% above the dollar estimate. Growth reflected cryogenic components, fluid transport, and particularly strong North American retail fueling.
Segment earnings increased approximately 12% to $132.9 million, leaving segment earnings margin essentially unchanged at 21.9%. Adjusted EBITDA margin was 23.4%, compared with 23.5% a year earlier. The segment therefore converted growth into higher profit dollars but did not produce meaningful year-over-year margin expansion. Earnings exceeded consensus by approximately 1.9%, less than the revenue beat.
Cryogenic demand is running ahead of available capacity, with new output expected in Q1 2027. Management’s analogy to SWEP is plausible: capacity additions initially depress profitability, then improve returns as shipment volumes absorb the fixed cost base. However, this is a proposed operating trajectory rather than evidence that cryogenic manufacturing will replicate SWEP’s exact margin structure or ramp speed.
The retail-fueling outlook improved in duration. Management had previously described a 3-year cycle and now indicated that it could extend to at least 4 years. This represents an extension of the original cycle, not a new commitment to 4 additional years of growth from October 2026.
The economic mechanism is more nuanced than higher fuel prices. Tobin emphasized healthy customer fuel spreads and profitability. Retail fuel margins depend on the relationship between acquisition costs, selling prices, and competitive conditions, not on the absolute gasoline or diesel price alone. Higher pump prices should therefore not be treated as a direct proxy for greater Dover demand.
Underground tank availability is also extending the replacement cycle. Dover does not supply the tanks themselves; it supplies associated equipment. Tank shortages can prolong the spending opportunity while simultaneously delaying installations and near-term revenue recognition. The greenfield expansion in below-ground retail-fueling products indicates confidence in the duration and profitability of that associated demand.
Management affirmed progress toward a previously discussed 25% margin objective but did not provide a new numerical 2027 target. Similarly, the discussion of CST’s historical 20% objective did not establish fresh annual guidance. The accounting basis and timing of these references were not fully restated during the exchanges, limiting their usefulness as precise near-term modeling commitments.
PUMPS & PROCESS SOLUTIONS: HIGH PROFITABILITY, MODEST ORGANIC MOMENTUM
Pumps & Process Solutions revenue increased 3.2% to $568.5 million, but organic growth was only 1.2%, below the 2.75% consensus. Organic growth improved from 0.4% in Q2, although it remained modest relative to the strength discussed in AI infrastructure, energy infrastructure, single-use biopharma, and industrial pumps.
Segment earnings increased 5.5% to $177.9 million, approximately 2.3% below consensus. Segment earnings margin increased to 31.3% from 30.6%, while adjusted EBITDA margin increased to 33.9% from 33.2%. The year-over-year result is favorable, but EBITDA margin declined from 34.9% in Q2. Annualizing the Q2 peak would therefore have overstated the subsequent run rate.
Polymer processing remained the principal offset to stronger applications. Management described quoting activity as high, but quoting is not equivalent to firm orders or recognized revenue. The distinction is particularly relevant because the July call had anticipated a return to polymer-processing growth in the second half, while Q3 commentary still described lower volumes. The expected recovery had not clearly appeared in Q3 shipments.
A polymer-processing recovery could increase segment revenue while reducing percentage margins if the recovering business carries lower profitability than the current mix. This would not necessarily weaken economic value creation if profit dollars and returns improve. Conversely, strong segment margins during a period of weak polymer volumes can partly reflect favorable mix rather than a permanently higher profitability structure.
Biopharma provides a different demand profile from large capital-equipment purchases. The prior call characterized much of Dover’s exposure as consumable components used while installed systems operate, supported by new product introductions. That helps explain why Dover can report healthy demand without requiring a broad recovery in bioprocessing equipment orders. Consumables are not immune to customer inventory adjustments, but the revenue driver is more closely tied to production activity than to new-system installations.
ENGINEERED PRODUCTS: COST CONTROL OFFSETTING DEMAND WEAKNESS
Engineered Products revenue declined 1.7% to $274.9 million, with organic growth of negative 1.6%, compared with positive 2.1% in Q2 and a consensus expectation of positive 2.64%. Revenue missed the dollar estimate by approximately 4.5%, making this the clearest top-line disappointment.
Aerospace and defense demand remained healthy, but lower European vehicle-services volumes more than offset that strength. Segment earnings declined 1.5% to $56.6 million, approximately 6.6% below consensus. Segment earnings margin remained approximately 20.6%, and adjusted EBITDA margin remained approximately 22.6%.
Stable margins demonstrate effective mix management and cost control, not a demand recovery. The segment provides evidence that Dover can defend profitability in weaker markets, but it also limits the interpretation that the entire industrial portfolio is accelerating. Vehicle-services footprint optimization may provide future savings, although the call did not quantify the benefit.
IMAGING & IDENTIFICATION: THE QUARTER’S PROFIT OUTPERFORMER
Imaging & Identification revenue increased 1.9% to $304.7 million, with organic growth of 2.2%, compared with 2.9% in Q2. Revenue was approximately 1.2% below consensus. Despite the modest top-line result, segment earnings increased 16.4% to $95.2 million, approximately 10.4% above consensus.
Adjusted EBITDA margin increased approximately 400 basis points to 32.7%, while segment earnings margin increased approximately 390 basis points to 31.2%. Serialization software, consumables, geographic mix, foreign exchange, and fixed-cost leverage all contributed. The quarter demonstrates the earnings sensitivity available when higher-margin software and consumables grow faster than equipment.
The calculated incremental segment earnings margin exceeded 200%, reflecting the small revenue increase and large profitability improvement. That is not a sustainable conversion rate for additional sales. It indicates that mix, currency, and cost structure were substantially more important than ordinary volume leverage.
Management explicitly redirected attention to the year-to-date result. Tobin stated, “if you look at it on a year-to-date basis, that’s entirely sustainable.” Year-to-date adjusted EBITDA margin was 30.2%, compared with 28.5% a year earlier, while year-to-date segment earnings margin was 28.8%, compared with 27.1%. Those are more defensible normalization anchors than Q3’s peak.
The new Polish plant and the rebuilding of ink production through 2027 provide additional productivity opportunities. However, the near-term earnings implication is balanced: structural profitability has improved, but some of the quarter’s favorable mix and currency effects may not repeat. A 2027 model that simultaneously assumes full CST recovery and perpetuation of Imaging’s Q3 margin would embed favorable assumptions in both major sources of earnings upside.
CASH FLOW AND CAPITAL INTENSITY
Year-to-date free cash flow increased 11.4% to $702.9 million, from $630.8 million. Dover defines free cash flow as operating cash flow less capital expenditures. The improvement therefore reflects actual cash generation after capital investment, rather than an adjusted earnings measure or a definition that adds back growth spending.
Q3 free cash flow was $383.3 million, up only 3.6% from $370.1 million a year earlier. Its margin declined to 17.2% from 17.8%, and conversion of adjusted earnings declined to 98.8% from 102.4%. The sharp sequential acceleration from Q2 is consistent with normal seasonality, but the year-over-year comparison does not support describing Q3 as a major structural improvement in cash conversion.
Year-to-date free cash flow conversion improved to 65.8% of adjusted earnings from 64.3%. Working-capital investment accompanying stronger growth is a reasonable explanation for restrained conversion, but the cash release remains an execution requirement. Orders and backlog do not become distributable cash until production, customer acceptance, and collection occur.
Full-year free cash flow guidance remains 14%-16% of revenue. At the reported revenue guidance range, this implies approximately $1.21-$1.40 billion of annual free cash flow and approximately $509-$695 million in Q4. At the midpoint, Q4 would need to generate approximately $602 million, around 24% above Q4 2025.
The midpoint requirement implies a Q4 free cash flow margin of approximately 27.1%, compared with 23.2% a year earlier. This is achievable in a seasonally strong quarter but is not automatic. The lower end of the annual range requires a more modest improvement over the prior-year Q4 result, while the upper end demands materially stronger working-capital conversion.
Capital expenditure guidance increased from $190-$210 million to $200-$220 million, a $10 million increase at both endpoints. Maintaining free cash flow guidance despite higher planned capital spending is incrementally positive. However, the aggregate spending burden remains moderate: the new range is approximately 2.3%-2.5% of expected revenue.
Year-to-date capital spending of $163.0 million was essentially unchanged from $163.3 million a year earlier, and the new annual midpoint of $210 million remains below 2025 actual spending of $220.3 million. Dover is reallocating investment toward attractive capacity opportunities without yet showing a dramatic increase in consolidated capital intensity. That supports the return profile, provided the new capacity achieves its intended utilization.
CAPITAL ALLOCATION AND ACQUISITIONS
Capital allocation shifted more decisively toward repurchases. Dover repurchased approximately $330 million of shares in Q3, representing approximately 83% of the $400 million year-to-date total. Tobin’s statement that “our bias was still on capital return” indicates that further repurchases are a credible near-term use of liquidity, although no additional amount or execution schedule was committed.
The change relative to July is meaningful. The Q2 call emphasized a greater supply of acquisition opportunities and preserving flexibility to evaluate them. The Q3 call acknowledged that some desired assets sold above Dover’s return thresholds and emphasized capital return instead. This supports the credibility of acquisition discipline, although it also indicates that attractive strategic assets remain expensive.
The value of repurchases depends on the price paid relative to intrinsic value and on the opportunity cost of cash. A lower share count increases EPS mechanically, but deploying cash also reduces interest income or increases financing needs. Share repurchases should therefore not be treated as equivalent to operating profit growth, nor should the entire EPS benefit be capitalized without considering the reduction in financial assets.
The stated more than $3 billion of dry powder represents capital-deployment capacity, not necessarily unrestricted cash on the balance sheet. It supports optionality across organic investment, acquisitions, and shareholder returns, but does not by itself establish a commitment to deploy that amount.
The 2 announced acquisitions involved approximately $80 million of aggregate committed capital according to the call. Cloeren closed in August and adds extrusion dies, feedblocks, and more than 300,000 square feet of US manufacturing capacity to the MAAG platform. Leistung was signed in August and remained expected to close in Q4, adding cryogenic-valve capabilities and an Indian manufacturing hub.
Leistung’s pending status matters: it should not be treated as contributing to Q3 results. Its transaction announcement also confirms that individual financial terms were not disclosed. Neither acquisition provides enough public information to independently calculate transaction multiples, stand-alone returns, or quantified EPS accretion.
The strategic rationale extends beyond acquired revenue. Dover expects other operating businesses to use excess manufacturing capacity in both locations. This creates potential capital efficiency and geographic flexibility, but it also requires successful integration, product qualification, and production transfer. Excess floor space is an option to create future capacity, not immediate productive output.
ILLUSTRATIVE 2027 EARNINGS FRAMEWORK
An illustrative scenario framework demonstrates the scale of the opportunity without presenting it as company guidance or consensus. The common assumptions are approximately $8.7 billion of 2026 revenue, the current adjusted EPS midpoint of $10.675, approximately 135 million diluted shares, and a 21% tax rate. Revenue-growth assumptions are total growth assumptions with no material net acquisition or currency contribution. Cost recovery is modeled separately from conversion on incremental revenue and requires confirmation that the amounts do not overlap other savings.
A base case with a 55% probability assumes 6% revenue growth, 30% incremental operating conversion on additional sales, $40 million of nonoverlapping operating cost recovery, and approximately $0.10 of net EPS benefit from capital allocation after financing effects. This produces approximately $11.9 of adjusted EPS, or roughly 12% growth. It requires successful capacity commissioning, substantially better food-retail execution, and sustained demand, but does not require a broad industrial rebound.
A bull case with a 25% probability assumes 9% revenue growth, 35% incremental conversion, $55 million of operating cost recovery, and approximately $0.15 of net capital-allocation benefit. This produces approximately $12.8 of adjusted EPS, or roughly 20% growth. The necessary conditions include strong capacity utilization, successful conversion of the 2027 backlog, sustained heat-exchanger economics, and limited offset from less favorable mix elsewhere.
A bear case with a 20% probability assumes a 2% revenue decline, 35% decremental conversion, only $10 million of cost recovery, and no net capital-allocation benefit. This produces approximately $10.4 of adjusted EPS, modestly below the 2026 midpoint. Potential causes include order deferrals, normalization of advance ordering, continuing refrigeration inefficiencies, and weaker short-cycle demand. This is not a severe recession scenario; a larger demand contraction could produce materially worse results.
The probability-weighted outcome is approximately $11.8, around 11% above the 2026 midpoint. The probabilities are judgmental rather than statistically estimated. The framework demonstrates that a credible double-digit earnings-growth case exists, but also that it depends on multiple operating assumptions rather than on backlog growth alone.
The most important sensitivity is conversion. The current quarter’s approximately 27% incremental adjusted segment EBITDA margin is below the stronger conversion embedded in the bull case. Moreover, higher depreciation from new facilities can cause EBIT conversion to lag EBITDA conversion. Capacity additions create the opportunity for better returns; they do not guarantee that the opportunity will be realized.
INVESTMENT IMPLICATIONS, CATALYSTS, AND RISK PARAMETERS
The quarter strengthens the case for Dover as an industrial business with improving growth exposure and identifiable self-help opportunities. It does not establish that the entire portfolio has become structurally high growth. Secular markets represent more than 25% of revenue, compared with 18% in 2024, but the majority of revenue still comes from other applications. Revaluing the entire company as a concentrated AI-infrastructure supplier would overstate the exposure.
The most credible source of earnings upside is the conversion of already visible demand through a more efficient manufacturing footprint. This is a more testable thesis than assuming an unspecified macroeconomic recovery. The relevant evidence includes plant commissioning, line-rate improvement, removal of redundant costs, backlog shipment schedules, and cash collection.
The catalyst sequence is clear. Q4 results should demonstrate further refrigeration output improvement and the seasonal cash release. January guidance should quantify 2027 restructuring carryover, acquisition contributions, and share-count assumptions. Q1 2027 should provide the first explicit test of management’s CST margin commitment and the contribution from new cryogenic and other capacity. Subsequent 2027 quarters should establish whether incremental production is being absorbed without sacrificing pricing or utilization.
Valuation remains essential. At illustrative 2027 EPS of $11.9, forward multiples of 18x, 20x, and 22x correspond to approximately $214, $238, and $262 per share. These are valuation sensitivities, not established fair values or price targets. A verified contemporaneous share price was unavailable, so a current expected stock return or claim of undervaluation cannot be substantiated. Even 10% EPS growth combined with 10% multiple compression would leave the share price approximately unchanged.
The fundamental conclusion is therefore positive, while the case for additional investment remains price-dependent. Existing exposure has a stronger operating basis than before the call, but new capital should not be committed solely because backlog increased 35%. The purchase decision requires a sufficient margin of safety against both execution disappointment and valuation compression.
For a portfolio already concentrated in AI infrastructure, electrification, and power-generation investment, Dover would add overlapping capital-spending exposure despite its industrial classification. Consumables, biopharma components, retail fueling, and aftermarket applications provide diversification, but their buffering effect should not be assumed to eliminate the shared cycle. The marginal portfolio exposure is increasingly to infrastructure investment and manufacturing execution, not merely to generic industrial activity.
A conditional risk framework would limit an initial position to approximately 1% of NAV, with a maximum of 2% before Q1 execution is demonstrated. A 12% price-based stop or mandatory reduction threshold would imply approximately 12 basis points of NAV risk at the initial size and 24 basis points at the maximum, excluding gaps and slippage. Such a position would require a valuation-qualified entry; these limits do not establish that the current price is attractive.
Fundamental exit criteria should include failure to improve CST margins against the Q1 comparison, persistence of substantial transition costs beyond the stated normalization period, material order cancellations or shipment deferrals, deterioration in working capital despite capacity availability, or acquisition spending that departs from stated return discipline. The appropriate initial holding horizon is 6-12 months, aligned with the disclosed operating milestones rather than an indefinite secular-growth narrative.
The decisive issue is whether the favorable order book becomes higher earnings and cash flow without requiring repeated extensions of the recovery timetable. Q3 improved confidence in demand and shipment opportunity. It did not yet resolve that conversion question.
SOURCE AND INTERPRETATION NOTES
Financial results, accounting definitions, historical comparisons, and guidance changes are based on Dover’s 10/22/26 and 07/23/26 earnings releases and investor supplements. Consensus comparisons use the supplied Bloomberg earnings notice. Management commentary uses the supplied Q3 transcript and the prior-quarter call transcript. The presentation PDF could not be independently read, so slide-only growth figures and the garbled data-center growth reference in the Q&A are not treated as verified numerical disclosures. Scenario probabilities, earnings sensitivities, valuation multiples, and portfolio limits are analytical assumptions rather than management forecasts.
COMPANY EMPLOYEES ON THE CALL
• Richard J. Tobin, Chairman, President and Chief Executive Officer. • Christopher B. Woenker, Senior Vice President and Chief Financial Officer. • Jack Dickens, Vice President, Investor Relations.
RESEARCH ANALYSTS AND AFFILIATIONS
• Steve Tusa, Wells Fargo. • Nigel Coe, Wolfe Research. • Mike Halloran, Baird. • Joe O’Dea, Vertical Research. • Scott Davis, Melius Research. • Andy Kaplowitz, Citigroup. • Brett Linzey, Mizuho. Called by the operator; no audible question was delivered. • Amit Mehrotra, UBS. • David Ridley-Lane, Bank of America, participating on behalf of Andrew Obin. • Joe Ritchie, Goldman Sachs. • Andrew Buscaglia, BNP Paribas. • Brandon Newsom, Morgan Stanley. Name rendered phonetically in the operator introduction; the transcript labels the speaker unidentified, and technical difficulties prevented completion of the question.
Key Read-Throughs
KEY READ-THROUGHS FROM DOVER’S Q3 2026 EARNINGS CALL
Dover’s October 22 earnings call supports selective exposure to infrastructure investment and recurring bioprocessing demand, not a broad industrial recovery. The strongest incremental positive is the extension of the North American fueling-equipment replacement cycle. Liquid-cooling demand is also broadening geographically, supporting thermal-management suppliers beyond the initial US investment wave. The clearest negative implications are longer-duration substitution pressure on fluorochemical refrigerants from expanding CO2 refrigeration deployment and continued weakness in European vehicle-service equipment. Dover’s 16% order growth and 35% backlog increase reinforce demand visibility, but management attributed much of the backlog build to capacity constraints and customers reserving production slots. Strong orders therefore should not be confused with immediate revenue or cash conversion. The following assessments distinguish business-level materiality from consolidated impact and fresh information from confirmation of peers’ existing disclosures. Countries denote corporate domicile.
RETAIL FUELING EQUIPMENT: SUPPLY CONSTRAINTS EXTEND THE REPLACEMENT CYCLE AND REDUCE EARNINGS CLIFF RISK (READ-THROUGH 1)
Affected companies: Vontier Corporation (VNT: United States) and Franklin Electric Co., Inc. (FELE: United States). Direction: positive. Magnitude: meaningful for their fueling businesses and moderate at the consolidated level, with disproportionately important profit exposure at Franklin Electric.
Call evidence: Dover reported 12.1% organic growth in Clean Energy & Fueling and described North American retail fueling as having “posted its strongest quarter in years.” Discussing the previously identified 3-year replacement cycle, Richard Tobin stated, “We now believe that is going to extend.” Management linked that extension partly to constrained underground tank availability and disclosed greenfield expansion in below-ground fueling equipment.
The principal implication is a longer earnings runway, not simply a stronger next quarter. Vontier participates through Gilbarco Veeder-Root’s dispensing, tank-monitoring and associated fueling infrastructure. Franklin Electric participates through Franklin Fueling Systems’ underground fuel-transfer, piping, containment and monitoring equipment. Tank replacement and compliance projects require associated equipment, creating demand beyond the tank itself. Dover explicitly said it does not manufacture the constrained tanks, making the distinction between tank availability and associated equipment demand important.
Vontier’s Environmental & Fueling Solutions segment represented approximately 48% of Q2 sales, although only a portion directly addresses this replacement cycle. Franklin Electric’s Energy Systems segment represented approximately 13% of Q2 sales but approximately 28% of combined operating-segment adjusted profit before corporate costs. Consequently, sustained fueling demand has greater earnings significance for Franklin Electric than its revenue exposure alone suggests.
The less obvious positive is reduced risk of a sharp post-cycle decline. If constrained installations spread replacement spending over a longer period, suppliers can maintain utilization and earnings for longer than a fixed-duration cycle model assumes. The accompanying negative is timing: unavailable tanks can postpone installation and recognition of associated equipment revenue. Vontier’s Q2 commentary already described healthy convenience-retail demand alongside shipment-timing headwinds.
Near-term catalysts: Franklin Electric’s October 28 results and Vontier’s November 5 results. The relevant tests are North American orders, underground-equipment shipments, project scheduling and whether either company extends its own cycle assumptions.
Longer-duration implication: stronger support for 2027 earnings durability and a lower probability of an abrupt replacement-cycle downturn. The conclusion would weaken if projects were being cancelled rather than delayed, or if OEM shipments were materially outpacing completed installations and building channel inventories.
DATA-CENTER THERMAL MANAGEMENT: INTERNATIONAL LIQUID-COOLING DEMAND BROADENS, BUT COMPONENT AND SYSTEM ECONOMICS DIFFER (READ-THROUGH 2)
Affected companies: Alfa Laval AB (ALFA: Sweden) and Vertiv Holdings Co. (VRT: United States). Direction: positive. Magnitude: meaningful for exposed thermal-management businesses and moderate at the consolidated level; stronger evidence of demand durability than of an immediate earnings surprise.
Call evidence: Dover described robust brazed-plate heat-exchanger shipments and orders across geographies and major end markets. Liquid-cooling demand was initially concentrated in the US, but management said, “We are now seeing meaningful acceleration in Europe and Asia.” Lead times remained extended, and Dover was investing “to double our global capacity for large heat exchangers through 2027.”
Alfa Laval has direct product overlap through heat-exchange equipment used in data-center cooling. Higher rack densities and greater liquid-cooling adoption increase demand for transferring heat between server, cooling-system and facility circuits. Vertiv participates further downstream through integrated thermal-management equipment and coolant distribution units. Its CoolChip CDU portfolio supports direct-to-chip and rear-door cooling through liquid-to-liquid or liquid-to-air architectures.
The incremental signal is geographical breadth. Europe and Asia create additional demand sources beyond the initial US deployment wave, supporting a longer and less geographically concentrated equipment cycle. This does not establish a recovery across European industrial demand generally. Nor does Dover identify Alfa Laval or Vertiv as customers, allocate its awards to either company, or demonstrate competitor market-share gains.
The economics differ along the supply chain. Dover said direct labor represented less than 10% of its heat-exchanger cost base and that incremental volume converted exceptionally well. This supports operating leverage in its particular component business. It does not establish equivalent incremental margins for Alfa Laval’s broader portfolio or Vertiv’s systems operations. Extended component lead times can support supplier utilization while delaying downstream system completion, customer acceptance and cash collection.
Expectations also matter. Alfa Laval had already reported 35% Q2 order growth, while Vertiv had reported 24% Q2 sales growth and raised guidance. Dover’s evidence therefore reinforces an established growth trajectory rather than independently proving further upside to estimates. The capacity-doubling disclosure applies specifically to Dover’s large heat exchangers, not all SWEP capacity or total data-center revenue.
Near-term catalysts: Alfa Laval’s October 27 results and Vertiv’s October 28 results. Regional cooling orders, available capacity and shipment conversion are more informative than another broad affirmation of AI demand.
Longer-duration implication: expanding international demand supports thermal-management growth through 2027. The principal risk is that capacity reservations and early ordering exaggerate sustainable consumption, particularly as competing suppliers bring capacity online.
COMMERCIAL REFRIGERATION: BETTER CO2 EQUIPMENT AVAILABILITY CHALLENGES THE FLUOROCHEMICAL REFRIGERANT OPPORTUNITY (READ-THROUGH 3)
Affected company: Solstice Advanced Materials (SOLS: United States). Direction: negative for fluorochemical refrigerants serving the affected food-retail applications. Magnitude: potentially meaningful within that niche over several years, but limited and unquantifiable at the consolidated level from Dover’s disclosure alone.
Call evidence: Dover reported record quarterly CO2 refrigeration-system revenue, with September reaching its highest output of the year. Separately, refrigerated door-case production improved, with Q3 exit line rates 15% above the Q2 exit rate. These are distinct measures: the door-case improvement is not evidence of a 15% increase in CO2 system capacity.
The transmission mechanism is technology substitution. Manufacturing constraints have limited the availability of equipment required for CO2 installations. As those constraints ease, retailers have greater practical ability to select CO2 rather than fluorochemical refrigerants for suitable new or replacement systems. Solstice participates in supermarket refrigeration through fluorochemical blends including Solstice N40. A store choosing a CO2 architecture eliminates the initial fluorochemical refrigerant charge for that installation and the subsequent fluorochemical servicing demand associated with it.
This is a consequential divergence within the environmental transition. Regulation and equipment replacement can stimulate refrigeration investment without ensuring that fluorochemical suppliers capture the spending. The refrigeration OEM can benefit from replacement activity while the refrigerant producer loses addressable demand in applications migrating to CO2.
The consolidated impact must remain bounded. Solstice reported Q2 refrigerant sales of $473 million, approximately 41% of group revenue, but supermarket applications comprise an undisclosed subset. Existing fluorochemical systems continue to require servicing, and retrofit economics differ from those of new installations. Solstice’s Q2 refrigerant revenue grew 13%, demonstrating that structural substitution can coexist with strong current demand and pricing. Dover’s call does not establish an imminent Solstice revenue decline, customer loss or pricing deterioration.
Near-term catalyst: Solstice’s November 4 results, particularly refrigerant volumes, pricing and application mix. The call is more relevant to assessing long-term market assumptions than predicting a quarterly miss.
Longer-duration implication: a growing CO2 installed base can reduce the future fluorochemical aftermarket opportunity. Faster equipment availability and deployment strengthen that risk. Installation costs, service capabilities and the continued attractiveness of fluorochemical retrofits constrain its pace. The high-conviction conclusion is substitution pressure in a specific application, not a broad bearish call on all refrigerants.
BIOPROCESSING: COMPONENT DEMAND SUPPORTS CONSUMABLES RECOVERY MORE CLEARLY THAN A CAPITAL-EQUIPMENT BOOM (READ-THROUGH 4)
Affected companies: Repligen Corporation (RGEN: United States) and Sartorius AG, preference shares (SRT3: Germany). Direction: positive. Magnitude: meaningful exposure for both companies, but moderate incremental information because their own disclosures already showed improving demand.
Call evidence: Dover identified single-use biopharma as a growth contributor within Pumps & Process Solutions and disclosed greenfield expansion in “single-use biopharma components in Asia.” The segment’s aggregate 1.2% organic growth understated the strength of selected businesses because lower polymer-processing equipment volumes offset growth elsewhere.
The transmission mechanism is recurring consumption associated with biologic manufacturing. Additional production runs require fluid-handling components, filtration products and other consumables. Repligen’s filtration, fluid-management and chromatography businesses and Sartorius’s Bioprocess Solutions operations participate in these workflows. Rising demand for components is therefore relevant evidence of manufacturing activity, although it cannot establish the growth rate of every product category or identify the customers behind Dover’s orders.
The Asian capacity investment adds a longer-duration signal. Committing manufacturing resources is more substantive than describing a favorable shipment quarter and supports confidence in regional demand and local supply requirements. It does not prove a China-specific recovery or a direct supplier relationship between Dover and either named peer.
The distinction between consumables and capital equipment is important. Consumables demand can improve as existing facilities run more production without requiring customers to launch a large new capacity-expansion cycle. Dover’s commentary supports that recurring activity more directly than it supports a broad surge in major bioprocessing equipment orders.
Repligen had already reported 13% Q2 organic growth and raised full-year organic-growth guidance to 10.5%–13.5%. Sartorius’s October 22 nine-month release had already identified recurring consumables as an important growth driver, alongside recovering equipment demand. Dover corroborates these trends rather than predicts Sartorius’s already-reported results.
Near-term catalyst: Repligen’s October 27 results, particularly order momentum, consumables growth and customer inventory commentary. For Sartorius, the immediate implication is confirmation of its disclosed trajectory rather than a new Q3 catalyst.
Longer-duration implication: sustained biologic production and regional manufacturing investment support recurring demand into 2027. The principal invalidation would be evidence that recent growth primarily reflects inventory replenishment without corresponding improvement in underlying production activity.
LNG AND CRYOGENIC INFRASTRUCTURE: COMPONENT DEMAND VALIDATES PROJECT EXECUTION, NOT AUTOMATICALLY NEW ORDERS (READ-THROUGH 5)
Affected company: Baker Hughes Company (BKR: United States), including its acquired Chart Industries operations. Direction: positive. Magnitude: moderate for relevant LNG and cryogenic equipment franchises, smaller at the consolidated level and primarily confirmatory.
Call evidence: Dover stated, “Demand for our cryogenic components in LNG and space launch infrastructure remains healthy, with several recent high-profile project wins.” Management also said demand was running ahead of capacity and that additional output would become available in Q1 2027.
Baker Hughes is the relevant listed exposure following completion of its Chart Industries acquisition on July 16, 2026. Chart adds cryogenic and thermal-management equipment used in handling and processing gases at low temperatures. Dover’s component-level demand supports the underlying investment environment for these activities and the value of qualified manufacturing capacity.
The critical analytical distinction is project stage. Cryogenic component procurement can occur after major equipment packages have already been awarded. Strong Dover orders may therefore corroborate execution of existing industry backlog without predicting new Baker Hughes awards. Dover’s unnamed project wins cannot be assigned to Chart, and its space-launch exposure should not be transferred wholesale to Baker Hughes’s LNG business.
Baker Hughes had already reported Q2 Industrial & Energy Technology orders of $7.1 billion and remaining performance obligations of $37.1 billion. Against this existing backlog, Dover provides additional evidence that investment is progressing into physical equipment requirements. It does not establish a new order-cycle acceleration.
The negative qualification is conversion economics. Dover’s fueling-segment margin was roughly flat despite strong volume, partly because production ramps absorbed operating leverage. This demonstrates why healthy cryogenic demand can coexist with near-term execution costs and delayed cash realization. The mechanism is relevant to evaluating capacity expansion and integration, although Dover’s margin outcome cannot be directly applied to Baker Hughes.
Near-term catalysts: Baker Hughes’s October 27 release and October 28 conference call, particularly Chart integration, delivery schedules and backlog conversion.
Longer-duration implication: sustained LNG and gas-infrastructure investment supports utilization and, subsequently, installed-base service opportunities. The principal risk is that shortages and ramp costs delay earnings and cash conversion despite strong reported demand.
EUROPEAN VEHICLE-SERVICE EQUIPMENT: RESILIENT REPAIR ACTIVITY DOES NOT GUARANTEE GARAGE CAPITAL SPENDING (READ-THROUGH 6)
Affected company: Snap-on Incorporated (SNA: United States). Direction: negative for exposed European vehicle-service equipment operations. Magnitude: moderate within the affected equipment businesses, limited at the consolidated level; corroboration rather than a fresh Q3 earnings warning.
Call evidence: Dover said strong aerospace and defense demand was “more than offset by lower volumes in European vehicle services.” Engineered Products organic revenue declined 1.6%. This identifies a specific area of weakness despite strength in several infrastructure-related markets.
The direct overlap is with Snap-on’s workshop equipment, including alignment and tire-service products, rather than its entire hand-tool franchise. Garages and dealerships can postpone larger equipment purchases when profitability, financing conditions or business confidence deteriorate. Repair volumes can remain stable while workshops extend equipment replacement intervals. Consequently, an aging vehicle fleet or resilient repair activity is not sufficient evidence of an imminent capital-equipment recovery.
Snap-on had already reported Q3 results on October 22, including a 5.5% organic decline in Repair Systems & Information, primarily associated with reduced OEM dealership activity. Dover’s European weakness is consistent with a difficult equipment-spending environment, but does not establish that Europe caused Snap-on’s decline. Snap-on separately attributed Tools Group pressure to franchisee inventory reductions associated with higher diesel prices while describing technician demand as stable. These are distinct mechanisms.
The actionable implication is a higher burden of proof for a rapid recovery in Q4 and 2027 equipment assumptions. Weak workshop investment can persist even if repair demand remains healthy and channel inventories normalize. Conversely, Snap-on’s strength in critical industries and its more recurring repair-information activities limit the case for extending this negative signal across the entire company.
Near-term catalyst: none from an unreported Q3 release, since Snap-on has already reported. Subsequent disclosures on European equipment orders, dealership activity and capital-equipment mix are the relevant tests.
Longer-duration implication: persistently weak garage investment would constrain equipment growth and operating leverage. This remains a narrow capital-spending concern, not evidence of a broad collapse in automotive aftermarket demand.
The cross-portfolio conclusion is selective rather than uniformly cyclical. Fueling, thermal management and cryogenic infrastructure benefit from different end markets but share capacity, installation and backlog-conversion risks. Bioprocessing provides a more distinct recurring-production driver. Refrigeration creates a genuine divergence between equipment beneficiaries and refrigerant suppliers, while European workshop equipment remains exposed to discretionary investment decisions. Dover’s strongest businesses should therefore not be used as evidence that industrial demand has recovered indiscriminately.
Report record
- Sector
- Industrials
- Industry
- Specialty Industrial Machinery
- Fiscal period end
- September 30, 2026
- Report date
- October 22, 2026
- Analysis
- 6169 words
- Read-throughs
- 2452 words
- Content fingerprint (PDF)
b3aa28b3dfd3- Content fingerprint (analysis)
dd1aa4a7f445- Content fingerprint (read-throughs)
39c25614e651
Prepared from the company's earnings release and earnings call transcript. Figures as reported by the company. For information only. Not investment advice.
More from Dover Corp
No other reports yet.
More in Industrials
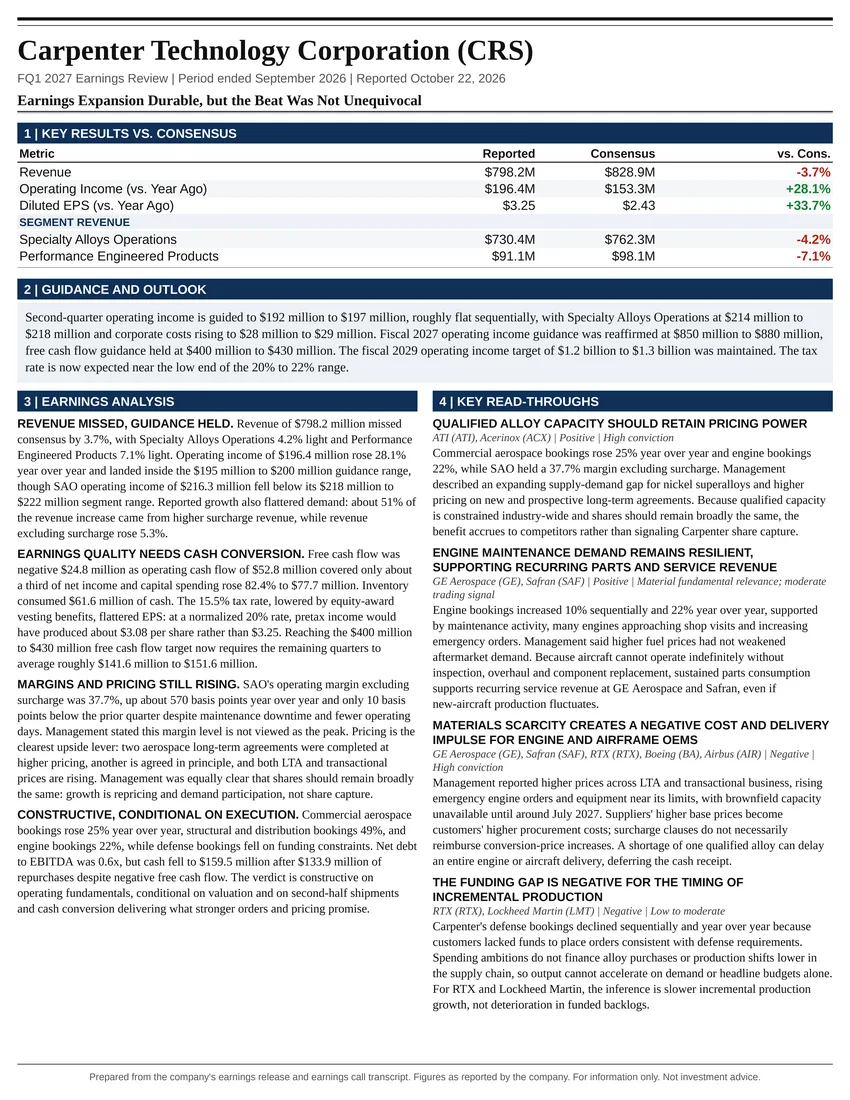
Earnings Expansion Durable, but the Beat Was Not Unequivocal
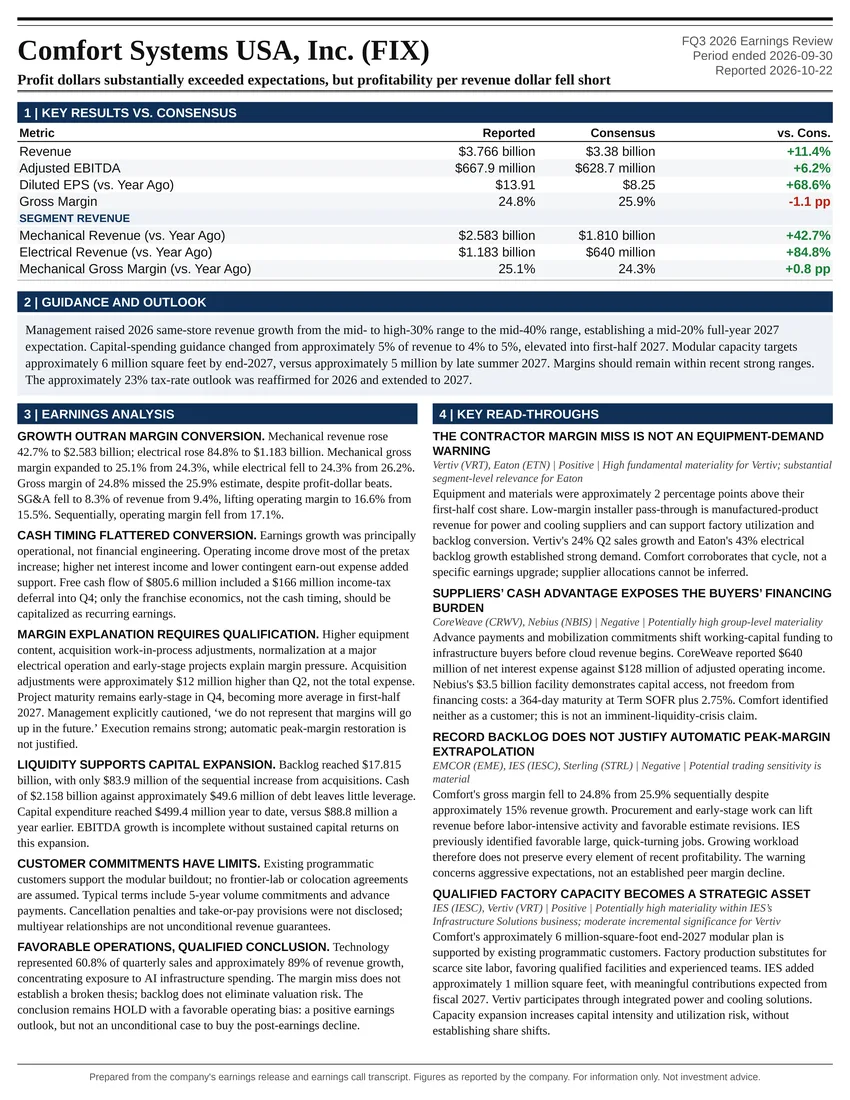
Profit dollars substantially exceeded expectations, but profitability per revenue dollar fell short
Follow @AtlasPeakRes on X for new earnings reports as they publish.