Earnings Expansion Durable, but the Beat Was Not Unequivocal
Earnings Reports
Bloom Energy Corporation FQ3 2026 Earnings Report
Bloom Energy Corporation (BE) FQ3 2026 earnings: A Larger and More Profitable Equipment Franchise, Not Yet a Cash-Generative Platform. Full earnings analysis, key read-throughs, and the one-page exhibit from Atlas Peak Research.
Bloom Energy Corporation (BE)
Sector: Industrials · FQ3 2026 · Period end September 30, 2026 · Reported October 22, 2026
Bloom Energy’s Q3 2026 results materially strengthened the earnings case for its onsite power platform, but did not resolve the more demanding questions around cash conversion, sustainable returns on expansion capital, and valuation.
Download the one-page report (PDF)
View one-page exhibit
Download analysis (.md)
Download read-throughs (.md)
Post to X
One-Page Exhibit
Earnings Analysis
EXECUTIVE CALL SUMMARY: Bloom Energy Corporation (10/22/26)
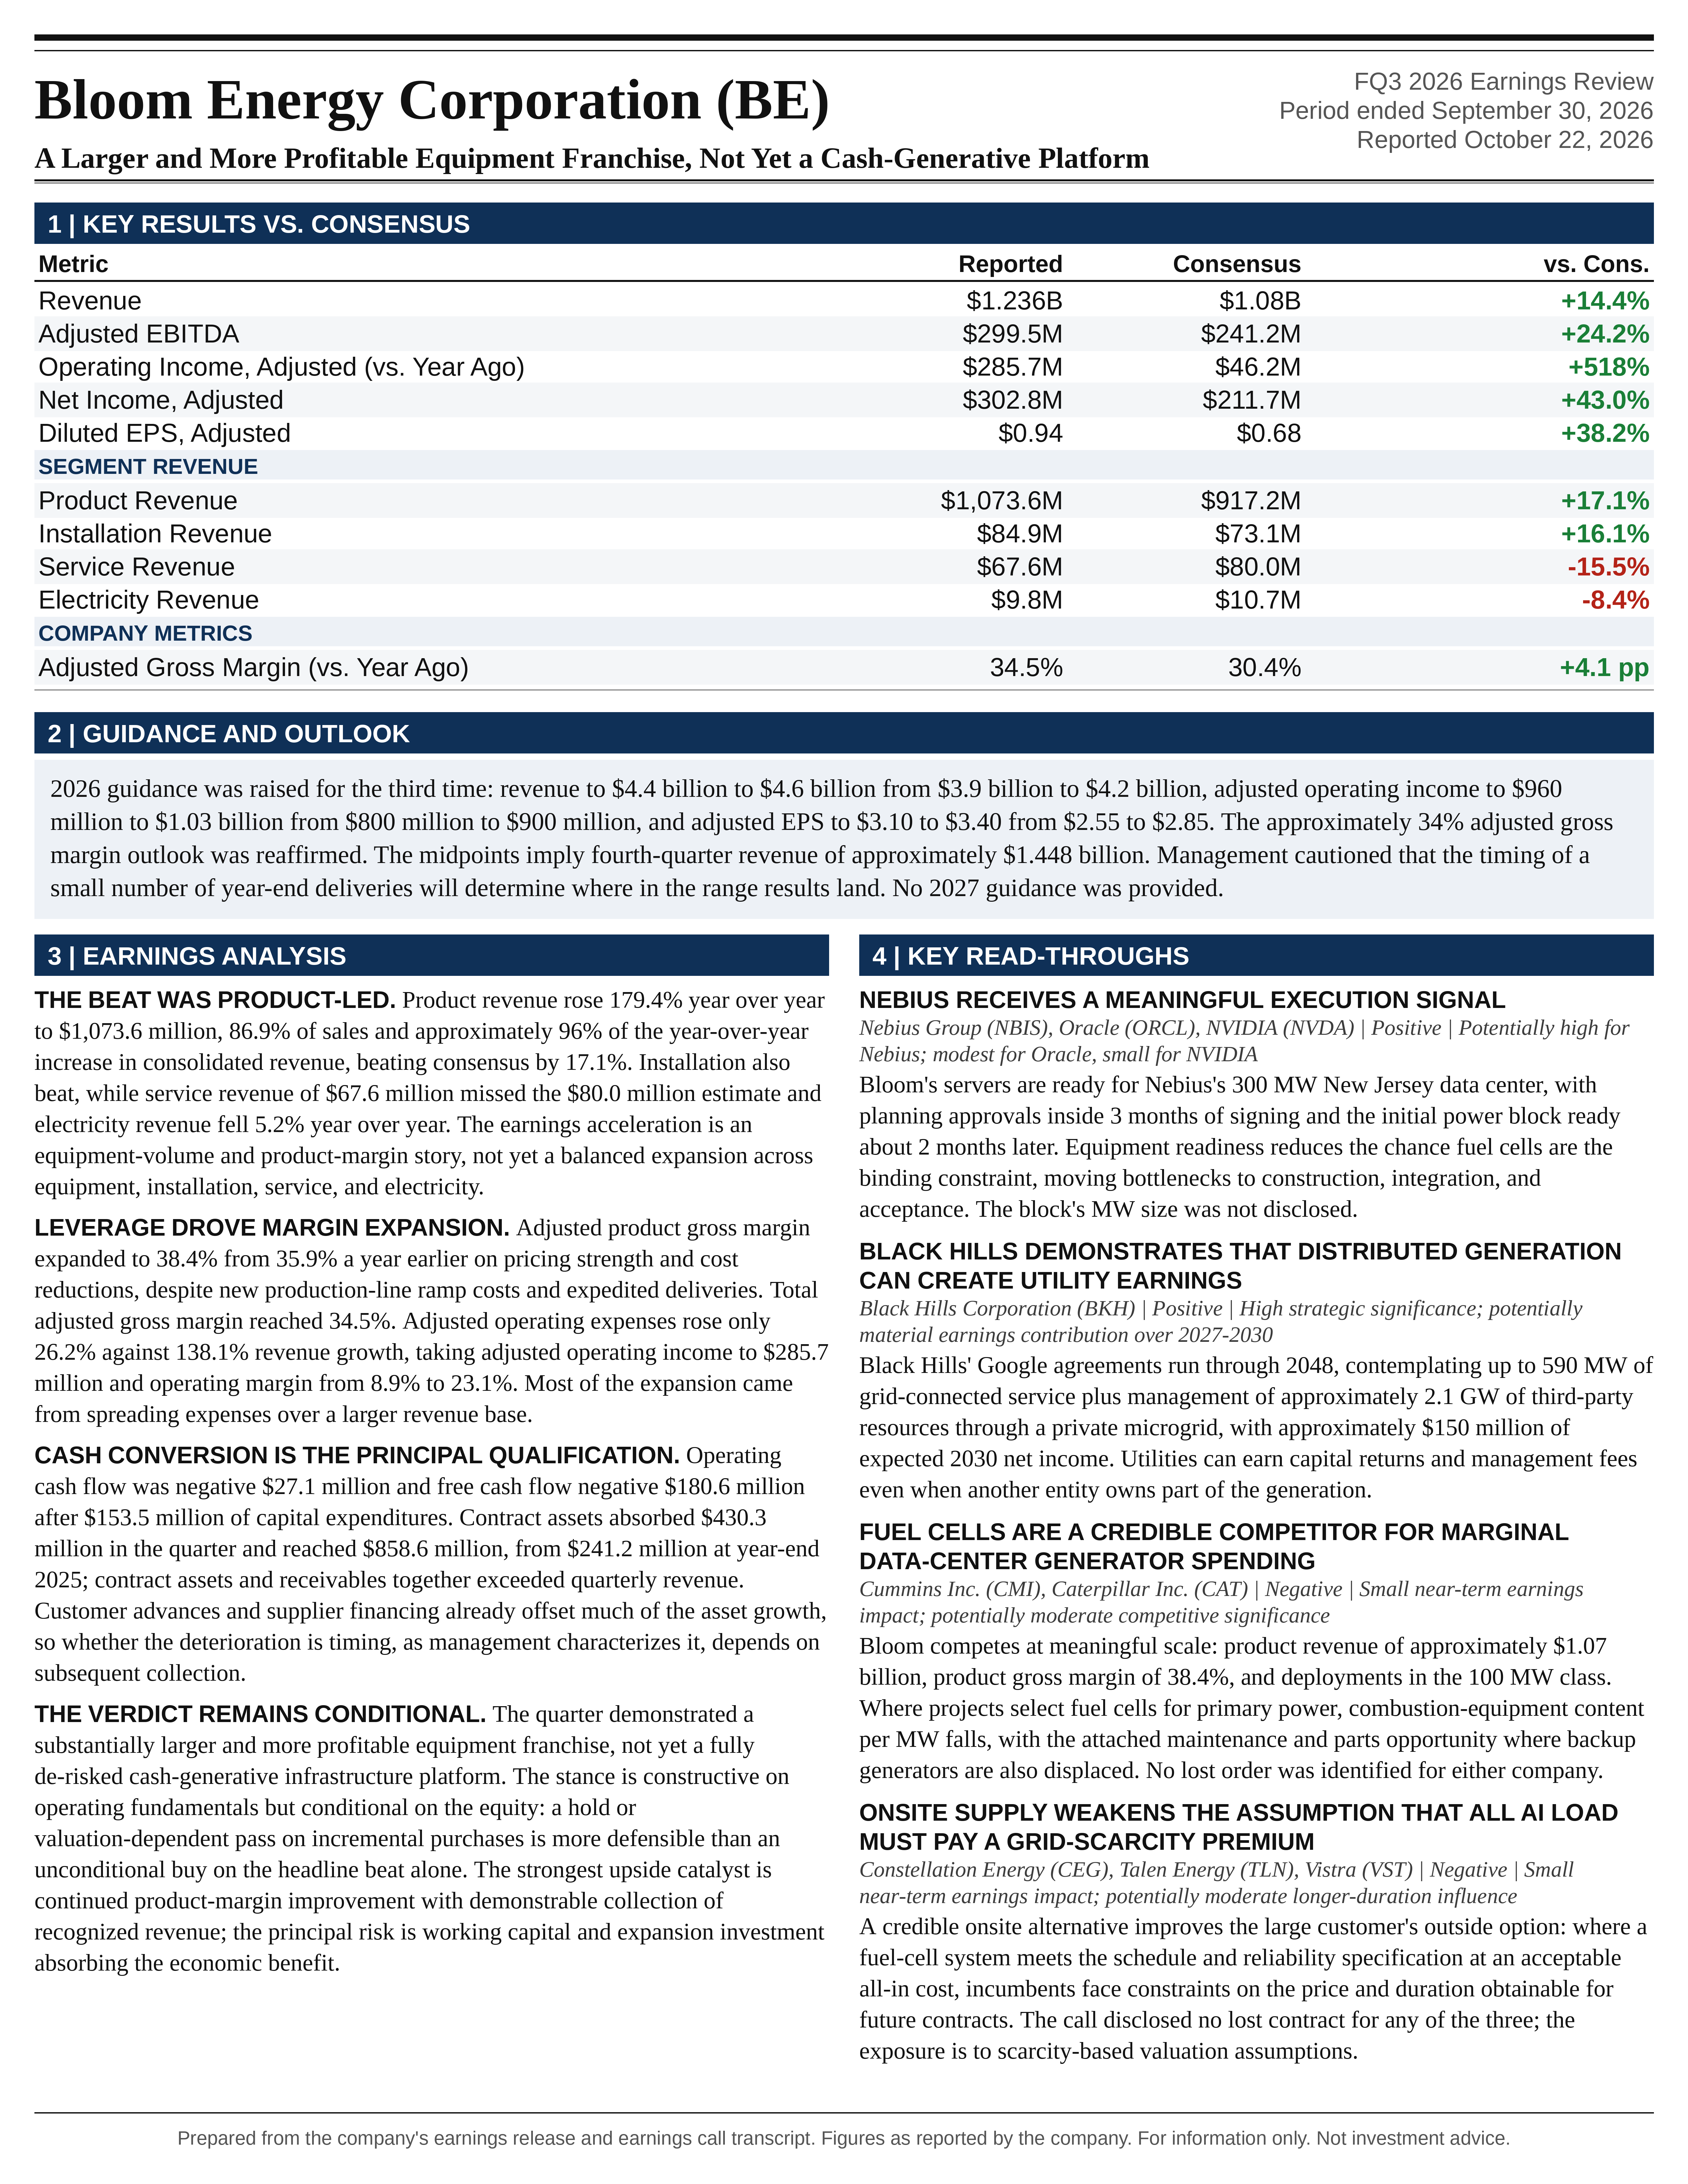
Bloom Energy’s Q3 2026 results materially strengthened the earnings case for its onsite power platform, but did not resolve the more demanding questions around cash conversion, sustainable returns on expansion capital, and valuation. Revenue of $1.236 billion exceeded Bloomberg consensus by 14.4%, adjusted diluted EPS of $0.94 exceeded consensus by 38.2%, and adjusted operating income increased 518% year over year to $285.7 million. The revised 2026 revenue midpoint increased 11.1% to $4.5 billion, while the adjusted operating income midpoint increased 17.1% to $995 million. These changes reflect substantial operating leverage rather than merely higher sales. However, operating cash flow deteriorated to negative $27.1 million, quarterly free cash flow was negative $180.6 million, and contract assets increased sharply. The quarter therefore supports higher earnings estimates more decisively than it supports a higher valuation multiple.
The most important positive development was the combination of sustained product demand and improving manufacturing economics. Product revenue increased 179.4% year over year to $1.074 billion, while adjusted product gross margin expanded to 38.4%. This occurred despite new production-line ramp costs and expedited deliveries. The most important qualification was the growing separation between revenue recognition and cash realization. Management characterized that separation as timing-related, but the financial statements show that substantial customer advances and supplier financing were already offsetting substantial asset growth. Evidence of subsequent collection is needed to establish that the cash deterioration is temporary.
The revised outlook also contains more Q4 strength than the unchanged approximately 34% annual gross margin target initially suggests. Using reported quarterly results, the $4.5 billion revenue midpoint implies Q4 revenue of approximately $1.448 billion, up 17.1% sequentially and 86.2% year over year. The $995 million adjusted operating income midpoint implies approximately $340 million of Q4 operating income and a 23.5% operating margin. Applying the approximately 34% annual gross margin target mechanically implies a Q4 gross margin near 34.7%, slightly above Q3. Maintaining annual gross margin guidance is therefore not equivalent to forecasting a sequential margin decline.
Strategically, the call broadened the investment narrative from rapid deployment for AI data centers toward a more diversified distributed-generation platform. Utility procurement, military installations, international markets, carbon capture, combined heat and power, and 800 V DC architecture could extend the growth runway. Their evidentiary maturity differs substantially. The AEP and Google project is a significant commercial validation, but AEP’s separate announcement describes a 702 MW facility expected to become fully operational by the end of 2028, with plans to integrate carbon capture. It is not evidence that a fully integrated 700 MW carbon-capture system is operating today. Similarly, preparation for manufacturing capacity beyond 5 GW is not guidance for 10 GW of installed capacity or a commitment to a specific expansion timetable.
The appropriate earnings-event stance is constructive on operating fundamentals but conditional on the equity. A hold or valuation-dependent pass on incremental purchases is more defensible than an unconditional buy based solely on the headline beat. The strongest prospective upside catalyst is the combination of continued product-margin improvement and demonstrable collection of recognized revenue. The principal downside risk is that accounting earnings continue to grow while working capital, customer incentives, manufacturing investment, and deployment obligations absorb an increasingly large share of the economic benefit.
OBSERVATION: QUARTERLY PERFORMANCE AND THE QUALITY OF THE BEAT
Unless otherwise specified, adjusted measures refer to Bloom’s non-GAAP disclosures. Consensus comparisons use the Bloomberg earnings notice accompanying the call. Historical comparisons incorporate Bloom’s October 22 results release, February 5 annual results release, April 28 results release, and July 28 supplemental financial information.
Revenue of $1,235.8 million increased from $519.0 million in Q3 2025 and $1,065.4 million in Q2 2026. The resulting growth rates were 138.1% year over year and 16.0% sequentially. Year-to-date revenue reached $3,052.3 million, already 50.8% above total 2025 revenue of $2,024.0 million. The absolute scale of the business has therefore changed materially within a short period. Q3 revenue alone represented approximately 61% of the preceding year’s revenue.
The revenue beat was concentrated in hardware. Product revenue of $1,073.6 million exceeded consensus of $917.2 million by $156.4 million, or 17.1%. Installation revenue of $84.9 million exceeded consensus by $11.8 million, or 16.1%. Those positive variances were partly offset by service revenue of $67.6 million, which missed the $80.0 million estimate by 15.6%, and electricity revenue of $9.8 million, which missed by 8.3%. Differences between the sum of segment estimates and the rounded consolidated estimate are immaterial.
Product revenue accounted for 86.9% of sales and approximately 96% of the year-over-year increase in consolidated revenue. The earnings acceleration is consequently best understood as an equipment-volume and product-margin story. It is not yet a broadly balanced expansion across equipment, installation, recurring service, and electricity sales. That distinction matters because equipment deliveries are generally more sensitive to project readiness, customer acceptance, financing, and milestone timing than a mature recurring-service business.
Management stated, “Product revenue is recognized when control transfers to the customer, so it is the direct measure of systems delivered and accepted in the quarter.” This is stronger evidence than an increase in nonbinding project announcements or pipeline estimates. Nevertheless, control transfer is not identical to customer energization, utilization, or cash collection. Product revenue growth also cannot be translated directly into megawatt shipment growth because the call did not disclose realized revenue per MW, equipment configuration, or a price-volume bridge.
The comparison with Q2 requires nuance. Revenue growth moderated from 165.5% year over year in Q2 to 138.1% in Q3, while product growth moderated from 215.4% to 179.4%. These lower percentage growth rates coexist with substantial sequential dollar growth and should not automatically be interpreted as weakening demand. The comparable-period revenue base is increasing. Conversely, the persistence of triple-digit growth does not establish that the same percentage expansion can continue through 2027.
Adjusted EBITDA of $299.5 million exceeded consensus of $241.2 million by 24.2%. Adjusted net income of $302.8 million exceeded consensus of $211.7 million by 43.0%. Adjusted diluted EPS increased from $0.15 to $0.94, while GAAP diluted EPS improved from a loss of $0.10 to earnings of $0.78. The GAAP EPS result exceeded the $0.53 estimate by 47.2%. Profitability therefore improved on both accounting bases, although the sustainability of EPS requires separate consideration of share-based compensation, financing income, and taxes.
OBSERVATION: PRODUCT ECONOMICS AND OPERATING LEVERAGE
Adjusted product gross margin increased to 38.4%, compared with 35.9% in Q3 2025 and 37.2% in Q2 2026. Product gross profit reached $412.2 million, compared with $138.0 million a year earlier. This business generated almost all consolidated gross profit and more than the entire year-over-year increase in consolidated gross profit, because deterioration in installation and electricity profitability offset part of the product and service improvement.
Management explicitly attributed the product-margin progression to both pricing and cost reduction. Edwards stated, “Pricing remains strong, and the cost reductions we’ve been driving are showing up in the numbers.” The qualification is that no quantitative decomposition was provided. The evidence supports improved aggregate product economics, but does not establish how much came from contractual pricing, manufacturing productivity, procurement savings, configuration mix, or customer mix. That distinction determines the durability of margins when urgent procurement conditions normalize.
Total adjusted gross margin increased to 34.5%, from 30.4% a year earlier and 34.3% in Q2. The relatively modest sequential improvement despite a 120-basis-point increase in product margin reflects changes elsewhere in the revenue mix and segment economics. Installation represented approximately 6.9% of revenue, compared with 4.8% in Q2, and carried a negative adjusted margin. Product mix declined modestly as a percentage of consolidated sales despite substantial absolute growth.
Installation generated an adjusted gross loss of $3.0 million, equivalent to a negative 3.5% margin. This compared with a negative 1.4% margin in Q2 and a positive 10.0% margin in Q3 2025. Installation growth therefore detracted from consolidated margin. The call appropriately distinguished installation revenue, recognized over time as work progresses, from product revenue recognized upon control transfer. However, timing alone does not explain the economic deterioration. Project scope, execution costs, contractual pricing, and responsibility for site work remain relevant.
Bloom’s release also identifies a transition toward a consult-only installation model, particularly at large-load sites, as a business risk. Such a transition could reduce low-margin installation revenue and execution exposure while making product sales a larger share of reported revenue. It could also shift more site-readiness risk to counterparties. Accordingly, installation revenue is not necessarily a reliable leading indicator of product demand, and lower installation sales would not automatically indicate a weaker equipment franchise.
Service revenue increased 15.3% year over year but declined 2.1% sequentially. Adjusted service gross margin improved to 21.4%, from 14.4% a year earlier, but declined from 22.0% in Q2. Management emphasized the achievement of another quarter above 20%; the sequential moderation deserves equal attention. Service gross profit was $14.5 million, compared with $15.2 million in Q2 and $8.5 million a year earlier.
The service result is encouraging because installed-base economics are central to the long-term value of fuel-cell deployments. However, service profitability remains small relative to equipment profitability. At approximately 5.5% of revenue, service cannot yet provide a substantial consolidated earnings cushion if product deliveries slow. The service revenue miss also warrants explanation as the installed base expands. Possible considerations include the lag between product acceptance and service commencement, contract mix, maintenance schedules, and the economics of newer systems. The call did not identify which factors explained the variance.
Electricity revenue declined 5.2% year over year, while its gross margin fell to 25.7%, from 43.8% a year earlier and 31.1% in Q2. Its approximately 0.8% revenue contribution limits the consolidated impact. Nevertheless, this reinforces that Bloom should principally be analyzed as an equipment and service platform, not as an electricity producer earning a recurring spread on most of the generation capacity associated with its brand.
Adjusted operating expenses increased 26.2% year over year to $140.5 million, substantially below revenue growth. Operating expenses declined from approximately 21.5% of revenue to 11.4%. Adjusted operating income consequently increased to $285.7 million from $46.2 million, with operating margin expanding from 8.9% to 23.1%. Approximately 33.4% of incremental year-over-year revenue translated into incremental adjusted operating income. The corresponding sequential conversion was approximately 27.0%.
The operating leverage is therefore genuine, but its composition matters. Most of the operating-margin expansion came from spreading operating expenses over a much larger revenue base, rather than from gross-margin expansion alone. This is attractive during rapid growth, but creates sensitivity to delivery disruptions. A revenue shortfall against a larger manufacturing, engineering, and commercial infrastructure can reverse part of that leverage.
Longer-term comparisons also caution against assuming uninterrupted margin improvement. Annual adjusted gross margin increased from 28.7% in 2024 to 30.3% in 2025 and is now guided to approximately 34% for 2026. However, individual quarters have been volatile: Q4 2024 adjusted gross margin was 39.3%, above the current quarter. The emerging evidence is of improved annual economics at much greater scale, not a permanently linear quarterly margin trajectory.
OBSERVATION: GUIDANCE REVISION AND THE IMPLIED Q4 REQUIREMENT
The guidance progression has been substantial. In February, Bloom forecast 2026 revenue of $3.1 billion to $3.3 billion, adjusted gross margin of approximately 32%, adjusted operating income of $425 million to $475 million, and adjusted EPS of $1.33 to $1.48.
In April, revenue guidance increased to $3.4 billion to $3.8 billion, gross margin increased to approximately 34%, adjusted operating income increased to $600 million to $750 million, and adjusted EPS increased to $1.85 to $2.25.
In July, revenue guidance increased again to $3.9 billion to $4.2 billion, while gross margin remained approximately 34%. Adjusted operating income increased to $800 million to $900 million and adjusted EPS to $2.55 to $2.85.
The current outlook is $4.4 billion to $4.6 billion of revenue, approximately 34% adjusted gross margin, $960 million to $1.03 billion of adjusted operating income, and $3.10 to $3.40 of adjusted EPS. Relative to July, the revenue midpoint increased by $450 million, operating income by $145 million, and EPS by $0.55. Relative to February, the revenue midpoint increased 40.6%, operating income increased 121.1%, and EPS increased 131.3%.
The annual revenue midpoint now implies approximately 122.3% growth, versus approximately 58.1% under the initial February outlook. The operating margin implied by the guidance midpoint increased from approximately 14.1% in February to 22.1% currently. This is a materially different earnings profile, rather than simply an incremental revenue adjustment.
The current revision implies strong incremental profitability. At a constant 34% gross margin, the additional $450 million of revenue adds approximately $153 million of gross profit. The operating income midpoint increases by $145 million, implying only approximately $8 million of additional full-year adjusted operating expenses under this simplified midpoint calculation. Approximately 32.2% of the revenue increase therefore flows through to adjusted operating income. This interpretation assumes that the approximate margin target can be treated as an exact modeling input; it is not separately issued operating-expense guidance.
The guidance increase also exceeds the amount needed merely to incorporate the Q3 revenue beat. Bloomberg’s prior full-year consensus was $4.11 billion. After subtracting actual H1 revenue and the $1.08 billion Q3 consensus estimate, that implied approximately $1.214 billion of Q4 revenue. The new guidance midpoint implies approximately $1.448 billion. On that consistent benchmark, the Q4 outlook is approximately $234 million, or 19.3%, above the previously implied consensus trajectory.
The revised annual range translates into Q4 revenue of approximately $1.348 billion to $1.548 billion. This requires sequential growth of approximately 9.1% to 25.2% and year-over-year growth of approximately 73.3% to 99.0%. The midpoint is ambitious in absolute dollars but consistent with another quarter of substantial sequential expansion.
Year-to-date adjusted operating income was approximately $655.0 million. The annual guidance therefore implies Q4 operating income of approximately $305 million to $375 million. Pairing corresponding revenue and operating-income endpoints produces operating margins of approximately 22.6% to 24.2%, with a midpoint near 23.5%. Management did not explicitly state that the endpoints must occur together, so these are modeling implications rather than separate quarterly guidance.
Year-to-date adjusted gross margin was approximately 33.7%. Reaching approximately 34% for the full year would require Q4 gross margin around 34.6% to 34.7% across the revenue range. The unchanged annual target therefore leaves room for modest sequential improvement. It should not be interpreted as an explicit warning that product economics are deteriorating.
Management nevertheless gave a clear warning about year-end timing: “With one quarter remaining, the timing of a small number of deliveries around year-end will determine where in the range we land.” The outlook incorporates both backlog assessed against customer readiness and a probability-weighted pipeline of customers needing power within the quarter. It is therefore not entirely supported by completed, unconditional delivery schedules.
This methodology has produced repeated upward revisions, which supports management’s recent forecasting credibility. It also creates sensitivity to a small number of large sites. Customer readiness can affect revenue timing even if Bloom’s manufacturing capacity and underlying demand remain strong. The distinction between equipment availability, contractual acceptance, commissioning, and billing is central to assessing the probability of achieving the upper end.
No formal 2027 revenue, margin, EPS, capital-expenditure, or manufacturing-capacity guidance was provided. Management’s expectation of further scale benefits is directionally positive but cannot be treated as a numerical commitment.
OBSERVATION: CASH CONVERSION IS THE PRINCIPAL FINANCIAL QUALIFICATION
Operating cash flow was negative $27.1 million, compared with positive $226.4 million in Q2 and positive $19.7 million in Q3 2025. Capital expenditures increased to $153.5 million, from $51.6 million sequentially and $12.3 million a year earlier. Free cash flow was consequently negative $180.6 million.
The distinction between operating cash flow and free cash flow matters because an analyst’s question described the $27 million outflow as part of the free-cash-flow discussion. The actual free-cash-flow deficit was much larger after manufacturing investment. A negative operating cash result during rapid growth can be manageable; a simultaneous acceleration in working capital and capital spending creates a more demanding funding profile.
Year-to-date operating cash flow remained approximately $273 million, supporting approximately $231 million of capital expenditures and approximately $42 million of positive free cash flow. Management’s statement that expansion had been funded from operations is supported on that year-to-date basis. However, free cash flow represented only approximately 1.4% of revenue, and operating cash flow was roughly 39% of year-to-date adjusted EBITDA. The business is generating much more accounting profit than distributable cash.
The quarterly working-capital movements were substantial. Contract assets absorbed $430.3 million, receivables absorbed $175.2 million, and inventory absorbed $170.4 million. Together, these categories used approximately $776 million. Offsetting sources included $184.7 million from accounts payable, $158.8 million from accrued expenses and other current liabilities, and $309.3 million from deferred revenue and customer deposits. Those sources totaled approximately $653 million.
The implication is more nuanced than a simple lag between sales and collections. Customer prepayments and supplier financing are already contributing significantly to the growth model. The current quarter’s cash result would have been substantially weaker without them. These financing benefits may persist if demand and contracting terms remain favorable, but they should not be assumed to expand indefinitely at the same pace.
Other long-term assets absorbed an additional $178.0 million, while deferred cost of revenue absorbed $42.7 million. The prepared remarks emphasized inventory, contract assets, and receivables, but those categories do not fully explain the cash movement. The nature and recoverability of the other asset growth require additional disclosure before the entire cash deficit can be characterized as ordinary short-cycle working capital.
Total current and noncurrent contract assets reached $858.6 million, compared with $241.2 million at year-end 2025. Receivables increased to $634.7 million from $371.8 million. Together, contract assets and receivables totaled approximately $1.493 billion, exceeding quarterly revenue. This is equivalent to roughly 110 days of Q3 sales, although it is not a conventional receivables-days calculation because contract assets include conditional billing rights and noncurrent balances.
Management explained that “cash collection can follow revenue recognition” and stated that “those differences even out over time.” This is a plausible explanation of milestone-based contracts, but the latter statement is a forecast about collection performance, not an established result. The decisive evidence will be conversion of existing contract assets into invoices and cash, rather than continued growth in aggregate balances accompanied by higher revenue.
A growing contract-asset balance does not by itself demonstrate aggressive accounting or poor customer quality. Conversely, investment-grade end customers do not eliminate site-readiness, contractual-condition, project-financing, or intermediary-counterparty risks. Useful disclosures would include aging, scheduled billing milestones, collection after quarter-end, customer concentration, and the share of balances associated with projects not yet operating.
Working-capital sensitivity is economically material. At the $4.5 billion annual revenue midpoint, an additional 30 days of revenue-linked capital absorption would represent approximately $370 million. That exceeds year-to-date free cash flow by a wide margin. Relatively small changes in payment structure can therefore have an outsized effect on equity cash generation.
Inventory increased to $927.7 million, compared with $643.3 million at year-end. Some inventory accumulation is consistent with management’s commitment to having equipment ready before customers need it. However, prebuilding for specific deployment schedules transfers timing risk onto Bloom’s balance sheet. The relevant questions are whether the inventory is interchangeable across projects, how much is finished equipment versus work in process, and what protections exist if customer schedules change.
OBSERVATION: BALANCE-SHEET STRENGTH, DILUTION, AND EPS SUSTAINABILITY
Cash and equivalents of $2.487 billion provide substantial liquidity. However, the cash balance should not be interpreted as equivalent excess equity value. Recourse and nonrecourse debt totaled approximately $2.476 billion on the reported carrying-value basis, leaving only approximately $10 million of net cash before financing obligations. Including approximately $185 million of financing obligations produces approximately $175 million of net debt, before operating lease liabilities and other adjustments.
The balance sheet is therefore liquid, but not meaningfully unlevered. Convertible securities also require consistent treatment in valuation: debt assumed to convert should not simultaneously be counted at full debt value while all associated conversion shares are included without adjustment.
The distinction between adjusted and GAAP earnings remains economically important. GAAP operating income was $225.4 million, compared with adjusted operating income of $285.7 million. Approximately $60.1 million of the difference was share-based compensation, equivalent to 4.9% of revenue and approximately 21% of adjusted operating income.
The compensation burden is declining relative to revenue, but increasing in dollars. Common shares outstanding increased from approximately 280.0 million at year-end 2025 to 295.5 million at September 30, an increase of 5.5%. Q3 diluted weighted-average shares were approximately 324.3 million, versus approximately 294.8 million basic weighted-average shares. Enterprise growth and per-share value creation therefore need to be evaluated separately.
The balance sheet also contained $306.5 million of current and noncurrent customer consideration assets. The accessible Q2 filing identifies this category as upfront share-based consideration payable to a customer’s customer. This is a commercial incentive asset, not an ordinary cash receivable. Its presence means that the economics of major customer relationships should be assessed after equity-linked commercial concessions, rather than solely through reported equipment pricing. The available disclosures do not establish a new Q3 incentive event or provide a sufficient Q3 rollforward to quantify its incremental effect.
Below operating income, net interest income contributed approximately $14.6 million. GAAP other income included effects associated with asset buyouts and repowering, with approximately $9.3 million removed in the adjusted net-income reconciliation. This adjustment improves the comparability of adjusted earnings, but interest income remains a source of earnings that can change with interest rates and cash deployment.
The income tax provision was only approximately $0.8 million against approximately $249.8 million of pretax income, implying an effective tax rate near 0.3%. Such a low rate materially supports reported EPS. A sensitivity using a 25% tax rate on the same pretax income would reduce earnings by approximately $62 million, or roughly $0.19 per diluted share, before detailed diluted-numerator adjustments. This is not a forecast of imminent tax normalization. It demonstrates why current EPS should not be capitalized indefinitely without considering tax attributes and their eventual utilization.
OBSERVATION: MANUFACTURING EXPANSION AND EXECUTION RISK
The decision to expand the Fremont footprint indicates that management is preparing for demand beyond the previously discussed 5 GW milestone. However, Sridhar explicitly declined to confirm the analyst’s proposed 10 GW interpretation or provide a timetable. The relevant statement was, “We are not going to provide a timeline of when that’s going to happen.”
Management also corrected the suggestion that Bloom had committed to quarterly additions of 250 MW to 300 MW. Sridhar stated, “We have not given any numbers on quarter to quarter growth or year growth.” This clarification is important. A mechanical quarterly capacity ramp should not be embedded in estimates as management guidance.
The financial commitment is already material. Approximately 66% of year-to-date capital expenditures occurred in Q3. Expanding within existing Fremont and Newark facilities may reduce the complexity and cost of a fully greenfield build, but it does not eliminate qualification, supplier, yield, commissioning, and staffing risks. Manufacturing capacity must also be distinguished from saleable output and customer-accepted deliveries.
Sridhar’s manufacturing example was striking: stack production had progressed from approximately 100 MW with approximately 600 employees toward 1 GW with a similar workforce, with an ambition to retain approximately 600 employees on the relevant line at 5 GW. This points to substantial automation potential. It does not demonstrate that total company labor, service infrastructure, material cost, testing requirements, or working capital will remain fixed as output increases.
The near-term evidence is favorable because product margin improved while capacity was being added. Longer-term returns still depend on capital cost per incremental unit of saleable capacity, utilization, yield, equipment life, and the ability to maintain field performance at much larger installed volumes. Management’s description of capital efficiency is supported by rapid earnings growth, but the call did not provide sufficient data to calculate incremental return on invested capital.
IMPLICATION: TIME TO POWER IS THE STRONGEST COMMERCIAL ADVANTAGE
The most persuasive element of Bloom’s value proposition is the ability to deliver usable power before constrained grid infrastructure can accommodate large loads. For a data center with installed or committed computing equipment, power availability can determine whether a much larger capital investment generates revenue. This can make time to power more important than a narrow comparison of generation cost per MWh.
Management reiterated that the Oracle Utah deployment was delivered in less than 2 months. For Nebius in New Jersey, planning approvals were reportedly obtained within 3 months of contract signing, followed approximately 2 months later by readiness of the initial power block. These are different measurement periods. The Nebius example supports rapid phased execution but does not establish a universal contract-to-power cycle below 90 days.
The call did not disclose the MW size of Nebius’s initial block. It also did not establish that the entire 300 MW project was energized. Sridhar’s commitment was, “We will not be the bottleneck,” with Bloom equipment available before each customer deployment block. This supports equipment readiness but leaves customer construction and commissioning schedules as revenue and cash-flow dependencies.
The distinction between currently operating and planned scale also remains important. When asked about the largest operating deployment, management described the 100 MW class. The 700 MW Wyoming project is materially larger and introduces additional requirements around gas supply, site integration, electrical architecture, service logistics, and potentially CO2 infrastructure. Replication of modular equipment reduces certain engineering risks, but site-level complexity does not disappear.
Management cited an NVIDIA statement that a quarterly delay at a 1 GW data center could represent $10 billion of missed revenue. This supports the strategic importance of energization timing, but gross customer revenue is not the same as economic value available to Bloom. The relevant amount depends on computing utilization, gross margins, equipment availability, demand commitments, and alternative deployment options.
The strongest pricing power exists where Bloom removes a binding constraint. As competing solutions become more available, pricing is likely to depend more heavily on demonstrated lifecycle economics. The durable thesis therefore requires both a near-term speed advantage and a defensible cost, reliability, permitting, or integration advantage after supply bottlenecks ease.
IMPLICATION: TOTAL COST OF OWNERSHIP, GAS EXPOSURE, AND RELIABILITY
The call’s emphasis on total cost per unit of useful computation is economically appropriate. Grid tariffs alone do not capture interconnection delays, backup generation, power-conditioning equipment, conversion losses, redundancy, cooling, or stranded computing capacity. However, describing conventional levelized generation cost as irrelevant would go too far. Fuel, capital recovery, maintenance, replacement cycles, and financing remain components of total delivered cost.
A complete comparison should incorporate natural-gas commodity and transportation charges, gas-service reliability, equipment and installation cost, stack replacement, long-term service pricing, electrical redundancy, power conversion, tax incentives, carbon costs, and residual value. The call did not provide a standardized customer-level cost bridge with those assumptions.
Gas prices remain a meaningful determinant of customer economics. As an illustrative sensitivity, a system operating at 60% electrical efficiency consumes approximately 5.7 MMBtu per MWh. A $1 per MMBtu change in delivered gas prices would therefore change fuel cost by approximately $5.7 per MWh before other costs. This is not a disclosed Bloom fleet-average heat rate. It demonstrates the continuing relevance of fuel prices even when onsite generation offers substantial infrastructure advantages.
Management argued that high international gas prices could enhance Bloom’s efficiency advantage. That is directionally valid against a less-efficient gas-based alternative, because the value of each unit of avoided fuel increases with fuel prices. It is not universally valid against low-cost hydroelectricity, nuclear generation, subsidized tariffs, or other electricity sources not tied to the same gas price. International expansion requires market-specific analysis rather than extrapolation of US economics.
The reliability claims also require system-level qualification. Distributed modules can reduce exposure to individual equipment failures, but common gas supply, switchgear, controls, and site infrastructure can remain shared failure points. Eliminating conventional backup generators depends on the complete electrical design, fuel resilience, black-start capability, required availability standards, and regulatory approval. The call did not provide project-level availability data or evidence that backup can be eliminated across all applications.
The water advantage is plausible and commercially relevant, particularly relative to wet-cooled combined-cycle generation. However, the comparison of approximately 25 billion gallons with 1.4 million gallons lacked a clear lifetime and operating boundary in the draft transcript. It should not be treated as a standardized lifecycle metric. Dry-cooled generation, data-center cooling, upstream fuel supply, and carbon-capture equipment can change the comparison. Low local pollutant emissions and low operating water use also should not be conflated with zero lifecycle greenhouse-gas emissions.
IMPLICATION: AEP, GOOGLE, AND CARBON CAPTURE
AEP’s October 14 announcement provides important independent support for the commercial significance of the project discussed on the call. AEP plans approximately $4 billion of investment in a 702 MW fuel-cell facility near Cheyenne, Wyoming, under a 20-year power purchase agreement with Google. The project entity is approximately 92% owned and controlled by AEP, with nearly 8% owned by funds advised by Basalt Infrastructure Partners. Construction is planned to begin in 2026, with full operation expected by the end of 2028.
This validates the ability of Bloom’s technology to support a large infrastructure financing and a long-duration hyperscaler power arrangement. However, the approximately $4 billion project investment is not Bloom equipment revenue. It includes a broader project scope. Likewise, the 20-year PPA is an arrangement involving the project entity and Google, not evidence that Bloom receives the full contracted electricity revenue.
The distinction between generation technology and a complete carbon-capture chain is equally important. AEP’s announcement describes plans to integrate carbon capture. It does not establish that capture, compression, transportation, sequestration, permits, and all associated commercial arrangements are complete.
Bloom’s potentially concentrated CO2 stream could offer a meaningful advantage relative to dilute combustion exhaust. Nevertheless, management’s assertion that combustion technologies lack an affordable, scalable carbon-capture pathway is a competitive claim, not a conclusion established by the call. The relevant comparison requires capture rate, energy penalty, installed capital cost, operating cost, gas consumption, transport distance, storage availability, financing, and policy support.
Sridhar supplied a potentially important commercial benchmark: “Think about a 10% to 15% cost as being a reasonable cost that most hyperscalers today would accept to be able to provide zero carbon power.” He stated that Bloom could deliver full carbon capture and sequestration within that range. The figure is useful as management’s target, but the underlying power-cost denominator, capture specification, credit assumptions, and infrastructure boundaries were not disclosed.
“Carbon capture ready” should also be distinguished from operating with carbon capture. A ready system may still depend on future pipelines and sequestration capacity. Furthermore, near-zero stack emissions do not establish zero lifecycle emissions when upstream methane leakage, residual CO2, and energy consumed by the capture chain are included.
Monetization remains flexible rather than standardized. Management described equipment sales to customers that monetize credits themselves, partner-led integrated solutions, and arrangements in which customers pay through electricity pricing or equipment margins. This flexibility could accelerate adoption, but it leaves the division of economics unresolved. No carbon-capture order value, incremental margin, or standardized recurring revenue stream was disclosed.
The investment implication is that carbon capture expands strategic relevance and potentially improves the durability of gas-based onsite generation within customer decarbonization plans. It should remain separately probability-weighted rather than embedded as a large, immediate earnings contributor.
IMPLICATION: 800 V DC, HEAT RECOVERY, AND OTHER EXPANSION OPPORTUNITIES
The 800 V DC opportunity is an architectural adjacency rather than a requirement for the current earnings beat. Bloom’s February release already stated that product shipments were 800 V DC ready. The Q3 call therefore advances the discussion of potential customer adoption, rather than establishing a newly available capability.
Management claimed that a 1 GW data center could save more than $5 billion over 5 years by adopting the proposed architecture. At continuous utilization, $5 billion over 5 years is equivalent to approximately $114 per MWh of 1 GW output. That magnitude indicates a broad modeled system benefit, not simply a small reduction in power-conversion losses. It requires a clear understanding of avoided capital equipment, financing, power consumption, computing utilization, and the comparison architecture.
The competitive question is not only whether 800 V DC adoption occurs. It is how much of the resulting value accrues specifically to Bloom. Other generation sources can also connect to DC distribution through appropriate equipment. Bloom’s potential advantage lies in reducing unnecessary conversion stages and integrating the power architecture, but customer savings are not automatically Bloom revenue or margin.
Management did not give an adoption timetable. Sridhar stated, “It’ll happen when the DC data centers are built with 800-volt DC as the standard.” This appropriately places the timing with the broader computing ecosystem. The opportunity is credible optionality, but not quantified 2027 guidance.
Combined heat and power can improve economics where useful thermal demand is sufficiently large and well matched to generation. Management’s suggestion that recovered heat could reduce power demand by 20% should be treated as application-specific. The benefit depends on exhaust conditions, heat-transfer equipment, absorption-cooling efficiency, baseline cooling demand, and the availability of a suitable thermal customer. Electrical efficiency, total fuel utilization, and reduction in facility electricity consumption are different metrics.
Commercial and industrial applications may provide particularly attractive heat-recovery opportunities because steam, process heat, or cooling can have direct economic value. However, management’s survey that approximately 25% of US commercial and industrial facilities expect to be fully powered onsite by 2030 measures stated intentions, not signed orders. A survey of more than 200 businesses cannot be directly converted into a revenue forecast without assessing facility size, financing, fuel infrastructure, permitting, and competing technologies.
The Army opportunity is also at an early contractual stage. The disclosed conditional award of long-term leases to partner Indelible supports access to potential development sites. It is not equivalent to an unconditional Bloom equipment order or completed project financing. Similarly, management’s expectation of international announcements and utility wins was not accompanied by identifiable revenue commitments on this call.
The utility channel is strategically attractive because it could convert Bloom from a competitor to utility load retention into a supplier supporting utility growth. However, regulatory treatment will vary. Generation equipment does not automatically qualify as a transmission or distribution asset because it is located near load. Ownership, cost recovery, competitive procurement, prudence, and customer cost allocation require jurisdiction-specific approval.
The AEP and Google arrangement should not be treated as proof that regulated utilities can universally place Bloom equipment into transmission and distribution rate base. A commercial PPA structure and a regulated cost-recovery structure have different risks and economics.
RECOMMENDATION: VALUATION DISCIPLINE, SCENARIOS, AND EVIDENCE REQUIRED
The quarter justifies materially higher 2026 operating estimates and raises confidence that Bloom can scale profitably. It does not, by itself, justify treating all prospective markets as contracted backlog or applying a recurring-software valuation framework to a predominantly equipment-driven business. Product acceptance is accelerating, but cash collection, service monetization, and replacement economics remain critical to the durability of shareholder returns.
Bloomberg reported an approximately 5% postmarket decline despite the headline beat and guidance increase. The decline cannot be causally attributed to any single issue from the available evidence. Plausible concerns include elevated expectations, cash consumption, the absence of quantified 2027 guidance, and the lack of a numerical backlog update. The central interpretation is that the company exceeded published consensus while the stock remained sensitive to the quality and duration of future growth.
Management stated that backlog was expanding faster than revenue but declined to quantify that statement. It should not be translated into a specific backlog growth rate or book-to-bill ratio. Backlog is a stock, revenue is a flow, and the comparison requires a defined period, contract scope, cancellation treatment, and distinction between equipment and long-duration service obligations. The refusal to provide a numerical bracket leaves an important component of the 2027 investment case unresolved.
A base case with a 50% probability assumes 2027 revenue of approximately $6.2 billion, adjusted gross margin of 35.5%, and adjusted operating margin of 24.0%. This produces approximately $1.49 billion of adjusted operating income, representing approximately 38% revenue growth and 50% operating-income growth from the revised 2026 midpoints. The assumptions require continued data-center conversion, moderate manufacturing improvement, and operating expenses growing more slowly than revenue. They do not require substantial near-term carbon-capture or 800 V DC monetization. Sustainable cash generation would require existing contract assets to convert as anticipated.
A bull case with a 25% probability assumes 2027 revenue of approximately $7.5 billion, adjusted gross margin of 38%, and adjusted operating margin of 27%. Adjusted operating income would reach approximately $2.03 billion. This case requires larger and faster customer deployments, successful expansion of manufacturing output, reduced startup and expediting costs, and meaningful contributions from additional utility or international relationships. Cash conversion would need to improve alongside earnings. Failure to collect recognized revenue would materially weaken the valuation implications even if the income statement approached this outcome.
A bear case with a 25% probability assumes 2027 revenue of approximately $4.8 billion, adjusted gross margin of 31%, and adjusted operating margin of 17%. Adjusted operating income would decline to approximately $816 million despite modest revenue growth. This could result from customer deployment delays, slower order conversion, pricing pressure, manufacturing underutilization, elevated service costs, or a less favorable project mix. Continued working-capital absorption during a manufacturing expansion would amplify the effect on equity value.
These are analytical scenarios, not company guidance or independently verified consensus estimates. Their probability-weighted 2027 adjusted operating income is approximately $1.45 billion. That outcome is materially above the revised 2026 midpoint, but remains sensitive to assumptions about margins and project conversion.
Valuation should distinguish business improvement from an attractive purchase price. Every $10 billion of enterprise value represents approximately 10.1x the current 2026 adjusted operating-income midpoint, or approximately 6.7x the base-case 2027 figure. Applying illustrative 20x, 30x, and 40x multiples to base-case 2027 operating income produces enterprise values of approximately $29.8 billion, $44.6 billion, and $59.5 billion. These are valuation sensitivities, not price targets. Their wide dispersion demonstrates that duration and multiple assumptions can dominate the effect of another quarterly earnings beat.
A sufficiently reliable event-date share price and fully reconciled enterprise-value bridge are not established by the available materials. A precise price target or expected share-price return would therefore imply unsupported precision. The appropriate recommendation is to retain a constructive operating view while requiring valuation support and improved cash evidence before assigning additional value to long-duration strategic options.
The immediate catalyst is Q4 delivery execution against the implied $1.35 billion to $1.55 billion revenue range. Equally important is whether Q3 contract assets become billable and collectible during Q4 and early 2027. The next annual guidance and backlog disclosure should provide the clearest test of 2027 growth visibility. Manufacturing utilization, capital expenditures, service profitability, warranty behavior, and customer concentration will determine whether the earnings trajectory is translating into durable returns.
The positive thesis would be strengthened by sustained product margins near or above current levels, service margins remaining above 20%, measurable improvement in cash conversion, and quantified orders supporting the next capacity increment. It would be weakened by repeated milestone slippage, rising contract-asset aging, increased customer concessions, service-cost deterioration, or capacity investment that persistently exceeds internally generated cash.
The principal conclusion is that Q3 demonstrated a substantially larger and more profitable equipment franchise, not yet a fully de-risked cash-generative infrastructure platform. Earnings revisions are supported by reported deliveries and margins. Further valuation expansion requires evidence that those deliveries produce timely cash, attractive lifecycle economics, and repeatable growth beyond the current phase of urgent AI power procurement.
COMPANY EMPLOYEES ON THE CALL
• KR Sridhar, Founder, Chairman, and Chief Executive Officer. • Simon Edwards, Chief Financial Officer. • Michael Tierney, Investor Relations.
An unidentified speaker also appears in the draft transcript; the individual’s identity, title, and affiliation are not established.
RESEARCH ANALYSTS ON THE CALL
• Mark Strouse, JPMorgan. • Nick Amakuchi, Evercore ISI, as identified in the draft transcript. • David Arcaro, Morgan Stanley. • Christopher Dendrinos, RBC Capital Markets. • Manav Gupta, UBS. • Ben Kallo, Baird. • Ameet Thakkar, BMO Capital Markets. • Maheep Mandloi, Mizuho. • Sunaina Ocalan, Bernstein. • Colin Rusch, Oppenheimer.
Key Read-Throughs
KEY READ-THROUGHS FROM BLOOM ENERGY’S Q3 2026 EARNINGS CALL
Bloom Energy’s results provide increasingly tangible evidence that onsite generation is becoming a commercially significant alternative to waiting for conventional grid expansion. Revenue increased 138% year over year, product gross margin reached 38.4%, and management raised annual revenue guidance to $4.4 billion to $4.6 billion. The broader-market implication is not simply stronger demand for fuel cells. It is a redistribution of value across the AI infrastructure chain: customers gain additional paths to energization, utilities can monetize privately supplied generation, gas infrastructure becomes more important, and conventional generator suppliers and incumbent power producers face greater competition for incremental projects. The strongest positive read-throughs concern identifiable customers and contractual counterparties. The strongest negatives concern prospective market share and scarcity-based pricing assumptions, rather than existing contracted earnings. Bloom’s negative quarterly free cash flow also demonstrates that faster deployment does not eliminate the financing and working-capital requirements of the AI buildout. Magnitudes below refer to business exposure and earnings sensitivity, not predicted share-price moves; country labels reflect corporate domicile.
AI INFRASTRUCTURE, CLOUD AND SEMICONDUCTORS
NEBIUS RECEIVES A MEANINGFUL EXECUTION SIGNAL, WHILE ORACLE AND NVIDIA RECEIVE MORE LIMITED VALIDATION (READ-THROUGH 1)
Affected companies: Nebius Group (NBIS: Netherlands), Oracle Corporation (ORCL: US), and NVIDIA Corporation (NVDA: US). Direction: positive. Magnitude: potentially high for the relevant Nebius deployment, moderate for Nebius’s company-level execution outlook, modest for Oracle, and small for NVIDIA’s consolidated near-term earnings.
The most actionable customer-specific statement concerned Nebius’s 300 MW New Jersey project. Sridhar stated, “We have our servers ready for the Nebius data center,” and repeatedly emphasized, “We will not be the bottleneck.” Management reported planning approvals within 3 months of contract signing and readiness of the initial power block approximately 2 months after approval. This reduces the probability that fuel-cell availability is the binding constraint on the initial deployment.
For Nebius, the transmission mechanism is earlier availability of usable computing capacity, potentially accelerating customer acceptance, utilization, and revenue recognition while reducing the period during which deployed infrastructure incurs costs without generating revenue. This matters more to an expanding AI infrastructure platform than to a diversified hyperscaler because individual campuses can represent a substantial portion of incremental capacity.
The qualification is material: Bloom did not disclose the initial block’s MW size, confirm energization of the entire 300 MW, or provide Nebius’s customer-service commencement date. Nebius’s project materials also identify it as the tenant operating the computing infrastructure, with DataOne developing and owning the facility. Bloom’s equipment readiness should therefore not be translated directly into Nebius-owned generation assets or an immediate 300 MW increase in revenue-producing capacity. The remaining execution bottlenecks move toward construction completion, electrical integration, cooling, GPU installation, networking, and customer acceptance.
Oracle’s Utah example is supportive but less incremental. Management reiterated delivery in less than 2 months after the original project announcement approximately 15 months earlier. That validates an established deployment route rather than announcing a new Oracle order. For NVIDIA, the benefit is reduced risk that customers cannot energize accelerator infrastructure. The call disclosed no incremental GPU procurement and does not justify converting management’s cited estimate of lost data-center revenue into NVIDIA revenue.
Near-term trading relevance is highest for Nebius when customer commissioning disclosures confirm that Bloom’s equipment readiness has translated into operational capacity. For Oracle and NVIDIA, the call is principally an execution-risk reduction signal. The longer-duration positive is that a broader set of sites can become economically deployable without waiting for the traditional grid-development schedule.
UTILITIES AND CONTRACTED POWER
BLACK HILLS DEMONSTRATES THAT DISTRIBUTED GENERATION CAN CREATE UTILITY EARNINGS WITHOUT UTILITY OWNERSHIP OF EVERY GENERATOR (READ-THROUGH 2)
Affected company: Black Hills Corporation (BKH: US). Direction: positive. Magnitude: high strategic significance and potentially material earnings contribution over 2027–2030; limited immediate earnings impact from Bloom’s call itself.
Sridhar’s utility commentary contained an important distinction: onsite generation can become “a complement to the grid,” with utilities procuring or integrating distributed resources rather than losing the customer entirely. The AEP–Google project provides a concrete setting in which that transition is occurring.
Black Hills’ separate October 6 disclosure establishes the economics more clearly than Bloom’s general discussion. Its Google agreements run through 2048 and contemplate up to 590 MW of grid-connected service alongside management of approximately 2.1 GW of third-party resources through a private microgrid. Black Hills expects approximately $150 million of net income from the project in 2030, supported by returns on generation investment and microgrid management fees.
The non-consensus implication is that third-party generation does not necessarily destroy the utility’s economic relationship with a large-load customer. Black Hills can earn fees for coordinating dispatch, reliability, grid interactions, and the broader supply portfolio even when another entity owns part of the generation. The earnings model shifts from supplying all electricity through conventional utility assets toward a combination of capital returns and contracted system-management revenue.
This also prevents double counting across portfolios. The AEP fuel-cell project and Black Hills’ arrangements relate to the same broader Google development in Cheyenne. The 702 MW fuel-cell announcement should not automatically be added to Black Hills’ approximately 2.7 GW resource plan as an unrelated increment of demand.
The contractual protections are important. Black Hills disclosed cost pass-through provisions, capital-recovery protections, termination protections, and collateral requirements. These provide a more credible basis for underwriting returns than a generic assumption that regulators will place all distributed generation in rate base. The company also plans approximately $1.8 billion of generation investment, and Google’s $399 million of equipment advances are refundable rather than permanent free funding.
Near-term relevance is confirmation that the broader supply architecture is progressing, not a newly announced Black Hills earnings increase. Investment returns are expected to begin contributing in 2027, with the larger earnings impact dependent on the subsequent load ramp. The longer-duration implication is favorable for utilities capable of structuring bespoke large-load agreements, but the Wyoming structure is not automatically transferable to every jurisdiction.
AEP GAINS A CONTRACTED GROWTH CHANNEL, WHILE GOOGLE EXPANDS ITS FIRM-POWER PROCUREMENT OPTIONS (READ-THROUGH 3)
Affected companies: American Electric Power Company (AEP: US) and Alphabet Inc. (GOOGL: US). Direction: positive, with substantial execution qualifications. Magnitude: moderate for AEP’s investment opportunity; strategically meaningful but small relative to Alphabet’s consolidated financial scale.
Bloom highlighted approximately 700 MW of fuel cells associated with AEP and Google. AEP’s October 14 announcement specifies a 702 MW project near Cheyenne, approximately $4 billion of investment, and a 20-year power purchase agreement with Google. Construction is planned to begin in 2026, with full operation expected by the end of 2028.
For AEP, the transmission mechanism is investment in contracted generation serving a creditworthy large-load customer, including opportunities outside its traditional service territory. This creates a growth channel that is not dependent solely on conventional retail load growth and standard utility infrastructure procurement.
The distinction between contracted infrastructure and regulated rate base is essential. The project is owned through a controlled project entity and supported by a commercial PPA. Bloom’s discussion of utilities potentially treating distributed resources as transmission or distribution assets does not establish the regulatory treatment of this specific investment. Returns must be evaluated against construction costs, financing, availability obligations, operating performance, and the actual contract structure.
For Alphabet, the benefit is diversification of the pathways through which future computing capacity can obtain firm electricity. Carbon-capture compatibility could also reduce conflict between rapid AI expansion and decarbonization commitments. Sridhar said hyperscalers would accept a “10% to 15%” cost premium for zero-carbon power and asserted that Bloom could deliver capture and sequestration within that range.
That statement is a management commercialization target, not proof of an agreed Google tariff or an operating integrated capture chain. AEP’s announcement describes plans to integrate carbon capture. It does not establish that all capture equipment, transport infrastructure, storage rights, permits, and performance guarantees are complete. The project’s power value should therefore be separated from its prospective carbon value.
The near-term trading catalyst was primarily the earlier AEP announcement; Bloom’s call adds supplier validation rather than a second independent order. The more important fundamental milestones are construction, equipment delivery, financing, and operating performance through 2028. The long-term positive is a broader menu of financeable firm-power arrangements, while the principal negative is additional capital and technology-integration risk.
NATURAL GAS INFRASTRUCTURE
BYPASSING ELECTRIC TRANSMISSION INCREASES THE IMPORTANCE OF FIRM GAS DELIVERY, NOT NECESSARILY GAS COMMODITY PRICES (READ-THROUGH 4)
Affected companies: Kinder Morgan (KMI: US) and The Williams Companies (WMB: US). Direction: positive for contracted infrastructure opportunities. Magnitude: moderate over a multiyear horizon, with limited incremental near-term earnings attributable to this call.
Bloom’s commercial examples are predominantly natural-gas-based generation, including the 300 MW Nebius project, the approximately 700 MW AEP–Google project, and initial shipments into Texas. Sridhar explicitly framed natural gas combined with carbon capture as a route to supplying reliable electricity while reducing emissions.
The transmission mechanism is straightforward: moving electricity production closer to the customer does not eliminate the need to deliver fuel. It can increase demand for dedicated gas laterals, firm transportation capacity, compression, storage, metering, and backup supply arrangements. For pipeline owners, the attractive economics are long-duration contracted infrastructure returns, not simply higher throughput at an unchanged tariff.
An illustrative 1 GW of generation operating at a 90% utilization rate and 60% electrical efficiency on a consistent higher-heating-value basis would consume approximately 0.12 Bcf/d. That is meaningful for a local delivery system but insufficient by itself to establish a national gas-price thesis. The net demand effect also depends on whether the fuel cells replace other gas generation or enable electricity consumption that otherwise would not occur.
Kinder Morgan’s October 21 results provide independent evidence that this opportunity is becoming contractual. The company disclosed final investment approval for the approximately $4.2 billion Permian Link project, with an approximately $1.6 billion KMI share, supported by long-term take-or-pay agreements and intended to serve generation for an A-rated hyperscaler. It also disclosed additional contracted phases of its Creekside Lateral project serving data-center and industrial customers. These are separate projects; the available evidence does not establish that they supply the Bloom deployments discussed on the call.
Williams has analogous exposure through its transmission network, including Transco’s position in eastern US power-demand corridors. The read-through is to future transportation and expansion opportunities, not a confirmed Williams contract with Nebius, Oracle, or Google.
A critical constraint follows: fuel-cell manufacturing speed is not the same as fuel-infrastructure readiness. Permian Link is expected in Q3 2030, illustrating that large-scale gas infrastructure can require a much longer development cycle than modular generation equipment. Sites with existing firm gas capacity therefore gain a meaningful advantage over sites requiring major new pipelines.
Near-term catalysts are binding transportation agreements, project sanctions, permits, and construction progress. The longer-duration shift favors contracted gas infrastructure across multiple generation technologies. It does not support indiscriminate purchases of gas producers or an assumption that every onsite MW creates wholly incremental national gas demand.
POWER-GENERATION EQUIPMENT
FUEL CELLS ARE A CREDIBLE COMPETITOR FOR MARGINAL DATA-CENTER GENERATOR SPENDING (READ-THROUGH 5)
Affected companies: Cummins Inc. (CMI: US) and Caterpillar Inc. (CAT: US). Direction: selectively negative relative to a scenario in which combustion generators capture substantially all onsite and backup demand. Magnitude: small near-term consolidated earnings impact, but potentially moderate competitive significance within data-center power over several years.
The supporting evidence is not just Bloom’s market forecast. Product revenue reached approximately $1.07 billion, product gross margin increased to 38.4%, and management described operating deployments in the 100 MW class alongside larger planned projects. Bloom is competing at an economically meaningful scale rather than merely demonstrating a technology.
The relevant competitive attributes are permitting, local emissions, noise, water use, and deployment timing. Management reported rapid approvals and initial equipment readiness at Nebius and said that its systems “eliminate the need for backup generators.” That last claim is not independently established across all configurations, but it identifies the customer spending category Bloom intends to displace.
The precise transmission mechanism is lower combustion-equipment content per MW on projects that select fuel cells for primary power, potentially compounded by reduced attachment of conventional backup generators where the complete system design permits it. Any resulting loss of installed equipment would also reduce the associated future maintenance and parts opportunity.
The competitive exposure is more direct for distributed gas and diesel generator packages than for all forms of utility-scale generation. Cummins and Caterpillar participate in these markets, but the call did not identify either company as having lost a particular order. No cancellation of their existing backlog should be inferred.
There are also meaningful limits to the negative conclusion. Fuel cells still require a complete reliability architecture, and customers may retain conventional backup equipment. Natural-gas supply, electrical controls, switchgear, maintenance outages, and other shared failure points remain relevant. Moreover, the overall data-center power market can expand rapidly enough for combustion-equipment sales to grow even while fuel cells gain share.
Cummins’ June announcement of gas-generator deliveries for West Texas data centers scheduled over 2026–2030 reinforces that coexistence. The call is therefore a negative for overly aggressive market-share and generator-attachment assumptions, not evidence that the absolute combustion-equipment cycle has turned down.
Near-term trading effects are most likely through sentiment and competitive comparisons. Fundamental earnings effects require actual procurement decisions, identifiable order displacement, or lower generator content in completed designs. Existing installed-base service revenue is less immediately exposed than future equipment wins.
ELECTRICAL EQUIPMENT AND DATA-CENTER THERMAL INFRASTRUCTURE
NATIVE DC CHANGES THE EQUIPMENT MIX, BUT DOES NOT ELIMINATE THE POWER-MANAGEMENT AND COOLING OPPORTUNITY (READ-THROUGH 6)
Affected companies: Eaton Corporation (ETN: Ireland), Schneider Electric (SU: France), and Vertiv Holdings (VRT: US). Direction: positive for deployment volume and architectural renewal, with negative exposure in selected legacy conversion stages. Magnitude: moderate for order opportunities and strategically significant over the next infrastructure cycle; no specific earnings revision can be derived from the call.
Bloom’s rapid-deployment examples support an important demand mechanism: generation availability can allow data-center construction and fit-out to proceed sooner. Energized computing capacity still requires electrical protection, distribution, controls, thermal systems, and appropriate ride-through arrangements. Solving the generation bottleneck can therefore accelerate spending on complementary infrastructure.
The more differentiated insight concerns 800 V DC. Sridhar called adoption a “no-brainer” and stated that Bloom was discussing the architecture with hyperscalers. The investment implication is not that the established electrical-equipment vendors become unnecessary. It is that equipment content migrates from the conventional AC conversion chain toward DC distribution, protection, controls, storage integration, and high-density cooling.
NVIDIA’s separately published architecture identifies Eaton, Schneider Electric, and Vertiv among its ecosystem participants. It also explicitly combines 800 V DC distribution with energy storage to manage rapid workload fluctuations. That is an important counterweight to interpreting Bloom’s comments about eliminating inefficiencies and backup equipment as evidence that all power conditioning or storage disappears.
The negative component is specific: native DC can remove some AC-to-DC conversion stages and reduce the requirement for selected transformers, distribution units, and legacy UPS configurations within the data hall. Financial models should not simply add new DC revenue while leaving all legacy equipment content unchanged.
The positive component is broader system complexity at higher rack density. New voltage standards require redesigned protection, controls, connectors, distribution equipment, and integrated system engineering. Eaton and Schneider have broad electrical franchises, while Vertiv combines power infrastructure with thermal management. Their ability to participate across the architecture reduces the relevance of a simplistic short thesis based on the removal of an individual conversion stage.
Bloom’s heat-recovery commentary also does not establish a broad negative for data-center cooling suppliers. Management suggested recovered heat could reduce electricity demand by 20%, but this depends on the thermal application and system design. High-density processors still require heat removal, and no named customer was shown to have eliminated its conventional or liquid-cooling requirements.
Near-term catalysts are customer design selections, equipment orders, and commissioning schedules. The longer-duration shift is a product-mix and engineering transition accompanying higher computing density. The strongest conclusion is positive for adaptable system suppliers, while the effect on revenue per MW and margins remains dependent on the final bill of materials.
MERCHANT POWER AND EXISTING GENERATION
ONSITE SUPPLY WEAKENS THE ASSUMPTION THAT ALL AI LOAD MUST PAY A GRID-SCARCITY PREMIUM (READ-THROUGH 7)
Affected companies: Constellation Energy Corporation (CEG: US), Talen Energy Corporation (TLN: US), and Vistra Corp. (VST: US). Direction: negative for marginal bargaining power and valuation assumptions tied exclusively to scarce grid-connected supply. Magnitude: small near-term earnings impact, potentially moderate longer-duration influence on uncontracted growth opportunities.
Bloom’s call provides evidence that large customers have an increasingly credible alternative to waiting for grid connections or purchasing all incremental power from existing generators. The Nebius deployment is particularly relevant because it is located in New Jersey, within the broader PJM market. Bloom also reported initial Texas shipments and asserted that its economics were becoming competitive in low-cost-power states.
The transmission mechanism is an improvement in the customer’s outside option. An incumbent generator can command a scarcity premium when a customer has few feasible alternatives. If an onsite system can meet the required schedule and reliability specification at an acceptable all-in cost, the customer can compare a grid-supplied agreement with a separately financed generation solution. That can constrain the price, duration, or other terms the incumbent can obtain on future contracts.
This is most relevant to valuation assumptions that attribute exceptional value to incremental AI load without adequately modeling supply responses. It is less relevant to already executed contracts, existing hedges, or low-cost generation selling into diversified markets. The call disclosed no lost contract for Constellation, Talen, or Vistra.
The negative should therefore not be expressed as an immediate reduction in wholesale power prices or a broad collapse in generation economics. Onsite systems face gas-supply constraints, construction requirements, operating obligations, and potential carbon costs. They may also enable additional data-center demand that otherwise would not be built, supporting the wider power market.
The targeted conclusion is that the option value of scarce existing power should not be capitalized as though alternative supply cannot emerge. Customer negotiation leverage can improve before enough onsite generation exists to materially change regional energy prices. That creates a potentially earlier valuation effect than an earnings effect.
Carbon capture could eventually strengthen this competitive alternative for buyers with emissions commitments, but the AEP project does not yet prove fully operational near-zero-carbon power at the claimed cost premium. Existing nuclear generation retains important operating and emissions advantages.
Near-term trading relevance is a challenge to scarcity-based narratives rather than an identified forecast miss. The fundamental test is whether subsequent hyperscaler procurement awards shift toward new onsite supply instead of existing grid-connected generation, particularly on projects where speed and power availability command the highest premium.
INFRASTRUCTURE ASSET MANAGEMENT AND PROJECT FINANCE
RAPID DEPLOYMENT INCREASES THE VALUE OF FINANCING PLATFORMS, DESPITE THE “SELF-FUNDING” MANUFACTURER NARRATIVE (READ-THROUGH 8)
Affected company: Brookfield Asset Management Ltd. (BAM: Canada). Direction: positive for infrastructure origination and capital-deployment opportunities, with heightened underwriting requirements. Magnitude: moderate strategic significance, but limited immediate group earnings impact established by this call.
Edwards described Bloom as a “self-funding business,” yet Q3 operating cash flow was negative $27 million and free cash flow was negative approximately $181 million. Year-to-date free cash flow remained positive at approximately $42 million after approximately $231 million of capital expenditures. These figures support the narrower statement that manufacturing expansion had been funded internally over the year to date. They do not imply that the downstream generation projects and AI facilities require little external capital.
The AEP project illustrates the distinction: approximately $4 billion of infrastructure investment supports a 702 MW facility. Separately, Brookfield and Bloom announced in June an expansion of their power-project financing framework from $5 billion to $25 billion. That relationship establishes a direct route through which broader deployment demand could translate into investable infrastructure opportunities.
For Brookfield Asset Management, the mechanism is origination and deployment through managed capital, potentially generating management fees and investment-performance economics where the relevant fund terms apply. Integrated financing can also help assemble generation, data-center infrastructure, and computing investments around a common customer requirement.
The financing advantage becomes more valuable when customers prioritize speed. A project may have commercially attractive demand and available equipment but still need construction capital, milestone funding, long-term ownership, and allocation of operating risks. Platforms capable of underwriting the entire arrangement can reduce coordination delays and improve the probability of execution.
However, the $25 billion framework is not equivalent to funded assets, fee-bearing capital already deployed, Bloom backlog, or Brookfield revenue. The call did not announce another increase in the framework or quantify new Brookfield-funded projects. Near-term earnings should not be calculated by applying a management-fee assumption to the entire headline amount.
Bloom’s cash-flow disclosures also reinforce the need for careful allocation of milestone and acceptance risk. Equipment revenue can be recognized before the associated cash is collected. Project investors must separately evaluate site completion, customer credit, termination provisions, fuel availability, maintenance obligations, equipment replacement, and residual value.
The near-term catalyst is identifiable financial closing and capital deployment into contracted projects, not the repetition of a financing framework. The longer-duration positive is an expanding market for integrated power infrastructure with long-term customer agreements. The critical investment distinction is between attractive contracted infrastructure returns and simply financing rapid equipment sales: the former can create durable fee and investment value, while the latter can leave capital exposed to unresolved construction, utilization, and technology risks.
Report record
- Sector
- Industrials
- Fiscal period end
- September 30, 2026
- Report date
- October 22, 2026
- Analysis
- 6641 words
- Read-throughs
- 3537 words
- Content fingerprint (PDF)
d3d5653da5e6- Content fingerprint (analysis)
6cb9d6d581fe- Content fingerprint (read-throughs)
9194bdcba46e
Prepared from the company's earnings release and earnings call transcript. Figures as reported by the company. For information only. Not investment advice.
More from Bloom Energy Corporation
No other reports yet.
All Bloom Energy Corporation reports
More in Industrials
Improved visibility into 2027 rather than a substantial upgrade to 2026 earnings
Profit dollars substantially exceeded expectations, but profitability per revenue dollar fell short
Follow @AtlasPeakRes on X for new earnings reports as they publish.