A Larger and More Profitable Equipment Franchise, Not Yet a Cash-Generative Platform
Earnings Reports
Comfort Systems USA, Inc. FQ3 2026 Earnings Report
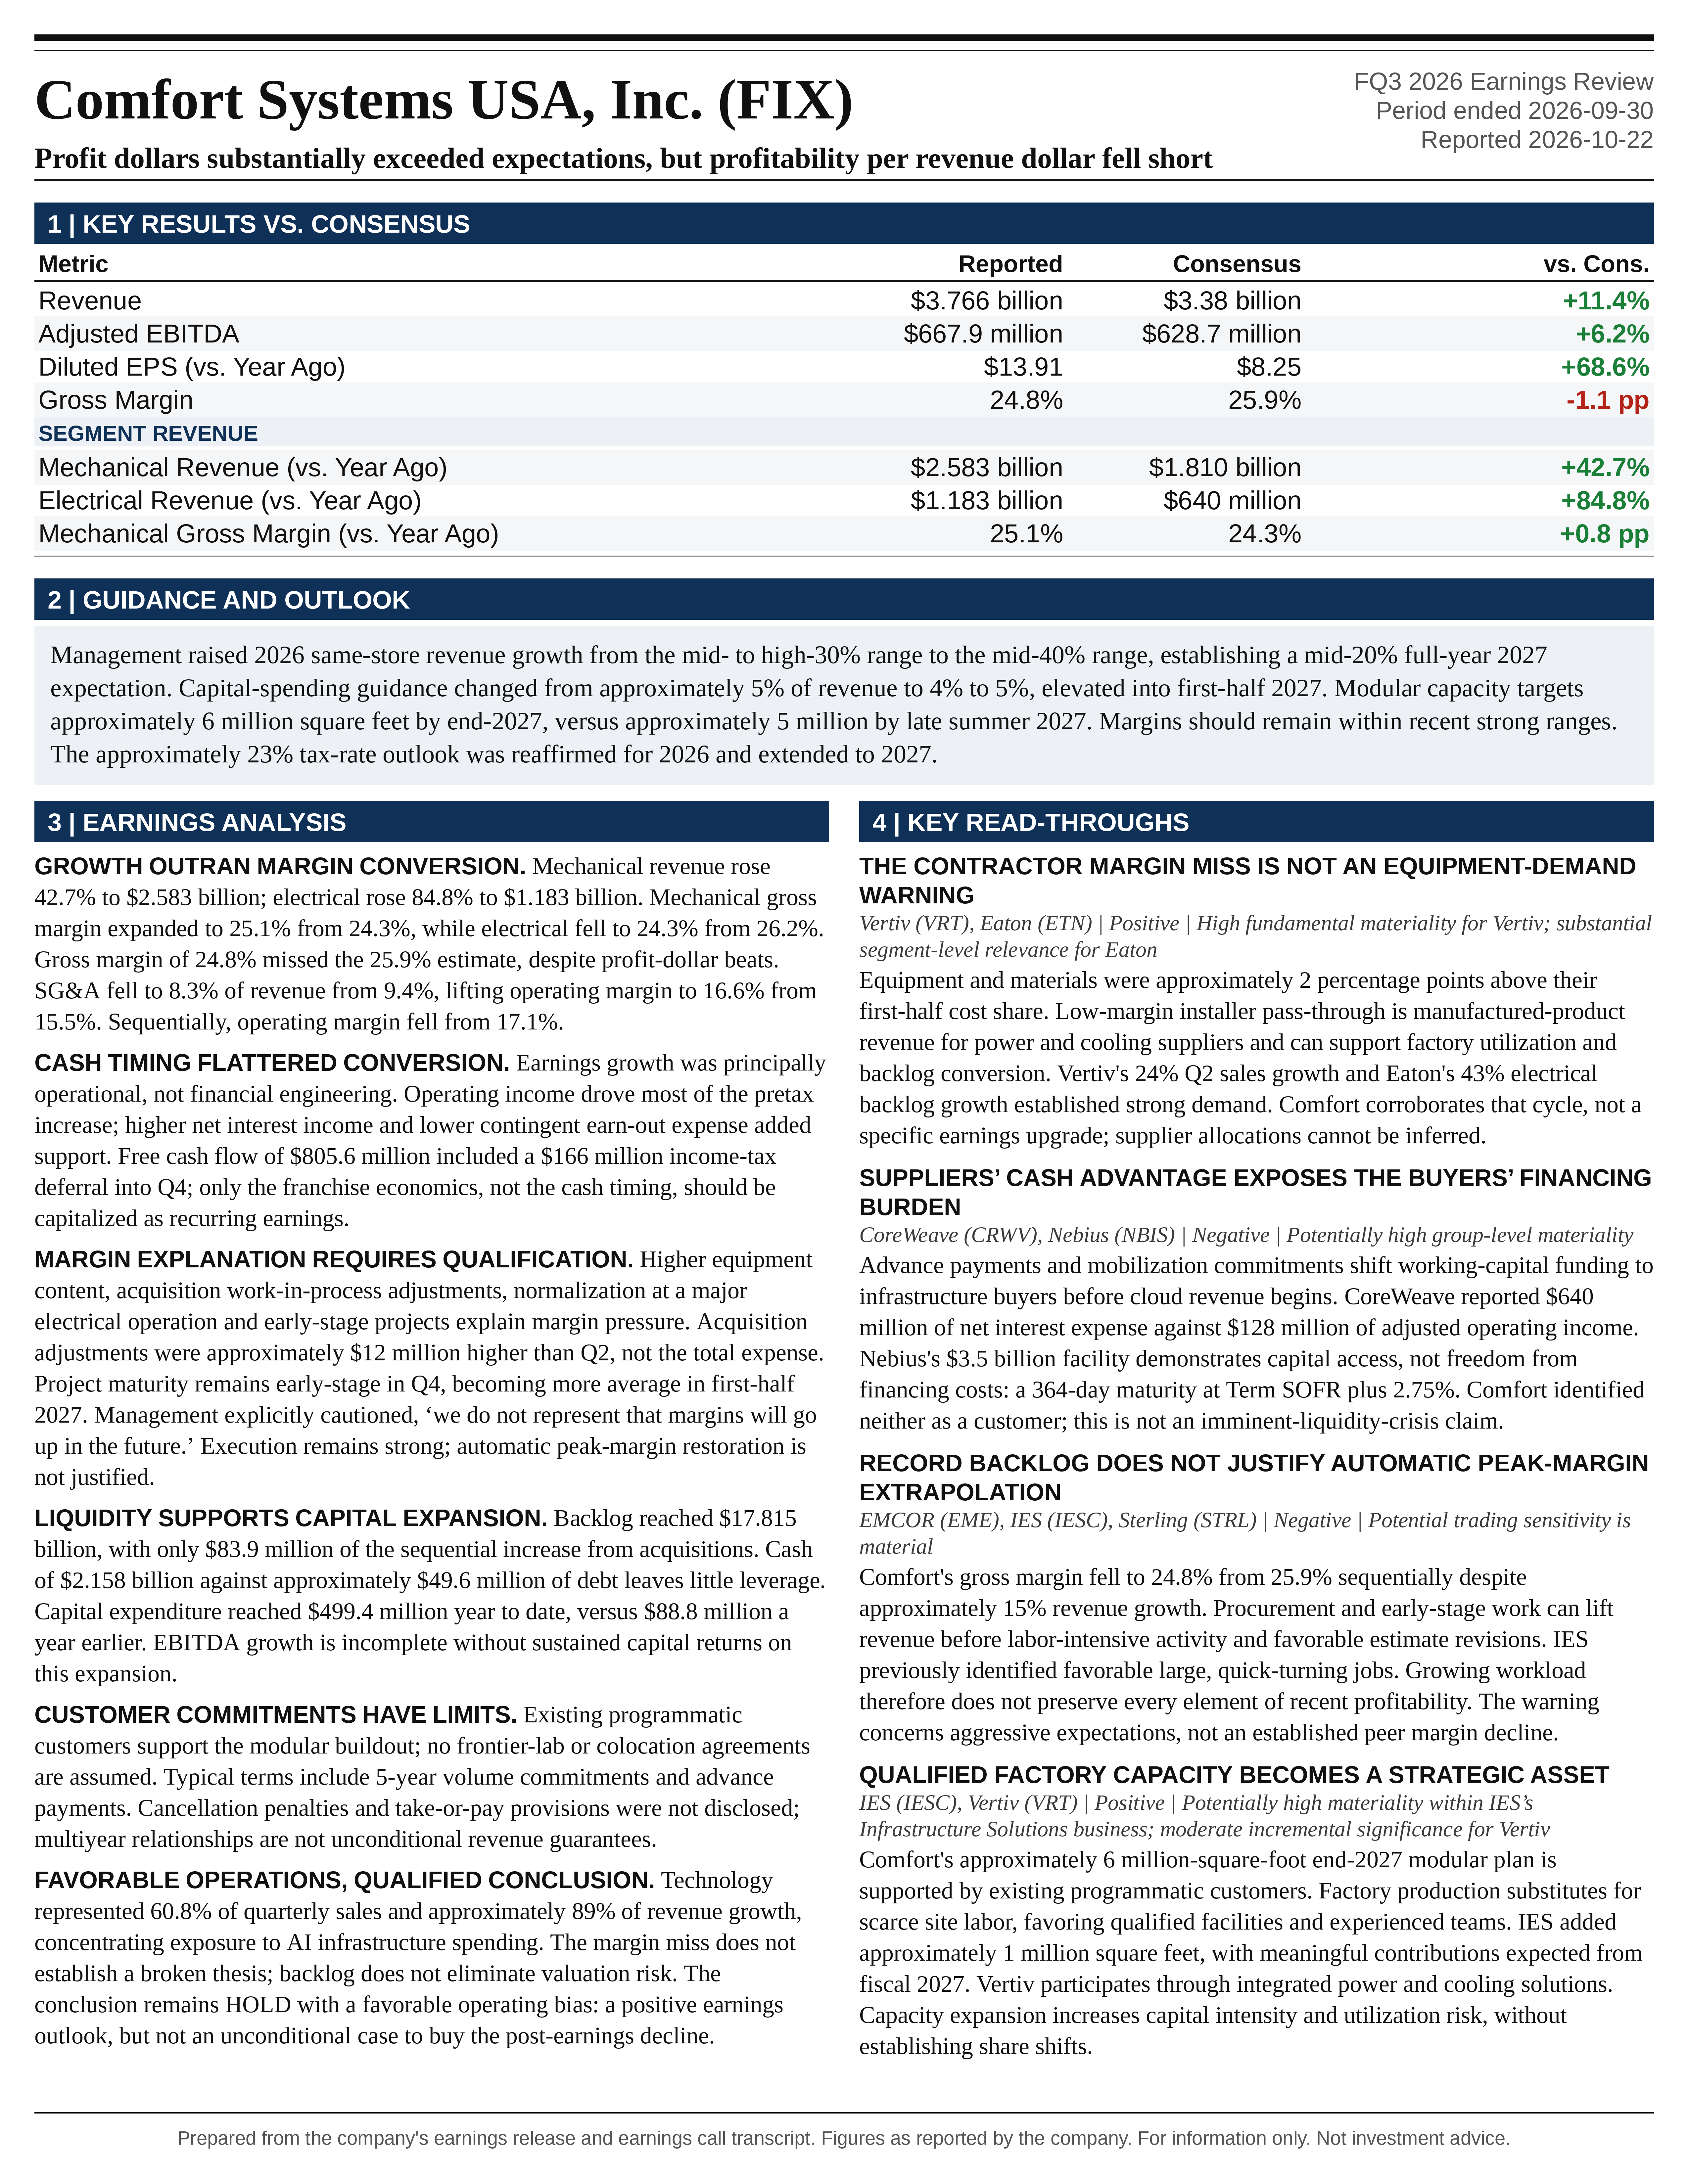
Comfort Systems USA, Inc. (FIX) FQ3 2026 earnings: Profit dollars substantially exceeded expectations, but profitability per revenue dollar fell short. Full earnings analysis, key read-throughs, and the one-page exhibit from Atlas Peak Research.
Comfort Systems USA, Inc. (FIX)
Sector: Industrials · FQ3 2026 · Period end September 30, 2026 · Reported October 22, 2026
Comfort Systems USA’s Q3 2026 results support a positive earnings outlook, but not an unconditional recommendation to buy the post-earnings decline.
Download the one-page report (PDF)
View one-page exhibit
Download analysis (.md)
Download read-throughs (.md)
Post to X
One-Page Exhibit
Earnings Analysis
EXECUTIVE CALL SUMMARY: Comfort Systems USA Inc. (10/23/26)
Comfort Systems USA’s Q3 2026 results support a positive earnings outlook, but not an unconditional recommendation to buy the post-earnings decline. The appropriate conclusion is HOLD with a favorable operating bias: demand, backlog, customer commitments, and execution remain unusually strong, while the investment debate has shifted toward sustainable margins, cash-flow normalization, capacity expansion returns, and the valuation appropriate for increasingly concentrated technology exposure. The quarter did not establish a deterioration in demand. It did demonstrate that exceptional revenue growth does not necessarily produce sequential margin expansion.
Revenue increased 53.7% to $3.77 billion, operating income increased 64.8% to $624.6 million, and diluted EPS increased 68.6% to $13.91. Revenue exceeded the supplied Bloomberg consensus by 11.4%, while adjusted EBITDA exceeded consensus by 6.2%. Gross margin of 24.8% missed the 25.9% estimate and declined from 25.9% in Q2. The distinction is important: profit dollars substantially exceeded expectations, but the profitability of each revenue dollar fell short. Bloomberg reported an intraday share-price decline of as much as 13%, following a 37% year-to-date gain through the preceding close. That reaction is consistent with a reassessment of margin expectations and valuation, rather than evidence that the operating results were weak in absolute terms.
The strongest forward indicator was backlog of $17.81 billion, up 90.0% year over year and 26.7% sequentially. Acquisitions explain only a small portion of that increase. Same-store backlog increased 85.4% year over year, and the sequential same-store increase was $3.67 billion. Management raised its 2026 same-store revenue growth expectation from the mid- to high-30% range communicated in July to the mid-40% range, while establishing a clearer full-year 2027 expectation in the mid-20% range. The modular capacity plan increased to approximately 6 million square feet by the end of 2027, supported by existing programmatic customers rather than contingent on signing new frontier-lab or colocation programs.
The margin explanation is credible but requires qualification. Equipment and materials represented a larger share of project costs, acquisition-related work-in-process adjustments increased, a major electrical operation normalized from unusually high Q2 profitability, and a larger proportion of work remained at early stages of completion. Filed disclosures also show that acquired businesses diluted reported gross margin and that favorable revenue-estimate adjustments were lower relative to revenue than in the first half. These factors support the interpretation that headline margin compression does not necessarily indicate deteriorating execution. They do not establish that margins must rebound or that all adjustments should be added back.
Cash generation was exceptional, but a substantial portion reflected favorable billing and payment timing. Q3 free cash flow was $805.6 million, including a $166 million benefit from income-tax payments deferred into Q4. The balance sheet also reflects substantial customer funding of future work. The central investment distinction is therefore between strong franchise economics and unusually favorable current cash timing. Both are positive, but only the former should be capitalized as a recurring earnings stream.
RESULTS VERSUS EXPECTATIONS AND HISTORICAL PERFORMANCE
The revenue beat was unusually large. Actual revenue of $3.766 billion exceeded the $3.38 billion Bloomberg consensus by approximately $386 million. Adjusted EBITDA of $667.9 million exceeded the $628.7 million estimate by approximately $39 million, while pretax income of $635.1 million exceeded the $581.2 million estimate by 9.3%. Operating cash flow of $1.010 billion exceeded the $709.1 million estimate by 42.5%. An EPS consensus was not included in the supplied Bloomberg notice, so a precise EPS surprise cannot be established from that source.
The gross-margin miss did not translate into a gross-profit-dollar miss. Applying the consensus gross margin of 25.9% to consensus revenue implies approximately $875 million of gross profit, compared with actual gross profit of $934.5 million. This calculation is indicative because separately aggregated consensus metrics need not represent an internally consistent forecast. Nevertheless, it illustrates the quarter’s central trade-off: substantially greater activity more than offset lower-than-expected profitability per revenue dollar.
At actual revenue, achieving the 25.9% consensus gross margin would have generated approximately $41 million of additional gross profit. That amount is economically meaningful. Using a 23% tax rate and the reported diluted share count, 100 basis points of quarterly margin equates to approximately $0.83 of EPS, assuming no offsetting changes elsewhere. A small change in the sustainable margin assumption can therefore materially alter forward earnings and valuation.
SG&A increased 36.8% to $314.2 million, above the $293.3 million consensus, but declined to 8.3% of revenue from 9.4% a year earlier. Revenue growth substantially exceeded overhead growth, providing approximately 110 basis points of year-over-year SG&A leverage. Operating margin consequently increased to 16.6% from 15.5%, despite essentially unchanged reported gross margin. The year-over-year incremental operating margin was approximately 18.7%, demonstrating that the business continued to convert incremental activity into attractive operating profit.
Sequential performance was more mixed. Revenue increased 15.3% from Q2, gross profit increased 10.7%, operating income increased 11.9%, and EPS increased 11.0%. Operating margin declined from 17.1% to 16.6%, and sequential incremental operating margin was approximately 13.3%. The quarter was therefore simultaneously an improvement in absolute profitability and a moderation in incremental profitability.
Earnings growth was principally operational rather than financial engineering. Net income increased 67.7%, while the diluted share count declined approximately 0.6% year over year. Higher net interest income and lower contingent earn-out expense provided additional support, but the $245.7 million increase in operating income accounted for most of the $264.6 million increase in pretax income. The effective quarterly tax rate increased to approximately 23.0% from 21.3%, partially offsetting operating improvement.
SEGMENT PERFORMANCE AND THE ORGANIC GROWTH DISTINCTION
Mechanical revenue increased 42.7% to $2.583 billion, while electrical revenue increased 84.8% to $1.183 billion. Mechanical gross profit increased to $647.3 million, with gross margin expanding to 25.1% from 24.3%. Electrical gross profit increased to $287.2 million, but reported gross margin declined to 24.3% from 26.2%.
A material clarification is required regarding electrical organic growth. The call includes a reference to approximately 80% organic electrical growth. The Q3 Form 10-Q instead attributes $174.1 million of the electrical segment’s $542.9 million revenue increase to acquisitions and $368.8 million to same-store activity. Relative to the prior-year electrical revenue base, those figures imply approximately 57.6% same-store growth and approximately 27.2 percentage points of acquisition contribution. The 84.8% figure is reported growth, not organic growth. The filed revenue bridge should govern the analysis.
Mechanical growth was much more purely organic. Only $7.5 million of its $772.4 million revenue increase came from the newly acquired modular business, implying approximately 42.2% same-store growth. At the consolidated level, same-store growth was 46.3%, with acquisitions contributing another 7.4 percentage points. Approximately 86% of the consolidated revenue increase therefore came from existing operations.
The segment operating-margin comparison is less favorable for electrical than the gross-margin normalization alone suggests. Mechanical operating margin increased to approximately 18.2% from 15.9%, while electrical operating margin declined to approximately 14.7% from 16.9%. These segment figures exclude corporate overhead. Electrical operating income still increased strongly, but its reported earnings conversion deteriorated. The conclusion that normalized electrical gross margin was approximately stable should not be extended to a claim that all electrical profitability measures were stable.
Mechanical improvement was supported by modular profitability reaching approximately the average profitability of the broader business. Management identified modular as the largest mix-related contributor to mechanical operating-margin improvement, while also citing stronger performance elsewhere, including piping. This matters because the modular thesis is no longer simply rapid revenue expansion from a lower-margin starting point. It increasingly includes the elimination of an historical profitability discount.
WHY GROSS MARGIN DECLINED
Management’s explanation separates into several overlapping effects rather than a single deterioration in pricing or execution.
The first effect was project cost mix. Materials and equipment represented approximately 2 percentage points more of costs than their first-half average. Such items carry lower margins than skilled labor, so an increase in equipment throughput can lift reported revenue while depressing gross-margin percentage. Management emphasized that operating leaders focus on returns generated by scarce craft labor rather than markups on purchased equipment. George stated, “They worry about their return on electricians and plumbers.”
This distinction is economically relevant, but it does not make revenue mix irrelevant to valuation. If a higher proportion of future revenue consists of lower-margin equipment pass-through, a revenue-based growth forecast can overstate the growth of economic value added. Gross profit per labor hour, labor productivity, and cash returns on deployed capacity become more informative than revenue growth alone. Those operating metrics were discussed directionally but not quantified.
The second effect was acquisition accounting. George stated that purchase adjustments associated with acquired work-in-process were approximately $12 million higher than in Q2. Relative to Q3 revenue, that incremental cost represents approximately 32 basis points of gross margin, or approximately $0.26 per share after tax. It explains a meaningful portion, but not all, of the sequential gross-margin decline. The $12 million is the increase from Q2, not the total acquisition-related expense, and it should not be treated as a complete normalization of current earnings.
The third effect was normalization at a major electrical subsidiary. Management said that this operation represents more than half of electrical revenue and generated gross margins above 30% in Q2. Q3 margins remained above the company average but fell below that exceptional level. This indicates that Q2 benefited from unusually strong profitability at a highly influential operation. It also highlights operating concentration: a single subsidiary can materially affect consolidated margin progression, even if that subsidiary serves multiple customers and projects.
The fourth effect was the maturity of projects. Early-stage work generally retains more contingency against uncertain labor productivity, scheduling, weather, subcontractor performance, and commissioning outcomes. Favorable estimate revisions tend to become more visible as work advances. George expected the project portfolio to remain relatively early-stage in Q4 and to return toward a more average maturity profile in the first half of 2027. This provides a plausible margin catalyst, but not a commitment to a specific quarterly rebound.
The most important limiting statement was explicit: “we do not represent that margins will go up in the future.” The operating explanation supports confidence in execution; it does not support automatically restoring peak margins in every forward quarter.
ACQUISITION MIX AND CONTRACT ACCOUNTING
The Form 10-Q provides additional evidence that headline gross margin understates improvement within the existing business. Acquisitions contributed approximately $181.6 million of quarterly revenue but only $24.2 million of gross profit, implying an aggregate acquired-business gross margin of approximately 13.3%. Excluding those contributions produces an indicative same-store gross margin of approximately 25.4%, compared with reported consolidated gross margin of 24.8%.
This is a useful analytical bridge, not a company-reported adjusted margin. The acquired-business contribution includes differences in business mix, acquisition timing, and potentially purchase-accounting effects. It does not establish that the acquired companies’ mature cash margins are structurally limited to 13.3%. It also overlaps with management’s discussion of purchase adjustments, so the benefits from excluding acquired operations and adding back acquisition accounting should not be stacked without a detailed reconciliation.
The prior-year electrical comparison also requires adjustment. The filing identifies $15.5 million of previously unrecognized revenue associated with a customer emerging from bankruptcy. Removing that amount from both prior-year electrical revenue and gross profit produces an approximate gross margin of 24.4%, close to Q3 2026’s 24.3%. This reconciles management’s statement that the prior-year discrete benefit increased electrical margin by approximately 180 basis points. Simply dividing the gain by reported revenue would overstate its margin effect because the gain affected both numerator and denominator.
Contract-estimate adjustments remain an important component of reported results. The Q3 filing states that changes in estimates associated with previously partially satisfied performance obligations increased quarterly revenue by 4.5%, compared with 4.0% in Q3 2025. The corresponding 9-month percentages were 6.6% and 4.6%. Applying those rounded percentages to reported revenue implies approximately $169 million of favorable revenue adjustments in Q3 and approximately $484 million in the first half, equivalent to approximately 7.9% of first-half revenue.
The lower contribution from favorable adjustments supports the argument that Q3 profitability was achieved with less help from prior-period estimate revisions than in the first half. However, it does not permit a precise calculation of “underlying gross margin” simply by subtracting the revenue-adjustment percentage from reported margin. Contract revisions can affect both revenue and estimated costs, and removing revenue also changes the margin denominator. These adjustments reflect construction accounting and project execution, not automatically low-quality earnings, but their magnitude increases the importance of conservative estimates and disciplined closeout accounting.
The appropriate interpretation is that early-stage project mix plausibly depressed current recognized profitability relative to mature-project economics. The offsetting risk is that future favorable revisions depend on actual execution. Contingency retention is not an earnings reserve that can be assumed to release on a predetermined schedule.
BACKLOG: EXCEPTIONAL VISIBILITY WITH GREATER CONCENTRATION
Backlog increased to $17.815 billion from $14.06 billion at June 30 and $9.377 billion a year earlier. The sequential increase included only $83.9 million from the Q3 acquisitions. Almost all of the increase therefore reflected expansion of the existing book rather than acquired backlog.
The growth was particularly concentrated in technology-facing operations. The filing attributes approximately $1.51 billion of sequential same-store backlog growth to the Texas electrical operation, $978.1 million to the large Texas modular operation, $583.4 million to a Virginia operation, and $505.7 million to another Texas operation. Those identified contributions account for approximately 97% of the reported $3.67 billion same-store sequential increase.
This concentration strengthens the evidence that customers are making large commitments to specific delivery platforms. It also means that geographic breadth and the number of subsidiaries should not be confused with diversification of incremental earnings risk. A small group of operations is responsible for much of the recent increase in future workload.
Management described the duration of larger projects as approximately 18 to 24 months, compared with historically much shorter visibility. The filing provides a more precise conversion framework: approximately 65% to 75% of remaining performance obligations is expected to become revenue over the next 12 months. Applied to current backlog, that represents approximately $11.6 billion to $13.4 billion of revenue through September 2027, with the balance thereafter.
The 18-to-24-month statement should therefore be interpreted as the reach of the larger-project schedule, not as the average duration of every backlog dollar. Nor does the $17.8 billion backlog equal 2027 revenue guidance. The conversion window includes Q4 2026, and future revenue will also include new awards, service activity, and short-duration projects not fully represented in backlog.
Management’s clearest description of the demand environment was McKenna’s statement that “the governor isn’t demand, the governor is really just labor.” Customers are committing earlier and for larger scopes because delivery capacity is scarce. This improves scheduling visibility and bargaining power, but it also creates the possibility that exceptional current bookings partially represent earlier placement of future commitments. Slower bookings in a subsequent quarter would not automatically indicate weaker end demand.
GUIDANCE CHANGES AND THE 2027 EARNINGS FRAMEWORK
The 2026 same-store revenue outlook improved materially. On the July 24 call, management expected growth in the mid- to high-30% range. On October 23, that increased to the mid-40% range. Because both descriptions are qualitative ranges, the change should not be presented as an exact numerical revision. It represents a high-single-digit percentage-point increase in the approximate annual growth expectation.
The revision is particularly notable because first-half same-store growth had already been approximately 47%. July’s outlook therefore implied a substantial second-half slowdown. Instead, Q3 same-store growth remained 46.3%, and year-to-date growth was 46.9%. Actual performance substantially exceeded the deceleration embedded in the earlier outlook.
The updated annual outlook still implies some moderation in Q4 relative to the year-to-date rate. Using the prior-year revenue weighting and the approximate 45% annual midpoint suggests growth around 40% in the remaining quarter, subject to the precise same-store perimeter. That is an analytical implication rather than separate management guidance. It would remain exceptional growth against a demanding comparison.
For 2027, management now expects full-year same-store revenue growth in the mid-20% range. This is more explicit than the July discussion, but it should not be described as entirely disconnected from prior commentary. In July, an analyst asked whether a high-20% exit growth rate was a reasonable starting point for 2027, and management responded that its outlook was its best estimate while emphasizing bottom-up workforce planning and tougher comparisons. That exchange was not a formal high-20% full-year 2027 commitment. The current mid-20% outlook is consequently best characterized as a clearer annual framework, rather than either an unequivocal upgrade or a formal guidance cut.
The change from approximately 45% growth in 2026 to approximately 25% in 2027 is a deceleration in growth, not a contraction in demand. At a constant comparable perimeter, those rates compound to approximately 81% growth over 2 years. The operating challenge remains the successful delivery of an extraordinarily expanded revenue base.
Gross-margin guidance was broadly maintained in character and extended into 2027. Management expects margins to remain within the strong ranges achieved on average in recent quarters. That language does not establish 25.9% as a floor, nor does it imply that Q3’s 24.8% is the permanent ceiling. The approximately 23% tax-rate outlook was maintained for the remainder of 2026 and extended to 2027. No formal 2027 EPS, operating-margin, or free-cash-flow target was provided.
Capital spending guidance moved from approximately 5% of revenue in July to 4% to 5%, with elevated spending expected into the first half of 2027. The lower percentage range should not automatically be interpreted as lower absolute investment because the revenue outlook increased. Capacity commitments and spending timing remain the more relevant indicators.
MODULAR: GREATER SCALE WITHOUT RELAXING CUSTOMER STANDARDS
The modular capacity plan now calls for more than 4 million square feet by the end of 2026 and approximately 6 million square feet by the end of 2027. In July, the company expected approximately 5 million square feet by late summer 2027. The new terminal capacity figure is 20% higher, but the target date is also later. It is therefore a larger expansion plan, not a clean 20% increase for an identical delivery date.
The most important commercial disclosure was that the announced buildout is supported by existing programmatic customers. Production for a frontier lab and colocation providers is already occurring, but those relationships have not reached the contractual threshold management considers programmatic. Their potential conversion remains an additional opportunity rather than a prerequisite for the existing expansion plan.
George’s clarification was unusually direct: “we haven’t yet reached terms where we’re willing to accept business from these people.” The constraint is not simply whether new customers want the product. It is whether the economics, commitments, credit exposure, and payment terms justify dedicating capital and labor to them.
Existing programmatic arrangements typically involve 5-year volume commitments, mobilization payments, and delivery payments. Those commitments provide greater investment visibility, but the call did not disclose cancellation penalties, take-or-pay provisions, parent guarantees, price-reset mechanisms, or the extent to which committed volumes are included in reported backlog. A multiyear customer relationship should not be treated as equivalent to an unconditional multiyear revenue guarantee.
Modular represented approximately 17% of year-to-date revenue, or roughly $1.68 billion. Its stable share despite rapid expansion means the traditional business is also growing strongly. Modular is important, but it is not sufficient by itself to explain the consolidated trajectory. Illustratively, if modular revenue increased 50% from a 17% starting mix, it would contribute approximately 8.5 percentage points to group growth. The remaining business would still need to grow approximately 20% to achieve 25% consolidated growth. This is a mix sensitivity, not an assumption that floor-space growth translates directly into revenue growth.
Management emphasized the physical constraints: “this is not scalable the way you can just print another copy of software.” Facilities require specialized equipment, automation, staffing, production learning, and customer qualification. End-of-year square footage therefore overstates average capacity available during the year, and square footage alone does not establish throughput, utilization, or returns on investment.
The strategic benefit of modular is the ability to industrialize portions of construction and improve labor productivity. The associated risk is a growing fixed-asset base whose returns depend on utilization and customer continuity. Standardized, versatile products and facilities with multiple potential uses reduce this risk. Highly customized capacity dependent on a single program increases it.
TECHNOLOGY EXPOSURE AND THE NATURE OF THE GROWTH
The quarterly filing shows technology revenue of $2.290 billion, up approximately 104% year over year and representing 60.8% of quarterly sales. The 59% figure discussed on the call refers to year-to-date revenue, not specifically Q3. Technology’s quarterly share increased from 45.8% a year earlier.
Approximately 89% of the consolidated year-over-year revenue increase came from technology. Revenue outside technology nevertheless increased approximately 11%, indicating that the rest of the business was not broadly contracting. The distinction is that non-technology activities supported underlying business stability, while technology drove the overwhelming majority of incremental growth.
Industrial markets represented approximately 76% of year-to-date revenue, including technology. Institutional markets represented approximately 16%, and commercial markets approximately 8%. These categories should not be added to construction, modular, or service percentages because they describe different classifications of the same revenue.
Service revenue increased 13% in Q3, with management describing record profitability. That provides a valuable recurring component, but service now represents only approximately 10% of revenue. Its stabilizing effect on consolidated results is consequently much smaller than the construction exposure. The current earnings profile is dominated by project work, including new-building construction, rather than a defensive maintenance franchise.
The growing installed base may create future service opportunities, but the call did not quantify attachment rates, contract duration, or the timing of that conversion. Future service revenue should therefore be treated as an additional opportunity rather than an established offset to a potential construction downturn.
LABOR, EXECUTION, AND GEOGRAPHIC CAPACITY
Management’s confidence in backlog execution rests on detailed labor planning rather than an expectation that capacity will appear after work is accepted. McKenna stated that work is labor-planned before commitment, while Lane emphasized, “we’re not going to take work that we can’t do at a very high level.”
The company cited more than 25,000 employees, a traveling workforce, collaboration among subsidiaries, contract craft operations, and acquisitions that place labor in attractive markets. However, no specific headcount growth target, wage-inflation assumption, utilization rate, or quantified productivity forecast was provided for 2027. Revenue growth cannot therefore be translated directly into the required employee increase.
The operating model provides flexibility, but not immunity from cost pressure. Traveling labor can address geographic mismatches while increasing accommodation, travel, supervision, and retention costs. Rapid expansion can also dilute experienced supervisory coverage. The risk is not simply an inability to hire enough craft workers; it includes whether newly expanded crews can reproduce the productivity and safety of established teams.
Management identified Texas, Georgia, Mississippi, the Carolinas, Utah, and Iowa as particularly strong. It also described substantial semiconductor opportunities in Arizona while questioning whether pursuing them would be preferable to existing opportunities in Texas. That selectivity is positive. The relevant objective is maximizing risk-adjusted profit per scarce labor resource, not accepting the greatest possible volume of work.
POWER, REGULATION, AND COUNTERPARTY RISK
Management reported no current project delays from data-center moratoriums and stated that power arrangements are generally resolved by the time traditional construction prospects reach Comfort’s stage of engagement. This lowers the apparent near-term risk that the disclosed pipeline is dominated by highly preliminary projects without an identified power solution.
The statement should not be generalized into a conclusion that power availability or regulation is immaterial to the broader industry. Comfort sees projects after substantial development decisions have already been made. Its direct experience therefore reflects a selected subset of projects, not the full universe of proposed data centers.
Modular production reduces dependence on the manufacturing location matching the customer site. It does not remove the destination project’s dependence on power, permitting, financing, and eventual commissioning. Geographic flexibility can mitigate where work is produced; it cannot eliminate whether the end customer can complete the project.
Counterparty underwriting was a central and constructive feature of the call. In traditional construction, the immediate payment obligation often belongs to a national general contractor. In modular, direct customer advances and delivery payments are more important. Management evaluates payment timing, financial strength, the usefulness of the completed asset to alternative owners, and the ability to redeploy manufacturing capacity.
George explicitly criticized competitors accepting terms that effectively finance customers and indicated that Comfort is willing to lose work rather than do so. This is a favorable signal because rapid revenue growth can conceal deteriorating credit quality when contractors become lenders to financially constrained customers.
The protection is incomplete. General-contractor credit risk can transmit end-customer stress, advances can be consumed during production, and lien rights do not guarantee immediate or full recovery. The appropriate conclusion is that Comfort appears disciplined in managing exposure, not that its contracts eliminate technology-sector financing risk.
CASH FLOW: STRONG ECONOMICS, FAVORABLE TIMING
The earnings release defines free cash flow as operating cash flow less capital expenditures plus proceeds from asset sales. Q3 operating cash flow of $1.010 billion, less $210.6 million of capital expenditure and plus $6.1 million of asset-sale proceeds, reconciles to reported free cash flow of $805.6 million.
Free cash flow increased 55.2% year over year and represented approximately 165% of net income. However, the $166 million tax-payment deferral materially enhanced that conversion. Removing only that timing benefit produces approximately $639.6 million of free cash flow, approximately 131% of net income and 23.2% above the prior-year quarter.
The filing identifies a further $29.8 million cash refund received in July, including $5.3 million of interest. Removing that receipt as well produces an illustrative timing-adjusted free-cash-flow figure of approximately $609.8 million. That is not a fully normalized measure because customer advances and other working-capital movements remain included. The associated after-tax interest benefit was approximately $4.2 million, or $0.12 per share, which is small relative to total EPS but relevant to a precise earnings-quality bridge.
Year-to-date operating cash flow was $2.538 billion, while free cash flow was $2.047 billion. The approximately $2 billion cash figure discussed verbally therefore corresponds more closely to free cash flow than operating cash flow. Both measures were exceptionally strong, but their distinction matters when assessing the funding available after capital investment.
The cash-flow statement demonstrates the importance of customer financing. Increased billings in excess of costs and deferred revenue contributed $1.693 billion of operating cash flow during the first 9 months. Receivable growth consumed $1.167 billion, while accounts payable and other current liabilities contributed $681 million. These are genuine cash movements, but they reflect the timing of a rapidly expanding project portfolio as well as underlying profitability.
Contract liabilities increased to $3.872 billion from $2.120 billion at year-end. The company recognizes revenue and incurs costs against these balances as work progresses. A slowdown in new advances could therefore reduce cash conversion before reported earnings deteriorate. Conversely, continued growth under favorable terms could sustain unusually strong cash generation for longer than a conventional working-capital model would imply.
The scheduled Q4 payment of deferred taxes creates an identifiable near-term cash-flow headwind. A sequential decline in cash conversion should not automatically be interpreted as an operating deterioration. More important warning signs would be weakening collections, reduced advance-payment coverage, rising unbilled exposure, or substantial cash consumption beyond the disclosed timing reversal.
BALANCE SHEET, CAPITAL INVESTMENT, AND SHAREHOLDER RETURNS
Cash was $2.158 billion and total debt approximately $49.6 million, producing net cash of approximately $2.108 billion. Against trailing adjusted EBITDA of approximately $2.3 billion, the company has little conventional financial leverage. The principal risk lies in operating commitments, project execution, and capital deployment rather than refinancing.
Not all cash should be treated as immediately distributable surplus because substantial customer funding supports future performance obligations. Equally, contract liabilities should not simply be deducted from cash as though they were financial debt. The appropriate assessment requires the associated receivables, project costs, future margins, and expected cash timing to be considered together.
Capital expenditure reached $499.4 million year to date, compared with $88.8 million in the prior-year period. Q3 spending of $210.6 million represented approximately 5.6% of quarterly revenue. Net property and equipment increased to $862.7 million from $388.0 million at year-end. Comfort is becoming more capital intensive as it expands owned production facilities and prefabrication capabilities.
That investment can improve productivity and customer retention, but it changes the downside characteristics of the business. Building ownership and specialized equipment create longer-duration commitments than labor-only expansion. Depreciation will also follow the expanding asset base, making EBITDA growth an incomplete measure of shareholder economics unless accompanied by sustained returns on capital.
The shareholder-return disclosure requires clarification. The call’s approximately $349 million figure corresponds to repurchases including applicable excise tax, rather than total cash returned through repurchases and dividends. The filing reports $346.1 million of cash share repurchases and $84.4 million of dividends, totaling approximately $430.5 million of cash shareholder distributions through September.
Cash repurchases represented approximately 16.9% of year-to-date free cash flow, consistent with management’s stated historical allocation of 15% to 20%. The quarterly dividend increased from $0.90 to $1.00, an 11.1% increase. Relative to Q3 EPS, the new quarterly dividend represents only approximately 7.2%, confirming that capital investment and discretionary deployment remain much more important than dividend income to the investment case.
The August acquisitions of Boys Electrical and NeoPod add more than $100 million of expected annual revenue. The filing identifies preliminary purchase prices of $63 million and $48 million, respectively. Their immediate consolidated scale is modest; their strategic value lies in labor access, geographic positioning, and additional modular applications. George’s statement that “we will not do a deal just because we have money” is particularly relevant given the growing cash balance and strong acquisition market.
CFO SUCCESSION AND ORGANIZATIONAL CONTINUITY
Bill George’s planned retirement is a meaningful leadership event because his responsibilities extend beyond financial reporting into acquisitions and operational oversight. Julie Shaeff’s promotion provides continuity in accounting, controls, and financial management, while the transition after the 2026 Form 10-K and George’s subsequent transition period reduce immediate execution risk.
The succession should not be assumed either to be immaterial or to signal an operating problem. Nothing in the call establishes that the retirement reflects weaker business conditions. Nevertheless, replacing a long-tenured executive’s judgment in project risk, customer terms, and acquisitions is broader than replacing the CFO title.
The relevant evidence will be continuity in acquisition discipline, conservative contract estimates, cash-collection practices, and the quality of disclosure. KeyBanc’s supplied commentary characterized the succession as expected and likely seamless. That is a constructive external assessment, but successful continuity will ultimately be demonstrated through operating decisions rather than tenure alone.
ANALYTICAL SCENARIOS AND INVESTMENT IMPLICATIONS
A reasonable base case, assigned an illustrative 55% probability, is that 2027 same-store revenue grows approximately 25%, gross margins remain within the recent strong range, and operating margin remains around 16.5% to 17.0%. Using Q3’s 16.6% operating margin as a reference rather than a full-year forecast, that combination implies approximately 24% to 28% growth in operating earnings on a comparable revenue base. The central drivers are backlog conversion, continued labor availability, and stable project economics. Additional programmatic modular customers are not necessary for this case.
A bull case, assigned an illustrative 25% probability, assumes 30% to 35% revenue growth and operating margin of approximately 17.5% to 18.0%. Relative to the same reference margin, operating earnings would increase approximately 37% to 46%. This requires successful capacity commissioning, strong utilization, continued favorable customer terms, and project maturation that produces better recognized profitability without offsetting cost pressure. New programmatic customers would provide further support, but should not be assumed before acceptable contracts are signed.
A bear case, assigned an illustrative 20% probability, assumes 0% to 10% revenue growth and operating margin of approximately 13.5% to 15.0%. Relative to the same reference, operating earnings would decline approximately 1% to 19%. Potential causes include project deferrals, weaker new orders, labor inefficiency, reduced favorable estimate revisions, and underutilized expansion capacity. A more severe downturn involving a 20% revenue decline and a 13% operating margin would reduce operating earnings by approximately 37%. This stress case illustrates the operating leverage embedded in the expanded business; it is not management guidance.
These probabilities are judgmental scenario weights, not statistically established forecasts. Confidence is higher in near-term revenue visibility than in the sustainable margin ceiling or the valuation investors will assign to the earnings stream. Strong earnings growth can coexist with a weak share price if the valuation multiple contracts.
The supplied notice does not establish an independently verified closing price or a current forward valuation. Consequently, the intraday decline alone cannot establish that the shares became inexpensive. The investment decision requires a valuation based on sustainable earnings and cash conversion rather than extrapolation of peak margins or current advances.
The principal positive catalysts are execution against the enlarged backlog, evidence of more normal project maturity in the first half of 2027, delivery of planned modular capacity, and continued improvement in mechanical profitability. The scheduled Q4 tax-payment reversal is a known cash-flow event rather than an adverse operating catalyst. Conversion of additional modular customers into durable programmatic relationships would be incremental upside only if the commitments and payment protections are economically attractive.
The main thesis-breakers are sustained margin deterioration after project mix normalizes, material adverse contract-estimate revisions, cancellations or delays that impair backlog conversion, weakening customer payment terms, and capacity expansion that fails to earn adequate returns. A sequential bookings slowdown by itself would be insufficient to invalidate the thesis because current awards may have been pulled forward and capacity acceptance remains constrained.
From a portfolio perspective, Comfort should be treated primarily as an AI and technology-infrastructure capital-spending exposure, despite its industrial classification. Its earnings sensitivity increasingly overlaps with data-center equipment, electrical infrastructure, thermal management, and hyperscaler investment. It can diversify company-specific product risk within that theme, but it does not provide substantial diversification from the theme’s underlying funding and spending cycle.
The recommended stance remains HOLD, with incremental purchases dependent on a demonstrated valuation margin of safety. No price-specific entry or exit level is justified without a verified market price and a consistent forward valuation. For conditional risk budgeting, a 0.5% to 0.75% portfolio allocation would translate a 40% stress drawdown into approximately 20 to 30 basis points of portfolio loss. A 15% decline from an eventual entry would warrant immediate review, while a confirmed deterioration in contract economics or counterparty protection would justify exit irrespective of price. These are illustrative risk limits, not a substitute for the portfolio’s actual aggregate technology-infrastructure exposure.
The quarter’s most defensible investment conclusion is that Comfort’s earnings power continues to expand faster than previously expected, while the quality and durability of that expansion require increasingly careful separation from accounting maturity, acquisition mix, customer advances, and capital intensity. The gross-margin miss is not sufficient evidence of a broken operating thesis. The backlog and guidance increases are not sufficient evidence that valuation risk has disappeared.
SOURCE BASIS
Financial comparisons are based on the October 23, 2026 earnings-call transcript, the supplied Bloomberg earnings notice and analyst commentary, the October 22 earnings release and Q3 Form 10-Q, the July 23 earnings release and July 24 earnings call, and the February 19, 2026 release of full-year 2025 results. Filed financial bridges take precedence where spoken descriptions differ. Calculated normalizations and scenarios are analytical estimates, not company guidance.
COMPANY EMPLOYEES ON THE CALL
• Brian E. Lane, Chief Executive Officer and Director. • Julie Shaeff, Senior Vice President and Chief Accounting Officer; designated successor to the Chief Financial Officer. • Trent McKenna, President. • William George, Executive Vice President and Chief Financial Officer.
RESEARCH ANALYSTS ON THE CALL
• Adam Bubes, Goldman Sachs. • Adam Thalhimer, Thompson Davis. • Brent Theilman, Oppenheimer & Co. • Brian Brophy, Stifel. • Joshua Chan, UBS. • Julio Romero, Sidoti & Company. • Kurt Yinger, D.A. Davidson. • Sangita Jain, KeyBanc Capital Markets. • Tim Mulrooney, William Blair.
Key Read-Throughs
KEY READ-THROUGHS FROM COMFORT SYSTEMS USA’S Q3 2026 EARNINGS CALL
Comfort Systems’ October 23 call indicates that the data-center construction cycle remains constrained primarily by delivery capacity rather than customer demand. The highest-conviction positive implications concern electrical infrastructure, cooling, specialized construction labor, and prefabricated production. The principal negatives concern extrapolating peak contractor margins and underestimating the financing required to secure scarce capacity. The most actionable distinction is that Comfort’s gross-margin disappointment partly reflected increased equipment throughput, which is not inherently negative for equipment manufacturers. Record backlog also provides stronger evidence of committed physical investment than of eventual AI monetization. The company relationships identified below are shared-market or competitive exposures unless otherwise stated; the call did not identify Comfort’s hyperscaler customers or equipment suppliers. Countries denote corporate domicile.
ELECTRICAL AND THERMAL INFRASTRUCTURE: THE CONTRACTOR MARGIN MISS IS NOT AN EQUIPMENT-DEMAND WARNING (READ-THROUGH 1)
Affected companies: Vertiv Holdings (VRT: USA) and Eaton Corporation (ETN: Ireland).
Directional impact and magnitude: Positive. High fundamental materiality for Vertiv’s data-center business; substantial segment-level relevance for Eaton’s electrical businesses, with a more moderate consolidated impact because Eaton serves additional markets. Confidence is high in the demand interpretation, but the call does not establish a specific earnings upgrade for either company.
The supporting evidence is unusually explicit. Comfort reported 54% revenue growth, approximately $17.8 billion of backlog, and a higher proportion of equipment and materials in project costs. Management said that this cost category was approximately 2 percentage points above its first-half average. McKenna explained: “equipment doesn’t carry the margin our labor does. So the percentage comes down even as the dollars go up.”
The transmission mechanism differs across the supply chain. Equipment is relatively low-margin pass-through revenue for an installer, but the same equipment represents manufactured-product revenue for power-distribution and cooling suppliers. Greater equipment deployment can therefore dilute Comfort’s gross-margin percentage while supporting suppliers’ factory utilization and backlog conversion. It would be analytically incorrect to transfer Comfort’s margin disappointment directly into a conclusion that manufacturers are discounting products or experiencing weaker demand.
Vertiv’s power and thermal-management portfolio and Eaton’s electrical infrastructure portfolio are exposed to the same underlying construction programs. Their own previously reported results already established strong demand: Vertiv reported 24% Q2 sales growth and raised its full-year outlook, while Eaton reported 43% year-over-year electrical backlog growth. Comfort’s call is additional evidence of continued physical execution into Q3 and 2027, not the first indication of the cycle.
The near-term catalysts are Vertiv’s October 28 results and Eaton’s November 3 results. The relevant disclosures are shipment conversion, order timing, production capacity, and manufacturing margins. Comfort’s higher equipment content does not prove that new OEM orders accelerated in the same quarter because equipment may have been ordered earlier. Over the next 12 to 24 months, the larger construction backlog supports demand durability, but no supplier allocation or incremental contract award can be inferred.
MODULAR DATA-CENTER INFRASTRUCTURE: QUALIFIED FACTORY CAPACITY BECOMES A STRATEGIC ASSET (READ-THROUGH 2)
Affected companies: IES Holdings (IESC: USA) and Vertiv Holdings (VRT: USA).
Directional impact and magnitude: Positive for qualified prefabrication capacity and integrated deployment capabilities. Potentially high materiality within IES’s Infrastructure Solutions business and moderate incremental significance for Vertiv. The associated negative is greater capital intensity and utilization risk, not evidence of current demand weakness.
Comfort expects modular capacity to exceed 4 million square feet by the end of 2026 and reach approximately 6 million square feet by the end of 2027. Critically, management said the announced expansion is supported by existing programmatic customers, rather than depending on prospective frontier-lab or colocation agreements. It also stated that established customers want more output than Comfort can supply.
The transmission mechanism is the substitution of controlled factory production for portions of labor-intensive site construction. Customers increasingly value repeatability, coordinated procurement, predictable commissioning, and reduced exposure to scarce field labor. This supports suppliers with functioning factories, experienced production teams, and qualified customer relationships, rather than companies that merely announce future capacity.
The read-through is especially relevant to IES. Its July results disclosed approximately 1 million square feet of additional production capacity over the preceding year, including acquired facilities being repositioned for existing customers. Management expected meaningful contributions from those operations beginning in fiscal 2027. Comfort’s customer-backed expansion independently supports the end-market rationale for that investment. It does not establish that IES has won work declined by Comfort.
Vertiv also participates through prefabricated power, cooling, and integrated data-center solutions. Its standardized platforms demonstrate that the opportunity spans equipment manufacturers and specialist contractors. This creates both a larger addressable market and potential overlap at the integration layer. Comfort’s expansion does not demonstrate Vertiv share loss, and the businesses may supply complementary portions of the same project.
The critical negative qualification is George’s statement: “this is not scalable the way you can just print another copy of software.” Buildings, automation, staffing, and production qualification must precede full output. Capacity measured at year-end is not equivalent to average productive capacity during that year, and additional square footage does not guarantee attractive returns.
The near-term catalysts are Vertiv’s October 28 update and IES’s next fiscal-year-end disclosure; an exact date for the latter was not verified. The longer-duration catalyst is successful fiscal 2027 facility ramp-up. Utilization, commissioning milestones, gross profit per production hour, and cash returns on expansion spending matter more than headline square footage.
SPECIALTY CONTRACTING: LABOR SCARCITY SUPPORTS AWARD QUALITY AND SELECTIVE PRICING POWER (READ-THROUGH 3)
Affected companies: EMCOR Group (EME: USA) and IES Holdings (IESC: USA).
Directional impact and magnitude: Positive. High relevance to data-center electrical and mechanical operations, with moderate consolidated upside potential for the more diversified EMCOR. Confidence is high that market conditions favor capable incumbents; company-specific growth rates and margins cannot be transferred from Comfort.
The central statement was McKenna’s observation that “the governor isn’t demand, the governor is really just labor.” Customers are committing earlier and for larger scopes to reserve capacity. Comfort’s backlog increased approximately $3.8 billion sequentially despite exceptional revenue conversion, and management expects approximately mid-20% same-store revenue growth in 2027.
The economic mechanism is stronger bargaining power for contractors that can credibly deliver skilled labor, supervision, scheduling, and commissioning. Scarce capacity allows these businesses to select projects by expected profitability, location, payment terms, and execution conditions rather than simply filling the order book. The benefit is therefore potentially better risk-adjusted contract economics, not just more revenue.
EMCOR’s July results already showed remaining performance obligations of $17.14 billion, up 43.9%, with Network and Communications among the strongest sources of growth. IES had already reported strong data-center-led expansion across Communications, Infrastructure Solutions, and Commercial & Industrial. Comfort’s call corroborates those established trends and provides additional support for their continuation into 2027. It does not predict results that those peers have already reported.
A particularly important competitive implication is that capacity constraints reduce the likelihood that every Comfort award represents a lost opportunity for a peer. Management described demand exceeding what the industry can deliver and acknowledged turning away opportunities. In that environment, several qualified contractors can expand simultaneously without a zero-sum redistribution of existing work.
There are limits to pricing power. Wage inflation, travel costs, supervisory shortages, and geographic mismatches can absorb higher project pricing. The favorable read-through applies most strongly to companies that secure acceptable terms before committing labor and avoid overextending their project portfolios.
EMCOR’s October 29 earnings are the nearest directly actionable catalyst. The key tests are backlog quality, project scheduling, electrical and mechanical profitability, and labor deployment. For IES, the next fiscal-year-end update and fiscal 2027 execution are more relevant than extrapolating Comfort’s reported electrical growth, which includes a substantial acquisition contribution.
SPECIALTY CONTRACTING: RECORD BACKLOG DOES NOT JUSTIFY AUTOMATIC PEAK-MARGIN EXTRAPOLATION (READ-THROUGH 4)
Affected companies: EMCOR Group (EME: USA), IES Holdings (IESC: USA), and Sterling Infrastructure (STRL: USA).
Directional impact and magnitude: Negative for aggressive margin expectations and valuation assumptions, rather than evidence of an immediate industry-wide earnings contraction. Potential trading sensitivity is material because modest margin changes can offset substantial revenue growth. Confidence is high in the accounting and project-mix mechanism; a specific peer margin decline is not established.
Comfort’s gross margin fell to 24.8% from 25.9% sequentially, even as revenue increased approximately 15%. Management cited higher equipment content, approximately $12 million of additional acquisition-related work-in-process adjustments, normalization at a major electrical subsidiary, and a greater proportion of early-stage projects. George explicitly stated that “we do not represent that margins will go up in the future.”
The precise transmission mechanism is a divergence between workload growth and recognized profitability. New projects may generate substantial procurement revenue before labor-intensive activity and before execution uncertainty permits favorable estimate revisions. Large backlogs can therefore increase revenue visibility while creating less visibility into quarterly margin realization.
This matters especially when a peer’s recent quarter benefited from favorable project closeouts, unusually attractive short-duration work, or mature contracts. IES’s July release explicitly identified large, quick-turning Commercial & Industrial jobs executed at favorable margins. That is a direct reason not to assume that a growing backlog preserves every element of the preceding quarter’s profitability.
Sterling’s expanding mission-critical electrical exposure also makes project stage and procurement mix more relevant to its consolidated results. It is no longer appropriate to analyze the company solely as a site-development contractor. EMCOR similarly requires segment-specific analysis rather than importing Comfort’s consolidated margin profile.
The magnitude can be illustrated without forecasting an actual deterioration. A 100-basis-point operating-margin reduction would lower operating income by approximately 9% at an unchanged revenue base and a 10.6% starting margin, EMCOR’s reported Q2 level. Strong revenue growth could offset that effect, but the sensitivity explains why a revenue beat alone may not protect a stock carrying ambitious profitability expectations.
The near-term catalysts are Sterling’s October 28 release and EMCOR’s October 29 release. The relevant question is whether incremental revenue is coming from procurement, newly mobilized projects, mature labor-intensive work, or favorable closeouts. Over 2027, successful project maturation could restore stronger earnings conversion. This is a warning against over-extrapolation, not a basis for indiscriminately shorting contractors with improving demand.
AI CLOUD INFRASTRUCTURE: SUPPLIERS’ CASH ADVANTAGE EXPOSES THE BUYERS’ FINANCING BURDEN (READ-THROUGH 5)
Affected companies: CoreWeave (CRWV: USA) and Nebius Group (NBIS: Netherlands).
Directional impact and magnitude: Negative for capital requirements, financing costs, and equity returns when capacity procurement precedes monetization. Potentially high group-level materiality because infrastructure expansion is central to both business models. Confidence is high in the financing mechanism, but the call does not establish that either company is a Comfort customer or has been refused capacity.
Comfort’s management emphasized customer financial strength, payment timing, and multiyear commitments. George said: “we haven’t yet reached terms where we’re willing to accept business from these people.” He also described programmatic customers as paying well ahead of performance and criticized competitors accepting terms that effectively finance customers.
The transmission mechanism is a transfer of working-capital responsibility toward the infrastructure buyer. Advance payments, mobilization funding, and long-duration commitments require cash before the resulting data-center capacity generates cloud revenue. If those payments must be financed, interest expense begins before utilization and revenue fully mature. If procurement is delayed instead, revenue commencement can also be delayed.
CoreWeave’s latest reported Q2 illustrates why this channel matters: net interest expense was $640 million against $128 million of adjusted operating income, despite $1.51 billion of adjusted EBITDA. Its substantial revenue backlog does not eliminate the financing required to build and activate the capacity supporting that backlog. Comfort’s commentary reinforces the importance of distinguishing customer commitments from funded, revenue-producing infrastructure.
Nebius provides an important counterweight to an overly bearish interpretation. On October 22, it announced a $3.5 billion senior secured facility from Citi and cited customer prepayments and more than $40 billion of long-term investment-grade customer commitments as elements of its funding strategy. That demonstrates access to capital, not an inability to finance growth. However, the facility has a 364-day maturity and initially costs Term SOFR plus 2.75%, with potential increases. Financing availability therefore does not remove financing cost or refinancing obligations.
The high-conviction conclusion is not that these companies face an imminent liquidity crisis. It is that scarce infrastructure capacity increasingly rewards buyers able to provide credible commitments and favorable payment terms. Revenue-backlog growth can coexist with substantial cash requirements and weaker near-term equity economics.
The near-term catalysts are subsequent financing announcements and the next reported cash-flow, deployment, and customer-prepayment updates. No unverified exact earnings date is assumed. Nebius’s October 22 facility is already announced and should not be treated as new information created by Comfort’s call. Over the next 12 to 24 months, the decisive variables are financing duration, all-in borrowing cost, construction-to-revenue timing, and the extent to which customer advances offset supplier advances.
ON-SITE AND STANDBY POWER: RESOLVED POWER ARRANGEMENTS DO NOT MEAN THE GENERATION OPPORTUNITY HAS DISAPPEARED (READ-THROUGH 6)
Affected companies: Caterpillar (CAT: USA) and Cummins (CMI: USA).
Directional impact and magnitude: Positive. High relevance to data-center power-generation product lines, but moderate consolidated impact because both companies have substantial non-data-center operations. Confidence is high in the shared demand channel; the call does not identify a specific generation technology, vendor, or order.
Comfort said that power arrangements are generally resolved by the time projects reach its traditional construction pipeline. George added that “a lot of these data centers just generate their own power anyway.” The important interpretation is that projects can advance through different power architectures, rather than depending exclusively on conventional utility interconnections.
The mechanism has 2 components. Some developments require on-site generation to support the primary power solution, while operating data centers also require resilience and standby systems. More construction reaching execution supports the installed base that needs generation equipment, controls, integration, and subsequent maintenance. The size of the prime-power opportunity should not be inferred from standby demand, or vice versa.
The companies’ own prior disclosures establish that this is already an operating business rather than merely a thematic possibility. Caterpillar reported Q2 power-generation sales growth of 29%, with increased large reciprocating-engine and turbine-related sales primarily linked to data centers. Cummins reported 19% Power Systems revenue growth and explicitly cited robust orders for data-center standby power.
Comfort’s call is therefore corroborative, with the incremental information being that a downstream contractor has not encountered widespread power-related interruptions in its active opportunity set. It reduces concern about a broad near-term stop in those projects, without proving that power bottlenecks are resolved across the entire industry.
The near-term catalysts are the companies’ forthcoming Q3 updates, particularly data-center orders, delivery schedules, capacity additions, and service demand. The longer-duration effect is an expanding installed base generating parts and maintenance revenue. No automatic read-through to a particular fuel-cell, turbine, or engine supplier’s market share is justified.
SITE DEVELOPMENT AND MISSION-CRITICAL CONSTRUCTION: GEOGRAPHIC FLEXIBILITY SUPPORTS GROWTH, BUT AWARD TIMING MUST BE RESPECTED (READ-THROUGH 7)
Affected company: Sterling Infrastructure (STRL: USA).
Directional impact and magnitude: Positive, with high relevance to E-Infrastructure and meaningful consolidated significance. Confidence is high in the shared end-market exposure; Comfort’s backlog is not evidence of an additional Sterling award.
Comfort identified Texas, Georgia, Mississippi, the Carolinas, Utah, and Iowa as particularly strong markets. Management reported no delays in its current work from data-center moratoriums and suggested that future investment may migrate toward more accommodating jurisdictions. Backlog duration has also expanded toward an 18-to-24-month horizon for larger projects.
Sterling’s exposure extends beyond initial site work. Its E-Infrastructure business combines large-scale site development with mission-critical electrical services, including the acquired CEC operation. This creates potential participation at multiple stages of a campus development: preparing the site, executing electrical infrastructure, and serving subsequent phases.
Sterling’s August results already showed that mission-critical projects represented 92% of E-Infrastructure backlog. The company also identified more than $1.4 billion of high-probability future-phase opportunities. Comfort’s sustained demand and geographic breadth support the premise that these campus developments have additional phases and locations available, rather than representing a small set of isolated projects.
The sequencing distinction is critical. Site development generally precedes Comfort’s mechanical and electrical installation. Consequently, Comfort booking a project can validate work that a site contractor has already performed rather than predict a new site-work award. The stronger forward implication concerns additional campus phases and Sterling’s electrical scope, not mechanically assigning Comfort’s current backlog growth to Sterling’s next quarter.
Regulatory friction can also redistribute work rather than eliminate it. A geographically flexible contractor may follow customer investment toward jurisdictions where projects can proceed, while an operator confined to a restricted local market cannot. That supports the value of Sterling’s broader platform, although the call does not establish specific project relocations or automatic benefits for every Southern-state operation.
Sterling’s October 28 earnings release is the immediate catalyst. The most informative disclosures will be conversion of future-phase opportunities into signed awards, separation of organic growth from acquisitions, electrical execution, and the geographic mix of new work. Over 2027, the structural opportunity is a larger scope of work across multiphase campuses. The cross-portfolio implication is that Sterling, EMCOR, IES, Vertiv, and Eaton increasingly share exposure to the same technology-infrastructure spending cycle; different industrial classifications do not eliminate that common risk.
Report record
- Sector
- Industrials
- Industry
- Construction & Engineering
- Fiscal period end
- September 30, 2026
- Report date
- October 22, 2026
- Analysis
- 5961 words
- Read-throughs
- 2825 words
- Content fingerprint (PDF)
f62e1eeec36b- Content fingerprint (analysis)
f04750ee0d85- Content fingerprint (read-throughs)
a1f058bf9074
Prepared from the company's earnings release and earnings call transcript. Figures as reported by the company. For information only. Not investment advice.
More from Comfort Systems USA, Inc.
No other reports yet.
All Comfort Systems USA, Inc. reports
More in Industrials
Earnings Expansion Durable, but the Beat Was Not Unequivocal
Improved visibility into 2027 rather than a substantial upgrade to 2026 earnings
Follow @AtlasPeakRes on X for new earnings reports as they publish.