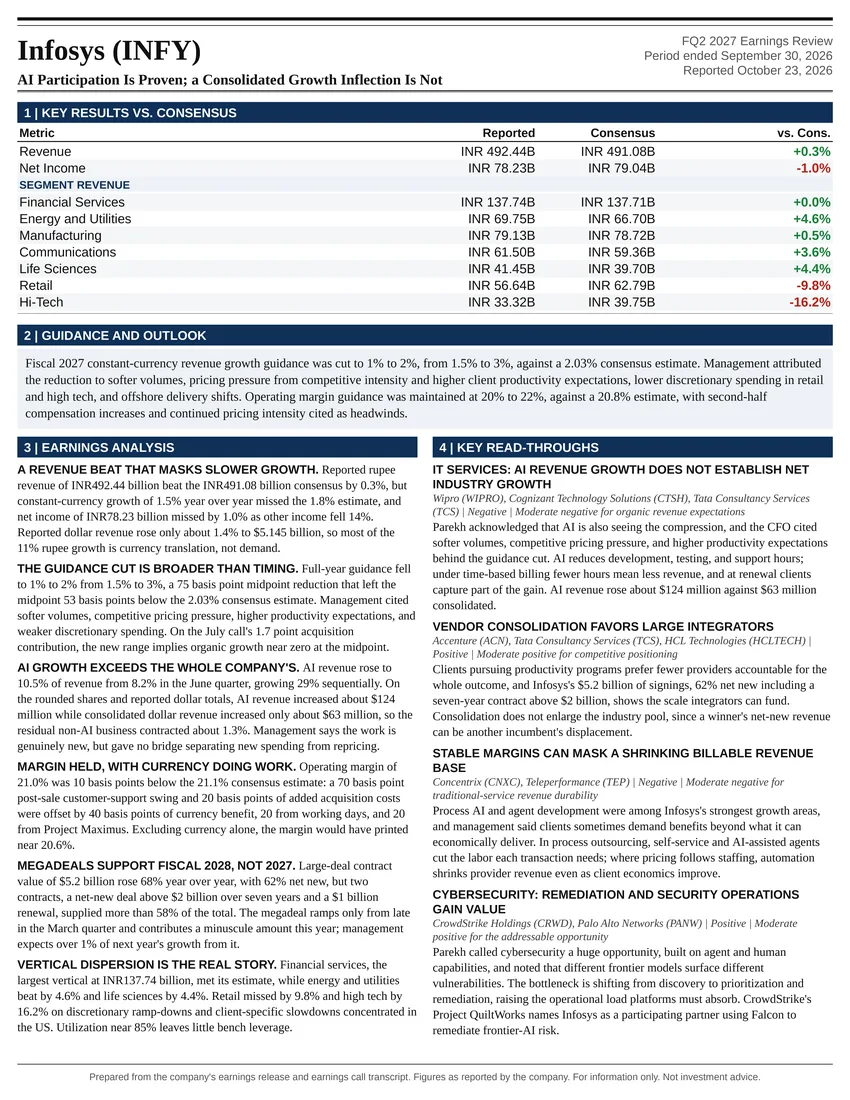
AI Participation Is Proven; a Consolidated Growth Inflection Is Not
Earnings Reports
ASML Holding N.V. FQ3 2026 Earnings Report
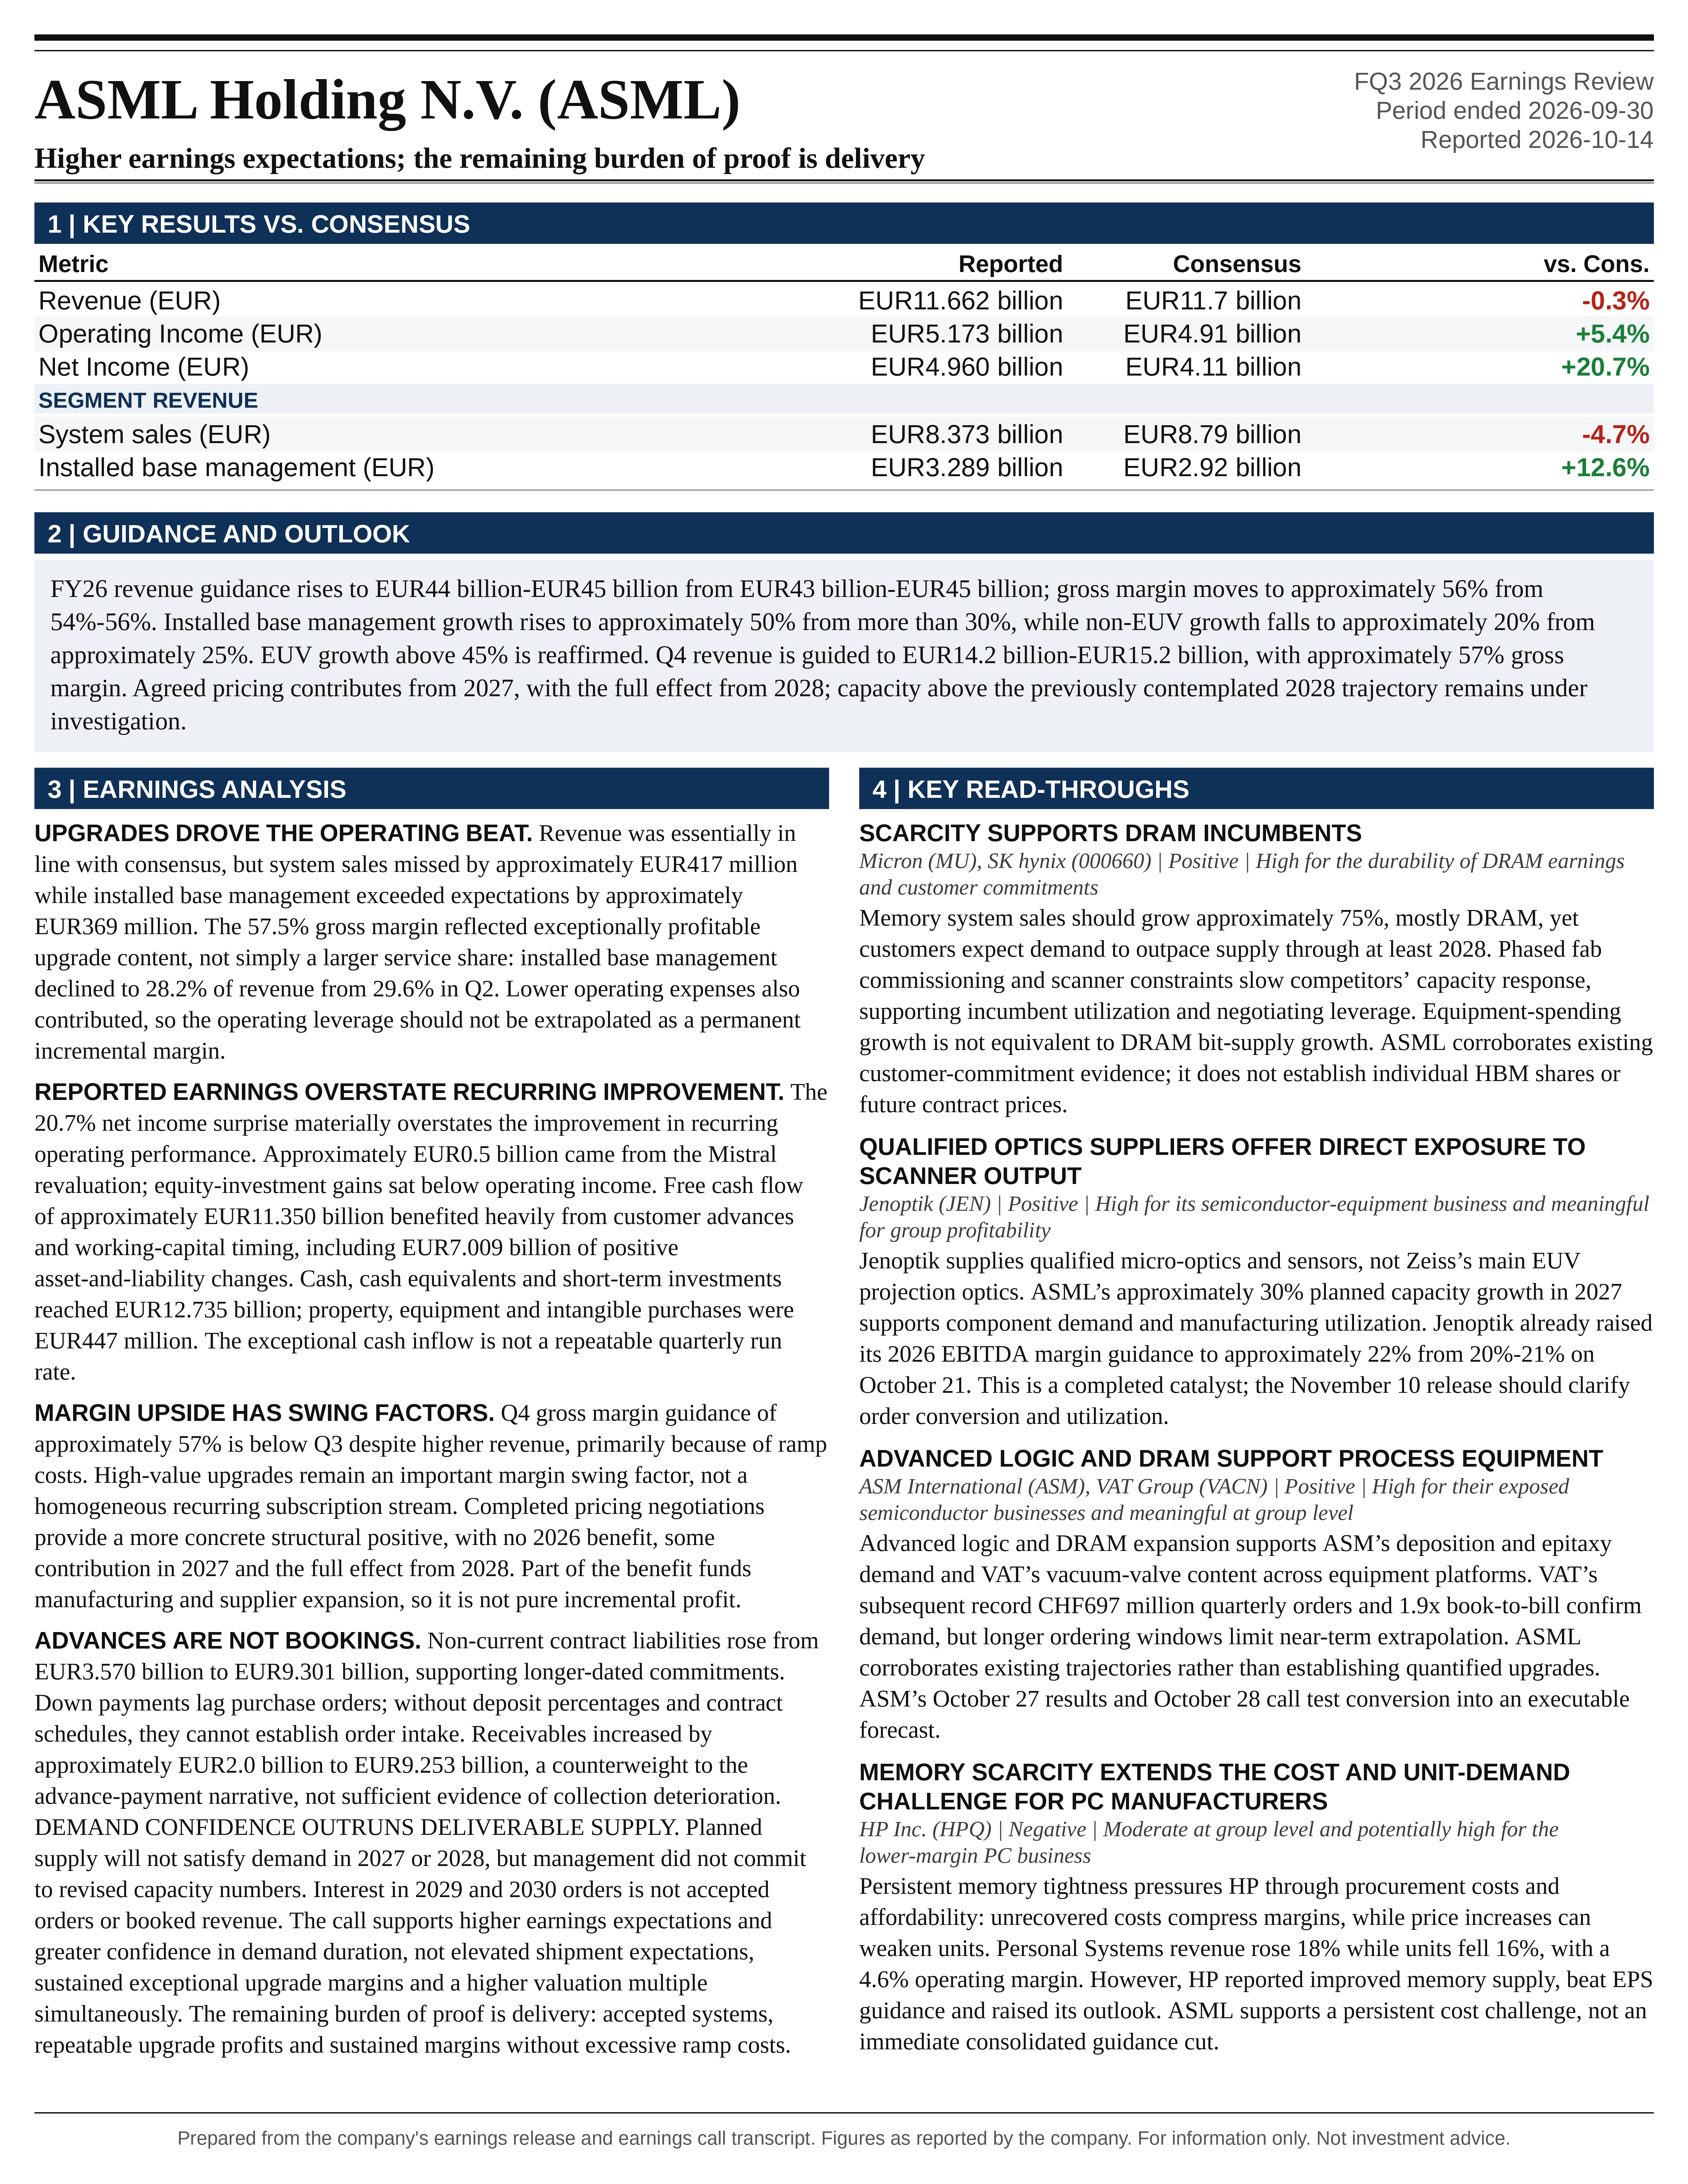
ASML Holding N.V. (ASML) FQ3 2026 earnings: Higher earnings expectations; the remaining burden of proof is delivery. Full earnings analysis, key read-throughs, and the one-page exhibit from Atlas Peak Research.
ASML Holding N.V. (ASML)
Sector: Information Technology · FQ3 2026 · Period end September 30, 2026 · Reported October 14, 2026
ASML’s Q3 2026 earnings call strengthened the case for a multiyear expansion in earnings, while leaving the scale of the next capacity increase unresolved.
Download the one-page report (PDF)
View one-page exhibit
Download analysis (.md)
Download read-throughs (.md)
Post to X
One-Page Exhibit
Earnings Analysis
EXECUTIVE CALL SUMMARY: ASML Holding N.V. (10/14/26)
ASML’s Q3 2026 earnings call strengthened the case for a multiyear expansion in earnings, while leaving the scale of the next capacity increase unresolved. The most important developments were the completion of pricing negotiations for critical products, management’s assessment that currently planned supply will not satisfy customer demand in either 2027 or 2028, and further evidence that productivity upgrades can generate substantial revenue and profit without requiring additional scanner manufacturing capacity. The investment conclusion is constructive on the operating outlook but more selective on the equity. The call supports higher earnings expectations and greater confidence in demand duration. It does not establish that elevated shipment expectations, sustained exceptional upgrade margins, or a higher valuation multiple are warranted simultaneously.
Q3 revenue of EUR11.662 billion increased 55.2% year over year and 25.0% sequentially, but was essentially in line with Bloomberg consensus of EUR11.7 billion. The composition was more consequential than the headline: system sales missed consensus by approximately EUR417 million, while installed base management sales exceeded consensus by approximately EUR369 million. Gross margin reached 57.5%, operating income exceeded consensus by 5.4%, and reported net income exceeded consensus by 20.7%. However, approximately EUR0.5 billion of reported earnings came from the revaluation of ASML’s Mistral AI investment. The quarter therefore combined genuine operating outperformance with a material non-operating valuation gain. The 20.7% net income surprise materially overstates the improvement in recurring operating performance.
The outlook improved, but not uniformly across the business. Full-year revenue guidance increased from EUR43 billion-EUR45 billion to EUR44 billion-EUR45 billion, raising the midpoint by 1.1% while leaving the ceiling unchanged. Gross margin guidance moved from 54%-56% to approximately 56%. Installed base management growth is now expected to be approximately 50%, compared with more than 30% in July. Conversely, non-EUV system growth was reduced from approximately 25% to approximately 20%. EUV growth remains above 45%, essentially unchanged. This was principally an upgrade-driven improvement in revenue quality and profitability, not a broad increase in every product category.
The most durable incremental disclosure concerned pricing. Roger Dassen stated that customer discussions “have been completed and have indeed led to pricing increase for what we call the most critical products for our customers.” The increases will not affect 2026, will begin contributing during 2027, and will have their full effect from 2028. This converts a previously discussed commercial opportunity into an agreed earnings driver, although neither the increase nor the eligible revenue base was quantified. Some of the benefit will fund manufacturing and supplier expansion, so the increase should not be modeled as pure incremental profit.
The main unresolved issue is the conversion of demand into deliverable capacity. Approximately 65 Low NA EUV systems in 2026 and a planned 30% increase in 2027 imply roughly 85 systems next year. A further 30% increase would imply approximately 110 in 2028. Management is investigating capacity above that 2028 trajectory, but did not commit to a revised number. The 90-100 systems some investors expected for 2027 and the 140-150 systems raised in an analyst question for 2028 are not company guidance. The call increased confidence in the demand opportunity more than it increased the executable supply forecast.
Financial comparisons below use ASML’s October 14 US GAAP financial statements and presentation, its earlier earnings releases and July call, and the pre-release consensus figures in the accompanying Bloomberg notice. Company guidance, mechanical implications, and illustrative investment scenarios are distinguished throughout.
Q3 PERFORMANCE: SUBSTANTIAL GROWTH, WITH A MORE COMPLICATED CONSENSUS COMPARISON
Revenue increased from EUR7.516 billion in Q3 2025 and EUR9.327 billion in Q2 2026 to EUR11.662 billion. System sales reached EUR8.373 billion, up 50.8% year over year and 27.5% sequentially. Installed base management revenue reached EUR3.289 billion, up 67.6% year over year and 19.1% sequentially. The growth was therefore broad in absolute terms, even though upgrades provided the principal upside against expectations.
Against management’s July guidance of EUR11 billion-EUR12 billion, revenue exceeded the midpoint by EUR162 million, or 1.4%, but remained EUR338 million below the upper end. Installed base management exceeded its approximately EUR2.9 billion guide by EUR389 million. Mechanically, the July total revenue midpoint less the installed base guide implied EUR8.6 billion of system revenue, compared with EUR8.373 billion actually recognized. That calculation was not a separate company system-sales forecast, but it demonstrates that the upgrade outperformance was larger than the consolidated revenue outperformance.
The same pattern appears against consensus. System sales were 4.7% below the EUR8.79 billion estimate, while installed base management was 12.6% above the EUR2.92 billion estimate. This distinction matters because investors focused primarily on scanner output could interpret the headline revenue result as confirmation of stronger system delivery than actually occurred. The quarter instead showed ASML extracting more economic value from the existing fleet while system revenue remained below market expectations.
Unit volumes also require qualification. ASML recognized sales of 121 lithography systems, compared with 91 in Q2 and 72 a year earlier. The 121 total exceeded consensus of approximately 115 by 4.9%, but the increase was not concentrated in the highest-value categories. EUV sales were 17 systems against approximately 17.3 expected, and immersion sales were 40 against approximately 41.1 expected. I-line systems reached 19 against approximately 13.4 expected. The I-line excess accounted for nearly all the aggregate unit beat. Total units therefore conveyed a more favorable impression than the high-end unit comparison.
Sequentially, immersion units increased from approximately 23 to 40, while EUV units increased from 16 to 17. I-line increased from 9 to 19. The strong immersion recovery was operationally important, but the overall unit expansion included substantial lower-value equipment. Moreover, recognized system sales, manufacturing output, shipments, installations, and customer acceptance are different measures. The 17 EUV systems recognized in Q3, including 1 High NA system, cannot be directly reconciled to the annual Low NA shipment target without the shipment and revenue-recognition schedules.
Gross profit increased to EUR6.700 billion from EUR5.035 billion in Q2 and EUR3.880 billion a year earlier. Gross margin expanded by 350 basis points sequentially and 590 basis points year over year to 57.5%. It exceeded the upper end of management’s 55%-57% guidance by 50 basis points and consensus by 140 basis points. This was the clearest operating achievement of the quarter.
An important nuance is that installed base management fell as a share of consolidated revenue, from 29.6% in Q2 to 28.2% in Q3. Consequently, the sequential margin increase cannot be explained simply by a larger service-and-upgrade revenue share. The mix within installed base management, together with stronger scanner volumes and product mix, was more important. Management specifically attributed the upside to “very high margin components within our installed based management business.” That language points to exceptionally profitable upgrade content rather than uniformly higher profitability across all recurring service activities.
OPERATING LEVERAGE AND EARNINGS QUALITY
Operating income reached EUR5.173 billion, up 49.7% sequentially and 109.6% year over year. Operating margin increased to 44.4%, compared with 37.1% in Q2 and 32.8% in Q3 2025. Approximately 73.5% of the sequential revenue increase converted into incremental operating income. That is powerful operating leverage, but it incorporates favorable upgrade mix and a decline in operating expenses, and should not be extrapolated as a permanent incremental margin.
R&D expense declined from EUR1.277 billion in Q2 to EUR1.174 billion, while SG&A increased from EUR303 million to EUR353 million. Combined operating expenses declined by approximately EUR52 million despite the 25.0% revenue increase. The July call had identified technology and IT transformation costs as a contributor to elevated Q2 R&D. Some of the sequential operating improvement therefore reflects the comparison with a higher expense base, rather than only structural scale efficiencies.
Against consensus, the operating income beat of approximately EUR263 million was not entirely a gross margin story. Applying the consensus gross margin to consensus revenue implies gross profit of approximately EUR6.564 billion, compared with EUR6.700 billion reported. The gross profit difference was approximately EUR136 million. The remaining operating income outperformance reflects lower implied operating expenses, subject to the rounding and aggregation limitations of consensus data. Both gross profitability and spending discipline contributed.
Reported net income was EUR4.960 billion, compared with EUR2.918 billion in Q2 and EUR2.125 billion a year earlier. Basic EPS was EUR12.95, while diluted EPS was EUR12.93. The financial statements separately identify EUR509.7 million of gains on equity investments below operating income. This gain did not contribute to revenue, gross margin, or operating margin. It should not receive the same valuation treatment as recurring lithography earnings.
Management described approximately EUR0.5 billion of the net income result as attributable to the Mistral revaluation. Subtracting that rounded contribution produces approximately EUR4.46 billion of earnings and EUR11.64 of basic EPS, still a strong result and approximately 8.5% above the unadjusted net income consensus. This is an analytical approximation, not an ASML-reported adjusted earnings measure. The disclosed statements do not separately identify the tax treatment of the gain, so a precise after-tax normalization cannot be established simply by applying the consolidated tax rate.
Other below-operating-line items also contributed. Interest and other income was EUR68 million, and profit related to equity-method investments was EUR135 million. The effective tax rate was 16.1%, compared with 17.5% in Q2, while the full-year tax expectation remained approximately 17%. The appropriate valuation anchor is therefore sustainable operating earnings after a normalized tax assumption, with investment gains, financing income, and equity-method earnings assessed separately. Annualizing EUR12.95 without adjustment would embed a nonrecurring valuation gain.
GUIDANCE REVISIONS: AN IMPORTANT MIX SHIFT BENEATH A MODEST REVENUE INCREASE
The latest annual revenue range of EUR44 billion-EUR45 billion compares with EUR43 billion-EUR45 billion in July, EUR36 billion-EUR40 billion in April, and EUR34 billion-EUR39 billion in January. The current midpoint is 21.9% above the initial January midpoint, demonstrating the magnitude of the year’s demand and execution improvement. However, the latest quarterly revision is much smaller than the cumulative revision. The October change raises the floor by EUR1 billion but leaves the ceiling unchanged.
At EUR44.5 billion, the midpoint implies approximately 36.2% growth over 2025 revenue of EUR32.667 billion. Gross margin guidance of approximately 56% compares with 52.8% in 2025 and the July range of 54%-56%. Using the respective guidance midpoints mechanically, expected annual gross profit increases from EUR24.2 billion to EUR24.92 billion, an improvement of approximately EUR720 million. This is a more substantial earnings revision than the 1.1% increase in the revenue midpoint suggests.
The product-level revisions are particularly important. July guidance called for more than 45% EUV growth, approximately 25% non-EUV growth, and more than 30% installed base management growth. October retains EUV growth above 45%, reduces non-EUV growth to approximately 20%, and raises installed base management growth to approximately 50%. The earnings outlook strengthened despite a lower non-EUV growth expectation. An indiscriminate increase to scanner revenue forecasts would misrepresent the update.
The memory outlook also warrants precise comparison. July described memory-related system growth above 75%; October describes approximately 75%. That is not evidence of an additional memory growth upgrade. Advanced logic growth remains above 25%, consistent with July. The approximately 10% growth now cited for total logic is a broader category and should not be compared directly with the advanced logic figure as though the company cut the same metric from 25% to 10%.
The revenue increase is not entirely backward-looking. Before Q3, the July annual midpoint and quarterly midpoint mechanically implied approximately EUR14.41 billion of Q4 revenue. After the EUR162 million Q3 revenue outperformance, the new annual midpoint implies approximately EUR14.74 billion for Q4. On that consistent midpoint basis, approximately EUR338 million of the annual increase relates to the remaining quarter. The new explicit Q4 midpoint of EUR14.7 billion is consistent with that calculation after rounding.
The annual and quarterly margin guides should not be forced into false precision. Reported 9-month gross profit of EUR16.380 billion, plus Q4 revenue of EUR14.7 billion at 57%, produces an annual gross margin of approximately 55.7%, which is consistent with guidance of “around 56%.” Treating the annual 56% as exact would imply a Q4 margin near 57.9%, above the explicit 57% guide. The correct conclusion is that the guidance is rounded, not that management implicitly forecast a higher Q4 margin.
Q4 OUTLOOK: ANOTHER LARGE STEP-UP, WITH RAMP COSTS VISIBLE
Q4 revenue guidance of EUR14.2 billion-EUR15.2 billion implies sequential growth of approximately 21.8%-30.3%. The midpoint represents 26.1% sequential growth and 51.3% growth over Q4 2025. It is also 5.2% above Bloomberg consensus of EUR13.97 billion. Even the bottom of the range exceeds consensus. This is a meaningful forward operating upgrade, rather than merely an optimistic qualitative statement.
Installed base management is expected to reach approximately EUR3.7 billion, up 12.5% sequentially and 73.4% year over year. At the consolidated revenue midpoint, implied system sales are approximately EUR11 billion, up 31.4% sequentially and 45.0% year over year. The Q4 guide therefore requires a substantial acceleration in system revenue recognition as well as further upgrade strength.
The gross margin guide of approximately 57% is 50 basis points below Q3 despite the higher revenue. Dassen explained that the decline is “primarily related to the fact that we are seeing some ramp costs.” This is an important qualification to the scale argument. Increasing output improves fixed-cost absorption, but preparing the manufacturing network and suppliers for subsequent growth consumes part of that benefit before the associated revenue arrives.
At the revenue midpoint, 57% gross margin and approximately EUR1.6 billion of combined R&D and SG&A imply operating income of approximately EUR6.78 billion and an operating margin near 46.1%. That would represent approximately 31% sequential operating income growth despite the lower gross margin. The implied operating leverage is favorable, but it depends on holding operating expenses near the disclosed level while executing a very large revenue quarter.
The Q4 midpoint annualizes to EUR58.8 billion of revenue. That is a useful indication of the expected exit pace, but not a 2027 revenue forecast. Delivery schedules, acceptance timing, product mix, upgrade campaigns, and quarter-end execution can make annualized quarterly revenue misleading. A full-year model should be built from shipment and recognition schedules rather than by multiplying the strongest quarter by 4.
INSTALLED BASE MANAGEMENT: THE PRINCIPAL EARNINGS UPSIDE AND THE PRINCIPAL MARGIN SWING FACTOR
Installed base management has become a central component of the investment thesis rather than a supplementary service stream. The reported 9-month result plus Q4 guidance implies approximately EUR12.24 billion of 2026 revenue, compared with EUR8.193 billion in 2025, or approximately 49.4% growth. This independently reconciles with management’s approximately 50% expectation.
The economic appeal is clear. Productivity upgrades increase output from equipment already installed, reducing the need for additional cleanroom space and avoiding much of the lead time associated with a new scanner. When a fab’s constrained lithography layer limits production, an upgrade can generate substantial incremental wafer output without a corresponding increase in footprint. Customers can rationally pay attractive prices for that improvement, particularly when the value of incremental chip production is high.
However, installed base management is not equivalent to a homogeneous recurring subscription business. It combines service and field options, including upgrades with different margins, purchase cycles, and technical eligibility. The current outperformance is disproportionately associated with high-value upgrades. Capitalizing the entire category at a recurring-service valuation would overstate the stability of its most profitable component.
Dassen identified the distinction explicitly: “upgrades is an important swing factor for us in the gross margin development as we see in ’27 and beyond.” Management’s arguments for durability were that a meaningful number of tools remain eligible for existing upgrades, additional upgrade products will expand the addressable installed base, and customer demand for immediate output remains strong. These are credible supporting factors, but the call did not quantify the remaining eligible population, penetration rates, upgrade pricing, or the replacement cadence of new offerings.
A more mature upgrade cycle could produce slower revenue growth or weaker mix even while recurring service revenue continues expanding. Conversely, successful new products could replenish the opportunity before existing upgrades saturate. The relevant question is not simply whether installed base revenue grows, but whether the high-margin upgrade portion can continue growing fast enough to offset its increasingly demanding comparison base.
The strategic trade-off is that upgrades increase ASML’s revenue and customer output while potentially reducing the number of new scanners required for a fixed wafer-production target. In the current shortage environment, management believes demand is sufficiently large to absorb both. Over a longer horizon, the model should nevertheless account for the interaction. Incremental upgrade capacity and incremental scanner capacity cannot both be treated as fully additive demand without an underlying wafer and exposure requirement.
CAPACITY EXPANSION: DEMAND VISIBILITY IMPROVES FASTER THAN DELIVERABLE SUPPLY
Management expects approximately 65 Low NA EUV systems of output in 2026, compared with 44 shipped in 2025, representing approximately 47.7% growth. That is strong evidence that the supply chain can expand rapidly. However, the approximately 65-system target was already communicated in July. Its reiteration supports execution confidence but is not a new production increase.
The same distinction applies to immersion. July identified approximately 130 shipments for 2026, broadly consistent with 2025, after an initially lower production plan. The October statement that immersion output should be similar to the prior year confirms that recovery. It does not introduce another quantified increase for 2026.
The July plan called for approximately 30% more capacity in 2027 for both Low NA EUV and immersion, with another 30% increase under investigation for 2028. Applied mechanically, that produces approximately 85 Low NA EUV systems and 169 immersion systems in 2027, followed by approximately 110 and 220 in 2028. These calculations describe the previously discussed capacity trajectory, not revenue guidance or guaranteed annual shipments.
The October change is that even this trajectory is now judged insufficient to satisfy customer demand. Management is investigating capacity above the previously contemplated 2028 increase. Fouquet was explicit about the absence of a revised commitment: “I won’t give new number for ’27 or ’28 because it’s far too early to give those numbers.” The likely opportunity is therefore larger than the quantified operating plan, but the incremental earnings should remain probability-weighted until manufacturing milestones become more concrete.
The expansion strategy has 3 principal components: better use of existing space, shorter manufacturing cycle times, and supplier capacity growth. Cycle-time reduction is particularly attractive because it increases output from existing factory infrastructure. As the NXE:3800E matures, assembly and qualification sequences can be simplified, and some steps can be eliminated with customer agreement. This can deliver capacity more quickly than constructing a new facility.
The limitation is that cycle-time gains must preserve reliability and qualification quality. A shorter factory process is economically valuable only if it does not produce longer installation periods, customer acceptance delays, higher field-service costs, or poorer availability. Factory output, customer installation readiness, and subsequent utilization should therefore be monitored together. A headline production increase without corresponding acceptance and cash conversion would be a weaker outcome.
Fouquet stated, “We do not see Zeiss today as a bottleneck for the capacity expansion we are discussing even beyond the 30% we mentioned for 2028.” This is a meaningful reduction in a specific near-term concern, but not a statement that all supplier constraints have been eliminated. Management also acknowledged that expansion may require support within the supply chain and that some pricing benefits will cover those costs. Neither the required supplier funding nor the full capital expenditure burden was quantified.
The reference to 140-150 Low NA EUV systems in 2028 came from an analyst’s question. Management did not endorse it. Relative to approximately 85 in 2027, those levels would require approximately 66%-78% growth in 2028, substantially above the previously investigated 30%. Such an outcome belongs in an aggressive upside scenario, not the central forecast.
DEMAND QUALITY, ORDER COMMITMENTS, AND THE LIMITS OF VISIBILITY
Management’s strongest demand statement was that leading customers expect their own demand to exceed supply through at least 2028. ASML is receiving orders for 2028, while customers are expressing interest in placing orders for 2029 and 2030. This materially lengthens the apparent planning horizon, but the evidence has different levels of contractual strength.
Accepted orders, customer demand forecasts, and requests to submit future orders are not interchangeable. ASML has not yet accepted the referenced 2029 and 2030 requests. Dassen explained that the company first wants to assess aggregate demand and available capacity so that early ordering does not exclude longstanding customers. These discussions are a positive indicator of demand duration, but they are not booked revenue or a disclosed backlog increase for those years.
Existing purchase orders have meaningful economic commitment. Dassen described the required down payment as “enough to hurt” and emphasized that cancelling a purchase order involves costs beyond the deposit. This reduces the likelihood that customers are submitting orders casually to reserve options. It does not eliminate deferrals, renegotiations, or the possibility that customers’ own end-demand assumptions prove too optimistic.
Management also described a detailed validation process linking requested tools to fab construction schedules and the availability of facilities. Fouquet said that the demand being discussed is demand management believes “is real and not inflated by any potential buying behavior from our customer.” This is more persuasive than reliance on aggregate customer forecasts alone. Nevertheless, a validated construction project can still be delayed, and installed wafer capacity can ultimately be underutilized if downstream demand disappoints.
The cleanroom discussion was balanced. Fouquet did not see customer cleanroom constraints as a major determinant of current demand, beyond potential timing movements of days or weeks. Dassen added that the scale of construction in 2027 and 2028 creates significant execution requirements. Cleanroom availability is therefore not the central constraint in the present plan, but remains a plausible cause of delivery and revenue shifts.
The demand-duration thesis also depends on the quality of commitments further downstream. Customers’ long-term agreements with their own customers improve visibility, but the call did not disclose those agreements’ cancellation provisions, financing arrangements, or ultimate demand utilization. Multiple contractual layers can reduce uncertainty without making the entire AI investment chain economically immune to overcapacity.
PRICING: A MORE CONCRETE STRUCTURAL POSITIVE, WITH A DELAYED EARNINGS PROFILE
The completion of pricing negotiations is more significant than an incremental statement about demand strength because it changes the economics of already anticipated future volumes. In July, management described conversations about capturing more of the value delivered by critical lithography products. In October, those conversations had resulted in agreed increases.
The scope remains narrower than an across-the-board price increase. Dassen referred to the most critical high-end, high-volume manufacturing products. Upgrade pricing will follow the same general pattern because it is linked to tool economics. Management did not disclose whether all relevant backlog was repriced, which order cohorts qualify, or how the increase applies across systems, services, parts, and upgrades. The absence of a backlog answer should not be converted into an assumption that all backlog is either protected or repriced.
The timing is explicit. There is no 2026 benefit, some benefit during 2027, and the full effect begins in 2028. Consequently, the Q3 margin record and the 2026 margin upgrade were achieved before this pricing contribution. That supports the possibility of another earnings driver beyond the current upgrade cycle, while also showing why the entire benefit should not be pulled into 2027.
There are also distinct sources of future ASP improvement that should not be conflated: the negotiated pricing reset, migration from older Low NA models to newer configurations, and higher productivity in new products. The July call clarified that older D-model supply is nearing completion and that the 2027 mix should predominantly comprise E models with some F models. The October transcript’s reference to “DUV models” within the EUV mix is inconsistent with that product discussion and should not be interpreted as a separate category change.
Price increases will be accretive, but not costless. Dassen stated that “a significant part of it is directly accretive to the gross margin,” while explaining that part will cover the extraordinary manufacturing and supplier ramp. This is economically sensible: ASML is increasing both the value captured and the resources committed to delivery. The relevant forecast variable is the net retained pricing benefit after associated costs, not the gross contractual price increase.
Management also rejected the idea of automatically repeating the negotiation annually. Dassen stated, “we would not be looking at repeating this every year or so.” The company is attempting to establish a higher value capture level without turning pricing into a short-term scarcity surcharge that customers could seek to reverse in a downturn. This supports pricing durability, but does not establish immunity from concessions, mix changes, or weaker upgrade demand if the market softens.
LOGIC AND MEMORY: STRONGER DRAM EXPOSURE, WITHOUT A WEAK ADVANCED-LOGIC SIGNAL
Memory represented 46% of Q3 system revenue and logic 54%, compared with 49% and 51%, respectively, in Q2. Applied to disclosed system revenue, the rounded mix percentages imply approximately EUR3.85 billion of memory sales and EUR4.52 billion of logic sales. Sequential growth was approximately 20% in memory and 35% in logic. Despite the stronger full-year memory growth rate, the latest quarter’s sequential acceleration was more pronounced in logic.
For 2026, memory system sales are expected to grow approximately 75%, compared with approximately 10% for total logic. Management attributed the memory expansion mainly to DRAM capacity additions and increasing EUV adoption at advanced nodes. The distinction between capacity and lithography intensity is fundamental. More wafers require more productive capacity, while more critical EUV layers or substitution away from multipatterning can increase ASML’s participation in each wafer’s process flow.
The memory strength should not be generalized to NAND. Management specifically emphasized DRAM. Similarly, approximately 10% total logic growth should not be interpreted as weak leading-edge demand, because advanced logic is expected to grow more than 25%. The slower consolidated logic figure indicates a less favorable contribution from other logic categories, but the call did not provide a complete mainstream-versus-advanced revenue bridge.
Management expects memory to approach logic in 2027, while logic likely remains the larger category. The portfolio implication is mixed. Broader exposure across logic and DRAM reduces dependence on a single customer spending program, but both are increasingly connected to the same AI infrastructure investment cycle. Economic diversification across the 2 end markets is therefore less than the accounting split might imply.
Comments about additional EUV customers are positive for the addressable market, but the call did not identify those customers or quantify their demand. The discussion of a customer beginning with “T” was not sufficient to establish identity or order volume. The confirmed message was broader interest across customers, including potential new DRAM adopters, rather than dependence on a single new entrant.
PRODUCTIVITY ROADMAP: OUTPUT GAINS EXTEND BEYOND SCANNER COUNTS
The NXE:3800F is expected to begin shipping in small quantities in early 2027 at 260 wafers per hour, compared with 230 wafers per hour for the NXE:3800E. The nominal throughput increase is approximately 13.0%. This supports higher customer output and value-based pricing, but the limited initial shipment volume means the full productivity benefit will phase in over time.
For illustration, a 30% increase in tool count combined with a complete shift from 230 to 260 wafers per hour would increase nominal capacity of those new tools by approximately 47%. That is not a 2027 forecast: most shipments will not immediately shift to the F configuration, installation timing matters, and rated throughput is not equivalent to realized fab output. The calculation demonstrates why system counts alone increasingly understate the potential growth in lithography exposure capacity.
Realized wafer capacity also depends on availability, utilization, exposure dose, the number of exposures required per wafer, and yield. A faster scanner does not necessarily translate proportionately into more finished chips if another process step is the bottleneck. Conversely, eliminating a lithography or associated process sequence can improve economics beyond the scanner’s nominal throughput gain.
Immersion products are expected to move to 330 wafers per hour at the beginning of 2027 across configurations with different overlay requirements. Management indicated that pricing should reflect the added value, as it does in EUV. No uniform percentage throughput improvement or price increase was disclosed across the immersion portfolio, so applying a single ASP uplift to all immersion systems would be unsupported.
The first YieldStar 550B shipment adds another source of value capture. Management described more than 60% greater productivity than the preceding generation, with improved accuracy and precision for advanced logic and DRAM process control. Faster metrology can enable broader sampling and quicker yield learning. However, a 60% productivity gain is not a 60% revenue increase, and the statement that demand should more than double versus 2025 did not establish a precise annual revenue or shipment target.
HIGH NA EUV: GREATER ADOPTION CREDIBILITY, BUT STILL A PHASED ECONOMIC TRANSITION
Q3 included recognition of 1 High NA EUV system. The financial result therefore does not yet depend on a large High NA shipment ramp. The more important development was the strengthening evidence of production readiness and customer adoption schedules.
Management cited Intel’s cumulative exposure of more than 1 million wafers, performance meeting or exceeding comparable Low NA-patterned layers, and fleet availability approaching 90%. These are meaningful indicators of platform maturation. They are not equivalent to proof of fully optimized high-volume economics across all customers, layers, resists, and device architectures. Availability approaching 90% also leaves room for improvement, particularly when customer economics depend on consistent production performance rather than isolated technical qualification.
Samsung’s planned 2028 manufacturing insertion and TSMC’s planned 2030 insertion establish different adoption timelines. They should not be combined into a broad 2028 industry adoption assumption. Intel’s earlier experience supports technical validation, Samsung provides a nearer-term DRAM milestone, and TSMC offers an important longer-duration logic opportunity.
The September 8 ASML-TSMC announcement confirms that TSMC intends to use High NA in high-volume manufacturing from 2030 using the existing mask format initially. The larger-mask initiative targets a pilot line by 2031 and lithography-system readiness for advanced-node production by 2033. The later mask transition is therefore not a prerequisite for the earlier manufacturing insertion. Its role is to improve subsequent productivity and reduce stitching constraints.
The quarterly presentation associates the larger-mask transition with more than 40% productivity improvement for a dual-mask exposure application. That is a specific process benefit, not a near-term fleet-wide capacity gain. Its long implementation horizon also limits its relevance to 2027 earnings. The immediate investment implication is stronger customer commitment to High NA’s long-run economics, rather than an additional near-term revenue forecast.
Management remained appropriately cautious on shipment timing. Fouquet acknowledged that customer capacity expansion can either accelerate High NA adoption or delay it if inserting a new platform complicates an urgent ramp. The statement that shipment numbers should increase over time did not endorse a specific double-digit annual level.
High NA should also be modeled as a technology substitution as well as a growth opportunity. Replacing multiple Low NA exposures with a High NA exposure can reduce required process steps while increasing the value of the scanner and its supporting ecosystem. A forecast that adds High NA revenue without considering displaced Low NA exposures or associated process changes would overstate the total incremental opportunity. The favorable thesis is that higher-value patterning, expanding wafer demand, and continued scaling outweigh those offsets.
CASH FLOW AND CUSTOMER ADVANCES: STRONG EVIDENCE OF COMMITMENT, NOT A REPEATABLE QUARTERLY RUN RATE
Q3 operating cash flow was EUR11.798 billion. After EUR447 million of property, equipment, and intangible purchases, company-defined free cash flow was approximately EUR11.350 billion, or approximately 229% of net income. This is an exceptional quarterly result, but it was heavily influenced by customer advances and working-capital timing.
The cash-flow statement identifies EUR7.009 billion of positive changes in assets and liabilities. Removing that aggregate working-capital contribution produces approximately EUR4.34 billion of free cash flow before those movements. This is a timing sensitivity, not a normalized cash-flow estimate, because it removes all disclosed asset-and-liability changes rather than isolating customer advances alone. It nevertheless demonstrates why EUR11.35 billion should not be annualized.
The 9-month perspective is more informative. Free cash flow was approximately EUR10.06 billion, below the Q3 amount because the 1st half had consumed approximately EUR1.29 billion. The net 9-month contribution from changes in assets and liabilities was only approximately EUR236 million. Thus, the exceptional Q3 cash inflow partly reversed earlier working-capital absorption, while year-to-date cash generation still reflects a substantial underlying earnings contribution.
The balance sheet provides more specific evidence of longer-dated commitments. Non-current contract liabilities increased from EUR3.570 billion in Q2 to EUR9.301 billion in Q3, a rise of approximately EUR5.730 billion. This accounted for almost all the increase in total non-current liabilities and is stronger evidence than the analyst’s approximate reference to a EUR5 billion increase.
However, the contract-liability movement is not equal to quarterly order intake. It reflects collections, the timing of contractual milestones, revenue recognition, and potentially current-versus-non-current classification. Management explicitly described down payments as a lagging indicator of purchase orders. Without disclosed deposit percentages and contract schedules, no defensible bookings number can be calculated from the balance-sheet increase.
Cash, cash equivalents, and short-term investments reached EUR12.735 billion, up EUR5.154 billion sequentially. Only EUR8.031 billion was cash and cash equivalents; EUR4.704 billion was short-term investments. The cash-flow statement also records EUR406 million of equity-investment purchases. Those purchases are separate from the noncash Mistral valuation gain and are not deducted in ASML’s conventional free-cash-flow measure.
Accounts receivable increased by approximately EUR2.0 billion sequentially to EUR9.253 billion. This is not sufficient evidence of collection deterioration, particularly during a rapid revenue ramp, but it is an important counterweight to the advance-payment narrative. Customer prepayments improve funding economics while billed receivables still require collection.
ASML spent approximately EUR4.071 billion on buybacks and EUR721 million on dividends during the quarter, returning approximately EUR4.79 billion, or 42% of quarterly free cash flow. The buyback is meaningful, but the weighted-average basic share count declined only approximately 0.4% sequentially. Most EPS growth came from earnings rather than denominator reduction. The EUR1.88 interim dividend payable November 4 was unchanged from the previous quarterly interim payment.
CHINA: STRONG DEMAND, MATERIAL QUARTERLY CONTRIBUTION, AND A DISTINCT REGULATORY RISK
Management reiterated that China should account for approximately 20% of total 2026 revenue. At the annual midpoint, that implies approximately EUR8.9 billion. This is a total-revenue measure, not a system-sales measure. The distinction matters because the call’s question and the quarterly notice use different denominators.
The Bloomberg notice reported China at 23% of Q3 system sales, compared with 14% in Q2. Applying those rounded percentages to reported system revenue implies approximately EUR1.93 billion in Q3 and EUR0.92 billion in Q2. On that approximate basis, China contributed roughly 56% of the sequential increase in system revenue. System sales outside China still increased approximately 14%, but the quarterly acceleration was not exclusively an advanced-AI equipment story.
Management described strong intrinsic demand from Chinese mainstream logic and memory customers, supported by fab construction and domestic consumption. However, it did not provide a numerical China revenue or share forecast for 2027. Strong demand does not ensure that China’s percentage of group sales remains unchanged if non-China advanced-node revenue grows faster.
Fouquet’s confidence in ASML’s competitive position was explicitly conditional on market access. Current customer preference and technology leadership support pricing, but restrictions on shipments or services can reduce accessible demand regardless of customer willingness to purchase. Restrictions can also increase the incentive for domestic substitution. The principal near-term risk is regulatory access, while the longer-term risk includes the development of alternative tools under a more protected local market.
The analyst’s suggestion that China could never compete technologically was not an established fact. Management’s response supported confidence in the current competitive gap, not permanent immunity. Similarly, strong Chinese DUV demand should not be included in the advanced EUV opportunity discussed for 2029 and 2030. Management explicitly stated that the EUV-related DRAM discussion excluded China.
READ-THROUGHS FOR CUSTOMERS, SUPPLIERS, AND OTHER EQUIPMENT COMPANIES
The call supports a constructive view of advanced logic and DRAM capital spending through the end of the decade, but much of the broad AI demand narrative was already present in July. The more incremental signals were the insufficiency of planned 2028 supply, completed pricing agreements, and the substantial rise in longer-dated customer advances. These developments strengthen confidence in committed equipment spending more than they establish a new demand cycle.
For ASML’s suppliers, the opportunity is sustained production growth and capacity support, offset by execution demands and potential upfront investment. Zeiss was specifically described as aligned with the expansion trajectory. For other equipment companies, the read-through is directionally positive but process-dependent. Higher wafer capacity generally supports deposition, etch, cleaning, and process control, while substitution from multipatterning to single-exposure EUV can reduce selected process steps per patterned layer.
KLA and other process-control suppliers benefit conceptually from tighter tolerances and higher sampling requirements, but YieldStar adoption does not establish a directly comparable revenue forecast or a specific competitive share shift. Likewise, the call’s DRAM emphasis is a more direct signal for advanced memory investment than for NAND-heavy equipment exposure. The share-price moves in the Bloomberg notice demonstrate an immediate sector response, not proof of company-specific earnings revisions.
SCENARIO ANALYSIS: THE MAIN UNCERTAINTY IS EARNINGS CONVERSION, NOT THE EXISTENCE OF DEMAND
An illustrative 2027 base case, assigned a 55% probability, assumes revenue of EUR55 billion, gross margin of 57.5%, operating expenses of EUR6.7 billion, a 17% tax rate, and 380 million shares. This assumes execution broadly consistent with the approximately 30% critical-tool capacity expansion, some favorable product mix and pricing, and installed base growth that moderates from 2026’s exceptional rate. It produces approximately EUR24.9 billion of operating income and EUR54.4 per share of after-tax operating earnings before financing income, equity-method contributions, and investment gains. Revenue growth would be approximately 23.6%.
An illustrative bull case, assigned a 25% probability, assumes EUR59 billion of revenue, 59.5% gross margin, EUR6.8 billion of operating expenses, a 17% tax rate, and 378 million shares. This requires better output and recognition timing, resilient high-margin upgrade demand, and stronger pricing and mix benefits with contained ramp costs. It produces approximately EUR28.3 billion of operating income and EUR62.2 per share on the same operating-earnings basis. Revenue growth would be approximately 32.6%. This is not management guidance and does not require treating 140-150 Low NA systems in 2028 as a commitment.
An illustrative bear case, assigned a 20% probability, assumes EUR48 billion of revenue, 53.5% gross margin, EUR6.8 billion of operating expenses, a 17% tax rate, and 382 million shares. This reflects delivery or customer-facility delays, weaker upgrade mix, continued ramp spending, and potential pressure on accessible China demand. It produces approximately EUR18.9 billion of operating income and EUR41.0 per share. Revenue would still grow approximately 7.9%, demonstrating that a disappointing equity outcome does not require a collapse in demand.
The probability-weighted operating-earnings result is approximately EUR53.7 per share. These scenarios are analytical sensitivities rather than consensus forecasts, and the probabilities reflect judgment rather than a statistical estimate. They deliberately exclude Mistral revaluation gains and other non-operating contributions to isolate the earnings engine most directly affected by the call.
Margin execution is nearly as important as incremental revenue. At EUR55 billion of sales and 380 million shares, each 100-basis-point gross margin change is worth approximately EUR1.20 per share after a 17% tax assumption, before any offsetting expense change. An additional EUR1 billion of revenue at 57.5% gross margin contributes approximately EUR1.26 per share if operating expenses are unchanged. A favorable shipment surprise can therefore be offset by a relatively modest deterioration in upgrade mix or ramp efficiency.
VALUATION, PORTFOLIO IMPLICATIONS, AND RISK DISCIPLINE
The appropriate stance is a constructive hold rather than a price-insensitive buy. The call provides a stronger operating thesis, but a stock-return conclusion requires the entry valuation and the extent to which the market already discounts 2027-2028 growth. Bloomberg reported an intraday increase of as much as 3.5%, not a verified closing return. The analyst commentary also indicated that results were broadly consistent with elevated buy-side expectations despite being favorable against published consensus.
The distinction between earnings growth and share-price appreciation is material. A 30% increase in earnings combined with a 20% decline in the valuation multiple produces only approximately 4% share-price appreciation before dividends. Conversely, a stable multiple would allow earnings growth to translate much more directly into returns. The largest equity risk is not necessarily a near-term earnings decline; it may be that excellent operating performance fails to exceed a demanding valuation.
The longer-term framework is increasingly relevant. ASML’s 2024 Investor Day described potential 2030 revenue of EUR44 billion-EUR60 billion and gross margin of 56%-60%. The current 2026 guide already reaches the lower end of that revenue framework and approximately its lower margin boundary. This supports the prospect of a revised long-term model at the June 10, 2027 Capital Markets Day. It does not establish that the entire previous 2030 range will be achieved early or that the high end should simply be extrapolated upward.
Portfolio exposure should be recognized as concentrated exposure to AI infrastructure investment, advanced logic and DRAM capacity, manufacturing execution, and export regulation. ASML’s differentiated technology and customer financing economics do not eliminate correlation with other AI-sensitive semiconductor holdings. A position alongside substantial accelerator, foundry, memory, and equipment exposure may add less diversification than its European listing or service revenue suggests.
Without a verified entry valuation or existing portfolio exposures, a specific incremental position size or absolute share-price target is not supported. For a conditional new allocation, an illustrative 1% initial NAV weight and 2% maximum weight would limit concentration while the pricing and capacity thesis is verified. A 10%-15% position-level stop would correspond to approximately 10-30 basis points of portfolio loss across that size range before gaps and slippage. Those are implementation guardrails, not a guarantee of maximum loss, and should not override an earlier exit when the operating thesis breaks.
Fundamental exit or reduction criteria are a meaningful reduction in the 2027 critical-tool capacity plan, delayed realization of agreed pricing, sustained weakness in upgrade demand, material customer delivery deferrals, or export restrictions that lower accessible demand beyond what non-China growth can offset. Profit-taking is appropriate if the valuation embeds the bull-case earnings trajectory before the corresponding production and margin milestones are demonstrated. The relevant underwriting horizon is 12-24 months, with separate recognition that the full pricing benefit begins in 2028.
CATALYSTS AND FINAL ASSESSMENT
The next major catalyst is January 2027, when management expects to provide 2027 financial guidance, including gross margin. The key disclosures will be whether the approximately 85-system Low NA trajectory changes, how upgrade demand is expected to develop, and how much pricing benefit offsets ramp costs. Early NXE:3800F deliveries and the immersion throughput transition provide additional execution milestones during 2027.
The June 10, 2027 Capital Markets Day is the principal longer-term valuation catalyst. It should clarify the relationship between system capacity, productivity, pricing, upgrade opportunities, and the historical 2030 financial framework. Beyond that, 2028 brings the full effect of the negotiated pricing changes, the potential for capacity above the previously investigated trajectory, and Samsung’s planned High NA manufacturing insertion.
The quarter’s central message is that ASML is monetizing scarce lithography capacity through more than scanner shipments. Upgrades, product productivity, and agreed pricing increases expand the revenue and earnings opportunity beyond unit growth. At the same time, the result demonstrates why record earnings require careful disaggregation: revenue was in line with consensus, system sales were below expectations, non-EUV annual growth guidance declined, and reported net income included a substantial investment gain.
The strongest investment case is therefore not that every operating indicator accelerated. It is that demand visibility, customer financial commitments, and ASML’s ability to capture more value improved sufficiently to support a higher and potentially more durable earnings base. The remaining burden of proof is delivery: converting that opportunity into accepted systems, repeatable upgrade profits, and sustained margins without excessive ramp costs or a deterioration in the downstream investment cycle.
COMPANY EMPLOYEES ON THE CALL
• Christophe Fouquet, President and Chief Executive Officer. • Roger Dassen, Executive Vice President and Chief Financial Officer. • Jim Kavanagh, Head of Investor Relations.
RESEARCH ANALYSTS ON THE CALL
• Joe Quatrochi, Wells Fargo. • Krish Sankar, TD Cowen. • Sandeep Deshpande, JP Morgan. • Francois-Xavier Bouvignies, UBS. • Lee Simpson, Morgan Stanley. • Alex Duval, Goldman Sachs. • Chris Caso, Wolfe Research. • Tammy Qiu, Berenberg Bank. • Stephane Houri, ABN AMRO - ODDO BHF.
Key Read-Throughs
KEY READ-THROUGHS FROM ASML’S Q3 2026 EARNINGS CALL
ASML’s call supports a prolonged investment cycle in advanced logic and DRAM, but the most actionable implication is the unequal distribution of its benefits. Existing manufacturers of scarce chips, suppliers with qualified equipment content, and providers of productivity improvements have favorable demand visibility. Customers purchasing that capacity face higher equipment prices and earlier financial commitments, while downstream hardware manufacturers remain exposed to memory costs and supply constraints. The critical disclosures were that planned ASML supply will not satisfy customer demand in 2027 or 2028, critical-product pricing increases have been agreed, memory-related system sales should grow approximately 75%, and customers continue purchasing unusually profitable upgrades. These signals support specific business exposures, not an indiscriminate semiconductor rally. Subsequent peer disclosures through October 25 are distinguished below from information that was incremental on the October 14 call. Magnitude assessments refer to operating exposure, not predicted share-price movements; countries indicate corporate domicile.
MEMORY AND SEMICONDUCTOR MANUFACTURING
SCARCITY SUPPORTS DRAM INCUMBENTS MORE STRONGLY THAN THE HEADLINE CAPACITY EXPANSION SUGGESTS (READ-THROUGH 1)
Affected companies: Micron Technology (MU: USA) and SK hynix (000660: South Korea). Direction: positive. Magnitude: high for the durability of DRAM earnings and customer commitments; not a quantified incremental EPS upgrade.
The strongest evidence is the combination of rapidly expanding equipment supply and an anticipated continuing shortage. ASML expects approximately 65 Low NA EUV systems in 2026, plans approximately 30% more capacity in 2027, and is investigating growth above the previously contemplated 30% increase in 2028. Despite that expansion, management expects planned supply to remain insufficient. Fouquet stated that leading customers believe demand for their products “will outpace supply through at least 2028.” Memory system sales are expected to grow approximately 75%, with management specifying that this is “mostly DRAM.”
The transmission mechanism is constrained growth in advanced DRAM wafer capacity relative to demand. Longer scanner lead times and phased fab commissioning reduce the speed at which competitors can respond to attractive memory economics. This supports incumbent utilization, negotiating leverage, and the economic value of qualified supply. Micron and SK hynix benefit through their advanced DRAM businesses, including the wafer production underlying HBM. However, the call does not establish individual HBM market shares, packaging yields, customer qualifications, or future contract prices.
The non-consensus distinction is that a large equipment-spending increase does not necessarily signal imminent memory oversupply. Equipment expenditure reflects capacity additions, higher lithography intensity, product transitions, and equipment pricing. ASML’s approximately 75% memory-sales growth is not a forecast of 75% DRAM bit-supply growth. Treating it as such would materially overstate the near-term supply response. Equally, scanner shortages cannot guarantee that memory prices remain elevated if downstream demand weakens.
Near-term, SK hynix’s October 28 results are a concrete catalyst for contract duration, capacity, and pricing commentary. Micron had already reported on September 30 and highlighted strategic customer agreements, while SK hynix’s July release disclosed long-term agreements with approximately 10 customers. ASML therefore corroborates an existing demand-duration thesis rather than discovering it. The longer-duration implication is stronger support for 2027-2028 utilization and earnings persistence. This read-through is specifically strongest for DRAM and should not be transferred automatically to NAND.
HIGHER EQUIPMENT PRICES AND ADVANCE PAYMENTS SHIFT FINANCING RESPONSIBILITY TOWARD CHIPMAKERS (READ-THROUGH 2)
Affected companies: Taiwan Semiconductor Manufacturing Company (2330: Taiwan), Micron Technology (MU: USA), and SK hynix (000660: South Korea). Direction: negative for incremental cash commitments and investment flexibility; potentially offset by higher output and stronger chip pricing. Magnitude: moderate at group level, potentially material for individual expansion programs.
ASML reported EUR11.4 billion of quarterly free cash flow, explicitly linking the result to order momentum and customer down payments. Dassen described a purchase-order deposit as “enough to hurt” and said cancellation costs extend beyond that payment. Separately, he confirmed that critical-product pricing negotiations had been completed, with some benefit to ASML during 2027 and the full impact from 2028.
The accounting transmission is important. Customer advances consume chipmakers’ cash before the equipment produces saleable wafers. They generally create an asset for the purchaser rather than an immediate operating expense. Higher equipment prices increase the capital committed to subsequent production, with depreciation affecting earnings after the equipment enters service. Consequently, ASML’s stronger cash generation does not imply equally strong contemporaneous free cash flow across its customers.
The economic effect is a transfer of funding responsibility and some future surplus from manufacturers to their critical equipment supplier. Customers obtain capacity assurance, but commit cash earlier and reduce their freedom to alter expansion plans. If demand later disappoints, the relevant downside is not merely lower utilization: deposits, cancellation costs, committed construction expenditure, and subsequent depreciation can make the adjustment more expensive.
The negative conclusion must remain precise. ASML did not disclose a higher deposit percentage, customer-specific payment amounts, or the size of the agreed price increases. The call therefore establishes growing aggregate commitments, not a newly imposed deterioration in every customer’s contract. It also does not establish higher cost per wafer, because productivity improvements can offset a higher scanner purchase price. Micron and SK hynix’s previously reported liquidity strength further argues against interpreting the development as a financing crisis.
Near-term catalysts are customer capital-expenditure, equipment-prepayment, and cash-conversion disclosures in late 2026 and early 2027. The longer-duration effect emerges through equipment delivery and the full pricing implementation in 2028. The cross-portfolio implication is that equipment-supplier cash flow and chipmaker cash flow can diverge even while both companies’ earnings rise.
INSTALLED-FLEET PRODUCTIVITY PROVIDES A FASTER PATH TO MONETIZATION THAN GREENFIELD CAPACITY (READ-THROUGH 3)
Affected company: Taiwan Semiconductor Manufacturing Company (2330: Taiwan). Direction: positive. Magnitude: moderate for incremental output and capital efficiency, with potentially greater importance at individual constrained fabs.
ASML’s installed base management revenue reached EUR3.3 billion, approximately EUR0.4 billion above guidance, primarily because of productivity upgrades. Management emphasized that customers can increase capacity “on the same footprint” and described the benefit as “an immediate increase in output capability.” The company also plans to introduce the NXE:3800F at 260 wafers per hour, compared with 230 for the NXE:3800E, and move immersion products to 330 wafers per hour.
For TSMC, the most direct benefit is additional output from already established manufacturing infrastructure. An upgrade to a bottleneck scanner can increase productive exposure capacity without waiting for a new fab, a complete additional tool set, or the full commissioning cycle. Where downstream processes have sufficient capacity and demand is available, additional wafer revenue can be earned against infrastructure whose fixed costs are already largely in place.
The advantage is not simply higher equipment speed. It is shorter time between incremental investment and revenue generation. Established manufacturers with qualified process flows and substantial installed equipment can monetize these improvements more rapidly than a new entrant building an entire production ecosystem. This supports TSMC’s incremental manufacturing economics, although ASML disclosed neither customer-specific upgrade spending nor tool-allocation shares.
The approximately 13% nominal throughput increase from the 3800E to the 3800F applies to the new configuration, not TSMC’s entire EUV fleet. Moreover, higher scanner throughput does not translate automatically into equivalent finished-chip growth: dose, utilization, yield, and other process bottlenecks remain relevant.
TSMC’s October 15 earnings release, issued after ASML’s call, confirmed strong leading-edge demand and guided Q4 revenue to USD52.3 billion-USD54.3 billion. The ASML evidence is therefore now corroboration of the operating opportunity, not an unreported TSMC quarterly catalyst. Near-term monitoring should focus on monthly revenue and conversion of installed capacity into shipments. The longer-duration benefit is capital-efficient growth during the 2027-2028 expansion, with High NA adoption from 2030 providing a separate technology milestone rather than a prerequisite for near-term growth.
SEMICONDUCTOR EQUIPMENT AND COMPONENT SUPPLIERS
QUALIFIED OPTICS SUPPLIERS OFFER DIRECT EXPOSURE TO SCANNER OUTPUT, WITH JENOPTIK ALREADY SHOWING PROFIT CONVERSION (READ-THROUGH 4)
Affected company: Jenoptik (JEN: Germany). Direction: positive. Magnitude: high for its semiconductor-equipment business and meaningful for group profitability.
ASML plans approximately 30% capacity growth in both Low NA EUV and immersion in 2027 and is investigating a larger-than-previously-planned expansion in 2028. Fouquet said the company is working across suppliers to ensure they can support the ramp and stated, “every number we share with you is the result of us having validated that the supply chain can, of course, follow those numbers.”
Jenoptik is a verified supplier of high-precision micro-optics to ASML. Its semiconductor products include optical components and sensors used in lithography and inspection. These are not the main EUV projection optics supplied by Zeiss. The direct transmission mechanism is higher demand for qualified components as scanner production increases, followed by improved utilization of Jenoptik’s manufacturing capacity.
The investment significance is amplified by the sequencing of Jenoptik’s investment. Its Dresden facility opened in May 2025 after an investment of just under EUR100 million and produces micro-optics and sensors for DUV and EUV applications. Capacity established before the acceleration in customer demand can produce attractive incremental profit conversion as utilization rises, although customer qualification, product mix, and manufacturing yield determine the actual outcome.
This read-through has already received subsequent confirmation. On October 21, Jenoptik raised its 2026 EBITDA margin guidance from 20%-21% to approximately 22%, citing product mix and strong semiconductor-equipment demand. Preliminary 9-month order intake reached approximately EUR1.1 billion, compared with EUR777 million a year earlier. Revenue-growth guidance remained 5%-9%, making the update more notable for profitability and orders than for an immediate revenue acceleration.
The October 21 upgrade is a completed catalyst, not a future earnings surprise. The next identifiable catalyst is the November 10 detailed release, particularly order conversion, semiconductor exposure, and capacity utilization. The longer-duration opportunity is the 2027-2028 scanner ramp. ASML’s targeted output growth should not be applied directly to Jenoptik’s consolidated revenue, and ASML’s negotiated customer price increases should not be assumed to pass through to its suppliers.
ADVANCED LOGIC AND DRAM SUPPORT PROCESS EQUIPMENT, BUT ORDER DURATION AND REVENUE CONVERSION MUST BE SEPARATED (READ-THROUGH 5)
Affected companies: ASM International (ASM: Netherlands) and VAT Group (VACN: Switzerland). Direction: positive. Magnitude: high for their exposed semiconductor businesses and meaningful at group level.
ASML expects memory system sales to increase approximately 75% and advanced logic sales to increase more than 25% in 2026. Management also reported accelerating capacity plans and said customer cleanroom availability is not currently a major constraint on demand. The supported read-through is expansion in advanced wafer manufacturing, not a universal improvement across all semiconductor end markets.
ASM International participates through atomic layer deposition and epitaxy used in advanced logic and DRAM fabrication. Capacity additions require additional process equipment, while more complex transistor and memory structures support demand for tightly controlled materials deposition. ASML’s demand signals therefore corroborate both wafer-capacity growth and the technology transitions underlying ASM’s product exposure. This is shared customer exposure, not a claim that ASM supplies ASML scanners.
VAT benefits through vacuum valves and related systems incorporated into semiconductor production equipment. Its economic exposure spans equipment platforms and subsequent installed-base activity. Higher tool production increases component demand, while higher fab utilization supports consumables and maintenance requirements. The effect is broader than an assumed direct relationship with ASML’s scanner count.
The novelty test is important. ASM had already guided in July to Q3 revenue of EUR1.1 billion, plus or minus 5%, at constant currency, and expected 2027 revenue above its previous EUR4.6 billion upper target. ASML reinforces that trajectory rather than establishing an additional quantified upgrade. ASM’s October 27 results and October 28 call are immediate catalysts for whether demand strength is converting into a higher executable forecast.
VAT subsequently reported on October 15 a record CHF697 million of quarterly orders and a 1.9x book-to-bill ratio, and expected 2027 sales significantly above its former CHF1.7 billion upper guide. That is now direct company evidence rather than an unconfirmed ASML read-through. However, VAT also explained that ordering windows had lengthened from approximately 3 months at the end of 2025 to as much as 9 months or longer. Order growth therefore partly reflects longer commitment horizons, not just a proportional increase in near-term consumption.
A further distinction limits extrapolation of ASML’s upgrade profitability: VAT’s service orders increased 88% year over year, but service revenue increased only 4%, with customers limiting downtime. Near-term revenue depends on installation and maintenance windows; longer-duration demand remains favorable. The actionable focus is backlog conversion and factory output, not treating every equipment supplier’s orders or service revenue as economically equivalent to ASML’s.
PROCESS-CONTROL INTENSITY IS A DURABLE POSITIVE, BUT ASML’S OVERLAY SUCCESS DOES NOT BELONG TO KLA (READ-THROUGH 6)
Affected company: KLA Corporation (KLAC: USA). Direction: positive for broad inspection and metrology demand, with a specific competitive offset in overlay. Magnitude: moderate at group level; the call does not establish a KLA earnings upgrade or market-share change.
ASML shipped its first YieldStar 550B and described tighter process-control requirements at advanced logic and DRAM nodes. Management highlighted more than 60% greater productivity than the previous generation and said YieldStar demand is expected to more than double in the coming years versus 2025. It also cited High NA availability approaching 90% and manufacturing adoption plans at Samsung in 2028 and TSMC in 2030.
The favorable transmission mechanism for KLA is the increasing economic value of detecting process variation and defects quickly. More expensive wafers, tighter tolerances, new materials, and complex structures raise the cost of a yield excursion. Additional wafer capacity also increases the volume requiring monitoring. KLA’s portfolio has direct exposure through dimensional, film, defect, and overlay measurements used in leading-edge logic and DRAM.
However, ASML’s specific YieldStar demand forecast belongs to ASML. KLA’s Archer and ATL products participate in overlay metrology, making this an area of commercial overlap rather than a purely complementary relationship. A more productive YieldStar offering strengthens the alternative available to customers. It does not prove that KLA has lost share, because the disclosed productivity comparison is against ASML’s own earlier product, not against KLA equipment.
The highest-conviction conclusion is therefore favorable structural demand for process control, with more uncertainty over the allocation of overlay spending. KLA’s broader inspection and metrology exposure is the more defensible positive channel. Assigning ASML’s expected YieldStar growth to KLA would double-count the opportunity and ignore competition.
Near-term catalysts are customer sampling intensity, new-node qualification activity, and KLA’s own product and order commentary during the late-2026 reporting cycle. The longer-duration drivers are advanced logic and DRAM ramps in 2027-2028 and subsequent High NA deployment. The 2031 large-mask pilot and 2033 production-readiness objectives are ecosystem-development milestones, not evidence of material 2027 KLA revenue.
CHINA REMAINS A MATERIAL EQUIPMENT-DEMAND SOURCE, BUT IT IS A DIFFERENT EXPOSURE FROM THE ADVANCED-EUV CYCLE (READ-THROUGH 7)
Affected company: Lam Research (LRCX: USA). Direction: positive for accessible China equipment demand, with substantial regulatory concentration risk. Magnitude: moderate incremental support at group level because the regional exposure is already large.
ASML expects China to represent approximately 20% of total 2026 revenue. Dassen described strong domestic demand for mainstream logic and memory and said “there is a lot coming online” in Chinese fabs. The accompanying earnings notice reported China at 23% of Q3 system sales, compared with 14% in Q2. Using the rounded regional shares and reported system revenue implies approximately EUR1.93 billion of China system sales in Q3 versus EUR0.92 billion in Q2.
The positive transmission for Lam is complementary process-equipment demand associated with fabs installing lithography capacity. Those production lines also require etch, deposition, and cleaning equipment. This supports the durability of legally accessible Chinese customer spending; it does not imply that Lam receives a specified portion of ASML customers’ expenditure or that the companies have identical shipment timing.
The geographic distinction is material. ASML explicitly excluded China from the advanced EUV-related DRAM demand discussed for 2029 and 2030. Strong Chinese DUV demand and strong non-China EUV demand are separate drivers. Combining them into a single AI-capacity thesis would obscure differences in technology, customer economics, and export exposure.
Lam’s October 21 release, after ASML’s call, reported China at 35% of quarterly revenue and record company revenue of USD8.22 billion. The demand contribution is therefore already visible in Lam’s results. ASML now serves as corroboration of regional investment activity, not as a prediction of an unreported quarter.
Near-term attention belongs on December-quarter shipments, customer acceptance, and licensing developments. The longer-duration positive is continued investment in domestic Chinese semiconductor capacity. The negative is that a substantial revenue exposure remains dependent on permissible product and customer access. ASML’s confidence in customer demand is not evidence that regulatory risk has diminished. This argues for separating China-sensitive equipment exposure from non-China advanced-node exposure when assessing portfolio concentration.
COMPUTER HARDWARE AND DOWNSTREAM TECHNOLOGY
MEMORY SCARCITY EXTENDS THE COST AND UNIT-DEMAND CHALLENGE FOR PC MANUFACTURERS (READ-THROUGH 8)
Affected company: HP Inc. (HPQ: USA). Direction: negative for Personal Systems input costs and unit-demand economics; not sufficient evidence for an immediate reduction in consolidated guidance. Magnitude: moderate at group level and potentially high for the lower-margin PC business.
The source evidence is ASML’s statement that supply shortages across advanced logic and memory are increasing in size and duration, alongside approximately 75% growth in memory-related system sales and continued efforts to obtain more output through upgrades. The relevant negative inference is that rising equipment investment does not imply rapid normalization of memory availability or purchasing conditions.
HP purchases memory rather than earning the scarcity premium on its production. Persistent tightness increases the importance of supply agreements, inventory management, and frequent product repricing. If higher component costs are not recovered, hardware margins compress. If they are recovered through higher selling prices, customers can defer purchases, choose lower specifications, or extend replacement cycles. Revenue can therefore remain strong while unit demand weakens.
HP’s own latest quarterly disclosure illustrates the distinction. Personal Systems revenue increased 18% year over year while units declined 16%, and the segment’s operating margin was 4.6%. Price and mix contributed to revenue performance, but the release does not establish that memory inflation alone caused the unit decline. The low operating margin nonetheless makes unrecovered input-cost changes economically important: a cost increase equal to 1% of segment revenue, without offsets, would reduce operating profit by approximately 22%. That is a sensitivity, not a forecast.
There is meaningful counterevidence against an immediate bearish earnings call. HP reported improved memory supply and fulfillment, exceeded its EPS guidance, and raised its annual outlook. ASML does not overturn those results. The high-conviction negative read-through concerns the persistence of the procurement and affordability challenge, rather than a demonstrated failure of HP’s mitigation strategy.
Near-term catalysts are fiscal-year-end guidance, Personal Systems margin, unit demand, and the durability of supply improvements. The longer-duration risk is that memory conditions remain unfavorable into 2027 even as industry equipment spending rises. This is the clearest cross-sector contrast in the material: the same constrained memory supply that supports Micron and SK hynix can pressure downstream hardware economics. Long exposure to both sides is not automatically diversified, because cost pass-through determines which company retains the economic benefit.
Report record
- Sector
- Information Technology
- Industry
- Semiconductors & Semiconductor Equipment
- Fiscal period end
- September 30, 2026
- Report date
- October 14, 2026
- Analysis
- 7355 words
- Read-throughs
- 3123 words
- Content fingerprint (PDF)
4069123899b0- Content fingerprint (analysis)
46ce705a3cf4- Content fingerprint (read-throughs)
300a345a7d93
Prepared from the company's earnings release and earnings call transcript. Figures as reported by the company. For information only. Not investment advice.
More from ASML Holding N.V.
No other reports yet.
More in Information Technology
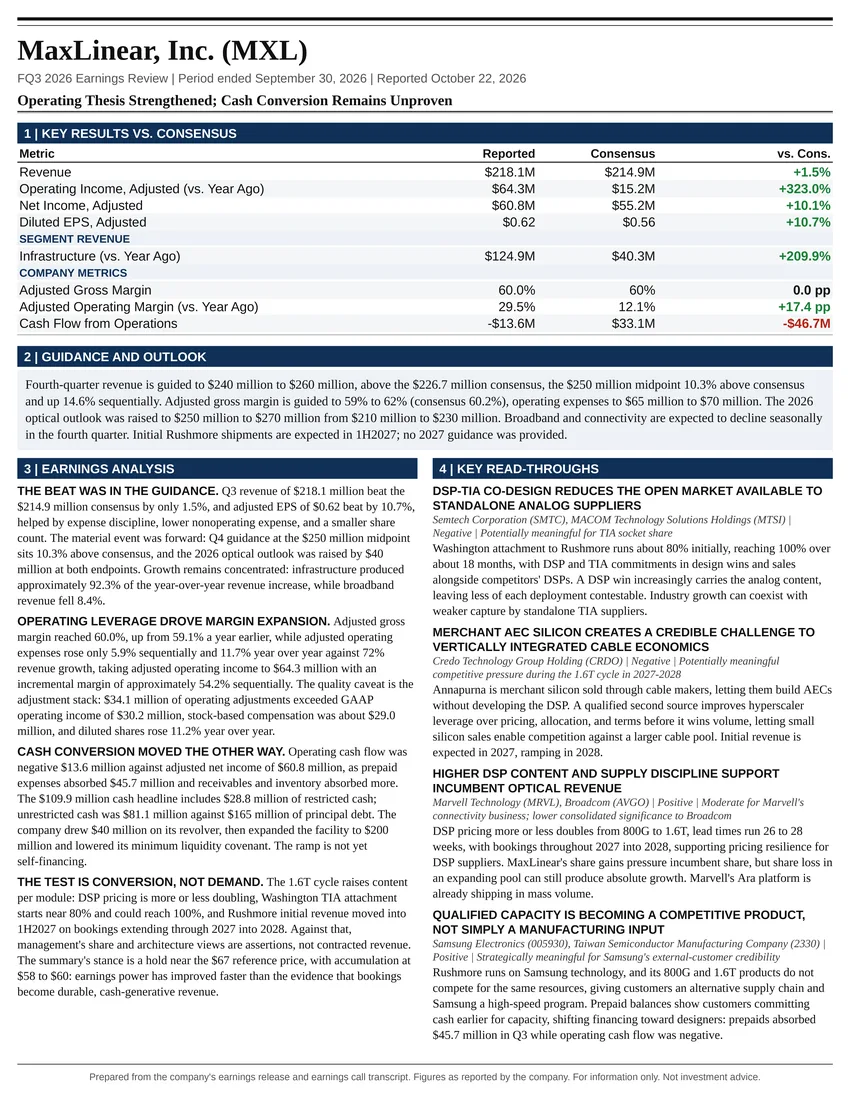
Operating Thesis Strengthened; Cash Conversion Remains Unproven
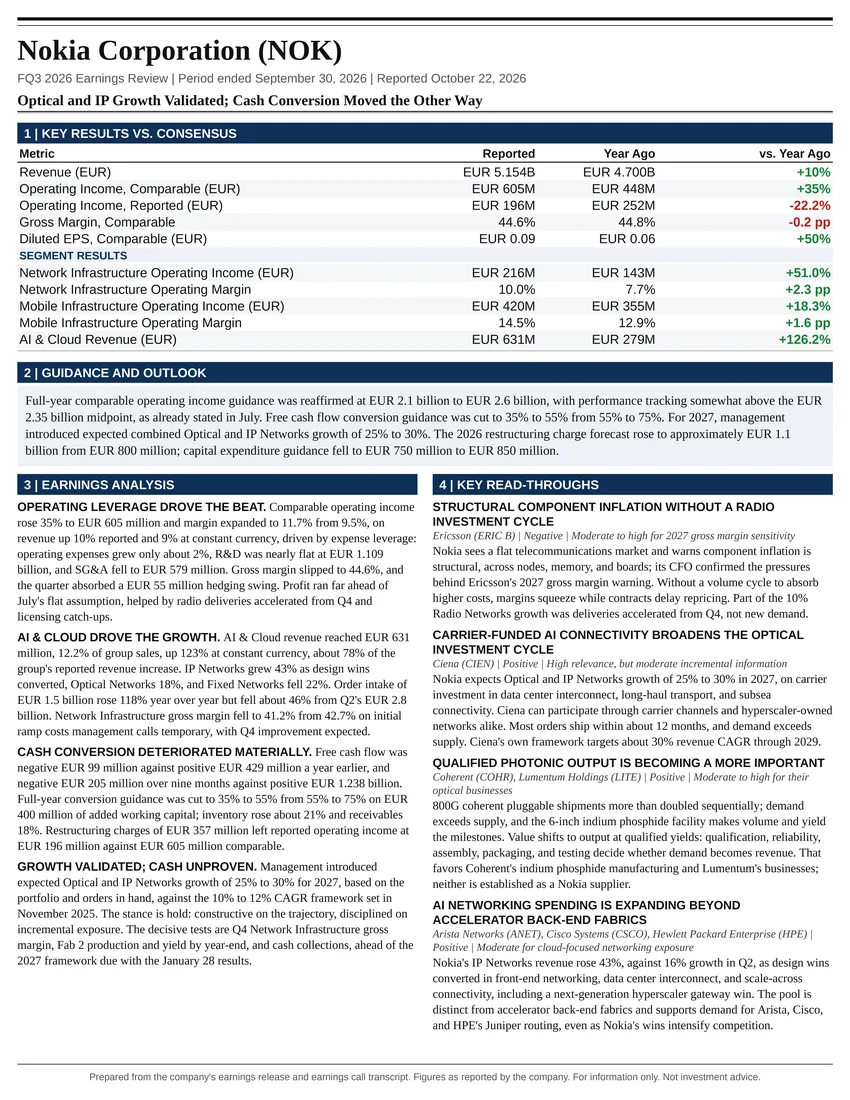
Optical and IP Growth Validated; Cash Conversion Moved the Other Way
All Information Technology reports
Follow @AtlasPeakRes on X for new earnings reports as they publish.