Positive for forward earnings revisions, but more qualified for valuation
Earnings Reports
Caterpillar Inc. FQ3 2026 Earnings Report
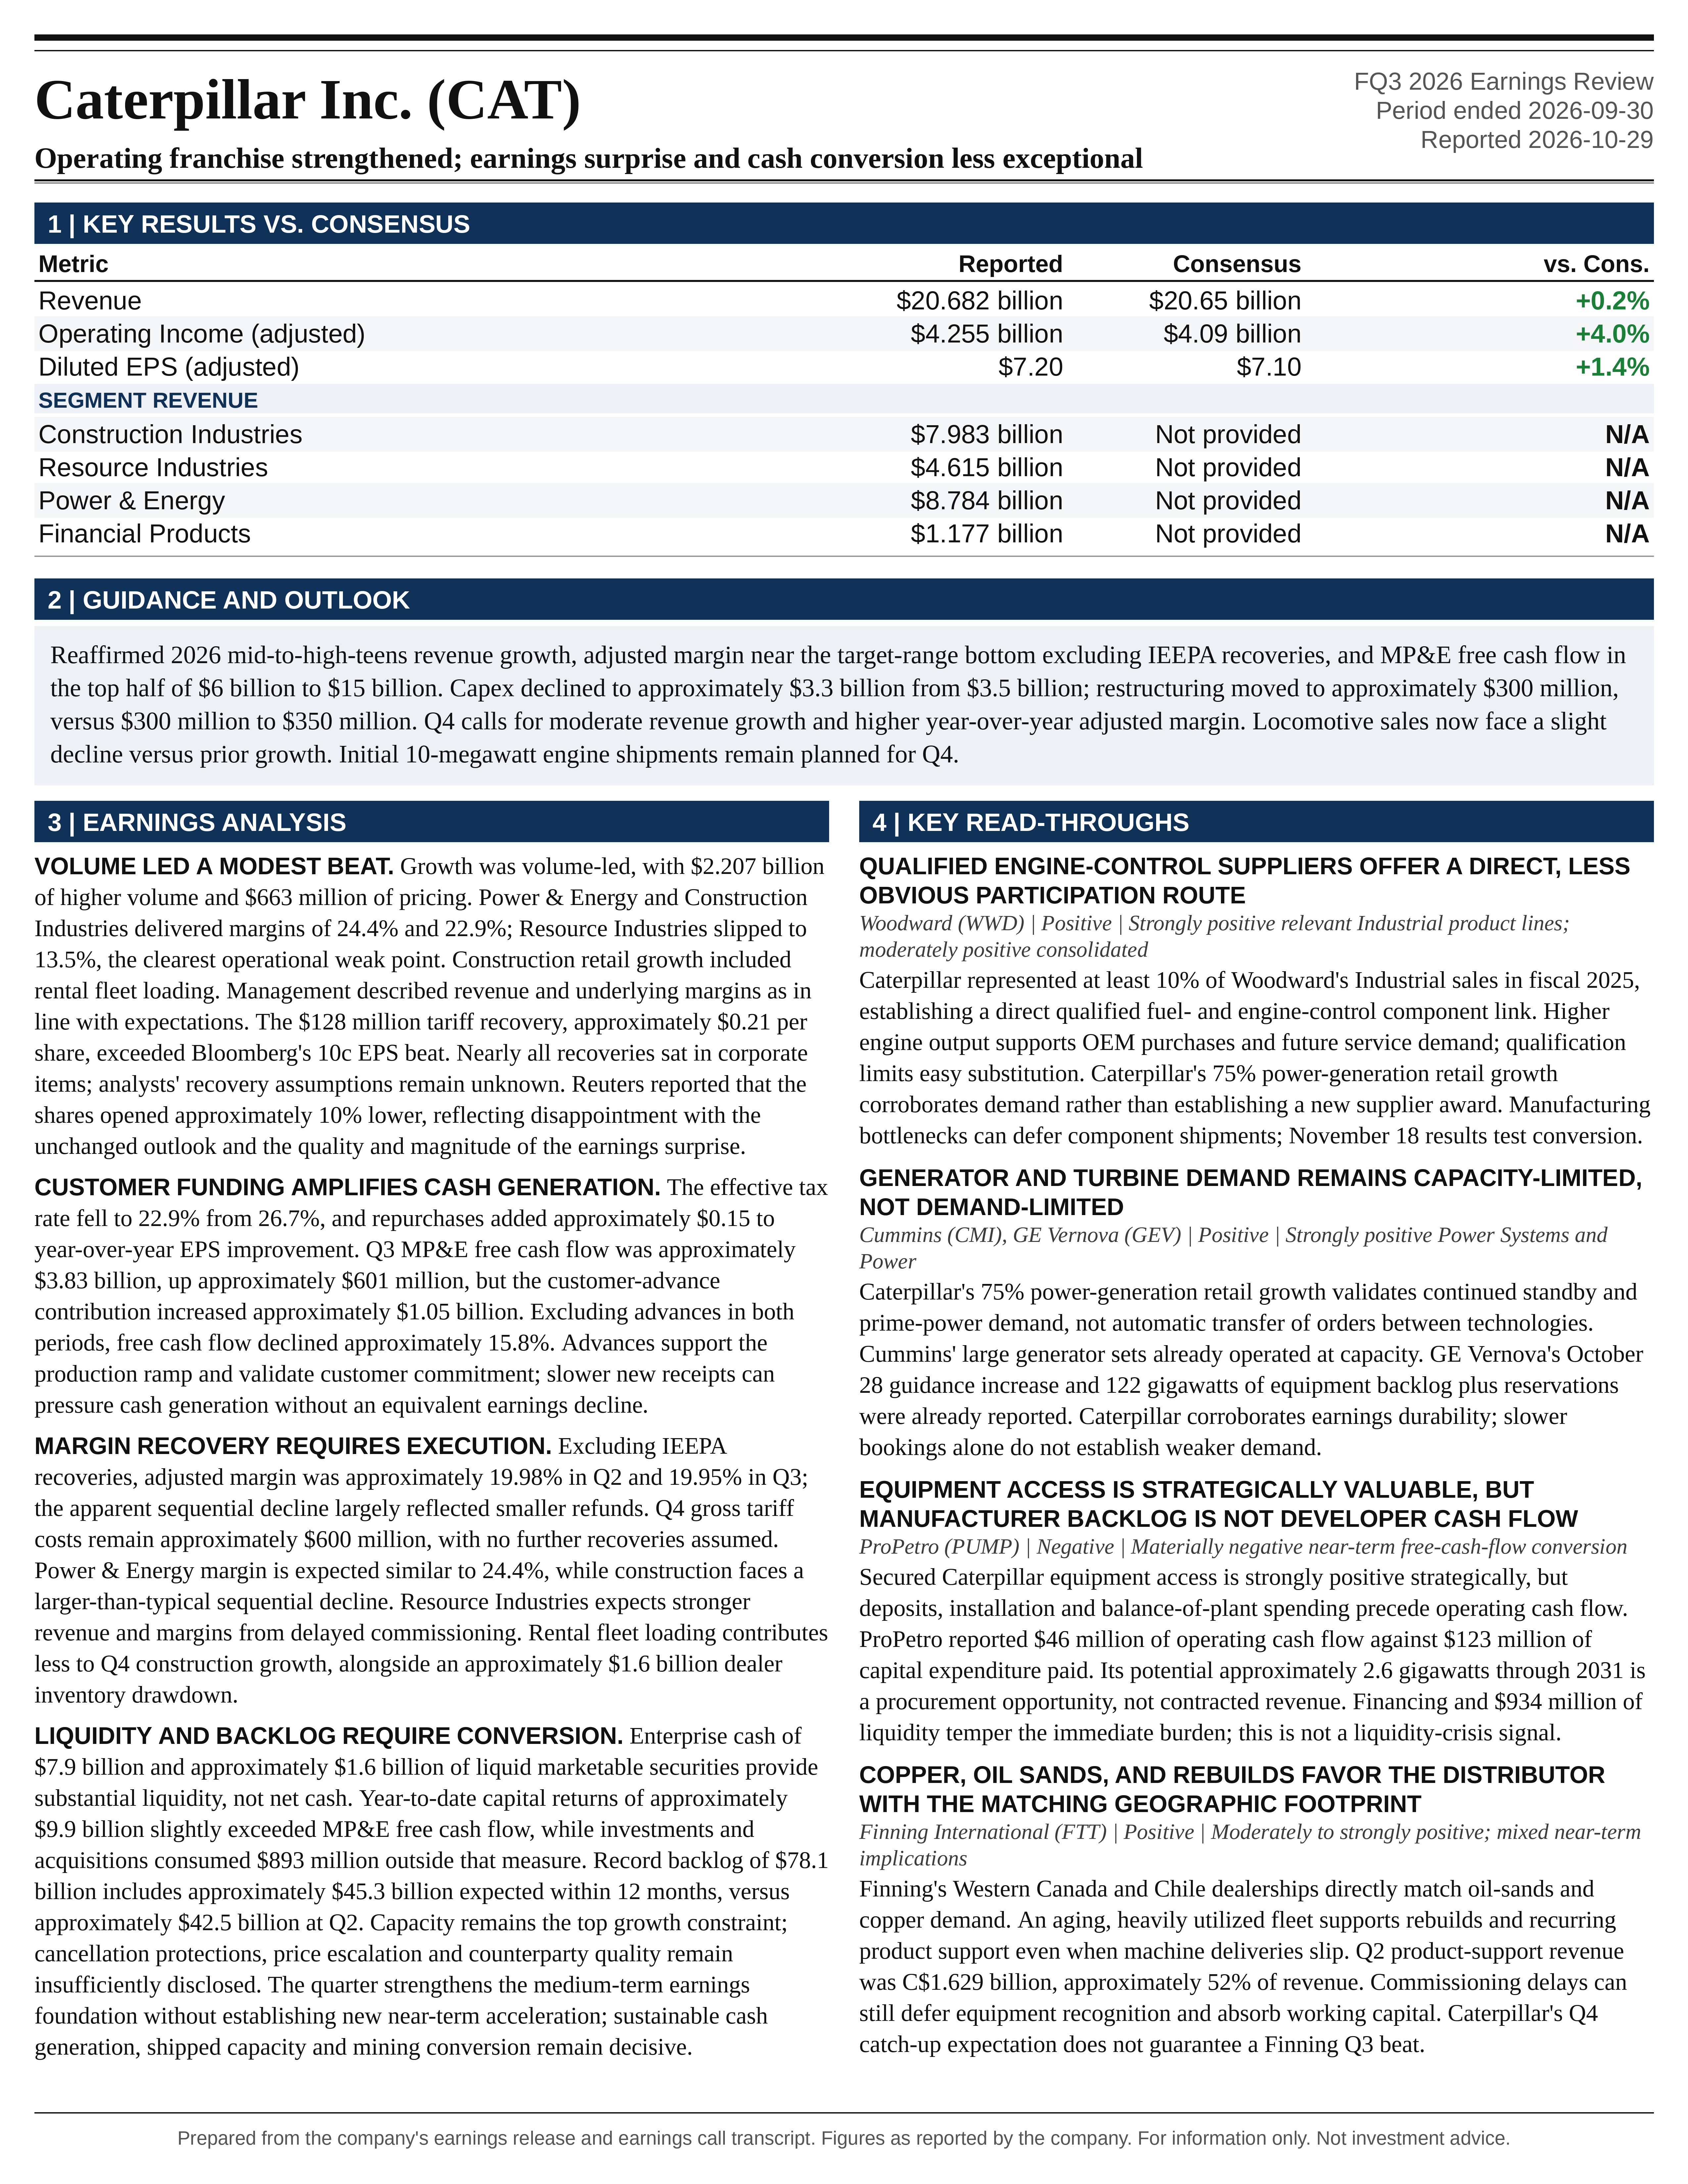
Caterpillar Inc. (CAT) FQ3 2026 earnings: Operating franchise strengthened; earnings surprise and cash conversion less exceptional. Full earnings analysis, key read-throughs, and the one-page exhibit from Atlas Peak Research.
Caterpillar Inc. (CAT)
Sector: Industrials · FQ3 2026 · Period end September 30, 2026 · Reported October 29, 2026
Caterpillar’s Q3 2026 earnings call supports a constructive operating outlook but a more selective investment stance. The appropriate earnings-event conclusion is HOLD rather than an unconditional increase in exposure.
Download the one-page report (PDF)
View one-page exhibit
Download analysis (.md)
Download read-throughs (.md)
Post to X
One-Page Exhibit
Earnings Analysis
EXECUTIVE CALL SUMMARY: Caterpillar Inc. (10/29/26)
Caterpillar’s Q3 2026 earnings call supports a constructive operating outlook but a more selective investment stance. The appropriate earnings-event conclusion is HOLD rather than an unconditional increase in exposure. Demand remains strong, pricing is favorable, backlog visibility has extended materially, and profitability improved substantially against Q3 2025. However, the quarter did not produce an underlying operational surprise relative to management’s expectations, full-year guidance was maintained rather than raised, and production constraints continue to limit the conversion of demand into revenue. The central investment question is shifting from whether Caterpillar can secure sufficient orders to whether capacity, commissioning, working capital, and pricing can convert those orders into durable per-share cash earnings.
Sales and revenues reached a record $20.682 billion, up 17.3%, while adjusted operating profit increased 37.7% to $4.255 billion and adjusted EPS increased 45.5% to $7.20. Those results are strong, but the reported earnings improvement requires normalization. Q3 included $128 million of IEEPA tariff recoveries, equivalent to approximately $0.21 per share. Excluding those recoveries, adjusted operating profit was approximately $4.127 billion, the operating margin was approximately 20.0%, and adjusted EPS was approximately $6.99. Underlying operating profit therefore still increased approximately 33.6%, but the headline earnings growth also benefited from a lower tax rate and share repurchases.
The record $78.1 billion backlog is the strongest evidence supporting earnings durability, although its composition and conversion matter more than its absolute size. Approximately $45.3 billion is expected to convert within 12 months, up from approximately $42.5 billion at Q2. This is a more useful positive signal than the extension of selected delivery slots into 2029 and 2030, which had already been disclosed before this call. Conversely, customer mix, cancellation protections, contractual price escalation, and project-level financing exposure remain insufficiently disclosed to treat the entire backlog as equivalent to guaranteed revenue or profit.
Cash generation was substantial but benefited materially from customer funding. Q3 machinery, power and energy free cash flow was approximately $3.83 billion, up approximately $601 million. The net cash-flow contribution from customer advances increased by approximately $1.05 billion versus Q3 2025, exceeding the entire reported free-cash-flow increase. Excluding that contribution in both periods, Q3 free cash flow declined approximately 15.8%. This does not invalidate the reported cash generation, especially while inventory is being built to support production, but it materially changes the interpretation of cash conversion and the sustainability of capital returns.
The quarter therefore strengthens the medium-term earnings foundation without establishing a new near-term acceleration. The next major investment catalysts are Q4 delivery execution, the realization of delayed mining commissioning, initial shipments of the restarted 10-megawatt engine platform, and formal 2027 guidance. A higher valuation requires evidence that capacity additions generate incremental revenue and margins without progressively greater reliance on customer advances, dealer fleet expansion, or tariff recoveries.
FINANCIAL BASIS AND COMPARABILITY
The relevant financial baseline is Caterpillar’s October 29 earnings release and financial-review presentation, supplemented by the August 4 Q2 call and presentation and the September investor update. The transcript’s isolated references to revenue and backlog in millions are transcription errors: quarterly revenue was $20.682 billion and backlog was $78.1 billion. Historical segment comparisons use the current presentation, including the transfer of Rail into Resource Industries effective January 1, 2026. Segment sales include intersegment transactions and therefore should not be added together or divided by consolidated revenue without adjustment.
Retail statistics also have different measurement conventions. Construction Industries and mining, heavy construction, and quarry and aggregates statistics are principally price-neutral measures derived from equipment units. Power & Energy retail statistics are reported in dollars. Neither measure is interchangeable with recognized segment revenue, which includes different service, product, intersegment, and timing effects.
REVENUE GROWTH AND EARNINGS QUALITY
The $3.044 billion year-over-year revenue increase consisted of $2.207 billion of higher sales volume, $663 million of favorable price realization, $58 million of currency benefits, and $116 million of higher Financial Products revenues. Volume contributed approximately 72.5% of the increase and pricing approximately 21.8%. Pricing alone represented approximately 3.8 percentage points of growth against the prior-year consolidated revenue base. The result was therefore predominantly volume-led, with meaningful pricing support and relatively little currency assistance.
The operating-profit bridge demonstrates substantial manufacturing leverage. Higher volume contributed $989 million of operating profit and favorable pricing contributed $663 million. These benefits were partially offset by $415 million of unfavorable manufacturing costs and other movements. The adjusted year-over-year incremental operating margin was approximately 38.3%. Removing the $128 million tariff recovery reduces that incremental margin to approximately 34.1%, which remains attractive and demonstrates that the earnings improvement was not principally an accounting benefit.
The distinction between reported and underlying profitability is nevertheless important. The tariff recovery added approximately 62 basis points to Q3 margin. Removing it reduces the reported 310-basis-point year-over-year adjusted margin improvement to approximately 244 basis points using the detailed financial amounts. Nearly all the recovery was recorded in corporate items, so the strong Power & Energy and Construction Industries segment margins should not be broadly dismissed as refund-driven. Conversely, the recovery should not be extrapolated into recurring corporate profitability.
Tax and share-count effects further amplified EPS. The effective tax rate was 22.9%, compared with 26.7% in Q3 2025. The prior-year quarter included a $54 million catch-up charge related to the annual tax-rate estimate and a $41 million charge for prior-year tax estimates. Even excluding discrete items, the estimated annual rate declined from 24% to 23%. Applying the prior-year adjusted effective tax rate to current adjusted pretax earnings would reduce current adjusted EPS by approximately $0.35, holding other factors constant. This is an analytical sensitivity, not a separate adjustment reported by Caterpillar.
Diluted shares declined to 460.9 million from 470.8 million, approximately 2.1%. Management attributed approximately $0.15 of year-over-year EPS improvement to repurchases. Excluding both the tariff recovery and the disclosed repurchase benefit, adjusted EPS would be approximately $6.84, still approximately 38% above the prior-year $4.95, although that comparison continues to benefit from the lower tax rate. The underlying earnings advance is substantial, but the headline 45% EPS growth should not be treated as a pure measure of operational improvement.
Sequential performance is more stable than the headline margin decline suggests. Revenue increased only 0.7% from Q2’s $20.543 billion, while adjusted EPS declined 11.9% from $8.17 and adjusted margin declined from 21.9% to 20.6%. However, Q2 contained $392 million of IEEPA recoveries, compared with $128 million in Q3. Excluding these recoveries, adjusted operating margin was approximately 19.98% in Q2 and 19.95% in Q3. The apparent 130-basis-point sequential margin decline was therefore almost entirely explained by the smaller recovery. This comparison removes only IEEPA recoveries, not every tariff-related adjustment or below-operating-line difference between the quarters.
Performance was broad across segments but geographically concentrated. North American consolidated revenue increased 24% to $12.017 billion, representing approximately 58.1% of total revenue and 76.7% of the year-over-year dollar increase. EAME and Latin America each grew approximately 15%, while Asia/Pacific declined approximately 2%. This is not a uniform global industrial recovery. The earnings expansion is particularly exposed to North American infrastructure, power investment, and construction activity.
RESULTS VERSUS EXPECTATIONS
Management repeatedly characterized consolidated revenue, segment revenue, and underlying operating margins as in line with expectations. Joe Creed stated: “Excluding IEEPA tariff recoveries, adjusted operating profit margin was in line with our expectations.” That wording is materially different from Q2, when stronger-than-expected results supported an increase in the annual outlook.
Contemporaneous Reuters reporting cited LSEG consensus of $20.55 billion for revenue and $7.08 for adjusted EPS. Against that specifically identified benchmark, revenue exceeded expectations by approximately 0.6% and adjusted EPS by approximately 1.7%. The $0.21 tariff-recovery contribution exceeded the $0.12 EPS beat. Excluding the recovery, EPS of approximately $6.99 would be below that published consensus, although a strict normalized consensus comparison cannot be established without knowing how much recovery, if any, analysts included.
The distinction explains why strong absolute growth did not necessarily constitute a positive earnings catalyst. Reuters reported that the shares opened approximately 10% lower, reflecting disappointment with the unchanged outlook and the quality and magnitude of the earnings surprise. That opening reaction is evidence of elevated expectations, not evidence that orders collapsed. Equally, the operating strength is not sufficient evidence that the shares were attractively valued after the decline.
BACKLOG: IMPROVED VISIBILITY, BUT NOT GUARANTEED EARNINGS
Backlog increased $6.0 billion sequentially to $78.1 billion and $38.2 billion year over year, approximately 96%. All 3 primary segments recorded sequential backlog growth for the 4th consecutive quarter. This breadth is important because it demonstrates that the order expansion extends beyond data-center power equipment into construction, oil and gas, and resources.
The most informative disclosure was Kyle Epley’s statement that “58% of our backlog is expected to be sold within the next 12 months,” compared with 59% at Q2. Applying those percentages to the disclosed balances implies approximately $45.3 billion of next-12-month backlog versus $42.5 billion previously, an increase of approximately $2.8 billion or 6.5%. Backlog beyond 12 months increased to approximately $32.8 billion from $29.6 billion. The slight decline in the near-term percentage therefore does not indicate shrinking near-term coverage. Both near-term and longer-duration backlog increased.
These are rolling conversion windows, not fixed calendar-year forecasts. The $45.3 billion cannot be treated as contracted 2027 revenue, and the total backlog cannot be divided by consolidated sales to produce a precise revenue-coverage ratio without aligning business scope. Financial Products revenues, shorter-cycle equipment orders, aftermarket demand, and intersegment eliminations complicate that comparison.
Sequential backlog additions slowed from $9.4 billion in Q2 to $6.0 billion in Q3. An analyst also referenced a book-to-bill decline from approximately 1.7 earlier in the year to approximately 1.3. Management appropriately noted that rising shipments can reduce book-to-bill even when orders remain strong. Large mining and prime-power orders are also inherently uneven. However, the response did not provide a quantitative Q4 bookings outlook or eliminate the possibility of a genuine deceleration in incremental demand. A lower book-to-bill should be assessed alongside gross orders, cancellations, delivery performance, and retail activity, rather than either dismissed or interpreted in isolation.
Orders extending into 2029 for large reciprocating engines and 2030 for turbines are not entirely new information. Q2 and the September investor update already discussed these horizons. The Q3 call provides more product-level detail: significant gas prime-power orders are generally looking toward 2029, some diesel-backup slots remain available in 2028, and smaller engines have substantially shorter lead times. It would be incorrect to characterize all Caterpillar capacity as sold out through 2028.
Framework agreements provide planning visibility beyond booked orders, but they are not automatically firm backlog. Creed stated that “we have a line of sight past the backlog.” This supports capacity planning, but it does not establish enforceable minimum purchases, nonrefundable deposits, fixed prices, or guaranteed margins. Customer forecasts, reserved capacity, firm purchase orders, and project financing commitments remain distinct levels of commercial certainty.
POWER & ENERGY: STRONG ECONOMICS, CONSTRAINED CONVERSION
Power & Energy sales increased 17.7% to $8.784 billion and segment profit increased 31.2% to $2.143 billion. Margin expanded 250 basis points to 24.4%, producing an incremental margin of approximately 38.6%. This is the strongest combination of growth, profitability, and visibility within the portfolio.
The $8.784 billion segment sales figure includes $1.496 billion of intersegment sales. External revenue was $7.288 billion, approximately 35.2% of consolidated revenue. Within external revenue, power generation increased 30% to $3.421 billion, oil and gas increased 13% to $2.236 billion, and industrial applications increased 4% to $1.631 billion. Power-generation revenue represented approximately 16.5% of consolidated revenue, but that category is not equivalent to data-center revenue. It includes other power applications, while data-center investment can also support other Caterpillar businesses.
Retail power-generation sales increased 75%, accelerating from 72% in Q2. Total Power & Energy sales to users increased 36%, versus 33% in Q2. Oil and gas retail growth moderated slightly to 5% from 6%, while industrial retail activity improved to a 3% decline from an 8% decline. The divergence between 75% power-generation retail growth and 30% recognized power-generation revenue growth should not be treated as an accounting inconsistency. The measures differ in timing and perimeter, including services. Nevertheless, the divergence reinforces the conclusion that end-user demand is considerably stronger than the company’s immediately available production response.
Capacity remains the primary constraint. Creed explicitly stated that “bringing additional capacity online is still the top pacing factor for growth in Power and Energy.” Later, he described the production system more starkly: “there’s no slack in the system.” A temporary test-cell interruption in Q3 was overcome, but the disclosure demonstrates the sensitivity of shipments to individual process bottlenecks. Strong backlog does not remove execution risk; it can increase the financial importance of relatively small disruptions.
The planned use of the Winston-Salem facility as an additional assembly and test location for 3600-series engines is strategically sensible. Repurposing an existing site and workforce should reduce implementation time and capital intensity relative to a greenfield facility, while supporting gas-compression demand. However, engine output depends on more than final assembly. Components, machining, suppliers, testing, skilled labor, and customer acceptance must all expand together. Additional floor space does not necessarily translate immediately into additional saleable output.
The plan to increase large reciprocating-engine capacity to nearly 3x 2024 levels by 2030 remains intact. Q3 did not provide the requested dollar estimate for incremental 2027 capacity. This is a major forecasting limitation. A long-term capacity target does not establish annual revenue progression, especially when product mix, commissioning, and supply-chain constraints can change the conversion of nominal capacity into shipments.
The 10-megawatt MaK engine restart is a tangible near-term milestone. Creed said, “we plan to ship our first units here in the fourth quarter,” followed by a ramp through 2027. The Q2 call had described approximately 1.5 gigawatts of capacity associated with the restart and indicated that it was separate from the previously discussed 65-gigawatt large-engine capacity figure. At the stated rating, 1.5 gigawatts corresponds arithmetically to approximately 150 engines of nominal capacity, not a disclosed shipment commitment. The platform fills a gap between high-speed gas engines and industrial turbines, but its revenue, margin, and ramp contribution remain unquantified.
PRIME POWER, AFTERMARKET VALUE, AND COUNTERPARTY RISK
Prime power potentially changes the lifetime economics of Caterpillar’s installed base. Standby equipment primarily provides availability and resilience, whereas prime-power equipment operates to supply ongoing electricity demand. Higher operating hours should increase maintenance, parts consumption, overhaul demand, and service opportunities. Consequently, equivalent installed megawatts can produce materially different lifetime aftermarket economics depending on utilization.
This opportunity is accompanied by greater operating obligations. Continuous-duty applications increase the importance of fuel efficiency, emissions compliance, reliability, service response, and spare-parts availability. Caterpillar’s existing service network is an advantage, but the call did not quantify service attachment, contracted service margins, warranty exposure, or lifetime revenue per megawatt. The installed-base opportunity is credible; its precise earnings value remains a modeling assumption.
Management’s emphasis on natural-gas compression expands the investment thesis beyond generators sold directly to data centers. Increased gas-fired generation requires additional gas movement and compression, supporting both reciprocating engines and Solar Turbines. However, this is not wholly independent diversification. Power-generation equipment and gas-compression demand can share exposure to the same underlying infrastructure cycle.
The response to counterparty and permitting questions was reassuring but incomplete. Management reported no significant change in project scheduling behavior and described close coordination with customers. It declined to quantify the mix of hyperscalers, colocation providers, independent power producers, and other counterparties. The presence of a hyperscaler as an ultimate power consumer does not establish that the hyperscaler guarantees the equipment purchaser’s obligations.
Customer advances demonstrate tangible commitment and provide working-capital support, but they do not independently establish cancellation protection. The call did not disclose refundability, termination penalties, parent guarantees, price-escalation clauses, or the amount of backlog dependent on uncompleted permitting and financing. These omissions become more consequential as delivery horizons extend. Longer backlog improves visibility while also lengthening exposure to customer credit, project economics, regulatory approvals, and input-cost changes.
CONSTRUCTION INDUSTRIES: STRONG DEMAND WITH A MATERIAL FLEET-LOADING COMPONENT
Construction Industries sales increased 18.1% to $7.983 billion, while segment profit increased 33.0% to $1.831 billion. Margin expanded 250 basis points to 22.9%, and the incremental margin was approximately 37.1%. Higher volume contributed $356 million of profit and favorable pricing contributed $349 million, partially offset by $252 million of unfavorable manufacturing costs.
Retail sales increased 20%, marking the 7th consecutive quarter of year-over-year growth. North America increased 27%, matching Q2. EAME accelerated to 16% from 13%, Latin America slowed to 13% from 24%, and Asia/Pacific shifted to a 2% decline from 8% growth. These regional differences are important. The strongest demand remains concentrated in North America, while Latin American growth moderated and Asia/Pacific underperformed expectations.
Dealer rental fleet loading contributed significantly to Q3 retail growth, especially through the Major Projects initiative. Creed stated that “as soon as we can get fleet on the ground, they’re moving to projects.” That is supportive evidence of deployment rather than purely speculative fleet accumulation. Management also said retail growth remained strong excluding rental loading, although no numerical ex-loading growth rate was disclosed.
Fleet loading and dealer inventory must be separated. Equipment transferred into a dealer rental fleet can count as a sale to a user even though it remains owned by the dealer. Conversely, dealer inventory generally refers to machines available for sale. Construction dealer inventory increased only $300 million, versus $600 million in Q3 2025, creating a year-over-year wholesale headwind despite strong fleet loading. The quarter therefore does not support a simple allegation that construction revenue growth was driven by increased unsold dealer stocks. It does establish that rental investment amplified retail growth.
The Major Projects joint venture is dealer-owned, not a wholly owned Caterpillar rental platform. Its national scale can allow local dealers to participate in projects requiring equipment classes or fleet sizes beyond their individual capabilities. Caterpillar benefits from equipment demand, distribution reach, financing opportunities, and aftermarket activity, but rental revenue and rental-fleet returns should not be attributed directly to Caterpillar without additional ownership or contractual disclosures.
The sustainability test is fleet utilization, rental yields, project duration, and replacement demand after the initial fleet build. A successful launch can produce a large initial equipment-sales contribution that subsequently normalizes even if the underlying rental operation remains healthy. Management explicitly expects rental loading to contribute less to year-over-year Q4 growth because the prior-year comparison becomes more demanding.
Regional wholesale growth also warrants scrutiny. The earnings release attributed much of Latin America’s construction volume growth to dealer inventory changes, while Asia/Pacific volume benefited from inventory movements despite weak retail activity. Global pricing strength was not universal: Asia/Pacific construction pricing was unfavorable. These details temper the broader claim of synchronized construction strength.
The $1 billion Sanford investment supports the Cat Compact strategy and longer-term penetration of smaller contractors. Automation, digital production, and integrated logistics could improve manufacturing efficiency and broaden the addressable customer base. However, the call did not disclose project-level returns, capacity timing, or incremental revenue. The investment should be evaluated as a separate capital-allocation commitment, rather than assumed to deliver the economics currently observed in large power equipment.
RESOURCE INDUSTRIES: STRONG ORDERS, WEAKER CONVERSION AND MARGINS
Resource Industries sales increased 15.4% to $4.615 billion, but segment profit increased only 14.3% to $622 million. Margin declined slightly to 13.5% from 13.6%, producing an incremental margin of approximately 12.7%. This is the clearest operational weak point in the quarter. Higher revenue did not generate the degree of earnings leverage observed elsewhere.
The profit bridge explains the limitation. Higher volume contributed $181 million and pricing contributed $96 million, but unfavorable manufacturing costs absorbed $208 million. Material costs, tariffs, and production-ramp inefficiencies therefore consumed most of the available leverage. Favorable geographic mix helped pricing, meaning the pricing improvement should not be interpreted entirely as broad contractual price increases.
Sales to users increased only 4%, below expectations and down from 17% growth in Q2. The aggregate requires disaggregation: mining, heavy construction, and quarry and aggregates retail sales increased 8%, while rail retail sales declined 70% because of locomotive-delivery timing. Management separately indicated that mining retail sales were lower because of shipment and commissioning delays, with heavy construction and aggregates providing support.
Recognized mining, heavy construction, and aggregates revenue increased 22%, considerably faster than the 8% retail measure. The earnings release attributed the revenue increase primarily to dealer inventory changes. This is consistent with equipment progressing through the distribution system ahead of end-user commissioning, although the call did not provide a transaction-level bridge. It makes Q4 retail conversion especially important. If the expected commissioning catch-up fails to occur, the explanation would need to move beyond temporary timing.
Rail revenue declined only 5% to $832 million, much less than the 70% retail decline, reflecting the broader revenue perimeter and support from services. The full-year locomotive outlook was explicitly reduced: Q2 anticipated growth, whereas Q3 anticipated a slight decline because of delivery timing. Rail services are still expected to grow. This is a genuine adverse revision within an otherwise maintained enterprise outlook.
Management described 3 consecutive strong order quarters, supported by copper, gold, Canadian oil sands, and heavy construction. High utilization and an elevated fleet age support replacement demand. Rebuild activity is also expected to increase moderately. Nevertheless, replacement demand and rebuild activity do not necessarily translate into identical revenue and margin outcomes. The mix between new machines, rebuilds, parts, and autonomous systems remains important.
The autonomy expansion into additional Luck Stone quarry operations is strategically relevant because it extends the technology beyond large mining applications. The Bull Run deployment had hauled more than 3.5 million tons since November 2024, and the additional deployments include the Cat 775 platform. This provides evidence of operational use, but tonnage alone does not establish customer payback, autonomous-system margins, or recurring software economics. No quantified near-term earnings contribution was provided.
FINANCIAL PRODUCTS: HEALTHY CREDIT WITH SOME RESERVE CAUTION
Financial Products revenue increased 9% to $1.177 billion and segment profit increased 10% to $264 million. Higher average earning assets supported revenue and profit, while lower financing rates and a higher credit-loss provision partially offset those benefits. Revenue growth was therefore not primarily driven by higher financing yields.
Credit performance remains strong. Past dues declined to 1.31% from 1.47%, the lowest level cited since 1998, while net write-offs declined to $28 million from $40 million. Low used-equipment inventories and above-historical lease-purchase conversion rates further support customer health and residual-value confidence.
The reserve picture is somewhat more cautious than the delinquency statistic alone suggests. The allowance increased to $332 million, or 0.91% of receivables, from $294 million and 0.84% at Q2. The year-over-year provision increase reduced segment profit by $34 million. These movements do not establish deteriorating credit, particularly with expanding earning assets and lower write-offs, but they indicate that management is not extrapolating exceptionally low past dues into lower reserve requirements.
CURRENT GUIDANCE VERSUS PRIOR GUIDANCE
The principal 2026 outlook was unchanged from Q2 and consistent with the September investor update. Revenue growth remains in the mid-to-high teens. Adjusted operating margin remains near the bottom of the progressive target range excluding IEEPA recoveries. MP&E free cash flow remains in the top half of the $6 billion to $15 billion annual range. Tariff costs remain approximately $2.2 billion excluding recoveries, and the estimated annual tax rate remains 23%.
The explicit financial changes were smaller. Capital expenditure guidance declined to approximately $3.3 billion from $3.5 billion, a $200 million reduction. Restructuring costs moved to approximately $300 million, the bottom of the prior $300 million to $350 million range. These changes modestly improve cash requirements and reported earnings, but lower restructuring costs do not improve adjusted operating profit to the extent those costs are excluded from the adjusted measure.
The Q4 construction inventory reduction was specified at approximately $1.6 billion. Q2 had already anticipated a reduction exceeding $1 billion, so the direction was not new. The current disclosure provides a more concrete headwind: compared with a $600 million reduction in Q4 2025, dealer inventory movements will reduce year-over-year construction sales volume by approximately $1 billion. Dealer inventory is still expected to finish 2026 almost $700 million above year-end 2025.
The guidance therefore describes a deliberate distinction between retail activity and factory shipments. Strong construction sales to users can coexist with approximately flat Construction Industries revenue because dealers are expected to satisfy part of that demand from inventory. A weak wholesale comparison would not, by itself, invalidate the retail-demand outlook. However, if retail activity also disappoints, the assumed distinction would no longer provide sufficient protection.
For Q4, Power & Energy is expected to produce moderate revenue growth, with margin approximately similar to Q3’s 24.4%. Construction revenue is expected to be approximately unchanged year over year, with higher year-over-year margin but a larger-than-typical sequential margin decline. Resource Industries is expected to produce strong revenue growth and a higher margin, supported partly by delayed commissioning. The enterprise expects moderate revenue growth and a higher year-over-year adjusted margin.
The full-year outlook can be translated into an illustrative Q4 hurdle, but not a new management point forecast. Using approximately $67.6 billion of 2025 revenue, 17% full-year growth implies approximately $79.1 billion in 2026. Subtracting reported year-to-date revenue of $58.640 billion implies approximately $20.45 billion for Q4, or roughly 6.8% growth against the prior-year quarter and approximately flat sequential revenue. An 18% annual-growth assumption implies approximately $21.13 billion of Q4 revenue. Each 1-percentage-point change in the annual growth assumption moves the residual Q4 revenue requirement by approximately $676 million.
This sensitivity explains the importance of apparently modest wording differences between mid-to-high-teens guidance and a high-teens market expectation. It also explains why analysts pressed for clarification on production throughput. Management’s response was that the plan had not changed, comparisons were difficult, and capacity remained the constraint. No quantified 2027 revenue outlook was provided.
TARIFFS, INFLATION, AND THE MARGIN FRAMEWORK
Q3 tariff costs were approximately $600 million before recoveries, broadly unchanged year over year. The missing amount in the transcript is confirmed by the presentation. Q4 tariff costs are also expected to be approximately $600 million, approximately $200 million below Q4 2025. Management expects approximately 50% of Q4 tariffs in Construction Industries and 25% in each of Power & Energy and Resource Industries, implying approximately $300 million, $150 million, and $150 million, respectively.
The lower Q4 year-over-year tariff burden is a meaningful profit support, but it should not be confused with sequential relief. Gross tariff costs are expected to remain approximately unchanged from Q3, and the outlook assumes no further IEEPA recoveries. Q4 therefore loses Q3’s $128 million recovery benefit unless additional recoveries occur. Year-over-year improvement and sequential pressure can coexist.
Reported year-to-date recoveries total approximately $520 million. Subtracting them from the $2.2 billion annual gross tariff-cost estimate gives an illustrative net recognized burden of approximately $1.68 billion, assuming no further recoveries. This is an accounting comparison, not a forecast of cash refunds received. The recurring operating assessment should continue to use the gross cost burden unless additional recoveries become sufficiently predictable.
The progressive margin framework explains why substantial year-over-year margin improvement can coexist with guidance near the bottom of the target range. The target is 15%-19% at $60 billion of revenue, 18%-22% at $72 billion, and 21%-25% at $100 billion. The profitability hurdle rises as revenue increases.
At an illustrative $79.1 billion revenue level, linear interpolation of the published framework implies a target band of approximately 18.8%-22.8%, with a midpoint near 20.8%. This is an analytical interpolation, not a separately issued annual margin forecast. Moving from the bottom to the midpoint represents approximately 200 basis points of margin improvement, or approximately $1.6 billion of operating profit at an $80 billion revenue base. At a 23% tax rate and approximately the current diluted share count, that would represent roughly $2.7 per share before other changes.
Management did not commit to achieving that midpoint in 2027. Creed stated that “over the next couple of years, we want to try to work our way back to the midpoint.” The statement supports gradual improvement, not an immediate full recovery. Capacity-related depreciation, startup inefficiencies, freight, materials, and technology spending remain offsets.
The most durable route to the midpoint is better utilization of productive capacity, improved manufacturing execution, profitable mix, and pricing that adequately compensates for cost inflation. Tariff relief would help, but an investment case dependent on both rapid operational normalization and full tariff relief would embed multiple favorable assumptions.
CASH FLOW: CUSTOMER FUNDING IS A MATERIAL PART OF THE STORY
MP&E operating cash flow was approximately $4.5 billion in Q3, with approximately $700 million of capital expenditure and $3.8 billion of free cash flow. Year-to-date MP&E operating cash flow was $11.534 billion, and free cash flow was approximately $9.525 billion, compared with approximately $5.801 billion in the prior year. The company’s reported cash generation is strong.
The composition is critical. Year-to-date customer advances contributed $4.002 billion to operating cash flow, compared with $1.649 billion in 2025. During the same period, MP&E inventory absorbed $4.114 billion, trade and other receivables absorbed $1.146 billion, and accounts payable provided $1.635 billion. Customer funding is therefore materially financing the production ramp and working-capital expansion.
The standalone Q3 comparison is less favorable than the headline free-cash-flow growth. Subtracting the first-half statements from the 9-month statements gives approximately $1.426 billion of customer-advance cash contribution in Q3 2026, compared with approximately $373 million in Q3 2025. Reported Q3 free cash flow increased from approximately $3.226 billion to $3.827 billion, but the advance contribution increased by approximately $1.053 billion.
Removing the advance contribution from both periods produces an analytical free-cash-flow measure of approximately $2.401 billion in Q3 2026 versus $2.853 billion in Q3 2025, a decline of approximately 15.8%. On a year-to-date basis, the equivalent measure increased approximately 33%, from $4.152 billion to $5.523 billion. The balanced conclusion is therefore that underlying cumulative cash generation improved substantially, but the latest-quarter improvement in reported free cash flow was more than explained by greater customer funding.
This calculation is not a claim that advances are low-quality or should always be excluded. Advance payments can validate demand, improve capital efficiency, and reduce the funding burden of long production cycles. The risk is that a slowdown in new advance receipts, a change in terms, or a shift from booking growth to backlog conversion can reduce cash generation without an equivalent decline in recognized earnings. Advance-supported cash flow should not be assumed to repeat indefinitely at the same rate.
Reported free cash flow also excludes investments and acquisitions. MP&E investments and acquisitions consumed $893 million year to date, compared with $26 million in the prior year. That spending should be considered when evaluating cash remaining after broader strategic investment, rather than interpreting the free-cash-flow figure as the amount available after all investment activity.
The cash-flow outlook remains broad. The top half of the $6 billion to $15 billion range corresponds approximately to $10.5 billion to $15 billion. With approximately $9.5 billion already generated, the residual Q4 requirement spans approximately $1.0 billion to $5.5 billion. Q2 had additionally indicated that second-half free cash flow should be slightly higher than first-half free cash flow. That more specific statement was not explicitly repeated on this call, but omission is not evidence of withdrawal.
The reduced $3.3 billion capital-spending forecast still implies approximately $1.3 billion in Q4 after roughly $2.0 billion through September, materially above the Q3 spending pace. The reduction could reflect timing, efficiency, or revised spending requirements; the call did not quantify the split. Capacity plans were described as on schedule, so the lower capital budget should not automatically be interpreted as a reduction in the growth plan.
CAPITAL ALLOCATION AND BALANCE-SHEET CAPACITY
Caterpillar returned approximately $2.0 billion in Q3, including $1.2 billion of repurchases and nearly $750 million of dividends. Year-to-date repurchases and dividends totaled approximately $9.9 billion, slightly above reported year-to-date MP&E free cash flow. The policy of returning substantially all MP&E free cash flow over time remains intact, but repurchases are discretionary and should be evaluated against normalized cash generation and valuation.
Enterprise cash of $7.9 billion and approximately $1.6 billion of additional liquid marketable securities provide substantial liquidity. These balances should not be described as net cash. Financial Products carries financing liabilities against its earning assets, while the industrial business also has debt. The principal near-term risk is not an evident liquidity shortage; it is whether capital returns, strategic investment, and working-capital growth remain appropriately balanced if customer-advance inflows normalize.
The lower Q3 repurchase pace versus Q2 should not independently be interpreted as a negative management signal. Cash needs, purchase timing, and valuation can affect quarterly activity. More important is whether future repurchases generate attractive per-share value rather than merely sustaining EPS growth as operational growth moderates.
WHAT THE Q&A RESOLVED AND WHAT REMAINS OPEN
The Q&A established that management continues to see strong customer demand, has not observed a significant change in project scheduling behavior, and considers current production expansion plans intact. It also clarified that the backlog is not uniformly extended across every product, that some diesel-backup slots remain available before the longest gas-engine horizons, and that construction inventory reductions are consistent with a planned seasonal pattern.
The discussion did not resolve the magnitude of incremental 2027 capacity, the proportion of backlog backed by investment-grade obligors, contractual price protection on long-dated orders, the economic split between prime and standby power, or the timing of Resource Industries margin normalization. No updated prime-power gigawatt figure was provided. The questions were directly relevant, and the largely qualitative responses leave meaningful uncertainty in forward earnings models.
Management’s confidence is therefore best interpreted as confidence in demand and the strategic direction, not as a quantified commitment to accelerate 2027 revenue above the long-term 6%-9% growth framework. Strong order visibility supports that possibility, but capacity and conversion evidence must establish it.
INVESTMENT SCENARIOS
A base case with an illustrative 50% probability assumes that demand remains healthy, production expands progressively, construction retail growth moderates after elevated fleet loading, and Resource Industries converts delayed deliveries without a major new disruption. Using approximately $79.1 billion as an illustrative 2026 revenue anchor, 9% growth would produce approximately $86.2 billion of 2027 revenue. A 20.5% operating margin excluding unusual recoveries would imply approximately $17.7 billion of operating profit. This scenario reflects continued earnings improvement without requiring an immediate move to the upper end of the margin framework.
A bull case with an illustrative 25% probability assumes faster capacity conversion, a successful 10-megawatt engine ramp, sustained prime-power demand, strong construction fleet utilization, and improved mining execution. Revenue growth of 16% from the same anchor would imply approximately $91.7 billion of 2027 revenue. A 22% margin would produce approximately $20.2 billion of operating profit. This outcome requires both strong demand and successful manufacturing execution; additional backlog alone would not establish it.
A bear case with an illustrative 25% probability assumes project deferrals, slower rental fleet investment, persistent mining commissioning issues, and cost pressure that pricing does not fully absorb. A 2% revenue decline would imply approximately $77.5 billion of 2027 revenue. A 17.5% margin would produce approximately $13.6 billion of operating profit. The downside need not involve wholesale backlog cancellation. Slower conversion, less favorable customer funding, and higher fixed costs could pressure earnings and cash flow while the reported backlog remains large.
These are analytical scenarios, not management guidance or statistically estimated probabilities. They imply a probability-weighted operating-profit outcome of approximately $17.3 billion. They do not establish an equity return without a valuation assumption. Even 15% EPS growth would produce an approximately 8% share-price decline if the earnings multiple compressed by 20%. The investment case must therefore distinguish earnings durability from the price paid for that durability.
RECOMMENDATION, CATALYSTS, AND RISK PARAMETERS
The earnings-event recommendation is HOLD, with additions contingent on valuation and evidence of stronger backlog conversion. The call does not justify a demand-collapse thesis, but it also does not justify paying an expanding multiple solely for the record backlog. The most attractive version of the long thesis is sustained earnings growth from capacity utilization, pricing discipline, and aftermarket development, purchased without assuming uninterrupted bookings acceleration or repeated tariff benefits.
The immediate operating catalysts are Q4 delivery performance, the expected mining commissioning catch-up, construction retail strength through the $1.6 billion dealer inventory drawdown, and initial 10-megawatt engine shipments. The formal 2027 outlook is the next major valuation catalyst. Although management referred conversationally to discussing 2027 in January, the published earnings calendar lists the Q4 results call for February 2, 2027.
Thesis-break conditions include repeated failure of delayed mining deliveries to convert, material customer deferrals accompanied by weakening retail demand, deteriorating rental utilization after fleet expansion, or persistent margin pressure despite higher shipments. A further warning would be declining free cash flow before customer-advance contributions alongside continued aggressive capital returns. Conversely, faster shipments, stable pricing, improving Resource Industries incrementals, and stronger cash conversion without disproportionate advance growth would support an upgrade.
For a new position, the appropriate current allocation is 0% until valuation is verified. If valuation subsequently supports entry, an illustrative initial allocation of 1%-1.5% of NAV is more appropriate than a concentrated position ahead of formal 2027 guidance. A 12% entry-price stop would imply a planned portfolio loss of approximately 12-18 basis points, before gap risk, with earlier exit if the operating thesis breaks. No specific dollar entry or target price is supported without a verified contemporaneous price and a fully reconciled forward earnings model.
Portfolio treatment should recognize that Caterpillar is not an independent hedge against AI infrastructure exposure. Power generation, gas compression, data-center construction, and parts of mining demand can share the same capital-spending drivers. The position may diversify business models relative to semiconductors or hyperscalers while still increasing exposure to the same investment cycle. Portfolio-specific correlations and concentration cannot be quantified without the actual holdings.
The decisive conclusion is that Caterpillar’s operating franchise strengthened in Q3, but the earnings surprise and cash-conversion quality were less exceptional than the headline growth suggested. The path to additional upside is execution-driven: more shipped capacity, better mining conversion, disciplined pricing, and sustainable cash generation. The principal risk is paying today for long-dated demand that converts more slowly, at lower margins, or with less favorable funding than expected.
COMPANY EMPLOYEES ON THE CALL
• Joseph “Joe” Creed, Chairman and Chief Executive Officer. • Kyle Epley, Chief Financial Officer. • Alex Kapper, Vice President of Investor Relations. • Stephanie A. Baughman, Senior Vice President, Global Finance Services Division. • Ryan Coleman, Senior Director of Investor Relations.
RESEARCH ANALYSTS ON THE CALL
• Robert Wertheimer, Melius Research. • Tami Zakaria, JPMorgan. • Jamie Cook, Truist Securities. • David Raso, Evercore ISI. • Michael Feniger, Bank of America. • Charles Albert “Chad” Dillard, Bernstein. • Jerry Revich, Wells Fargo Securities. • Mircea “Mig” Dobre, Baird. • Kyle Menges, Citi. • Kristen Owen, Oppenheimer. • Stephen Volkmann, Jefferies.
Key Read-Throughs
KEY READ-THROUGHS FROM CATERPILLAR’S Q3 2026 EARNINGS CALL
Caterpillar’s results indicate that the physical infrastructure investment cycle remains strong, but equipment availability, project execution, and financing increasingly determine which companies capture the returns. Power-generation sales to users increased 75%, North American construction sales to users increased 27%, and backlog reached $78.1 billion. The most actionable positive implications extend beyond generator manufacturers to qualified component suppliers, existing compression fleets, electrical infrastructure providers, and mining aftermarket distributors. The principal negative implications concern capital-intensive power developers funding equipment ahead of customer cash flows and rental incumbents facing a more capable dealer-owned competitor. Importantly, strong equipment orders do not establish faster data-center commissioning, and slower backlog growth does not independently establish weaker demand. The assessments below distinguish operating exposure from expected share-price performance; country identifiers denote corporate domicile.
NATURAL GAS INFRASTRUCTURE
COMPRESSION FLEET SCARCITY SUPPORTS COMMERCIAL RETURNS, BUT CONSTRAINS VOLUME GROWTH (READ-THROUGH 1)
Affected company: Archrock (AROC: United States). Direction and magnitude: moderately to strongly positive for medium-term contract economics and existing-fleet value; moderately negative for the speed and capital intensity of fleet expansion.
Call evidence: Caterpillar expects reciprocating-engine growth to be supported by gas-compression applications and is repurposing part of its Winston-Salem facility to assemble and test 3600-series engines for oil-and-gas customers. Management stated that “we’re going to move a lot of natural gas in the next few years.” Large-engine capacity remains constrained while power generation and compression compete for manufacturing resources.
The transmission mechanism is unusually direct. Archrock purchases compression equipment incorporating Caterpillar engines and earns recurring revenue from contracted operating horsepower. More gas production and transportation require compression capacity, while long engine lead times restrict the industry’s ability to supply additional equipment quickly. Existing available horsepower therefore becomes more valuable, supporting utilization, recontracting economics, and customer willingness to commit earlier. This is principally an infrastructure-volume and equipment-availability exposure, not a mechanical bet on higher natural-gas prices.
Archrock’s own Q2 commentary already identified Caterpillar engine lead times of approximately 195 weeks and ordering for 2029 delivery. It also reported 94.4% utilization and contract-operations adjusted gross margins above 70%. Caterpillar’s call corroborates the persistence of that constraint rather than introducing a previously unknown shortage. The incremental positive is that Caterpillar is allocating additional manufacturing resources specifically to compression, validating demand beyond the more visible data-center generator market.
The negative is equally important: scarce engines protect existing-fleet economics but can delay incremental contracted horsepower and require capital commitments well before deployment. Archrock’s disclosed $1.4 billion-$1.6 billion cumulative growth-capital framework for 2027-2030 illustrates that funding burden. The near-term trading catalyst is its scheduled November 3 results update, particularly utilization, revenue per horsepower, equipment delivery commitments, and capital-spending timing. The longer-duration benefit lies in commercially attractive compression deployment through 2027-2030, not an assumption that Caterpillar’s factory expansion immediately increases Archrock’s revenue.
POWER GENERATION AND QUALIFIED COMPONENTS
QUALIFIED ENGINE-CONTROL SUPPLIERS OFFER A DIRECT, LESS OBVIOUS PARTICIPATION ROUTE (READ-THROUGH 2)
Affected company: Woodward (WWD: United States). Direction and magnitude: strongly positive for the relevant Industrial power-generation product lines; moderately positive at the consolidated level because Aerospace remains the larger business.
Call evidence: Caterpillar is increasing large reciprocating-engine capacity to nearly 3x 2024 levels by 2030, reported 75% growth in power-generation sales to users, and described capacity as the principal limitation on further growth. Management also highlighted continued strength in gas compression and the aftermarket.
Woodward is an established supplier rather than a speculative beneficiary selected solely because it manufactures industrial components. Its fiscal 2025 annual report identified Caterpillar as a customer representing at least 10% of Industrial segment sales, although no customer represented 10% of consolidated sales. Higher Caterpillar engine production can therefore translate into additional purchases of qualified fuel and engine-control components. Woodward’s exposure to other major power-equipment manufacturers provides additional participation without requiring Caterpillar to win every project.
The economic attraction is qualification and integration within the engine platform. Customers cannot necessarily substitute fuel-control and actuation components without engineering work, testing, and validation. Increased output on established platforms can consequently generate recurring OEM demand, while a larger operating installed base supports future service requirements. No new supplier award, increase in content per engine, or specific position on Solar Turbines packages is established by this call.
Woodward had already reported 19% growth in power-generation sales in its June quarter, driven by data-center base and backup power. Caterpillar’s September-quarter strength provides a subsequent demand confirmation ahead of Woodward’s November 18 fiscal-year results and 2027 outlook. The actionable questions are whether customer production schedules translate into higher component shipments and whether Woodward’s capacity additions preserve delivery performance and incremental margins. The longer-duration benefit is a larger installed base and sustained OEM output, while the principal risk is that Caterpillar’s production bottlenecks defer component demand or prompt inventory adjustments rather than producing a smooth shipment ramp.
GENERATOR AND TURBINE DEMAND REMAINS CAPACITY-LIMITED, NOT DEMAND-LIMITED (READ-THROUGH 3)
Affected companies: Cummins (CMI: United States) and GE Vernova (GEV: United States). Direction and magnitude: strongly positive for Cummins Power Systems and GE Vernova Power; moderately positive for Cummins overall and moderately to strongly positive for GE Vernova’s broader earnings durability.
Call evidence: Caterpillar reported 75% power-generation retail growth and stated that “bringing additional capacity online is still the top pacing factor for growth in Power and Energy.” Significant gas prime-power orders generally extend toward 2029, while turbine orders extend into 2030. Management reported continued strength in diesel standby demand as well as prime power.
For Cummins, this validates both established standby-generator demand and the commercial rationale for expanding gas prime-power offerings. Cummins’ own Q2 call described large generator sets as effectively operating at capacity, with some customers adopting smaller sets where larger units were unavailable. It also discussed investment in a 130-liter natural-gas generator platform. Caterpillar’s commentary supports continued demand for that investment rather than suggesting an imminent industrywide order correction.
For GE Vernova, the read-through is sustained demand for dispatchable gas generation and continued value in available manufacturing positions. The technologies are not perfectly interchangeable: Caterpillar’s reciprocating engines and Solar industrial turbines serve different configurations and project scales from much of GE Vernova’s heavy-duty turbine portfolio. The conclusion is therefore shared end-market strength, not automatic transfer of Caterpillar orders to GE Vernova.
The important non-consensus distinction is between slower bookings growth and deteriorating demand. Longer delivery horizons, framework agreements, rising shipments, and uneven project awards can reduce book-to-bill without reducing equipment demand. Caterpillar’s near-term backlog dollars increased despite a slight decline in the percentage expected to convert within 12 months. That argues against interpreting decelerating backlog additions across power-equipment manufacturers as sufficient evidence of an AI infrastructure downturn.
Cummins’ November 5 earnings call is the nearer-term catalyst, especially Power Systems margins, production capacity, and 2027 delivery coverage. GE Vernova already reported on October 28, including higher guidance and 122 gigawatts of equipment backlog plus slot reservations. Caterpillar therefore corroborates GE Vernova’s existing disclosure rather than predicting an unreported earnings beat. The longer-duration implication is improved revenue visibility and installed-base service potential, tempered by the fact that scarcity does not eliminate manufacturing-cost inflation or execution risk.
POWER-AS-A-SERVICE DEVELOPERS
EQUIPMENT ACCESS IS STRATEGICALLY VALUABLE, BUT MANUFACTURER BACKLOG IS NOT DEVELOPER CASH FLOW (READ-THROUGH 4)
Affected company: ProPetro Holding (PUMP: United States), through PROPWR. Direction and magnitude: strongly positive for the strategic value of secured equipment access, but materially negative for near-term free-cash-flow conversion and the capital required to realize that opportunity. This is not evidence of an immediate liquidity crisis.
Call evidence: Caterpillar is accepting long-dated prime-power orders, continues to negotiate large framework agreements, and expects initial shipments of its restarted 10-megawatt engine platform in Q4. Management emphasized that “there’s no slack in the system.” These disclosures increase the value of an established equipment position, but they also highlight the long interval between procurement commitments and operating project cash flows.
The relationship is verified. Caterpillar and PROPWR announced a framework under which PROPWR agreed to purchase at least 1.5 gigawatts of incremental generation assets, with an option to increase that amount to approximately 2.1 gigawatts. Including previously ordered equipment, the potential capacity reaches approximately 2.6 gigawatts through 2031. That is a procurement framework and capacity opportunity, not a matching contracted customer-revenue balance.
ProPetro’s October 28 results disclosed approximately 510 megawatts committed under customer contracts, approximately $8 million of quarterly PROPWR adjusted EBITDA, and $400 million-$430 million of expected 2026 PROPWR capital expenditure incurred. The company also expects higher PROPWR investment in 2027, including down payments and milestone payments under the Caterpillar framework. The 510-megawatt commercial commitment and 2.6-gigawatt equipment opportunity have different horizons and commitment levels; their ratio is not a current utilization rate.
The precise negative transmission is that equipment purchases, deposits, installation, and balance-of-plant spending precede full operating cash generation. ProPetro reported $46 million of Q3 operating cash flow against $123 million of capital expenditure paid. However, financing materially changes the immediate cash requirement: incurred expenditure exceeded cash paid, Caterpillar Financial borrowings were $172 million, and a $690 million convertible-note issuance helped lift total liquidity to $934 million. Treating all incurred capital expenditure as an immediate equity-funded cash outflow would overstate the near-term burden.
The near-term catalysts are binding customer awards, financing terms, and the detailed 2027 capital plan, not merely further announcements of secured megawatts. The longer-duration opportunity is substantial if equipment access converts into well-underwritten, high-utilization power contracts. The critical negative valuation implication is that Caterpillar’s backlog growth cannot be capitalized directly into PROPWR’s earnings or distributable cash.
DATA-CENTER ELECTRICAL AND THERMAL INFRASTRUCTURE
BEHIND-THE-METER GENERATION PRESERVES THE NEED FOR POWER DISTRIBUTION, CONTROL, AND COOLING (READ-THROUGH 5)
Affected companies: Vertiv Holdings (VRT: United States) and Schneider Electric (SU: France). Direction and magnitude: positive with high strategic relevance for Vertiv and moderate incremental fundamental significance for both companies. The call confirms an opportunity; it does not establish new awarded revenue.
Call evidence: Caterpillar stated that prime-power demand continues to trend higher as customers seek turbine and reciprocating-engine solutions. Standby demand also remains strong. The relevant distinction is that customers are changing how electricity reaches the site, not eliminating the need to distribute, condition, manage, and cool the power consumed inside the data center.
Vertiv has a verified relationship with Caterpillar and Solar Turbines. Their announced collaboration combines generation with Vertiv power distribution, cooling, and services in pre-designed architectures. Caterpillar’s prime-power momentum therefore validates a specific commercial strategy rather than a generic association with AI spending. Schneider benefits through overlapping electrical-distribution, protection, UPS, control, and cooling demand, although this call establishes no Caterpillar supplier award for Schneider.
The transmission mechanism is system complexity and reliability. On-site engines still require electrical protection, switching, synchronization, load management, and integration with data-center power architecture. Cooling requirements remain linked to compute load regardless of whether electricity originates from a utility or on-site generation. Combined cooling, heat, and power can change the thermal configuration, but it does not make integration and thermal management unnecessary.
There is an important timing caveat. Additional electrical and cooling content does not guarantee immediate recognition if generator delivery, permits, or site readiness remain on the project’s critical path. Caterpillar’s long lead times can support a durable project pipeline while delaying portions of installation and commissioning. The positive exposure is to the completed infrastructure architecture, not an assumption that every generation order immediately becomes a new Vertiv or Schneider shipment.
Both companies had already reported Q3 before Caterpillar’s call. Vertiv’s October 28 release showed 55% organic sales growth and more than 100% organic orders growth; Schneider’s October update also described exceptionally strong data-center demand. Caterpillar is corroborating those trends, not creating a fresh Q3 earnings prediction. The next catalysts are named integrated deployments, conversion of orders into shipments, and 2027 capacity execution. Cross-portfolio, these positions remain correlated with generator manufacturers and power developers through the same data-center capital-spending cycle.
EQUIPMENT RENTAL AND CONSTRUCTION
THE DEALER-OWNED NATIONAL RENTAL PLATFORM IS A REAL COMPETITIVE HEADWIND (READ-THROUGH 6)
Affected companies: United Rentals (URI: United States) and Herc Holdings (HRI: United States). Direction and magnitude: moderately negative for competitive conditions in overlapping large construction equipment; initially limited and unquantified at the consolidated earnings level.
Call evidence: Caterpillar described strong interest in the dealer-owned Major Projects joint venture, exceptionally strong rental fleet loading, and the ability to serve projects beyond the capacity of individual dealer fleets. Management stated that “as soon as we can get fleet on the ground, they’re moving to projects.”
The competitive change is aggregation of dealer capabilities. Historically, national rental companies benefited from the ability to coordinate fleet, service, logistics, and commercial relationships across large projects. A national dealer-owned platform can reduce the scale disadvantage of individual Caterpillar dealers and allow them to compete for projects previously outside their practical reach. This increases credible bidding capacity precisely where rental incumbents are emphasizing growth: infrastructure, energy, manufacturing, and data-center construction.
The negative transmission is potential pressure on future award share, equipment rates, and the capital required to defend customer relationships. Even without losing existing customers, incumbents may face more competition for incremental project phases. The current deployment commentary makes this more consequential than an announcement of theoretical future fleet capacity.
The exposure should not be overstated. The initiative is dealer-owned, not a wholly owned Caterpillar rental business. Its stated focus is larger construction equipment, not every specialty category served by United Rentals or Herc. United Rentals’ substantial specialty offering and both companies’ integrated service capabilities remain important defenses. The call establishes a stronger competitor, not observed incumbent share loss or a quantified earnings reduction.
The near-term trading issue is competitive interpretation, particularly changes in project-win commentary and rental pricing. The longer-duration fundamental issue emerges over 2027-2029 as the dealer platform builds operating history and competes for repeat awards. A broad short thesis on national rental companies is not supported, but underwriting uninterrupted share gains or an unchanged competitive environment is less defensible.
STRONG RENTAL UTILIZATION IS MORE IMPORTANT THAN CATERPILLAR’S Q4 WHOLESALE DESTOCK (READ-THROUGH 7)
Affected companies: United Rentals (URI: United States) and Herc Holdings (HRI: United States). Direction and magnitude: moderately positive for near-term utilization and rental demand, offsetting part of the competitive headwind above. This is corroboration of an existing upswing, not evidence of a new economy-wide construction acceleration.
Call evidence: North American construction sales to users increased 27%, dealer rental revenue continued to grow, and management described strong retail growth even excluding the rental fleet-loading contribution. Caterpillar nevertheless expects approximately flat Q4 Construction Industries revenue because dealer inventory is expected to decline $1.6 billion, versus a $600 million decline in Q4 2025.
The transmission mechanism is the distinction between equipment ownership flows and rental activity. Caterpillar recognizes equipment sales into its distribution system, while rental companies earn revenue from utilization, rental rates, ancillary services, and project duration. Dealers can reduce unsold inventory while end-user construction activity and rental demand remain healthy. A weak Caterpillar wholesale comparison therefore should not automatically be treated as a negative indicator for rental-company revenues.
The peer evidence is already supportive. United Rentals reported 17.8% rental-revenue growth and 6.5% fleet-productivity improvement on October 21. Herc reported approximately 12% rental-revenue growth on October 27, with average fleet growth below 2% and improved dollar utilization. These results show that the demand signal is not confined to Caterpillar dealers purchasing additional machines.
The limit is breadth. Major projects can drive strong rental results while smaller local markets remain less dynamic. Caterpillar’s retail figure also includes rental fleet investment, so it cannot be transferred directly into a forecast for rental rates or construction spending. The highest-conviction conclusion is resilient activity in major-project categories, not a blanket bullish signal for every construction end market.
The near-term catalyst is Q4 utilization and pricing, particularly whether strong project activity persists through seasonal changes and Caterpillar’s inventory drawdown. The longer-duration issue is balancing demand growth against rising fleet supply from both national rental firms and the dealer-owned platform. Favorable demand and increased competition can coexist; the likely beneficiaries are operators that improve utilization and customer service without overexpanding fleet.
MINING EQUIPMENT DISTRIBUTION AND AFTERMARKET
COPPER, OIL SANDS, AND REBUILDS FAVOR THE DISTRIBUTOR WITH THE MATCHING GEOGRAPHIC FOOTPRINT (READ-THROUGH 8)
Affected company: Finning International (FTT: Canada). Direction and magnitude: moderately to strongly positive for medium-term equipment and product-support demand, with significant group-level relevance; mixed near-term implications because shipment and commissioning delays can defer recognition and absorb working capital.
Call evidence: Caterpillar reported 3 consecutive strong Resource Industries order quarters, cited copper, gold, and Canadian oil sands as demand drivers, and stated that “Customer product utilization is high and the age of the fleet remains elevated.” Rebuild activity is expected to increase moderately. Conversely, mining sales to users were below expectations because of shipment and commissioning delays, with catch-up expected in Q4.
Finning has a direct and geographically well-matched exposure through its Caterpillar dealership operations in Western Canada and Chile. Canadian oil-sands activity supports equipment utilization, rebuilds, parts, and field service. Chilean copper investment supports mining equipment and the installed base that generates subsequent product-support revenue. This is a stronger transmission mechanism than applying Caterpillar’s global mining commentary indiscriminately to every machinery manufacturer or commodity producer.
The aftermarket component is particularly important. Finning’s Q2 product-support revenue was C$1.629 billion, approximately 52% of total revenue, and increased 11%. An aging, heavily utilized fleet requires maintenance and rebuilding even when new-machine deliveries are delayed. That provides an additional earnings channel while the new-equipment production system is constrained. Nevertheless, maintenance timing can be uneven, and utilization does not guarantee that every customer immediately undertakes major rebuild work.
The negative is that Caterpillar’s production and commissioning constraints can also become dealer revenue and working-capital constraints. Strong OEM orders do not guarantee the timing of Finning’s deliveries or collections. Finning’s own Q2 results already showed the distinction between growth and margin: revenue increased 20%, but the higher new-equipment mix contributed to a lower gross margin. Caterpillar’s manufacturing margins should not be transferred to the dealer’s economics.
Finning’s November 10 earnings release is the near-term catalyst, particularly mining order intake, product-support growth, equipment delivery timing, and working-capital conversion. Caterpillar’s expected Q4 commissioning catch-up is more relevant to subsequent conversion than to a guaranteed Finning Q3 beat. The longer-duration positive is a larger, more intensively utilized Caterpillar installed base across copper and oil-sands markets, with recurring service demand extending beyond the initial equipment sale.
Report record
- Sector
- Industrials
- Industry
- Machinery
- Fiscal period end
- September 30, 2026
- Report date
- October 29, 2026
- Analysis
- 6440 words
- Read-throughs
- 3038 words
- Content fingerprint (PDF)
49e9bda5094d- Content fingerprint (analysis)
aef0701d5f55- Content fingerprint (read-throughs)
bd66d441e944
Prepared from the company's earnings release and earnings call transcript. Figures as reported by the company. For information only. Not investment advice.
More from Caterpillar Inc.
No other reports yet.
More in Industrials
Constructive on the medium-term outlook, measured on the immediate earnings upgrade
A Larger and More Profitable Equipment Franchise, Not Yet a Cash-Generative Platform
Follow @AtlasPeakRes on X for new earnings reports as they publish.