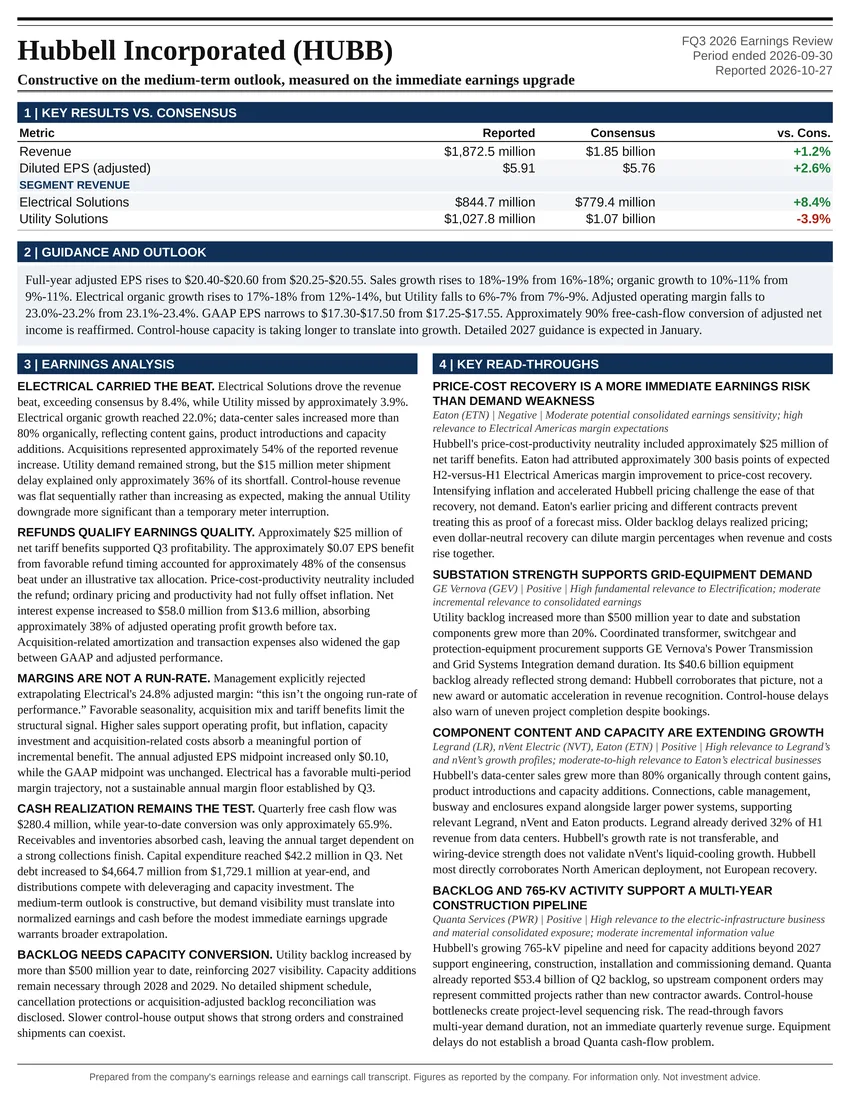
Constructive on the medium-term outlook, measured on the immediate earnings upgrade
Earnings Reports
GE Vernova Inc. FQ3 2026 Earnings Report
GE Vernova Inc. (GEV) FQ3 2026 earnings: Positive for forward earnings revisions, but more qualified for valuation. Full earnings analysis, key read-throughs, and the one-page exhibit from Atlas Peak Research.
GE Vernova Inc. (GEV)
Sector: Industrials · FQ3 2026 · Period end September 30, 2026 · Reported October 28, 2026
GE Vernova’s 3Q 2026 results marked a material improvement in the earnings conversion of its electricity infrastructure backlog.
Download the one-page report (PDF)
View one-page exhibit
Download analysis (.md)
Download read-throughs (.md)
Post to X
One-Page Exhibit
Earnings Analysis
EXECUTIVE CALL SUMMARY: GE Vernova (10/28/26)
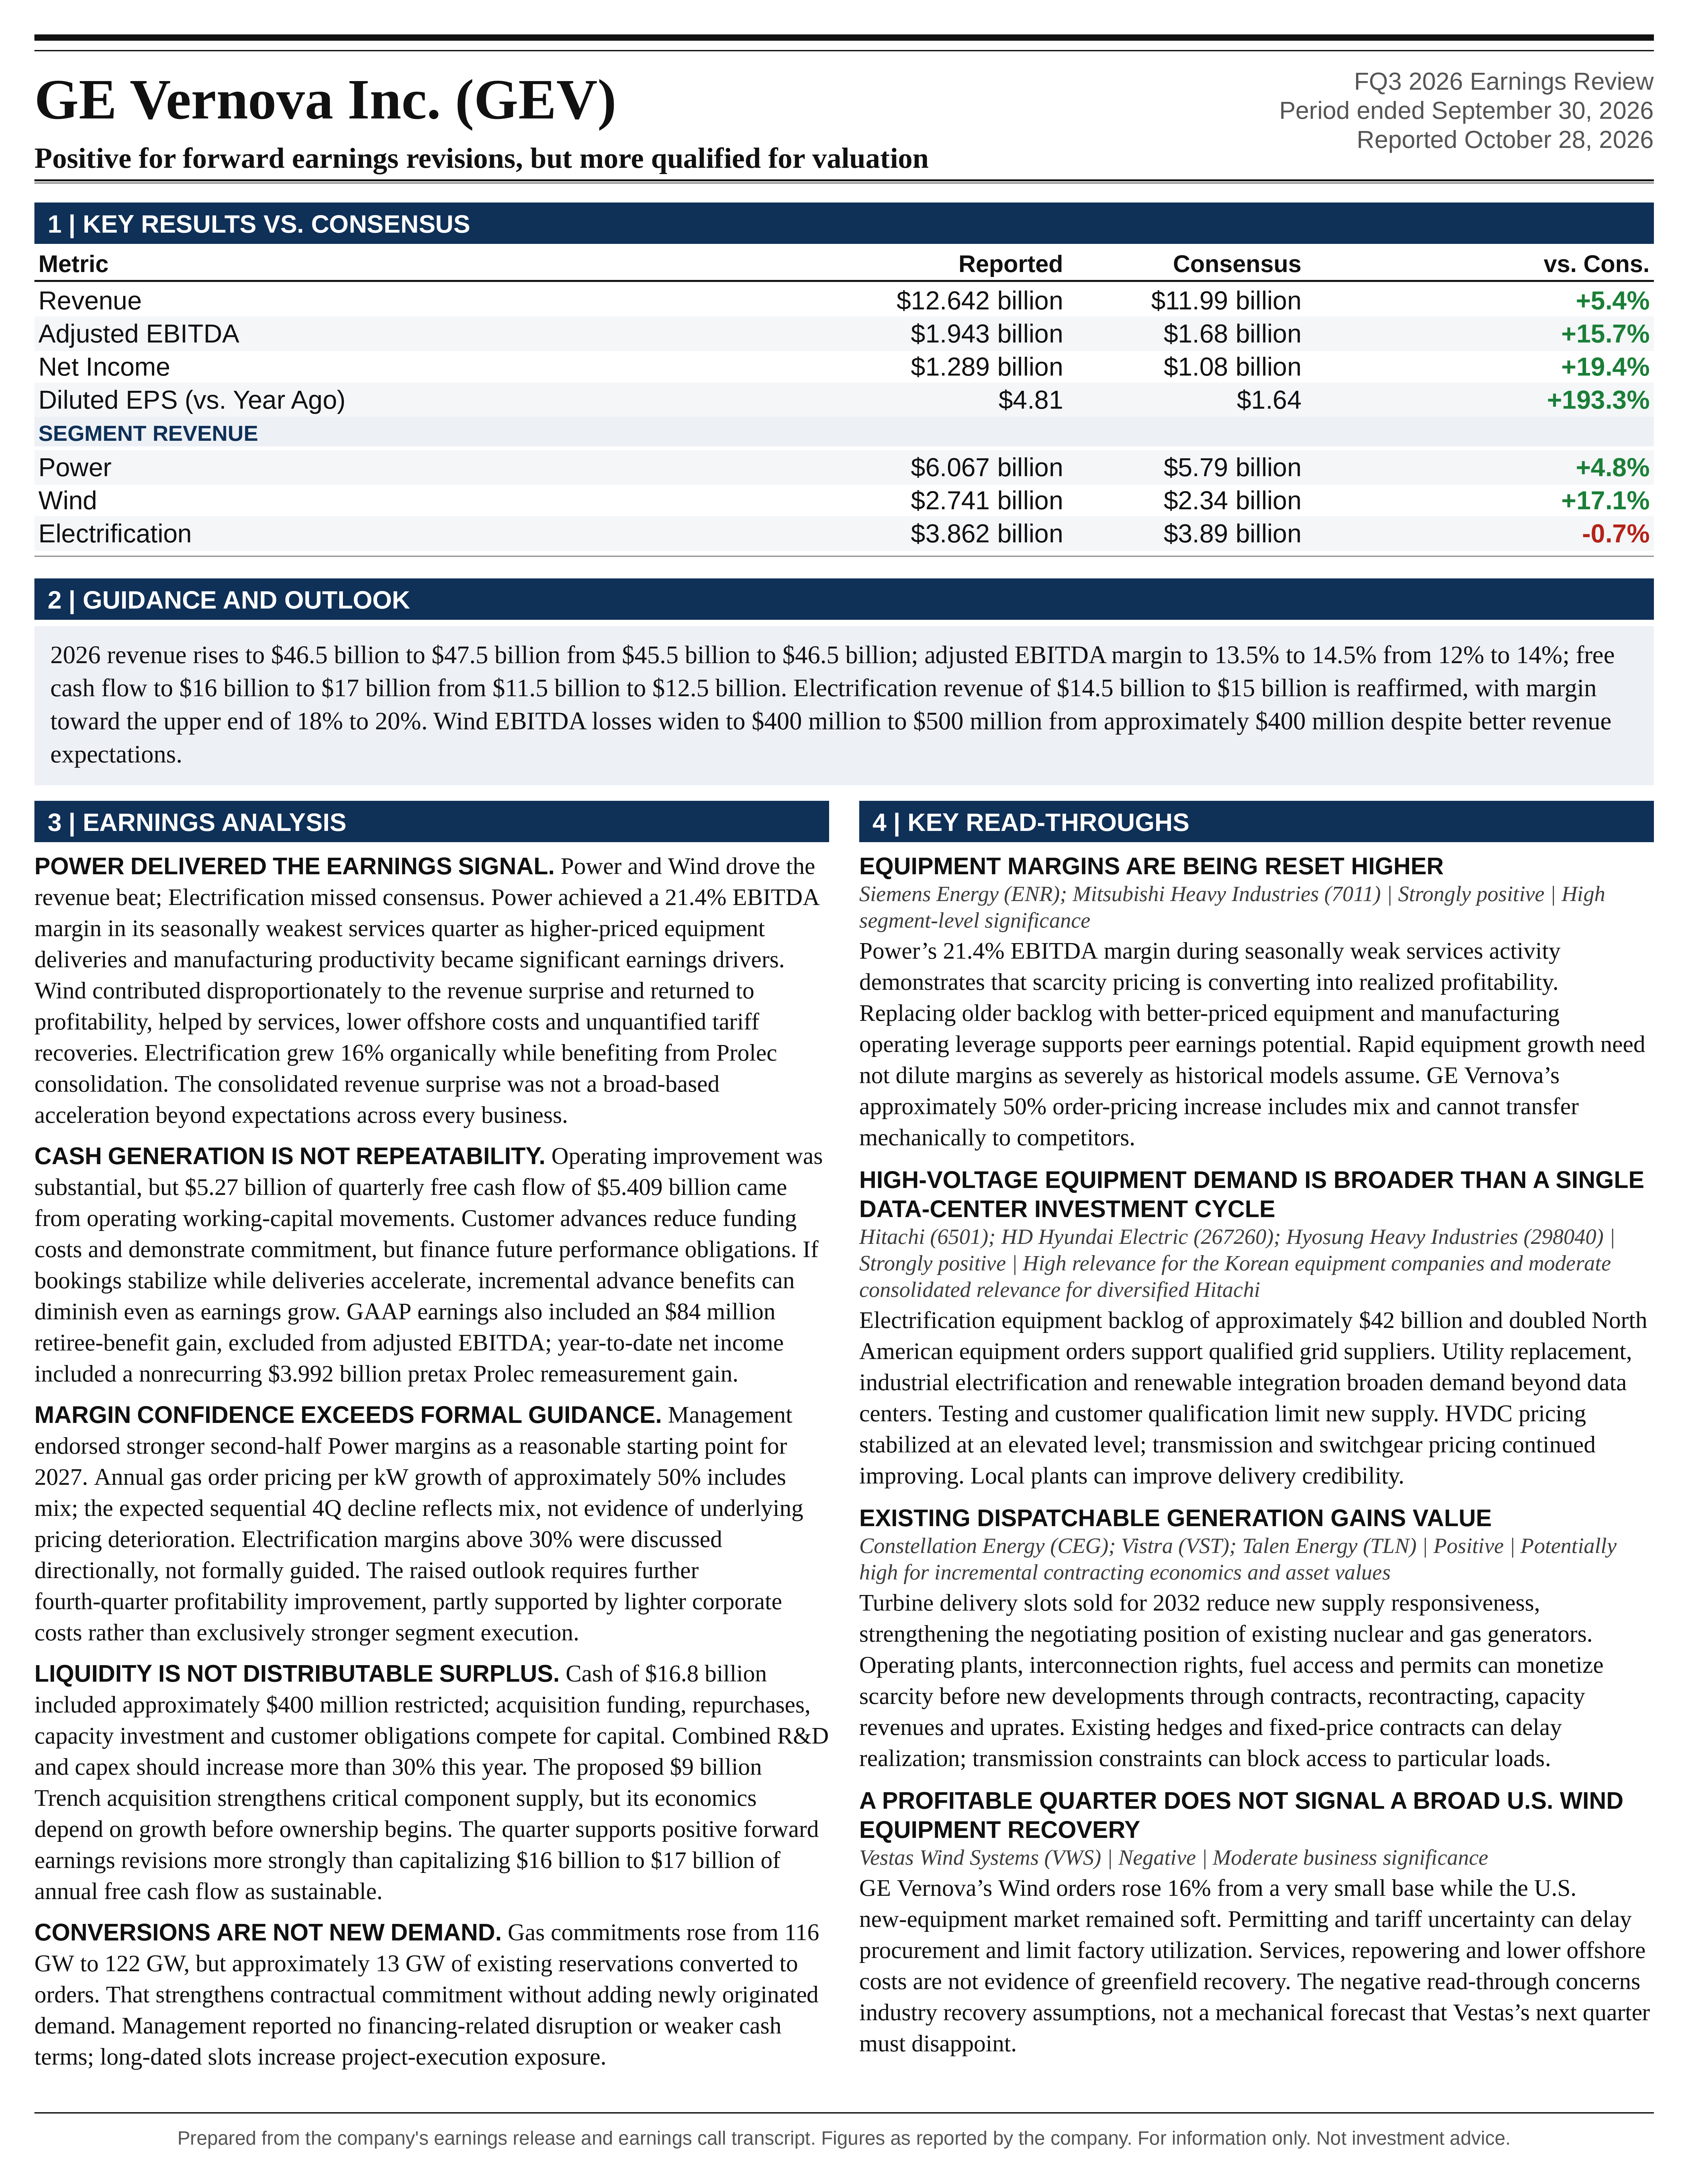
GE Vernova’s 3Q 2026 results marked a material improvement in the earnings conversion of its electricity infrastructure backlog. The central development was Power’s 21.4% EBITDA margin during its seasonally weakest services quarter, demonstrating that higher-priced equipment deliveries and manufacturing productivity are becoming significant earnings drivers. Electrification continued expanding organically while benefiting from Prolec consolidation, and Wind returned to quarterly profitability. The investment conclusion is positive for forward earnings revisions, but more qualified for valuation: the operating improvement is substantial, while the exceptional free cash flow remains heavily dependent on customer advances rather than recurring cash earnings.
Revenue of $12.642 billion exceeded Bloomberg consensus by 5.4%, and adjusted EBITDA of $1.943 billion exceeded consensus by 15.7%. The resulting 15.4% adjusted EBITDA margin was approximately 136 basis points above the margin implied by consensus revenue and EBITDA. Management raised 2026 revenue guidance by $1 billion, increased the adjusted EBITDA margin midpoint by 100 basis points, and raised free cash flow guidance by $4.5 billion. The revenue and margin revisions together imply approximately $6.58 billion of full-year adjusted EBITDA at the midpoints, an increase of approximately $600 million, or 10.0%, from the previous framework.
The more consequential forward signal was management’s willingness to treat the stronger 2H 2026 Power margin profile as a reasonable starting point for 2027. That statement increases confidence that the quarter was not merely a favorable shipment or services mix event. However, the annual gas equipment order pricing increase of approximately 50% includes product mix, the 2027 outlook remains qualitative, and margin expectations above 30% for Electrification were discussed directionally rather than formally guided.
The proposed $9 billion Trench acquisition strengthens Electrification’s component technology, manufacturing footprint, and control over critical suppliers. Its strategic rationale is credible, especially for bushings, instrument transformers, and coils used in transformers, substations, and HVDC systems. Its economics require more scrutiny than the headline 13x 2028 EBITDA multiple suggests. That multiple assumes substantial growth before ownership begins, while projected 2028 standalone free cash flow of approximately $400 million represents only a 4.4% yield on the purchase price before considering acquisition financing and the opportunity cost of cash.
The principal analytical distinction is between earnings quality and cash-flow repeatability. Earnings improved meaningfully through pricing, productivity, and shipment execution. Cash generation was also economically valuable, but $5.27 billion of the quarter’s $5.409 billion free cash flow came from operating working-capital movements. The quarter therefore supports a higher earnings trajectory more strongly than it supports capitalizing $16 billion to $17 billion of annual free cash flow as a sustainable run rate.
OBSERVATION: QUARTERLY PERFORMANCE AND EARNINGS QUALITY
Revenue increased 26.8% from $9.969 billion in 3Q 2025 to $12.642 billion. Organic revenue increased 18%, with most of the difference attributable to acquisitions, principally Prolec. Adjusted EBITDA increased approximately 140% on a reported basis from $811 million to $1.943 billion. Management’s approximately 123% growth commentary referred to the organic comparison. Similarly, reported adjusted EBITDA margin expanded approximately 730 basis points, whereas the organic expansion was 690 basis points. These distinctions matter because the quarter combined genuine underlying improvement with a meaningful change in business composition.
The revenue beat was not uniformly distributed. Power revenue of $6.067 billion exceeded Bloomberg consensus of $5.79 billion by approximately $277 million, or 4.8%. Wind revenue of $2.741 billion exceeded consensus of $2.34 billion by approximately $401 million, or 17.1%. Electrification revenue of $3.862 billion was approximately $28 million, or 0.7%, below consensus. Consequently, the consolidated revenue surprise should not be interpreted as a broad-based acceleration beyond expectations across every business. Power delivered the most important earnings signal, while Wind contributed disproportionately to the revenue surprise.
Net income increased from $453 million to $1.289 billion and exceeded Bloomberg consensus of $1.08 billion by 19.4%. Diluted EPS increased from $1.64 to $4.81. The earnings increase was overwhelmingly operational rather than a function of share repurchases, although the lower share count provided an additional benefit. GAAP earnings nevertheless included non-operating items. Non-operating benefit income was $212 million, versus $115 million a year earlier, and included the $84 million gain associated with transferring retiree benefit obligations. That gain was excluded from adjusted EBITDA.
The distinction between GAAP and adjusted results becomes particularly important across periods. Year-to-date net income of $6.687 billion included a $3.992 billion pretax gain from remeasuring the previously held Prolec equity interest. That gain is not recurring operating earnings. Conversely, acquisition-related amortization creates a substantial difference between adjusted profitability and GAAP income. Quarterly depreciation and amortization increased to $439 million from $212 million, including intangible amortization of $239 million versus $61 million. Adjusted EBITDA is useful for evaluating execution, but it does not capture every economic cost associated with acquiring and maintaining the expanded platform.
Sequential results reinforce the operating improvement. Revenue increased 13.9% from 2Q, while adjusted EBITDA increased 55.4% from $1.250 billion. Adjusted EBITDA margin rose from 11.3% to 15.4%. This occurred while total services revenue declined sequentially from $4.645 billion to $4.302 billion. The improvement therefore cannot be explained by a favorable shift toward the historically higher-margin services mix.
GUIDANCE: A MATERIAL EARNINGS UPGRADE WITH A DEMANDING 4Q
The new 2026 revenue range is $46.5 billion to $47.5 billion, compared with $45.5 billion to $46.5 billion previously. Adjusted EBITDA margin guidance increased from 12% to 14% to 13.5% to 14.5%. The midpoint revenue increase is 2.2%, while the implied midpoint EBITDA increase is 10.0%, indicating that margin improvement is substantially more important than the revenue revision alone.
Pairing the respective revenue and margin endpoints produces an illustrative full-year EBITDA range of approximately $6.28 billion to $6.89 billion, versus approximately $5.46 billion to $6.51 billion under the previous guidance. These are arithmetic implications rather than separately issued EBITDA dollar ranges. At the midpoints, approximately $470 million of the $600 million EBITDA increase comes from the 100-basis-point margin improvement applied to the new revenue base, with approximately $130 million coming from the additional revenue at the former midpoint margin.
The historical guidance progression is important. In January 2026, after incorporating Prolec, management expected revenue of $44 billion to $45 billion, adjusted EBITDA margin of 11% to 13%, and free cash flow of $5.0 billion to $5.5 billion. By July, revenue guidance had increased to $45.5 billion to $46.5 billion, margin guidance stood at 12% to 14%, and free cash flow guidance had reached $11.5 billion to $12.5 billion. The October outlook therefore reflects repeated operating and commercial outperformance, although the much larger cumulative cash-flow revisions primarily reflect customer payment activity.
The new guidance implies a substantial 4Q. Subtracting year-to-date revenue of $33.084 billion produces implied 4Q revenue of approximately $13.42 billion to $14.42 billion. Subtracting year-to-date adjusted EBITDA of $4.089 billion from the paired full-year endpoints produces approximately $2.19 billion to $2.80 billion of 4Q EBITDA. At the midpoints, implied 4Q EBITDA is approximately $2.49 billion on $13.92 billion of revenue, or a 17.9% margin. This represents further improvement from the already strong 15.4% margin in 3Q.
The segment implications are more nuanced than the consolidated increase suggests. Power organic revenue growth guidance increased from 18% to 20% to 19% to 21%, while its EBITDA margin range increased from 17% to 19% to 19% to 21%. Using the restated 2025 revenue base and ignoring currency differences, the midpoints imply a 4Q Power margin of approximately 22.2%. The upper endpoints imply approximately 25.4%. Thus, the analyst’s reference to a mid-20% exit margin described the upper end of the framework, not an explicit management commitment to a mid-20% annual margin in 2027.
Electrification revenue guidance remained $14.5 billion to $15 billion, but EBITDA margin is now expected toward the upper end of 18% to 20%. At midpoint revenue and a full-year margin of 19.5% to 20%, the implied 4Q segment margin is approximately 21.8% to 23.6%. That would represent a meaningful increase from 19.1% in 3Q. Management is consequently relying on continued execution and a favorable shipment profile rather than merely maintaining the latest quarterly result.
Corporate costs also contribute to the implied 4Q improvement. The difference between segment EBITDA and consolidated adjusted EBITDA was approximately $404 million year to date, including approximately $165 million in 3Q. Full-year corporate and other costs of $450 million to $500 million imply approximately $46 million to $96 million in 4Q. Management specifically noted uneven compensation timing and Financial Services activity. Some consolidated margin improvement therefore reflects a lighter corporate burden rather than exclusively stronger segment profitability.
POWER: THE QUARTER’S MOST IMPORTANT FUNDAMENTAL DEVELOPMENT
Power revenue increased 25% to $6.067 billion, and segment EBITDA increased from $651 million to $1.297 billion. Reported margin rose from 13.4% to 21.4%, while organic margin expanded 830 basis points. The reported incremental EBITDA margin was approximately 54%, an unusually strong conversion rate reflecting pricing, operating leverage, and productivity. It should not be extrapolated indefinitely, but it demonstrates that the current backlog repricing is converting into realized profitability.
The services mix makes the result particularly informative. Power equipment revenue increased approximately 65% to $2.870 billion, while services revenue increased only 2% organically to $3.197 billion. Sequentially, services revenue declined approximately $315 million, while equipment revenue increased approximately $905 million. Despite that unfavorable historical mix effect, segment margin increased from 18.8% in 2Q to 21.4%. Higher equipment profitability, rather than a temporary increase in services contribution, was central to the result.
Management linked this improvement to reaching approximately 5 GW of quarterly shipments and beginning to deliver better-priced equipment. The presentation showed 5.3 GW of gas turbine sales and 32 units, compared with 4.0 GW and 20 units a year earlier. Deliveries included 19 heavy-duty turbines and 13 aeroderivatives. Unit shipments increased 60%, but GW shipments increased approximately 33%, illustrating why unit counts, electrical capacity, and revenue growth cannot be treated interchangeably.
Scott Strazik characterized the business as being “early in our margin expansion acceleration.” More importantly, in response to the question about 2027, he endorsed the stronger 2H shipment profile as “the right way to start to think about our projection into ’27.” This supports raising the prospective annual earnings base above the 2026 full-year average. It does not establish a precise 2027 margin target, especially because seasonal services activity, product mix, inflation, and capacity-ramp expenses will continue affecting quarterly results.
The pricing disclosures were strong but require careful interpretation. Management stated that 3Q gas equipment orders were priced more than 20% above the 4Q 2025 reference point, and that full-year 2026 order pricing per kW would be approximately 50% above full-year 2025. However, the comparison includes a richer mix of aeroderivatives and 60 Hz equipment. It is not a disclosed 50% like-for-like price increase for a standardized turbine. The 2026 order book should support future margin improvement, but the magnitude cannot be converted directly into a comparable increase in segment margins.
Management expects order pricing per kW to decline sequentially in 4Q because of fewer aeroderivatives and a greater proportion of 50 Hz units. That anticipated decline is not evidence of deteriorating underlying pricing. The relevant distinction is between product mix and like-for-like commercial terms. Strazik described lower prospective aeroderivative bookings as occurring “Not because the demand is softer, but more because we’re now going out so far in the future before we have availability.” Supply availability is constraining incremental bookings in that product category.
The use of aeroderivative availability within broader customer relationships is strategically significant. Management indicated that aeroderivatives are being incorporated into partnerships that also secure heavy-duty turbine and Electrification business. This may improve customer lifetime value and cross-segment economics. However, it also makes standalone product pricing less transparent because value can be allocated across a broader equipment package. The key economic test is total contract profitability and cash terms, not merely the order price per kW of an individual product.
GAS CONTRACTS, BACKLOG QUALITY, AND THE RISK OF DOUBLE COUNTING
The gas equipment backlog and slot reservation agreement balance increased from 116 GW to 122 GW. Management raised its year-end expectation from at least 125 GW to at least 130 GW, compared with 83 GW at the beginning of 2026 and 62 GW at the end of 3Q 2025. The increase remains material despite the ramp in deliveries.
The distinction between new commitments and conversions is essential. During 3Q, GE Vernova signed 11 GW of new agreements, comprising approximately 8 GW of new slot reservations and 3 GW of direct orders. It also converted approximately 13 GW of existing reservations into orders and shipped approximately 5 GW. Consequently, equipment backlog increased from 53 GW to 64 GW, while reservations declined from 63 GW to 58 GW. The reservation decline was therefore a favorable conversion event, not evidence of customer withdrawals.
This bridge also explains why the $21.8 billion of Power orders and the 112 turbine orders should not be interpreted entirely as newly originated demand during the quarter. A meaningful portion represents previously reserved capacity moving into formal orders. The conversion strengthens execution visibility and contractual commitment, but it does not increase total committed GW in the same way as a new customer agreement. Treating both the original reservation and its later conversion as incremental demand would overstate the commercial acceleration.
Formal gas backlog now exceeds the reservation balance, an important improvement in the composition of commitments. The 122 GW total nevertheless remains a combination of different contractual stages. The call did not disclose sufficiently detailed cancellation, refund, or termination provisions to establish that all reservations have the same enforceability or financial consequences as equipment orders.
Strazik reported no financing-related disruption or slowing of conversions and stated that “there’s no change in our cash terms required to secure the equipment.” This is useful evidence that recent demand is supported by customer funding rather than weaker payment requirements. The customer base spans approximately 100 customers across 25 countries. However, the approximately 80% traditional-customer and 20% data-center classification should not be interpreted as only 20% economic exposure to data-center demand. Utilities and independent generators can be ordering equipment in response to hyperscaler load growth.
Management’s 2027 commentary implies continued backlog growth but a more moderate quarterly pace of new agreements than in 1H 2026. The company signed 52 GW year to date, including 11 GW in 3Q, implying approximately 41 GW during 1H. Management suggested that 2027 quarters may resemble 3Q and 4Q more closely than the unusually strong earlier quarters. The bullish interpretation is sustained bookings above deliveries, not indefinite acceleration from the highest quarterly commitment rates.
The commercial duration is extending, with delivery slots sold for 2032. This supports scarcity and demand visibility, but it also increases exposure to changes in project economics, grid interconnection, permitting, fuel infrastructure, and customer capital priorities. Long-dated commitments reduce near-term order risk while increasing the importance of disciplined contract terms and counterparty selection.
SERVICES: ATTRACTIVE LONG-TERM ECONOMICS, BUT NOT AN IMMEDIATE REVENUE STEP-CHANGE
Power services orders increased 12% in the quarter and 18% year to date, while services revenue increased only 2% organically in the quarter and 4% year to date. That divergence is consistent with a growing contracted opportunity that is not yet converting proportionately into near-term revenue. Power services backlog reached $76.4 billion, up 17% year over year. Total company services backlog was $92.7 billion.
The call contained an important operational qualification. Strazik acknowledged that “we may be prioritizing at times the equipment shipments to hold schedule as long as we don’t put customers at risk for services.” This indicates that equipment and services share constrained manufacturing resources. Services growth is being limited partly by fulfillment capacity and outage scheduling, not simply by end-market demand. Sustaining customer reliability while expanding new-equipment output is therefore a critical execution requirement.
Management expects services to remain margin-accretive even as equipment profitability increases. Strazik stated, “We also are pricing up the services book,” and confirmed that “as services grow as a proportion of the total, that drives margin expansion for the power business.” This supports a multistage earnings trajectory: equipment repricing drives the nearer-term improvement, while a larger installed base supports additional high-margin revenue over a longer horizon.
The HA lifetime services disclosure provides a useful economic reference. Management expects each GW of HA capacity to generate approximately $500 million of services revenue over its initial 20 years. A simple average is approximately $25 million per GW annually, but actual revenue depends on utilization, outage timing, contractual terms, escalation, and equipment availability. The figure is revenue, not EBITDA or free cash flow, and it should not be multiplied across the entire gas commitment balance because that balance includes different turbine technologies and contractual stages.
Duration materially affects valuation. An illustrative $25 million annual revenue stream for 20 years has a present value of approximately $213 million to $245 million at discount rates of 10% to 8%, before operating costs, taxes, working capital, and any delay before service activity begins. The $500 million nominal lifetime figure therefore should not be treated as immediate economic value. Likewise, adding future service estimates to existing services backlog without identifying already contracted amounts risks double counting.
The prior long-term target was at least $22 billion of Gas and Steam services revenue by 2035, compared with approximately $12 billion at the December 2025 investor update. That represents approximately 6.2% annual growth over 10 years. The current call suggested that the $22 billion objective could prove conservative, but did not provide a replacement target. Management continues to expect the most substantial contribution from the newly expanding installed base during the 2030s, rather than implying an immediate services revenue inflection in 2027.
The service opportunity also carries estimation risk. The 3Q 10-Q disclosed $293 million of net unfavorable changes in estimated profitability on contractual service agreements during the first 9 months of 2026. That disclosure does not negate the improvement in the services franchise, but it demonstrates that long-duration service contracts are not mechanically fixed-margin annuities. Future maintenance scope, component durability, labor, and utilization assumptions remain economically important.
ELECTRIFICATION: STRONG ORGANIC PROGRESS, WITH ACQUISITION AND MIX QUALIFICATIONS
Electrification revenue increased 51% to $3.862 billion, including approximately $945 million from acquisitions, principally Prolec. Organic revenue increased 16%. Segment EBITDA increased 91% on a reported basis to $739 million, while organic EBITDA increased 57%. Reported margin reached 19.1%, compared with an organic margin of 17.9%. Both measures improved, demonstrating that the quarter was not merely an acquisition-driven increase in reported earnings.
The underlying incremental profitability was strong. Organic EBITDA increased approximately $189 million on approximately $396 million of additional organic revenue, implying an incremental margin of approximately 48%. Higher volume, pricing, and productivity contributed. However, this should not be interpreted as the sustainable margin of the entire business. It reflects the incremental economics of an improving revenue base, including operating leverage and the conversion of better-priced backlog.
Orders of $5.371 billion increased approximately 6% on a reported basis but declined 9% organically because the prior-year period included a $1.6 billion Saudi synchronous condenser order. The organic decline is therefore not, by itself, evidence of a demand inflection. Book-to-bill remained approximately 1.39x, North American equipment orders doubled, and equipment backlog reached $42.2 billion. Approximately $5 billion of that backlog came from Prolec, meaning the 60% reported year-over-year backlog increase should not be treated as entirely organic.
The growth mix was also uneven. Equipment revenue increased 21% organically, while services revenue declined 5% organically. Grid Systems Integration revenue increased substantially, and Power Transmission benefited from transformer and switchgear demand as well as Prolec. Power Conversion and Storage and Grid Automation and Software did not show the same reported revenue acceleration. Electrification’s overall momentum is strong, but individual product groups remain at different points in their commercial and fulfillment cycles.
Prolec appears to be expanding commercial access as well as manufacturing capacity. Management cited approximately $900 million of U.S. transformer orders booked during 2026 that can now be fulfilled from GE Vernova’s global factories. That supports the acquisition rationale of removing restrictions and simplifying customer access. These orders remain future revenue opportunities rather than completed earnings, and their incremental profitability was not quantified.
The margin discussion requires particular discipline. An analyst referred to Prolec’s original high-20% margin framework and asked whether Electrification margins could exceed 30%. The quarter’s presentation disclosed approximately $216 million of Prolec adjusted EBITDA on approximately $945 million of revenue, or roughly 23%. The reported quarterly result therefore should not be replaced with the analyst’s cited historical target when constructing the current earnings base.
Strazik stated that “our expectations are growing with electrification” and that continued expansion would move margins “directionally in the neighborhood of your question.” This was an encouraging statement of ambition, not formal guidance above 30%. A 2030 financial framework is expected at a future Capital Markets Day, whose timing is to be announced during the January earnings call.
TRANCH GROUP: STRATEGIC CONTROL AT A PRICE THAT REQUIRES CONTINUED GROWTH
The proposed Trench acquisition addresses specific component bottlenecks rather than adding an unrelated business. Bushings provide insulation and connections for high-voltage equipment; instrument transformers enable voltage and current measurement and protection; coils support electrical stability and power quality. These products are integral to the performance and delivery of transformers, substations, and HVDC systems.
The company expects Trench’s 2026 revenue to comprise approximately $600 million of bushings, $500 million of instrument transformers, and $300 million of coils. GE Vernova currently has a comparatively modest presence in these categories. Management estimated that bushings represent approximately 5% to 8% of transformer bill of materials, while Trench-type components represent approximately 10% of the bill of materials for the $1.5 billion Barmer HVDC project expected to be ordered in 4Q. These percentages describe component intensity, not guaranteed incremental revenue or profit.
The strongest strategic argument is improved delivery certainty. A component representing a modest percentage of project cost can constrain delivery of a much more valuable system. Bringing critical technology and manufacturing capacity inside the company can improve production scheduling, component qualification, and customer coordination. Customer specifications also matter because some utilities and developers explicitly select the bushing supplier, creating potential commercial benefits for the broader transformer business.
Technical distinctions remain important. Dry-type bushings can reduce reliance on oil within the bushing insulation system; their use does not necessarily make the complete power transformer dry-type. Similarly, higher transmission voltages can reduce resistive losses for a given power transfer, but not all of management’s cited grid losses are recoverable through voltage upgrades. The $130 billion high-voltage market estimate is a component of the approximately $300 billion Electrification addressable market, not an additional market to be added to it.
Trench’s footprint includes 11 manufacturing sites and more than 3,000 employees. The newly opened North Carolina facility adds a strategically relevant U.S. location, but the acquisition announcement states that manufacturing of 765 kV equipment there is expected to begin in late 2027. The capability should therefore be regarded as a developing source of supply rather than fully available current production.
The financial forecast assumes revenue increasing from $1.4 billion in 2026 to $1.6 billion in 2027 and $1.9 billion in 2028, equivalent to approximately 16.5% annual growth over 2026 to 2028. EBITDA margins are expected to increase from approximately 33% to 35% and then 36%. Using the rounded revenue and margin figures implies approximately $462 million of 2026 EBITDA and $684 million in 2028. The $9 billion purchase price consequently represents approximately 19.5x 2026 EBITDA and 13.2x 2028 EBITDA.
The forward multiple is reasonable only if the intervening growth and capacity expansion are delivered. The expected late-2027 closing means that 2028 is the initial full year of ownership, but the buyer is committing today to financial performance that has not yet been achieved. Most planned expansion capex is expected before closing, which is beneficial, although it leaves execution during the pre-closing period as an important underwriting variable.
The approximately $5 billion of combined backlog and framework agreements should not be treated as a single homogeneous order book. The presentation identifies approximately $2.6 billion as remaining performance obligations, with the balance represented by framework agreements. Management described approximately 80 frameworks, some extending into the 2030s, as volume commitments. Their value depends on enforceability, pricing, call-off schedules, and customer behavior. They provide visibility but are not interchangeable with recognized revenue or near-term cash receipts.
Cost synergies of $50 million to $100 million annually by 2030 would equal approximately 7% to 15% of projected 2028 EBITDA. Adding those synergies to 2028 EBITDA without assuming further growth produces an illustrative purchase multiple of approximately 11.5x to 12.3x. However, that calculation combines a 2028 earnings base with synergies targeted for 2030 and should not be presented as the actual 2028 acquisition multiple. Revenue synergies remain unquantified.
Vertical integration also creates accounting and competitive considerations. Sales from Trench to GE Vernova will be eliminated on consolidation, so future internal sourcing cannot be counted simultaneously as incremental Trench revenue and incremental system revenue. In addition, Trench serves a broad external customer base, including customers that may compete with GE Vernova in complete systems. Preserving neutral access, commercial confidentiality, and customer confidence will be important to retaining that revenue.
The proposed funding is approximately $4.5 billion of cash and $4.5 billion of debt, with anticipated annual interest expense of approximately $200 million. The transaction is not subject to a financing condition. Management expects debt to adjusted EBITDA below 1x after closing, but that is a forward-looking statement: September borrowings were approximately $2.8 billion, so adding $4.5 billion would produce approximately $7.3 billion before other changes. The leverage expectation relies on the future earnings base, not simply on comparing the new debt with current EBITDA.
The projected $400 million of 2028 standalone free cash flow equates to a 4.4% purchase-price yield. As an illustrative capital-return test, an 8% unlevered return on $9 billion would require $720 million of annual after-tax operating profit, already above the projected 2028 EBITDA before depreciation and taxes. The acquisition’s value therefore depends on continued growth, strategic supply-chain benefits, and future cash generation rather than immediate earnings accretion alone.
Regulatory approval, employee consultation, integration, and currency remain material conditions. The purchase price is approximately €8 billion, translated at $1.12 per euro, and the dollar funding requirement can change unless hedged. The filing also identifies a termination fee under specified regulatory circumstances without providing its amount in the disclosed summary. Trench’s financial forecasts reflect its own accounting policies and exclude acquisition accounting and integration effects, further limiting direct comparability with consolidated GAAP earnings.
CASH FLOW: EXCEPTIONAL FUNDING ECONOMICS, NOT A NORMALIZED EARNINGS YIELD
Quarterly operating cash flow was $6.057 billion, and capex was $647 million, producing $5.409 billion of free cash flow. The working-capital bridge included $5.816 billion from contract liabilities and deferred income, $573 million from payables, and $13 million from contract assets, offset by $824 million of receivables investment and $308 million of inventory investment. The net working-capital contribution was approximately $5.27 billion.
Subtracting that contribution leaves approximately $139 million of quarterly free cash flow before the net working-capital benefit. That is not a normalized steady-state estimate because the quarter included $1.423 billion of cash taxes, approximately $350 million of voluntary retiree benefit funding, and elevated growth capex. Nevertheless, it demonstrates why the headline $5.4 billion should not be interpreted as cash earnings generated solely by the quarter’s delivered products and services.
The year-to-date picture is even more pronounced. Free cash flow reached $15.307 billion, compared with $1.902 billion a year earlier. Operating working capital contributed approximately $17 billion, including $19.511 billion from contract liabilities and deferred income before offsets. Customer advances are therefore funding not only the growing production base but also broader capital allocation.
These advances are economically attractive. They reduce funding costs, demonstrate customer commitment, and provide capital before equipment delivery. Their value can persist for years when orders and prices continue increasing. However, they finance future performance obligations. If bookings stabilize while deliveries accelerate, the incremental advance benefit can diminish even as revenue and EBITDA continue growing. Slower bookings therefore could pressure free cash flow before materially affecting reported earnings.
Contract liabilities and deferred income totaled approximately $45.7 billion at September 30, compared with $26.0 billion at year-end 2025. These balances are not conventional financial debt and should not automatically be deducted dollar for dollar from enterprise value. The correct valuation treatment is to incorporate the future cash costs and working-capital movements required to fulfill the associated contracts. Counting all advance-funded cash as permanently surplus while also assuming unrestricted future cash conversion would overstate value.
The new $16 billion to $17 billion full-year free cash flow range implies only approximately $693 million to $1.693 billion in 4Q after the first 9 months. This contrasts with the substantial implied increase in 4Q EBITDA. The guidance itself therefore demonstrates that earnings and cash flow need not move together over short periods.
Liquidity remains strong. The $16.8 billion reported cash balance included approximately $400 million of restricted cash, and the company had access to a $3 billion revolving credit facility. However, acquisition funding, repurchases, capacity investments, and customer delivery obligations all compete for capital. The balance sheet provides considerable flexibility, but the distinction between liquidity and economically distributable surplus remains important.
WIND: A BETTER QUARTER, BUT NOT A CONFIRMED RECOVERY CYCLE
Wind generated $72 million of EBITDA and a 2.6% margin, compared with a $61 million loss in 3Q 2025 and a $275 million loss in 2Q 2026. Improved services performance, lower offshore project costs, and recoveries of previously paid tariffs contributed. The return to profitability is meaningful, but the tariff recoveries were not quantified, limiting assessment of the recurring earnings base.
Services revenue increased 40% organically to approximately $620 million. Equipment revenue declined 4% organically, despite higher offshore activity. Total orders increased 16% organically, but the underlying unit data do not establish a broad new-build recovery. New wind turbine orders declined from 156 units to 145 units, while repowering orders increased from 139 units to 481 units. Repowering, rather than a generalized expansion in new wind development, was a major driver.
Wind book-to-bill was approximately 0.78x. Total backlog declined 7% year over year to approximately $20.0 billion, including a 14% reduction in equipment backlog. Some backlog reduction is desirable because management is deliberately completing legacy offshore obligations. Nevertheless, the combination of quarterly order growth and shrinking backlog should not be characterized as an unambiguous demand inflection.
The full-year guidance revision was mixed. Revenue is now expected to decline at a mid-single-digit organic rate rather than a low-double-digit rate. However, expected EBITDA losses widened from approximately $400 million to $400 million to $500 million. Additional turbine deliveries improve revenue, but accelerated maintenance and the Vineyard Wind settlement more than offset the associated profit benefit.
The maintenance timing matters for 2027. Management is bringing scheduled work forward from 2027 into 4Q 2026, creating a near-term cost burden and potentially easing the following year’s schedule. This is not equivalent to permanently eliminating those costs. An improvement in 2027 profitability partly attributable to timing should be distinguished from a sustained change in service contract economics.
The guidance also implies continued quarterly profitability rather than a return to a 4Q loss. Year-to-date Wind EBITDA was negative $585 million. Finishing the year with a $400 million to $500 million loss requires approximately $85 million to $185 million of positive 4Q EBITDA. The correct interpretation is a weaker full-year profit outlook than previously expected despite improving quarterly results.
The Vineyard Wind settlement reduces an identifiable legal and execution uncertainty, but the remaining offshore program extends into 2027. Strazik said, “we’re improving our optionality with this business,” while emphasizing the need to complete offshore execution and observe the U.S. market. That statement does not constitute a divestiture announcement. Strategic alternatives become more credible as legacy liabilities and execution uncertainty decline, but their value remains contingent on the condition of the residual business.
The U.S. market continues to face permitting delays and tariff uncertainty, including the Section 232 process referenced on the call. Management indicated that its previous longer-term assumptions did not require a recovery above the weak 2025 North American volume base. A recovery would therefore represent upside, but it is not necessary to manufacture such a recovery assumption to explain the current operating improvement.
NEW PRODUCTS, NUCLEAR, AND INVESTMENT SPENDING
The company spent approximately $2.4 billion on R&D and capex during the first 9 months and expects combined spending to increase more than 30% for the full year. The quarter’s margin improvement therefore was not achieved by broadly suppressing investment. Power and Electrification are expanding capacity while also funding new products, automation, robotics, and AI applications. Management explicitly characterized these initiatives as a net expense in 3Q rather than a major current source of margin improvement.
The near-term nuclear opportunity remains weighted toward the existing fleet. Nuclear Power revenue increased from $664 million to $719 million, while management highlighted uprates and life extensions across equipment touching approximately 65 GW of U.S. nuclear capacity. These activities offer a more immediate earnings pathway than new reactor deployment.
SMR developments expand the longer-term opportunity but remain at different stages of commercialization. Construction progress in Ontario, the Clinch River construction-permit milestone described on the call, and the 1.2 GW technology selection in Sweden are positive indicators. A technology selection is not equivalent to a fully financed equipment order, and a construction permit is not equivalent to an operating license or completed plant. No sufficiently detailed incremental revenue, margin, or cash-flow schedule was provided to justify material near-term earnings contributions from these announcements.
The initial hyperscaler MVUPS order and solid-state transformer developments provide evidence of progress beyond concept-stage products. However, the 6 MW outdoor solid-state transformer award still requires contracting, and the prototype remains in testing. Qualification, reliability, manufacturability, and customer acceptance remain important conditions. These technologies create potential upside to the product portfolio, but they should not be assigned mature-equipment margins or large-scale revenues before operating evidence develops.
Management’s distinction between grid investment and generation investment was economically sound. Better transmission, substations, and power management can improve utilization and delivery, but they cannot universally substitute for additional generation. GE Vernova’s combined exposure across generation and grid equipment is valuable because the investment requirements are complementary rather than mutually exclusive.
CAPITAL ALLOCATION AND EXECUTION ACCOUNTABILITY
The repurchase authorization increased from $10 billion to $20 billion, leaving approximately $10.1 billion available after cumulative purchases through October 23. The remaining authorization is not a binding commitment or a specified purchase timetable. Management reported cumulative purchases of 15.6 million shares at an average price of approximately $635, but that historical average is not the price at which new capital is being deployed.
The 10-Q disclosed a 3Q average repurchase price of $948.72, approximately 49% above the cumulative average cited on the call. The difference matters when evaluating prospective returns. Strong returns on earlier repurchases do not establish that additional purchases at higher prices have the same expected economics. Repurchases remain attractive only when the valuation is favorable relative to the opportunity cost of investment, acquisition funding, and balance-sheet flexibility.
The completion of transition services arrangements with GE Aerospace represents a tangible operating milestone. Management expects approximately $135 million of associated G&A savings, of which approximately $100 million had been realized. The remaining savings are useful but small relative to the approximately $600 million increase in implied 2026 EBITDA guidance. The principal earnings drivers remain segment pricing, volume, and productivity rather than separation savings.
The announced CFO transition also coincides with a more complex capital-allocation phase. Claire McDonough is scheduled to join in November and assume the CFO role on January 1, 2027, with Ken Parks supporting the transition. Integrating acquisitions, protecting advance-funded liquidity, and maintaining consistent profitability disclosures will be increasingly important as the business becomes larger and more capital intensive.
IMPLICATION: BACKLOG VALUE, LONG-TERM TARGETS, AND EXPECTATIONS
Total backlog reached $196.721 billion, including $104.054 billion of equipment and $92.667 billion of services. The increase was approximately $20.4 billion sequentially and 45% year over year. The company expects backlog to exceed $200 billion in 4Q, bringing forward a milestone originally framed for year-end 2028 at the December 2025 investor update. That acceleration is substantial, although acquisitions contribute to the comparison.
Backlog duration prevents the full balance from being treated as near-term revenue coverage. The 10-Q expects 33% of equipment backlog to convert within 1 year, 60% within 2 years, and 97% within 5 years. For services, the corresponding disclosures are 16% within 1 year, 54% within 5 years, and 78% within 10 years. The initial 12-month conversion percentages imply approximately $49 billion of revenue from existing obligations, but that period runs from September 30 and does not correspond exactly to calendar 2027.
Management expects the increase in equipment margin dollars embedded in backlog during 2026 to be substantially larger than the approximately $8 billion increase achieved in 2025. That is a powerful forward indicator, but it should not be confused with an equivalent increase in annual EBITDA or with a promise that backlog margin rates will expand by more than the 6 percentage points disclosed for 2025. Growth in embedded margin dollars combines higher backlog volume with improved profitability and is recognized over multiple years.
The most recent quantified company-level 2028 framework established in January was $56 billion of revenue and a 20% adjusted EBITDA margin, including Prolec but excluding Trench. That implies approximately $11.2 billion of EBITDA. The current quarter strengthens the case for performance above that framework, but management did not formally replace it. Trench’s forecast also should not simply be added without considering consolidation eliminations, integration costs, financing, and the timing of synergies.
The magnitude of future Electrification margin expansion depends predominantly on the existing business, not merely acquisition mix. As an illustration, adding $1.9 billion of Trench revenue at a 36% margin to a $14.75 billion business earning 20% would produce approximately a 21.8% combined margin before synergies. The calculation deliberately uses different-period revenue scales to isolate the mix effect, not to forecast 2028. It demonstrates that reaching approximately 30% requires substantial improvement in the much larger legacy revenue base.
SCENARIO ANALYSIS: THE 2027 EARNINGS OPPORTUNITY
A 55% probability base case assumes approximately $52 billion of 2027 revenue and $9.5 billion of adjusted EBITDA, implying an approximately 18.3% consolidated margin and roughly 45% EBITDA growth from the new 2026 midpoint. An illustrative segment construction is $26.5 billion of Power revenue at a 24% margin, $17 billion of Electrification revenue at 22%, $8.5 billion of Wind revenue at negative 1%, and approximately $500 million of corporate costs. This assumes continued conversion of better-priced backlog, moderate capacity progress, and no meaningful full-year Trench contribution.
A 25% probability bull case assumes approximately $55 billion of revenue and $11.6 billion of adjusted EBITDA, or an approximately 21.0% margin. The operating assumptions are $28 billion of Power revenue at 27%, $18 billion of Electrification revenue at 24%, $9 billion of Wind revenue at 2%, and approximately $500 million of corporate costs. This requires sustained high-end Power profitability, stronger grid execution, limited disruption from capacity expansion, and continued improvement in Wind services. It would bring the prior company-level 2028 EBITDA framework forward materially.
A 20% probability bear case assumes approximately $48.5 billion of revenue and $7.2 billion of adjusted EBITDA, or an approximately 14.9% margin. The assumptions are $25 billion of Power revenue at 21%, $15.5 billion of Electrification revenue at 19%, $8 billion of Wind revenue at negative 5%, and approximately $550 million of corporate costs. This outcome could arise from shipment delays, less favorable product mix, component inflation, weaker grid conversion, or renewed offshore and service costs. EBITDA could still grow modestly while the equity disappoints if expectations already require the stronger scenarios.
These are illustrative underwriting cases, not management guidance or consensus estimates. They produce probability-weighted 2027 EBITDA of approximately $9.6 billion. Free cash flow cannot be projected with comparable confidence from the disclosed operating assumptions because customer payment schedules and advance collections can dominate the annual result. Assigning a stable conversion ratio to these EBITDA cases would create false precision.
VALUATION AND RECOMMENDATION
The appropriate stance is Hold with a positive earnings-revision bias. The quarter materially strengthens confidence in the operating trajectory, but the evidence does not justify treating the stock as attractive at any valuation or extrapolating the 2026 cash-flow result as recurring distributable earnings.
A valuation reference grounded in disclosed capital allocation illustrates the distinction. Applying the $948.72 average 3Q repurchase price to the September share count produces approximately $251 billion of equity value. Subtracting approximately $13.6 billion of unrestricted cash net of disclosed borrowings produces a simplified enterprise value of approximately $238 billion, before minority interests, pension adjustments, and subsequent capital movements. This is a historical execution-price reference, not a current market quote.
That reference equates to approximately 36x the new 2026 EBITDA midpoint, approximately 25x the illustrative 2027 base case, and approximately 21x the previous $11.2 billion 2028 framework. Such a valuation can be supported by durable growth and improving margins, but it already requires meaningful future execution. The relevant debate is not whether GE Vernova is growing; it is how much earnings expansion and duration are already capitalized.
Multiple sensitivity remains material. On approximately $9.5 billion of forward EBITDA, a 5x change in the valuation multiple represents approximately $48 billion of enterprise value. Consequently, earnings upgrades can coexist with weak share performance if the market reduces the premium assigned to growth duration, cash-flow quality, or competitive scarcity. The supplied Bloomberg notice’s 1.4% premarket gain was an early trading snapshot, not evidence of the final market assessment.
The next decisive catalyst is the January earnings call, including 2027 guidance and updated disclosures on equipment margin in backlog. Additional checkpoints include achieving at least 130 GW of year-end gas commitments, exceeding $200 billion of backlog, converting the expected Barmer order, sustaining improved Power margins as product mix changes, and delivering the substantial 4Q profitability implied by guidance. The subsequent Capital Markets Day should clarify the formal 2030 framework and whether the directional Electrification margin discussion becomes a quantified commitment.
The thesis would weaken if formal order conversion slowed, customer payment terms deteriorated, equipment pricing failed to offset inflation, or higher-priced shipments did not sustain improved margins. Other important invalidation signals would include persistent service fulfillment delays, additional adverse service-contract estimate changes, renewed offshore losses, weaker Trench performance before closing, or capital returns that reduce liquidity faster than recurring cash earnings improve.
The principal upside is a durable increase in the earnings power of an installed-base franchise whose equipment and grid businesses are becoming substantially more profitable before the next major services cycle develops. The principal downside is that exceptional order growth, advance collections, and scarcity pricing are capitalized as permanent at the same time that manufacturing capacity, competitive supply, and customer project risks are increasing. The quarter moves the fundamental evidence clearly in a favorable direction, but valuation and cash-flow normalization remain essential constraints on the investment conclusion.
SOURCE AND METRIC CLARIFICATIONS
The earnings release, presentation, and September 2026 Form 10-Q establish the precise backlog, financial, and reconciliation figures. Total backlog was $196.721 billion, not an exact $200 billion; services backlog was $92.667 billion; and revenue guidance was $46.5 billion to $47.5 billion. Historical segment comparisons reflect the company’s 2026 reporting realignment. Organic growth rates exclude specified acquisition, disposition, and currency effects, and should not be substituted for reported growth without qualification. Consensus comparisons are from the supplied Bloomberg earnings notice. Historical outlook comparisons are supported by the December 2025 investor update and January and July 2026 company disclosures.
COMPANY EMPLOYEES ON THE CALL
• Scott Strazik, Chief Executive Officer. • Kenneth “Ken” Parks, Chief Financial Officer. • Michael Lapides, Vice President of Investor Relations.
RESEARCH ANALYSTS ON THE CALL
• Joe Ritchie, Goldman Sachs. • Nigel Coe, Wolfe Research. • Julian Mitchell, JPMorgan. • Andrew Obin, Bank of America. • Alexander Virgo, Evercore ISI. • Nicole DeBlase, Deutsche Bank. • Amit Mehrotra, UBS. • Andrew Kaplowitz, Citi. • Ameet Thakkar, BMO Capital Markets. • David Arcaro, Morgan Stanley. • Robert Wertheimer, Melius Research.
Key Read-Throughs
KEY READ-THROUGHS FROM GE VERNOVA’S 3Q 2026 EARNINGS CALL
GE Vernova’s results strengthen the investment case for scarce power-generation equipment, critical manufacturing capacity, and existing dispatchable generation more than they support an indiscriminate electricity-infrastructure trade. The critical development was the conversion of higher equipment pricing into a 21.4% Power EBITDA margin despite seasonally weak services activity. Meanwhile, customer advances are transferring substantial financing requirements upstream from utilities and developers to equipment suppliers, and turbine availability is extending into 2032. These conditions favor qualified manufacturers and owners of already-operating generation, while creating cost, funding, and commissioning challenges for infrastructure buyers. Grid investment remains geographically broad, but wind demand is materially weaker than gas and transmission demand. Impact assessments below refer to incremental business effects, not predicted share-price changes. Countries indicate corporate domicile.
GAS TURBINES AND MANUFACTURING SUPPLIERS
EQUIPMENT MARGINS, NOT JUST ORDER VOLUMES, ARE BEING RESET HIGHER (READ-THROUGH 1)
Affected companies: Siemens Energy (ENR: Germany); Mitsubishi Heavy Industries (7011: Japan). Direction and magnitude: strongly positive for gas-power earnings potential; high segment-level significance, with greater consolidated sensitivity at Siemens Energy.
Call evidence: Power achieved a 21.4% EBITDA margin in its seasonally weakest services quarter. Management attributed the improvement partly to the initial approximately 5 GW quarter of better-priced equipment deliveries. Gas equipment order pricing per kW is expected to be approximately 50% higher in 2026 than in 2025. Strazik described the company as “early in our margin expansion acceleration” and endorsed the stronger 2H performance as a starting point for thinking about 2027.
The transmission mechanism is a more profitable replacement of older equipment backlog, combined with manufacturing operating leverage. Siemens Energy and Mitsubishi Heavy compete in the same concentrated heavy-duty turbine market, where customer demand exceeds readily available qualified capacity. GE Vernova’s realized margin performance provides stronger evidence for peer earnings upside than another increase in reservations would: it demonstrates that scarcity pricing can survive manufacturing, installation-related obligations, inflation, and delivery execution sufficiently to improve reported profitability.
The less obvious implication is that rapid equipment growth need not dilute segment margins as severely as historical models assume. Equipment margins are improving while the subsequent installed-base expansion creates additional services opportunities. Peer models that retain historical low equipment profitability while forecasting strong deliveries risk understating operating leverage.
Near-term catalysts are peer results, margin guidance, and disclosure of the profitability embedded in backlog. The larger fundamental effect extends through 2027 to 2032 as repriced orders ship. GE Vernova’s 50% pricing metric includes product mix and must not be transferred mechanically to competitors’ like-for-like prices or margins. Likewise, its projected decline in 4Q pricing per kW reflects fewer aeroderivatives and more 50 Hz equipment, not a disclosed deterioration in underlying commercial terms.
THE BOTTLENECK EXTENDS UPSTREAM INTO ENGINE CORES AND HOT-SECTION COMPONENTS (READ-THROUGH 2)
Affected companies: Howmet Aerospace (HWM: United States); GE Aerospace (GE: United States). Direction and magnitude: positive; potentially material for Howmet’s gas-turbine business and moderate at consolidated level, with a smaller consolidated effect at GE Aerospace.
Call evidence: GE Vernova booked 57 aeroderivative turbine orders in 3Q after a similarly strong 2Q, shipped 32 gas turbines, and reached approximately 5 GW of quarterly output. Management explicitly attributed the expected moderation in aeroderivative bookings to distant availability: “Not because the demand is softer, but more because we’re now going out so far in the future before we have availability.” It also acknowledged competition for manufacturing resources between new equipment and services parts.
Howmet’s qualified turbine airfoils and castings participate in the physical production constraint. Higher OEM output requires additional components, while the growing installed fleet increases eventual replacement-part demand. The combination supports capacity utilization, customer-backed expansion, and the durability of demand beyond an individual OEM’s quarterly bookings. Howmet’s own disclosed 38% gas-turbine revenue growth in 2Q 2026 corroborates that this transmission is already occurring.
GE Aerospace supplies the underlying aeroderivative engine technology and products through established arrangements involving GE Vernova, Baker Hughes, and their industrial aeroderivative platform. The relevant benefit is engine deliveries, parts, and contractual economics, not ownership of GE Vernova’s downstream turbine-package margin. Neither GE Vernova’s turbine bookings nor its pricing increases translate directly into identical incremental orders or pricing at GE Aerospace.
The near-term trading implication is that lower sequential aeroderivative bookings should not automatically be treated as a negative demand signal for suppliers. The longer-duration benefit depends on actual capacity additions, yields, and delivery conversion during 2027 to 2030. Manufacturing qualification and casting capacity remain more important constraints than nominal customer demand.
POWER GENERATION OWNERS AND REGULATED UTILITIES
EXISTING DISPATCHABLE GENERATION GAINS VALUE WHEN NEW CAPACITY IS EXPENSIVE AND DISTANT (READ-THROUGH 3)
Affected companies: Constellation Energy (CEG: United States); Vistra (VST: United States); Talen Energy (TLN: United States). Direction and magnitude: positive; potentially high for incremental contracting economics and asset values, but uneven near-term earnings sensitivity.
Call evidence: Gas equipment commitments reached 122 GW, management expects at least 130 GW by year-end, and customers reserved delivery slots for 2032. Management also rejected the proposition that grid improvements alone could eliminate the need for additional generation, describing Electrification as a complement rather than a substitute.
The transmission mechanism is reduced supply responsiveness. A customer needing reliable power before a new turbine can be delivered must place greater value on existing nuclear and gas generation, uprates, operating-life extensions, or contracts backed by already-connected plants. This strengthens the negotiating position of incumbent generators with available output in constrained locations.
Constellation’s exposure includes both its nuclear fleet and the gas-generation platform acquired with Calpine. Vistra and Talen similarly possess operating assets whose value does not depend on securing a new turbine manufacturing slot. Existing interconnection rights, fuel access, and operating permits become economically important alongside the generating equipment itself.
The actionable distinction is between ownership of operating capacity and announcements of future development. Existing assets can monetize scarcity sooner through incremental power contracts, recontracting, capacity revenues, and justified uprates. Developers purchasing equipment at today’s prices must earn an adequate return on a substantially different capital base.
Near-term catalysts are new power agreements, recontracting disclosures, and regional capacity-market developments. The fundamental effect extends through the period of constrained new supply. Existing hedges and fixed-price contracts can delay realization, and local transmission restrictions can prevent a plant from serving a particular load. The call supports a scarcity premium, not an automatic increase in every generator’s current-year EPS or every regional electricity price.
SUPPLIER CASH GENERATION IS THE OTHER SIDE OF BUYER FUNDING PRESSURE (READ-THROUGH 4)
Affected companies: American Electric Power (AEP: United States); Dominion Energy (D: United States). Direction and magnitude: negative for near-term project cash requirements and financing flexibility; moderate significance, without implying a uniformly negative long-term earnings outlook.
Call evidence: GE Vernova generated approximately $5.4 billion of quarterly free cash flow, including approximately $5.3 billion from working capital, principally customer down payments. Strazik emphasized that “there’s no change in our cash terms required to secure the equipment.” Equipment prices continue increasing, and delivery commitments extend further into the future.
The economic mechanism is straightforward: equipment suppliers receive cash before utilities obtain operating assets or the full associated revenue stream. Utilities developing generation, substations, and transmission must fund reservations, progress payments, construction, and potentially longer carrying periods. AEP’s disclosed procurement of turbine capacity from GE Vernova and Mitsubishi makes this more than a purely thematic exposure. Dominion’s substantial electricity-infrastructure requirements expose it to the same procurement and construction-cost pressures, although no company-specific down-payment allocation was disclosed on this call.
Higher approved investment can ultimately expand regulated rate base. However, cash funding, regulatory recovery, customer cost allocation, and shareholder returns occur on different schedules. The strongest utility outcomes require effective construction-cost recovery, enforceable large-load commitments, customer contributions, and financing plans that avoid excessive dilution. Higher supplier margins alone do not establish higher utility returns.
Near-term catalysts are utility funding updates, rate proceedings, large-load tariffs, and customer-security requirements. Longer-term, transmission-heavy utilities can still benefit substantially from investment growth. The negative read-through concerns the cost and timing of that growth, especially for new procurement. It does not imply retroactive repricing of existing fixed-price equipment contracts, nor should GE Vernova’s mix-influenced 50% order-pricing increase be applied to total plant construction cost.
GRID EQUIPMENT AND ELECTRICAL CONSTRUCTION
HIGH-VOLTAGE EQUIPMENT DEMAND IS BROADER THAN A SINGLE DATA-CENTER INVESTMENT CYCLE (READ-THROUGH 5)
Affected companies: Hitachi (6501: Japan), through Hitachi Energy; HD Hyundai Electric (267260: South Korea); Hyosung Heavy Industries (298040: South Korea). Direction and magnitude: strongly positive for transformer and transmission-equipment businesses; high relevance for the Korean equipment companies and moderate consolidated relevance for diversified Hitachi.
Call evidence: Electrification equipment backlog reached approximately $42 billion, North American equipment orders doubled, and management described continued growth across regions. Data-center orders exceeded $6 billion year to date, but management also identified utility replacement, industrial electrification, renewable integration, and higher-voltage transmission as demand drivers. The expected $1.5 billion Barmer HVDC order provides a specific Indian investment signal.
The transmission mechanism is sustained demand for qualified transformers, switchgear, converter-station equipment, and associated components. Replacement of aging infrastructure creates an additional demand source beyond new data-center construction. Higher-voltage projects also require specialized engineering, manufacturing, testing, and customer qualification, limiting the ability of undifferentiated capacity to enter quickly.
Hitachi Energy has direct exposure to HVDC systems and large power transformers. HD Hyundai Electric and Hyosung possess significant transformer exposure and U.S. manufacturing footprints in Alabama and Tennessee, respectively. Local production and customer qualifications can improve delivery credibility and reduce some trade-related execution risks, although imported components still create exposure.
The more discriminating pricing signal is that management described HVDC pricing as having stabilized at an elevated level while pricing continued improving in transmission, switchgear, and synchronous condensers. The positive read-through is therefore strongest where backlog conversion, product mix, and remaining pricing opportunities overlap, not where investors assume every grid category is experiencing gas-turbine-like price increases.
Near-term catalysts are peer order intake, margins, and capacity utilization. The fundamental benefit extends through the late-decade grid buildout. Barmer supports the Indian market opportunity but is GE Vernova’s expected order, not revenue to be assigned to competitors. Trench’s integration also strengthens GE Vernova competitively; strong industry demand does not remove market-share risk.
PROJECT EXECUTION CAPACITY AND SUPPLY-CHAIN ACCESS BECOME DIFFERENTIATORS FOR CONTRACTORS (READ-THROUGH 6)
Affected companies: Quanta Services (PWR: United States); MYR Group (MYRG: United States). Direction and magnitude: positive; high multiyear revenue relevance, with more moderate and contract-dependent margin implications.
Call evidence: Electrification backlog reached approximately $46 billion. Management highlighted U.S. 765 kV transmission, substation rebuilding, and the importance of component lead times. The Trench acquisition was justified partly by improved production planning and alignment between component availability and customer project schedules.
Every installed transformer or substation requires engineering, site preparation, electrical construction, testing, and commissioning. Quanta and MYR participate directly in those activities. Their benefit is therefore connected to physical equipment conversion, rather than merely to headline data-center construction budgets.
Quanta has an additional strategic advantage through its disclosed agreements with AEP covering 765 kV transmission execution and development of domestic transformer and breaker manufacturing capacity. GE Vernova’s willingness to spend $9 billion to secure critical component capabilities reinforces the commercial importance of such supply-chain coordination. Contractors able to combine labor availability, engineering, procurement, and equipment access can offer greater schedule certainty than labor-only competitors.
The qualification is important: equipment scarcity can increase contractor backlog while simultaneously delaying revenue recognition, reducing crew utilization, or creating claims exposure. OEM pricing power does not automatically transfer to EPC margins, and OEM customer advances do not establish equivalent contractor cash terms.
Near-term catalysts are utility project awards and contractor backlog conversion. The stronger earnings effect should develop through 2027 to 2030 as equipment is delivered and projects move into construction. Customer-procured equipment, contractual escalation, and responsibility for schedule delays determine how much of the infrastructure expansion becomes profitable contractor growth.
DATA CENTERS AND ELECTRICAL ARCHITECTURE
POWER AVAILABILITY IS A CONSTRAINT ON AI CAPITAL PRODUCTIVITY, NOT EVIDENCE OF COLLAPSING AI DEMAND (READ-THROUGH 7)
Affected companies: Microsoft (MSFT: United States); Amazon (AMZN: United States); Alphabet (GOOGL: United States); Meta Platforms (META: United States). Direction and magnitude: negative for incremental campus economics and deployment timing; potentially material at project level but moderate and highly differentiated at consolidated level.
Call evidence: Approximately 20% of GE Vernova’s gas commitment customer mix was associated with data centers. Aeroderivative availability is increasingly distant, turbine slots were sold for 2032, and management stated that grid equipment alone cannot provide a sufficient substitute for additional generation. GE Vernova nevertheless reported no deterioration in customer financing or cash terms.
The transmission mechanism is a longer and more expensive path from capital commitment to usable computing capacity. Equipment reservations, electrical infrastructure, backup systems, and generation arrangements can absorb cash before a campus is energized. Delayed power availability can postpone revenue from an otherwise completed facility or require more expensive interim solutions.
The important cross-portfolio distinction is between AI demand and the return on satisfying that demand. Strong orders for power equipment can coexist with lower capital efficiency for hyperscalers because scarcity rents accrue partly to equipment suppliers and existing generators. Conversely, financially strong hyperscalers can use procurement scale and early commitments to secure capacity ahead of smaller developers.
Near-term catalysts are disclosures of campus energization schedules, power agreements, infrastructure prepayments, and changes in capital spending relative to revenue realization. The longer-term consequence is greater differentiation based on secured electricity rather than announced campus capacity alone. The call does not establish that these companies are the unidentified buyers of particular GE Vernova orders, that all 2027 projects are delayed, or that AI-related credit quality is deteriorating.
GE VERNOVA IS BECOMING A MORE CREDIBLE COMPETITOR INSIDE THE DATA-CENTER POWER SYSTEM (READ-THROUGH 8)
Affected companies: Eaton (ETN: Ireland); Schneider Electric (SU: France). Direction and magnitude: negative for assumptions of uncontested future market share and pricing; limited immediate earnings impact, with potentially moderate competitive significance later in the decade.
Call evidence: GE Vernova signed its initial hyperscaler MVUPS order, has a solid-state transformer prototype in testing, and received notification of a hyperscaler award for a 6 MW outdoor solid-state transformer, with contracting expected in 4Q. It also described using broader customer relationships to secure combinations of generation and Electrification equipment.
The transmission mechanism is entry into a larger portion of the customer’s electrical procurement package. A supplier already providing generation, utility-side transformers, and grid systems can extend its commercial relationship into medium-voltage power conditioning and conversion. That can increase competitive bidding pressure, change system specifications, and influence which suppliers control the interface between incoming power and the data center.
The non-consensus risk is not that demand for electrical equipment disappears. It is that expanding market demand attracts a technically credible, well-funded competitor capable of bundling a broader system. Incumbent revenue growth can remain strong while the market share or margin opportunity embedded in long-term valuations becomes more contested.
Eaton already has solid-state transformer capabilities, and Schneider is developing higher-voltage DC architectures. They should not be characterized as technologically inactive or immediately obsolete. The near-term catalyst is completion of GE Vernova’s contracting and qualification milestones. The longer-duration issue is successful commercialization and repeat orders during 2027 to 2030. No meaningful incumbent earnings reduction can be quantified from an initial order or prototype alone.
WIND EQUIPMENT AND OFFSHORE PROJECT OWNERS
A PROFITABLE QUARTER DOES NOT SIGNAL A BROAD U.S. WIND EQUIPMENT RECOVERY (READ-THROUGH 9)
Affected company: Vestas Wind Systems (VWS: Denmark). Direction and magnitude: negative for expectations of a rapid U.S. new-build recovery; moderate business significance, partly offset by services, repowering, and geographic diversification.
Call evidence: GE Vernova’s Wind orders increased 16%, but Strazik emphasized that growth came from a “very small base” and that the U.S. new-equipment market remained soft. Permitting and tariff uncertainty continued delaying clarity. Despite better revenue expectations, full-year Wind EBITDA loss guidance widened from approximately $400 million to $400 million to $500 million.
The transmission mechanism is continued uncertainty around customer project returns and execution dates. Developers facing unresolved equipment costs, permitting, and policy conditions can delay firm procurement, limiting factory utilization and visibility for turbine manufacturers. Repowering and services can remain active without a comparable recovery in greenfield turbine demand.
The most important analytical distinction is that GE Vernova’s improved profitability reflects services execution, tariff recoveries, and lower offshore project costs as well as deliveries. These are not interchangeable with evidence that the addressable U.S. new-build market has recovered.
Vestas has disclosed its own U.S. orders, so GE Vernova’s experience should not be used to infer that every competitor is losing orders or to disregard company-specific market-share gains. The high-conviction negative read-through is to industry recovery assumptions, not a mechanical forecast that Vestas’s next quarter must disappoint.
Near-term catalysts are tariff clarification, permitting progress, and the composition of Vestas’s order intake. The longer-duration issue is whether greenfield development becomes economically and administratively viable at scale. Services and repowering are comparatively more resilient exposures than an investment thesis dependent on an immediate U.S. installation rebound.
OFFSHORE PROJECT DE-RISKING BENEFITS SPECIFIC OWNERS, NOT THE ENTIRE DEVELOPMENT PIPELINE (READ-THROUGH 10)
Affected companies: SSE (SSE: United Kingdom); Equinor (EQNR: Norway); Iberdrola (IBE: Spain). Direction and magnitude: positive for identified project execution; moderate relevance to SSE’s delivery trajectory and smaller consolidated significance for Equinor and Iberdrola.
Call evidence: GE Vernova reported progress on Dogger Bank B installations and commissioning and resolution of the outstanding Vineyard Wind dispute. Management nevertheless emphasized that another year of North Sea offshore execution remained.
The ownership links are direct. SSE and Equinor each own 40% of Dogger Bank A, B, and C. Iberdrola holds its Vineyard Wind interest through Avangrid. Improved turbine installation and commissioning support the transition from construction spending toward operating cash generation. Resolution of an equipment dispute can also reduce legal uncertainty and simplify the remaining delivery process.
The read-through is strongest for assets already financed and under construction. Progress at these projects does not establish that new offshore projects can be developed at attractive returns under current equipment prices, financing costs, and permitting conditions.
Near-term catalysts are commissioning milestones, demonstrated turbine availability, and project-specific financial updates. The fundamental benefit occurs as completed capacity operates reliably. GE Vernova’s description of a modest settlement cost does not establish a material cash receipt for Iberdrola or reveal the allocation of settlement benefits. The positive inference is reduced uncertainty, not a quantified earnings windfall or complete removal of offshore execution risk.
NUCLEAR EQUIPMENT AND ENGINEERING
CONTRACTED NUCLEAR SUPPLIERS HAVE A CLEARER MONETIZATION PATH THAN UNDIFFERENTIATED SMR EXPOSURE (READ-THROUGH 11)
Affected companies: BWX Technologies (BWXT: United States); AtkinsRéalis (ATRL: Canada). Direction and magnitude: positive; moderate nearer-term visibility benefit, with a potentially larger long-duration opportunity from repeat deployments.
Call evidence: GE Vernova reported continued construction progress for the BWRX-300 in Ontario, the Clinch River construction-permit milestone, and a 1.2 GW technology selection in Sweden. Management also described growing demand for nuclear uprates and life extensions across equipment touching approximately 65 GW of the U.S. nuclear fleet.
The supplier relationships are identifiable. BWXT has a contract to manufacture the reactor pressure vessel for the initial Darlington BWRX-300. AtkinsRéalis is the project’s architect-engineer and holds an execution contract for the initial unit. Their revenue opportunities arise during engineering, manufacturing, and construction, before the completed reactor begins selling electricity.
The more actionable distinction is between nuclear suppliers with defined work and reactor developers whose equity values depend primarily on future commercialization. Progress on an initial plant can improve confidence in existing backlog conversion and establish manufacturing and engineering references for subsequent projects. Fleet life extensions and uprates provide a separate, nearer-duration demand source that does not require waiting for a large SMR operating fleet.
Near-term catalysts are construction progress, supplier execution, and additional firm component or engineering awards. The longer-duration opportunity extends into the 2030s if repeat units are approved and financed. The Swedish technology selection is not yet equivalent to a fully funded equipment order, and neither BWXT nor AtkinsRéalis should automatically be assigned follow-on scope outside its disclosed contracts. The positive read-through is greater credibility and visibility for established nuclear work, not uniform validation of every listed nuclear technology company.
Report record
- Sector
- Industrials
- Industry
- Electrical Equipment
- Fiscal period end
- September 30, 2026
- Report date
- October 28, 2026
- Analysis
- 7317 words
- Read-throughs
- 3335 words
- Content fingerprint (PDF)
bdae08b7dc9c- Content fingerprint (analysis)
e71df84edfa9- Content fingerprint (read-throughs)
dcdbf44c6528
Prepared from the company's earnings release and earnings call transcript. Figures as reported by the company. For information only. Not investment advice.
More from GE Vernova Inc.
No other reports yet.
More in Industrials
A Larger and More Profitable Equipment Franchise, Not Yet a Cash-Generative Platform
Earnings Expansion Durable, but the Beat Was Not Unequivocal
Follow @AtlasPeakRes on X for new earnings reports as they publish.